
3
Background on the Selected Regions
INTRODUCTION
In selecting Phoenix, Cleveland, Montgomery, Los Angeles, and Fargo, the committee aimed to capture a broad range of demographic, labor, and educational characteristics. It looked for regions that have a range of types of institutions of higher education (2- and 4-year; public and private); that have active economic development organizations already exploring the science, technology, engineering, and mathematics (STEM) workforce; and that have economies focused on a variety of industries and employer types. The committee prioritized regions that had a mix of research universities and regional comprehensive universities and also paid particular attention to minority-serving institutions. The committee worked to ensure that historically black colleges and universities, Hispanic-serving institutions, and tribal colleges and universities were included as either hosts or participants at several workshops. Desirable regions were those that have received less attention than locales where linkages between higher education and regional workforce have been extensively examined (e.g., the Boston-Cambridge area of Massachusetts or Silicon Valley in California).
The committee’s primary objectives in its site selection included having a broad geographical distribution with major urban areas as well as smaller cities in more rural regions. The committee identified regions with distinct demographics, experiencing different labor market dynamics and economic growth, and differing in how successful industry and higher education have been thus far in establishing strong cross-sector partnerships. The committee also worked to ensure that selected regions had a mix of small, medium, and large businesses and firms with both regional and national (and in some cases, international) presences. Practical concerns also came into play. For highly productive regional workshops, a project of this magnitude required a strong core set of college, university, industry, and economic development partners in each locale, as well as people ready and willing to assist the committee in organizing and hosting each of the five events (which all occurred within a 6-month period). Lastly, an important criterion was local participants’ eagerness to make progress in their partnerships. Regions were selected in which organizations in both sectors clearly perceived the need for stronger linkages and were moving along the path toward addressing that need.
The data presented below were drawn from a number of sources, including the U.S. Census, the U.S. Bureau of Labor Statistics, and real-time labor market information (RTLMI) analyses commissioned by the committee and performed by the nonprofit organization Jobs for the Future. Data for Los Angeles diverge from those of the other regions because of the modified format of that meeting; it was coorganized by the Los Angeles Area Chamber of Commerce, and due to logistical constraints, we were unable to include RTLMI analyses in that workshop. At that meeting the workforce data were provided by a presenter from Beacon Economics. The descriptions below reflect the order in which the committee visited the locations.
The RTLMI analyses identified the occupations for which each region has a competitive advantage, that is, the occupations that constitute a larger share of the labor market in that region than the average for the United States overall. The areas of competitive advantage may serve as a focal point for higher education, regional employers, and third-party organizations as they consider building or strengthening cross-sector partnerships and developing a regional STEM workforce development ecosystem.
The RTLMI analyses also identified the top industries for STEM-related jobs and the skills most in demand, for both STEM broad and STEM narrow classifications (described in detail in Chapter 2). The analyses showed that every region has many more jobs in STEM broad than in STEM narrow—often by an order of magnitude—demonstrating that higher education’s role in training STEM-competent students who thrive in the regional workforce goes beyond the traditional STEM majors and extends to these institutions’ conferring a range of STEM competencies. This focus on skills is consistent with a theme heard by the committee from employers in the five regions, that is, that STEM skills are often more important than STEM degree fields.
The analyses summarized below capture a moment in time. Clearly, regional needs will change somewhat. The continual evolution of regional economies—and of the macroeconomic environment within which they exist—underscores the need for finer resolution in workforce data and the creation and strengthening of structured partnerships among higher education, government, third-party organizations, and employers in locales nationwide. Table 3-1 presents demographic data for the five regional workshops. Each region is discussed in the order in which the workshops were held.
TABLE 3-1 Demographic Data for the Five Regions Visited
| Phoenix AZ | Cleveland OH | Montgomery AL | Los Angeles CA | Fargo ND | |||||
| Percentage of people with a high school education or higher, metropolitan areaa | 80.6 | 77.4 | 87.5 | 74.5 | 94.6 | ||||
| Percentage of people with a high school education or higher, statea | 85.7 | 88.5 | 83.1 | 81.2 | 90.9 | ||||
| Percentage of college degree holders, metropolitan areaa | 26.3 | 14.9 | 35.7 | 31.1 | 39.0 | ||||
| Percentage of college degree holders, statea | 26.9 | 25.2 | 22.6 | 30.7 | 27.2 | ||||
| Median household income, metropolitan areaa | $47,139 | $26,217 | $43,702 | $49,497 | $45,458 | ||||
| Median household income, statea | $49,774 | $48,308 | $43,253 | $61,094 | $53,741 | ||||
| Percentage of residents living below the poverty line, metropolitan areaa | 22.8 | 35.4 | 22.6 | 22.0 | 16.3 | ||||
| Percentage of residents living below the poverty line, statea | 17.9 | 15.8 | 18.6 | 15.9 | 11.9 | ||||
| Percent unemployment rate, metropolitan areab | 5.7 | 5.6 | 6.6 | 7.5 | 2.4 | ||||
aU.S. Census Bureau.
bU.S. Bureau of Labor Statistics, http://www.bls.gov/eag, accessed July 2015.
PHOENIX, ARIZONA
The Phoenix metropolitan area (4.19 million residents in 2010) is rapidly growing and diverse, and located in a state with a significant Native American population and large Hispanic population. Prior to 2007, the region had one of the most rapidly growing economies in the nation, but it was hit hard by the recession beginning in 2008. Major industries include aerospace, defense, information technology, and biomedicine/health care. In addition to these and other large companies, the region has a sizable number of small- and medium-sized businesses, which were well represented at the workshop. Institutions of higher education include Arizona State University (our host), Grand Canyon University, and the Maricopa County Community College District, a network of 10 community colleges in the Phoenix metropolitan area. Figure 3-1 provides an overview of the need for STEM skills in the Phoenix region.
The Phoenix area has a competitive advantage in a number of occupations, with many more falling into the STEM broad category than into STEM narrow. Table 3-2a lists those occupations for which the Phoenix region has a competitive advantage, organized by educational level. Table 3-2b lists Phoenix’s top STEM employers as identified by RTLMI analyses, and Table 3-2c lists the Phoenix workshop participants.
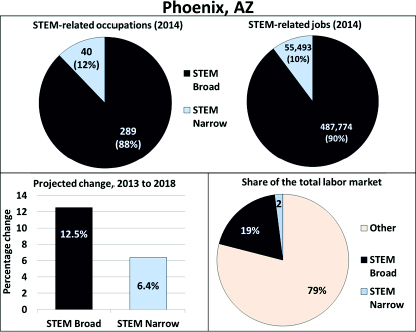
FIGURE 3-1 Overview of the need for STEM skills in the Phoenix region. Note: The panel in the lower left displays growth or positive change. SOURCE: Jobs for the Future analysis uses Economic Modeling Specialists International data to assess job numbers.
TABLE 3-2a Phoenix Region: Occupations with a Competitive Advantage in 2013
| Educational Level | STEM Broad | STEM Narrow | |||||||
| Less than a bachelor’s degree | Veterinary technologists and technicians Web developers Computer user support specialists Diagnostic medical sonographers Medical equipment repairers Heating, air conditioning, and refrigeration mechanics and installers |
Industrial engineering technicians Electromechanical technicians Aerospace engineering and operations technicians Electrical and electronics engineering technicians Electrical and electronics drafters |
|||||||
| Bachelor’s degree or higher | Software and applications developers Statistical assistants Computer and information systems managers Financial managers Surveyors Purchasing managers Anesthesiologists |
Forensic science technicians Hydrologists Electronics engineers (except computer) Computer hardware engineers Operations research analysts Materials engineer |
|||||||
SOURCE: Analysis by Jobs for the Future using data from Burning Glass Technologies.
TABLE 3-2b Phoenix Region: Top Employers as Identified by RTLMI Analyses
| Top STEM Employers—RTLMI Analyses | |||||||||
| Dignity Health | |||||||||
| Best Buy | |||||||||
| Banner Health System | |||||||||
| United Health Group | |||||||||
| General Motors | |||||||||
| eBay | |||||||||
| Mayo Foundation | |||||||||
| Fresenius | |||||||||
| American Express | |||||||||
| Intel Corporationa | |||||||||
aAttended the regional workshop.
SOURCE: Analysis by Jobs for the Future.
TABLE 3-2c Phoenix Region: Workshop Participants, January 22–23, 2015
| Employers/Industry | Higher Education | Third-Party Intermediaries | Policy/Government | Nonprofit/Philanthropic | |||||
| ACESA Corporation Arizona Public Service TJM Electronics Freeport MacMoRan Avnet Inc. Intel Arizona Medtronic Microchip Siemens Stratco |
Arizona State University Maricopa County Community College District Glendale Community College Estrella Mountain Community College Yavapai College Grand Canyon University |
Greater Phoenix Economic Council Greater Yuma Economic Development Corporation Arizona Chamber of Commerce and Industry |
Arizona Commerce Authority |
Arizona Technology Council Science Foundation Arizona Arizona Council of Engineering and Science Associations Association of University Research Parks EdLeader21r |
|||||
CLEVELAND, OHIO
The Cleveland metropolitan area has a population of 2.1 million (2010) and is located in northern Ohio on the shore of Lake Erie. Historically, its economy has been strong in manufacturing, and key sectors today include manufacturing, health care, and aerospace. Institutions of higher education include Case Western Reserve University, Youngstown State University, Cuyahoga Community College, and Lorain County Community College. The meeting was hosted by the Ohio Aerospace Institute. Figure 3-2 provides an overview of the need for STEM skills in the Cleveland region.
The Cleveland area has a competitive advantage in a number of occupations, with (as for the other regions visited) many more falling into the STEM broad category than into STEM narrow. Table 3-3a lists those occupations for which the Cleveland region has a competitive advantage, organized by educational level. Table 3-3b lists Cleveland’s top STEM employers as identified by RTLMI analyses, and Table 3-3c lists the Cleveland workshop participants.

FIGURE 3-2 Overview of the need for STEM skills in the Cleveland region. Note: The panel in the lower left displays growth or positive change. SOURCE: Jobs for the Future analysis uses Economic Modeling Specialists International data to assess job numbers.
TABLE 3-3a Cleveland Region: Occupations with a Competitive Advantage in 2013
| Educational Level | STEM Broad | STEM Narrow | |||||||
| Less than a bachelor’s degree | Foundry mold and core makers Tool and die makers Lathe and turning machine tool setters Operators, credit authorizers Extruding and drawing machine operators Prepress technicians and workers Machinists |
Chemical technicians Industrial engineering technicians Mechanical drafters Electromechanical technicians Aerospace engineering and operations technicians Mechanical engineering technicians |
|||||||
| Bachelor’s degree or higher | Pediatricians Oral and maxillofacial surgeons Sales engineers Psychiatrists Other health care practitioners and technical workers Other physicians and surgeons |
Biomedical engineers Materials engineers Actuaries Nuclear engineers Industrial engineers Materials scientists |
|||||||
SOURCE: Analysis by Jobs for the Future using data from Burning Glass Technologies.
TABLE 3-3b Cleveland Region: Top Employers as Identified by RTLMI Analyses
| Top STEM Employers—RTLMI Analyses | |||||||||
| Ohio Department of Health | Southwest General Health Center | ||||||||
| Ohio Department of Transportation | HCR ManorCare | ||||||||
| American Red Cross | Philips Electronics | ||||||||
| Sherwin Williams | Lubrizol Corporationa | ||||||||
| Cleveland Clinica | Alliance Scientific Solutions | ||||||||
| University Hospitals | PNC Financial Services | ||||||||
| Kindred Healthcare | |||||||||
aAttended the regional workshop.
SOURCE: Analysis by Jobs for the Future.
TABLE 3-3c Cleveland Region: Workshop Participants, April 1, 2015
| Employers/Industry | Higher Education | Third-Party Intermediaries | Policy/Government | Nonprofit/Philanthropic | |||||
| The Cleveland Clinic TimkenSteel PHASTAR Corporation COO/ZIN Technologies WIRE-Net University Hospitals ECCL Aerospace Services Indus International The Lubrizol Corporation GE Lighting |
Cleveland State University Youngstown State University Lorain County Community College Cuyahoga County Community College Case Western Reserve University Baldwin Wallace University Wright State University University of Cincinnati |
Ohio Aerospace Institute New Growth Group MAGNET Ohio Manufacturing Institute |
Cleveland/Cuyahoga County Workforce Investment Board Ohio Board of Regents NASA Glenn Research > Center Ohio Manufacturing Institute |
KeyBank Foundation The Nord Family Foundation Cleveland Foundation Cleveland Engineering Society Dayton Regional STEM Center |
|||||
MONTGOMERY, ALABAMA
The Montgomery metropolitan area has 374,000 residents (2010) and is situated in a more rural, southern state. The region has a large African American population, and major industries include defense, aerospace, and the automotive industry. Institutions of higher education include Alabama State University (our host) and Tuskegee University (both historically black universities), Auburn University, and members of the Alabama Community College System. Figure 3-3 provides an overview of the need for STEM skills in the Montgomery region.
The Montgomery area has a competitive advantage in a number of occupations, with many more falling into the STEM broad category than into STEM narrow. Table 3-4a lists those occupations for which the Montgomery region has a competitive advantage, organized by educational level. Table 3-4b lists Montgomery’s top STEM employers as identified by RTLMI analyses, and Table 3-4c lists the Montgomery workshop participants.
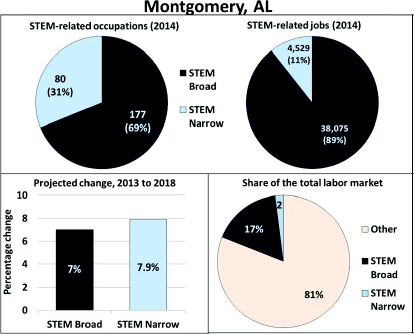
FIGURE 3-3 Overview of the need for STEM skills in the Montgomery region. Note: The panel in the lower left displays growth or positive change. SOURCE: Jobs for the Future analysis uses Economic Modeling Specialists International data to assess job numbers.
TABLE 3-4a Montgomery Region: Occupations with a Competitive Advantage in 2013
| Educational Level | STEM Broad | STEM Narrow | |||||||
| Less than a bachelor’s degree | Power plant operators Broadcast technicians Veterinary assistants Computer, automated teller, and office machine repairers Welders |
Environmental engineering technicians Environmental science and protection technicians Surveyors Mechanical engineering technicians |
|||||||
| Bachelor’s degree or higher | Database administrators Forensic science technicians Other computer occupations Computer programmers Instructional coordinators Budget analysts |
Foresters Urban and regional planners Environmental engineers Forensic science technicians Statisticians Environmental scientists |
|||||||
SOURCE: Analysis by Jobs for the Future using data from Burning Glass Technologies.
TABLE 3-4b Montgomery Region: Top Employers as Identified by RTLMI Analyses
| Top STEM Employers—RTLMI Analyses | |||||||||
| Sherlock Smith and Adams | Bridgestone/Firestone | ||||||||
| City of Montgomery | Department of Veterans Affairs | ||||||||
| GKN Aerospace | IBM | ||||||||
| Ricoh Electronics | Alcatel-Lucent | ||||||||
| Hargrove Engineers + Constructors | Rheem Manufacturing | ||||||||
| Jackson Hospital | American Express | ||||||||
| Baptist Medical Center | General Dynamics | ||||||||
SOURCE: Analysis by Jobs for the Future.
TABLE 3-4c Montgomery Region: Workshop Participants, May 11, 2015
| Employers/Industry | Higher Education | Third-Party Intermediaries | Policy/Government | Nonprofit/Philanthropic | |||||
| Lockheed Martin Conference America | Alabama State University Tuskegee University Auburn University Alabama Community College System H. Councill Trenholm State Community College |
Montgomery Area Chamber of Commerce Economic Development Association of Alabama |
Alabama Department of Commerce Alabama Commission on Higher Education |
Alabama Science in Motion | |||||
LOS ANGELES, CALIFORNIA
The committee’s Los Angeles meeting took a somewhat different shape, as the opportunity arose to collaborate with the Los Angeles Area Chamber of Commerce in an event already in the planning stages that would reach a substantial number of STEM employers in the region. This meeting thus drew a relatively larger number of representatives of the regional workforce. In addition, the workforce data presented were provided by a local economic research organization, Beacon Economics, rather than by Jobs for the Future, as was done in the other four meetings.
Los Angeles is the second-largest metropolitan area in the United States with a population in 2010 of 12.8 million. It is highly diverse ethnically and socioeconomically, including a large Hispanic population. Whereas other areas of California have historically received more attention from efforts to develop and sustain university-industry partnerships—notably, Silicon Valley and the San Francisco Bay Area—the Los Angeles basin may have less robust partnerships, but at the same time, a broader range of industries with which higher education is or can be connected. The region has a large network of 2- and 4-year institutions of higher education, including the California State Universities at Dominguez Hills, Fullerton, Long Beach, Los Angeles, and Northridge; California State Polytechnic University, Pomona; the University of California, Los Angeles; the University of California, Irvine; the California Institute of Technology; the University of Southern California, the Los Angeles Community College District, Santa Monica Community College, Glendale Community College (among others); and a number of private colleges and universities.
In Los Angeles County, top STEM occupations include health care, professional/business, manufacturing, financial activities, education, government, retail trade, information, transport/utilities, leisure and hospitality, and wholesale trade. Between 2000 and 2013, negative growth was seen in manufacturing and information (Figure 3-4), while considerable growth was seen in health care, professional/business, education, and government. Dramatic growth was seen in the category of leisure and hospitality, which, while small, grew by 125.2 percent over that period (to 6,003 jobs). Health care showed the greatest increase in share of the labor market with 4.3 percent. Figure 3-4 provides an overview of the STEM workforce in Los Angeles, and Table 3-5 lists the Los Angles workshop participants.
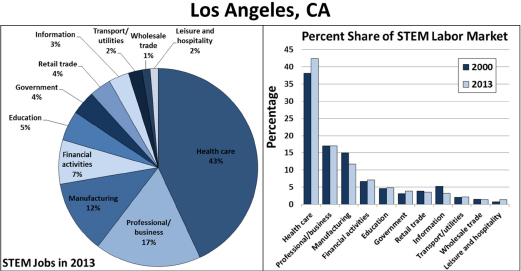
FIGURE 3-4 Overview of the STEM workforce landscape in Los Angeles. Note: Workforce and occupation data for the Los Angeles workshop was analyzed and presented by the consulting firm Beacon Economics and not Jobs for the Future as in the other regions. SOURCES: Adapted from Beacon Economics; U.S. Census 2000; U.S. Census ACS 2013.
TABLE 3-5 Los Angeles Region Workshop Participants, May 27, 2015
| Employers/Industry | Higher Education | Third-Party Intermediaries | Policy/Government | Nonprofit/Philanthropic | |||||
| AAA T.L.C. Health Care Inc. AECOM AltaSea, Port of Los Angeles AP Group Avery James Inc. Beacon Management Group Cedars-Sinai Health System City of Los Angeles Cumming Construction Management Inc. Deloitte LLP Farmers Insurance Group of Companies Hitachi Ltd. Los Angeles Office HMC Architects JPMorgan Chase Bank Los Angeles Unified School District Northrup Grumman Corporation Pearson Education Port of Los Angeles Raytheon Roll Global Sims Recycling Solutions Texas Instruments |
California State University, Los Angeles California State University, Dominguez Hills California State University, Northridge California Institute of Technology Citrus College DeVry University East Los Angeles College El Camino College Los Angeles Community College District Los Angeles Harbor College Los Angeles Southwest Community College Loyola Marymount University Mt. San Antonio College Pasadena City College University of California, Los Angeles University of Southern California Woodbury University |
Los Angeles Area Chamber of Commerce Bixel Exchange Los Angeles County Economic Development Corporation Managed Career Solutions San Gabriel Valley Economic Partnership South Bay Workforce Investment Board |
Los Angeles County Metropolitan Transportation Authority Los Angeles County Office of Education Los Angeles County Workforce Investment Board Los Angeles Jobs Corps Center (U.S. Department of Labor) |
Nonprofit/Philanthropic American Cancer Society Big Brothers Big Sisters of Greater Los Angeles Boy Scouts of America California Community Foundation College-Bridge Common Sense Education EnCorps STEM Teachers Friends of Hollywood Central Park Great Minds in STEM I Have A Dream Mentors International Society of Hispanic Professional Engineers Specialty Family Foundation Teach for America The Carol and James Collins Foundation The Durfee Foundation Tiger Woods Foundation William C. Bannerman Foundation YMCA of Metropolitan Los Angeles |
|||||
FARGO, NORTH DAKOTA
Fargo is a city of 209,000 inhabitants (2010) located in eastern North Dakota. For the past 5 years it has experienced an economic boom as a result of a surge of oil and gas production in the western part of the state. The state is rural and has a significant Native American population. Major industries include oil and gas extraction, agriculture, transportation, and equipment manufacturing. Institutions of higher education in the region include North Dakota State University (our host), North Dakota State College of Science, University of North Dakota, and Valley City State University; the meeting also had representation from the North Dakota Association of Tribal Colleges. Figure 3-5 provides an overview of the need for STEM skills in the Fargo region.
The Fargo area has a competitive advantage in a number of occupations, and the STEM broad category includes significantly more job types than does STEM narrow. Table 3-6a lists those occupations for which the Fargo region has a competitive advantage, organized by educational level. Table 3-6b lists Fargo’s top STEM employers as identified by RTLMI analyses, and Table 3-6c lists the Fargo workshop participants.
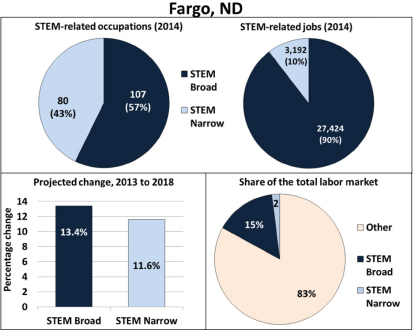
FIGURE 3-5 Overview of the need for STEM skills in the Fargo region. Note: The panel in the lower left displays job growth or positive change. SOURCE: Jobs for the Future analysis uses Economic Modeling Specialists International data to assess job numbers.
TABLE 3-6a Fargo Region: Occupations with a Competitive Advantage in 2013
| Educational Level | STEM Broad | STEM Narrow | |||||||
| Less than a bachelor’s degree | Precision instrument repairers Cement masons and concrete finishers Installers and repairers of electronic home entertainment equipment Structural iron and steel workers Mobile heavy equipment mechanics Mechanical drafters |
Agricultural and food science technicians Civil engineering technicians Mechanical drafters Mechanical engineering technicians Industrial engineering technicians |
|||||||
| Bachelor’s degree or higher | Surgeons Optometrists Occupational therapists Chiropractors Financial specialists Secondary school career/technical education teachers |
Soil and plant scientists Food scientists and technologists Life scientists Biological scientists Foresters Atmospheric and space scientists |
|||||||
SOURCE: Analysis by Jobs for the Future using data from Burning Glass Technologies.
TABLE 3-6b Fargo Region: Top Employers as Identified by RTLMI Analyses
| Top STEM Employers—RTLMI Analyses | |||||||||
| North Dakota State Universitya | Department of Veterans Affairs | ||||||||
| KJL Engineeringa | RDO Equipmenta | ||||||||
| Kar Auction Services | Deere and Company | ||||||||
| Automotive Finance Corporation | Appareoa | ||||||||
| Ulteig Engineers | Doosan Bobcat Companya | ||||||||
| Essentia Health | Blue Cross Blue Shield of North Dakota | ||||||||
| Sanford Health | |||||||||
aAttended the regional workshop.
SOURCE: Analysis by Jobs for the Future.
TABLE 3-6c Fargo Region: Workshop Participants, June 30, 2015
| Employers/Industry | Higher Education | Third-Party Intermediaries | Policy/Government | Nonprofit/Philanthropic | |||||
| Microsoft Fargo Doosan Bobcat Company Trail King Industries Sanford Health Appareo Minn-Dak Farmers Cooperative Tecton Products LLC Caterpillar Reman KJL Engineering General Equipment and Supplies F-M Ambulance Service Marvin Windows and Doors—Integrity and Tecton Products Partner RDO Equipment Company Laney’s Inc. |
North Dakota State University North Dakota State College of Science University of North Dakota Valley City State University North Dakota Association of Tribal Colleges Bismarck State College Lake Region State College Mayville State University |
Greater Fargo Moorhead Economic Development Corporation North Dakota STEM Network Jamestown/Stutsman Development Corporation |
North Dakota Department of Commerce Job Service North Dakota North Dakota Department of Career and Technical Education |
Gateway to Science Emerging Prairie – Speaker’s Bureau |
|||||


