
4
Climate System Modeling in the SCC-IAMs and the Role of ECS
This chapter provides information on how the social cost of carbon integrated assessment models (SCC-IAMs) currently model the climate system and how equilibrium climate sensitivity (ECS) is incorporated into each SCC-IAM. In addition, the committee outlines tests that could be applied to the simple climate models used to generate the SCC, to determine whether the central projections of these models agree with those of more comprehensive Earth system models.
REPRESENTATION OF THE CLIMATE SYSTEM IN THE SCC-IAMS
The three SCC-IAMs used by the Interagency Working Group on the Social Cost of Carbon (IWG) are the Dynamic Integrated Climate-Economy Model (DICE), the Policy Analysis of the Greenhouse Effect (PAGE) model, and the Climate Framework for Uncertainty, Negotiation and Distribution (FUND) model. The climate system in each of them consists of three major elements: calculation of the path of atmospheric concentrations of CO2 from greenhouse gas emissions, translation of concentrations to radiative forcing, and the response of global mean surface temperature to changes in radiative forcing. However, the specification (structural and parametric) of each element varies across the models; see Table 4-1.22 Significant differences exist in the structure of the carbon cycle, radiative forcing per doubling of CO2 concentrations, the derivation of global mean temperature from forcing, the coverage of and interactions with non-CO2 concentrations and forcing, and climate feedback representation. Differences in model time steps are also meaningful, as they have an impact on the climate system dynamics in the models.
___________________
22For additional discussion and details, see Rose et al. (2014). This is one of the few systematic reviews and comparisons of the SCC-IAMs; it is used in this chapter to introduce the differences between the three IAMs.
TABLE 4-1 Climate Modeling Structural Characteristics for the SCC-IAMs.
| Characteristic | DICE | FUND | PAGE |
|---|---|---|---|
| Atmospheric Concentrations | |||
|
CO2 |
3-box carbon cycle | 5-box carbon cycle | 1-box carbon cycle |
|
Non-CO2 Kyoto |
Not modeled | CH4, N2O, SF6 | Not modeled |
|
Non-CO2 non-Kyoto |
Not modeled | SO2 | SO2 |
| Radiative forcing | |||
|
CO2 (per doubling) |
3.80 W/m2 | 3.71 W/m2 | 3.81 W/m2 |
|
Non-CO2 Kyoto |
Exogenous | CH4, N2O, SF6 | Exogenous |
|
Non-CO2 non-Kyoto |
Exogenous | SO2 | SO2, non-SO2 exogenous |
| Global Mean Surface Temperature | Rate temperature moves toward equilibrium is a function of climate sensitivity & surface temperature modulated by ocean heat uptake | Rate temperature moves towards equilibrium is a function of climate sensitivity | Function of global mean land and ocean temperatures |
| Ocean Temperatures | 2-box (upper and deep ocean) | 1-box | 1-box |
| Regional Temperatures | n/a | Implicit with regional damage parameters calibrated to regional temperatures downscaled based on a linear pattern-scale average of 14 global circulation models | Explicit with regional temperatures downscaled according to latitude and landmass adjustment |
| Global Mean Sea Level Rise | Components (thermal expansion, glacier and small ice cap melt, GIS melt, WAIS melt) computed as functions of temperature and lagged temperature | Computed as a function of temperature and lagged temperature | Computed as a function of temperature and lagged temperature |
| Time Steps | 10-year | 1-year | Variable (10-year 2000-2060, 20-year 2060-2100, 100-year 2100-2300) |
| Implementation of CO2 Pulse in Year t | Pulse spread equally over the decade straddling year t | Pulse spread equally over the decade from year t forward | Pulse distributed evenly over the two decades preceding and subsequent to year t |
| Model-Specific Uncertainties Other than ECS (number of parameters; distribution types) | None | 11 – normal, truncated normal, triangular, and gamma distributions | 10 – triangular distributions |
NOTE: See text for discussion.
SOURCE: Modified from Rose et al. (2014, Table 5-1).
We note that the IWG has modified the SCC climate modeling components of each model. In DICE, the IWG changed the time steps and averaged CO2 concentrations across time periods. In PAGE, the IWG modified the time-step scheme, the modeling of non-CO2 emissions and forcing, and the ECD modeling approach.23 The IWG also standardized the distribution of the ECS used in each model.
___________________
23Non-CO2 forcing is also captured in the models in significantly different ways, with FUND deriving non-CO2 concentrations and forcing, and DICE and PAGE using forcing assumptions developed from sources outside the models. Also, the models vary in their coverage of non-CO2 forcing, with all three different in total forcing coverage: FUND covers the fewest of the broad set of non-CO2 forcing constituents, including long-lived and short-lived gases and aerosols.
Differences in the derivation of temperature from forcing are also noteworthy with regard to the IWG’s standardization of the ECS distribution. In DICE and FUND, the rate at which temperature moves toward equilibrium is affected by ECS. In these two models, a higher ECS corresponds to a slower convergence toward the equilibrium temperature (i.e., a longer period of time, or lag, before reaching the equilibrium temperature). Varying the adjustment speed (or lag) with the climate sensitivity parameter ensures some consistency with historical observations. Importantly, it also moderates the effect of changing the ECS parameter, in particular on transient climate response (TCR). The temperature response in PAGE, which does not include this temperature lag adjustment, is more sensitive to alternative ECS values. DICE, which uses a two-box ocean model, also includes a moderating feedback from the ocean, with deep ocean temperatures moderating the rate at which surface temperature increases. Finally, FUND and PAGE include an explicit climate carbon cycle feedback that accelerates global warming at higher temperatures. The feedback represents global physical mechanisms (e.g., terrestrial drying and vegetation dieback) that release additional emissions into the atmosphere as the planet warms and in so doing increase the rate of global warming.
Global mean surface temperature is the primary climate variable driving the climate damage estimates in all three of the models. In addition, the rate of temperature change and CO2 concentrations are also used in some FUND damage categories. Other climate variables such as precipitation, weather variability, and extreme weather events are not modeled explicitly, although these effects may be captured implicitly in the calibration of damage response to global mean temperature change.
Global mean surface temperature drives projected global average mean sea level rise in all three models and projected regional average temperatures in FUND and PAGE, which in turn drive damages. However, differences in the downscaling approach lead to differences in projected regional temperatures across FUND and PAGE for the same global mean surface temperature, with PAGE projecting greater warming for many regions. The sea level rise calculations also vary across models, with projected sea level rise in 2100 varying by a factor of two across models for the same projected levels of warming (Rose et al., 2014).
It is worth noting that in the IWG’s SCC methodology, climate system parametric uncertainty is accounted for in all three models, but to different degrees. All models consider ECS parameter uncertainty through a probability distribution for ECS calibrated to the likelihoods of the Intergovernmental Panel on Climate Change (IPCC, 2007), with a distributional form adopted from Roe and Baker (2007). In addition, FUND and PAGE incorporate additional climate-model-specific parametric uncertainties.
In the DICE model, the climate model component is represented using a two-layer ocean (see Chapter 3, “Determining Temperature Changes in Response to CO2 Emissions”). In FUND and PAGE, the temperature response is characterized by a single exponential decay. In DICE and FUND, the timescale of the temperature response varies with the ECS.24
Figure 4-1 shows that the models used in the IWG analysis vary by decades in the time taken to reach peak warming associated with a pulse emission. This contrasts with the time of about one decade indicated by the models participating in the Joos et al. (2013) intercomparison (see Figure 3-7 in Chapter 3). However, direct comparison between the two sets of results is complicated by differences in their experimental design and baselines.
___________________
24In the standard version of the 2009 PAGE model, the timescale and TCR are parameters, and ECS is a function of them. In the IWG version of PAGE, timescale is invariant to the ECS parameter, and TCR is not an explicit parameter.
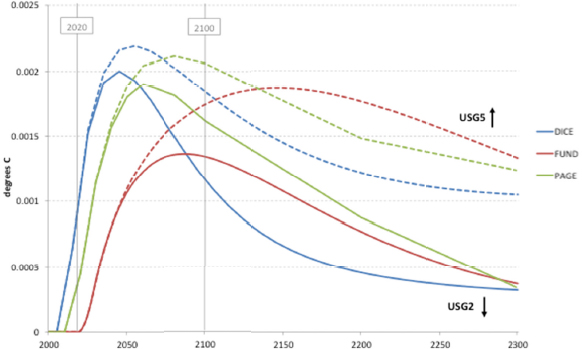
NOTES: The responses are for a 1 GtC emissions pulse in 2020 with higher (USG2, solid) and lower (USG5, dashed) reference emissions. USG2 and USG5 are the socioeconomic scenarios that produce the highest and lowest fossil fuel and industrial CO2 emission projections respectively in the IWG methodology. The lower baseline USG5 results (dashed) are more comparable to those from the Joos et al. (2013) experiment shown in Figure 3-7 (in Chapter 3), which performed a pulse experiment on top of a 389 ppm CO2 baseline. Note that the Joos et al. (2013) experiment is not fully comparable.
SOURCE: Developed from Rose et al. (2014). Reprinted with permission.
Harmonization of Emissions Inputs and the ECS by the IWG
The IWG methodology harmonizes assumptions across the three models along three dimensions: socioeconomic and emissions projections (five cases), ECS uncertainty (using a common assumed ECS probability distribution), and discount rates (three alternative constant values). Given their climate modeling and projection implications, this section discusses the socioeconomic/emissions and ECS harmonizations. Note that the IWG socioeconomic and emissions and ECS modeling approaches were developed for the IWG’s 2010 SCC estimates (Interagency Working Group on the Social Cost of Carbon, 2010) and retained for the 2013 and 2015 estimates (Interagency Working Group on the Social Cost of Carbon, 2013, 2015). The IWG methodology regarding socioeconomic and emissions modeling differs to different degrees from each model’s standard structure.
Socioeconomic and emissions variability are considered in the IWG SCC calculations through the five alternative scenarios (USG1 through USG5). Four of the scenarios are described as “baseline” futures assuming negligible greenhouse gas mitigation, and one is described as a “policy” future that stabilizes atmospheric concentrations by 2100 at 550 ppm CO2-equivalent. Each scenario consists of a set of projections for gross domestic product, population, fossil and industrial CO2 emissions, land use CO2 emissions, and non-CO2 emissions and forcing.
In the IWG methodology, the baseline socioeconomic, emissions, and forcing projections to the year 2100 are drawn from scenario data from the Energy Modeling Forum’s 22nd study, EMF 22 (Clarke et al., 2009), which was a multimodel scenario exercise of 10 global IAMs with detailed energy sectors to explore the cost and energy transformation implications of climate targets and international cooperation. The four baseline scenarios are reference “no climate policy” futures associated with 4 of the 10 models participating in the EMF 22 study. The “policy” scenario was derived by the IWG by averaging the 550 ppm CO2-equivalent scenario results from the same four models, with each variable averaged separately. In the IWG exercise, the SCC estimates resulting from each socioeconomic/emission scenario are given equal weight in the averaging used to derive the overall SCC estimates.
Implementation of these inputs varied somewhat across the three models (see Rose et al., 2014): FUND and PAGE require translation of the projections into model-specific regional population and income; PAGE and DICE use level values, and FUND uses growth rates; and FUND requires derivation of its own fossil and industrial CO2 emissions in lieu of the standardized projections. In addition, only FUND uses explicit emissions for a subset of non-CO2 Kyoto greenhouse gases (CH4, N2O, SF6); and DICE and PAGE include non-CO2 forcing exogenously. To estimate climate damages beyond 2100, the IWG extrapolated the EMF 22-based socioeconomic and emissions inputs from 2100 to 2300.
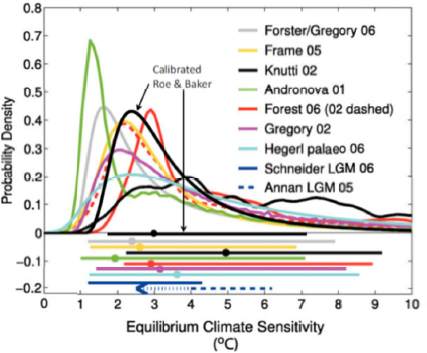
The IWG approach standardized one climate system modeling assumption, the distribution of the ECS parameter. The IWG calibrated a Roe and Baker (2007) distributional form (see discussion in Chapter 3) to match statements regarding the likelihood of the ECS value made in the IPCC Fourth Assessment Report. Figure 4-2 depicts the chosen calibrated Roe and Baker distribution.25
___________________
25For a detailed discussion, see IWG (2010); also see Box 3-2 in Chapter 3.
NOTES: The black line is based on the Roe and Baker (2007) functional form. Additional probability distributions adopted from Figure 9.20 in the source for this figure. The circles below the distributions reflect the median ECS estimate; the ends of the horizontal bars represent the 5th and 95th percentiles of the ECS distributions.
SOURCE: Interagency Working Group on the Social Cost of Carbon (2010, Figure 2).
Role of ECS and Other Assumptions in Determining the Emissions-to-Temperature Link
Projecting global mean surface temperature change from projected emissions in the SCC-IAMs requires sequentially translating emissions trajectories into concentrations, concentrations into radiative forcing, and radiative forcing trajectories into temperature. In the IWG analysis, the ECS parameter is one of several critical parameters governing the last translation from forcing to temperature.
The ECS is a long-standing metric for climate system responsiveness (e.g., Arrhenius, 1896) and is used as an input parameter to most simple climate models, such as those used by the IWG. However, the ECS is not an input parameter to more complex climate models. Rather, it emerges from the behavior of each complex model and is derived as an output based on each model’s global mean surface temperature response to a doubling of CO2 concentrations. The ECS is therefore unique to each model’s structure, parameterization, and settings.
The ECS is recognized as an influential parameter in the three IAMs used to calculate the SCC, with studies finding SCC estimates to be relatively sensitive to the assumed ECS (Anthoff and Tol, 2013a, 2013b; Hope, 2013; Butler et al., 2014). This reflects in part the way the ECS is incorporated into these models. Direct comparison of the SCC-IAMs’ climate responses has also found that the sensitivity of projected temperature (level and incremental) to the ECS assumptions varies significantly across the three models, with PAGE being the most sensitive and FUND the least sensitive (see Figure 4-3).
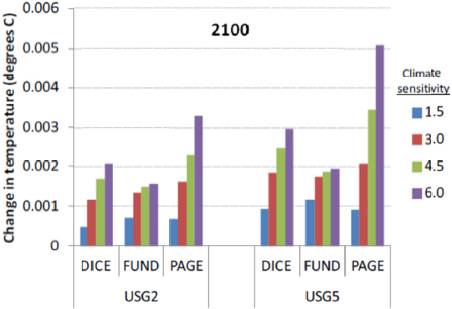
NOTES: In DICE, FUND, and PAGE, the increase is in response to a 2020 1 GtC pulse varying the ECS parameter and reference emissions scenario. USG2 and USG5 represent the IWG’s highest and lowest emission scenarios, respectively.
SOURCE: Rose et al. (2014, Figure 5-13). Reprinted with permission.
Other climate modeling elements of the three SCC-IAMs, in addition to the ECS, play a significant role in translating emissions into projected global mean temperatures. These include the specifications for the carbon cycle, the ocean response to forcing, non-CO2 forcing, climate feedbacks, and non-ECS parametric uncertainties. As a result of variations in these specifications across the models, PAGE has slower CO2 concentration accumulation but higher projected temperatures, FUND has faster accumulation of CO2 concentrations and higher non-CO2 forcing but lower projected temperatures, and DICE has CO2 concentrations and temperature that are the most sensitive to projected emissions. Non-ECS uncertainty also plays a role in FUND and PAGE in defining the distribution of projected temperature.
SENSITIVITY OF THE SCC TO OTHER MODELING ASSUMPTIONS
The committee’s charge emphasizes the role of the ECS in estimating the SCC, but the ECS is one of many assumptions that can influence an SCC estimate. Other assumptions include the projected size of the economy and population, emissions levels, discount rate, non-ECS climate parameters, regional temperature downscaling, the assumed sea level rise response rate, and the functional forms and parameterizations for the various climate damages (Anthoff and Tol, 2013a, 2013b; Hope, 2013; Butler et al., 2014; Rose et al., 2014). Some assumptions are potentially more influential than the ECS, as well as interacting with the ECS.
Looking specifically at damages, Anthoff and Tol (2013a, 2013b) identified key sensitivities for FUND SCC estimates in parameters associated with cooling damages, agricultural damages, migration, and energy efficiency improvement. Looking more broadly across the overall PAGE modeling framework, Hope (2013) finds key sensitivities in the model’s discounting parameters, climate feedback response, sulfate aerosol effects, and noneconomic damage function exponent and weight parameters. In addition, Butler et al. (2014) illustrate with
a modified version of the DICE model the potential importance of interactions between uncertain parameters.
Direct comparison of the model damage components of the three IWG SCC models illustrates the differences in sensitivity of damage estimates to assumed warming levels and the size of the economy. Such comparison finds that PAGE damages are the most sensitive to changes in the level of warming, and FUND damages are the least sensitive. At low levels of warming, DICE and PAGE damages are the most sensitive to changes in the size of the economy, but at high levels of warming, FUND damages are the most sensitive. In both contexts there are warming and income ranges for which there are even differences in the sign of estimated damages, as well as the responsiveness.
These insights suggest that it is important to look beyond the ECS when evaluating current methods and identifying opportunities for improvement. Those opportunities include not only other climatic factors, but also sensitivity to changes in other model inputs and assumptions in other components of the causal chain. There are also uncertainties, and potential sensitivities, associated with elements not currently modeled, including other factors that will drive the physical impacts of global climate change, such as changes in the regional and temporal distribution of precipitation, humidity, changing aerosol and cloud patterns, sea level rise, and potential extreme events.
ASSESSMENT OF SIMPLE CLIMATE MODEL PERFORMANCE
The climate modeling community assesses the performance of its models in two ways: (1) intermodel comparison diagnostics and (2) comparison of projections to historical data. With the exception of some limited intermodel comparison exercises (e.g., Warren et al., 2010; van Vuuren et al., 2011; Rose et al., 2014), similar diagnostics and historical comparisons have not been applied to the simple climate models that serve as inputs to SCC-IAMs calculations.
Simple climate models, such as the ones used in SCC-IAMs, can be assessed through a set of diagnostic experiments described below. The key point of comparison is whether the central projections and ranges of the simple climate models agree with those of more comprehensive Earth system models. These diagnostics should not necessarily disqualify models based on broader responses than the Earth system models, however, as the latter models are known to cluster near central estimates (e.g., Huybers, 2010; Roe and Armour, 2011). Similarly, it is not inappropriate for simple climate models to include feedbacks not represented in Earth system models; but the diagnostics should be run with these additional feedbacks disabled so as to facilitate comparison with more complex models that, because of computational limits, do not include such feedbacks.
Four key properties of any simple climate model can be assessed:
- Transient climate response to emissions (TCRE) can be assessed using extended release experiments along the lines of those conducted by Matthews and Caldeira (2008) or Herrington and Zickfeld (2014). In these experiments, CO2 is emitted at a constant rate of 20 Gt C/year until such time that cumulative emissions reached 50, 200, 500 or 2000 Gt C, at which point emissions are ceased. The TCRE is given by the ratio of warming to cumulative emissions at the end of the emission period. The TCRE experiments assess the combined response of the climate and the carbon cycle to CO2 emissions.
- TCR can be assessed with an experiment in which CO2 concentrations are increased at 1 percent/year from a preindustrial initial value, with the mean warming over years
-
60-80 defining the TCR. This assesses the multidecade response of climate to CO2 concentrations, removing from the equation the effects of the carbon cycle and the multicentury adjustments that contribute to ECS.
- The initial pulse-adjustment timescale (IPT) can be assessed with experiments such as that of Joos et al. (2013), in which the temperature response over time to a pulse emission of 100 GtC was assessed relative to a steady-state baseline CO2 concentration of 389 ppm. Such experiments provide information on both the IPT and the TCRE, but extended release experiments are more relevant to TCRE.
- Finally, the overall baseline response to forcing can be assessed using the representative concentration pathway/extended concentration pathway (RCP/ECP)26 experiments driven by total forcing (Collins et al., 2013). Specifically, a range of possible forcings can be examined by using the high-emissions 6 RCP/ECP 8.5 and low-emissions RCP/ECP 2.6 pathways. By driving the model directly with climate forcing, these experiments isolate the energy balance portion of the simple climate model.
Although these experiments and this report focus on the climate effect of CO2 emissions, similar diagnostics can be applied to the simple climate models used in the calculation of the social cost of other climate forcers.
___________________
26Extended concentration pathways are an extension of representative concentration pathway emissions scenarios from 2100 through 2300 (van Vuuren et al., 2011).
This page intentionally left blank.


