
2
The Metrics Landscape
The workshop’s first panel featured three speakers who provided an overview of the current state of population health metrics, shared the context to and broad outlines of an emerging major metrics set, and discussed the use of multisector metrics to inform health improvement. Steven Teutsch, Senior Scholar at the University of Southern California’s Leonard D. Schaeffer Center for Health Policy and Economics, senior fellow at the Public Health Institute, and adjunct professor at the Fielding School of Public Health, University of California, Los Angeles (UCLA), reviewed a few of the available metrics sets, described some of their characteristics, and discussed some of the opportunities that they provide to move from measurement to action. Alonzo Plough, Vice President of Research-Evaluation-Learning and Chief Science Officer at the Robert Wood Johnson Foundation (RWJF), made his presentation via video conferencing and spoke about the set of metrics that RWJF has adopted as part of its new 20-year Culture of Health initiative. Rajiv Bhatia, Founder and Principal at The Civic Engine, described an interdisciplinary, multisectoral set of metrics developed in San Francisco to track progress in meeting population health goals. Following the three presentations (highlights provided in Box 2-1), David Kindig moderated an open discussion among the workshop participants.
CONTEXT SETTING1
In many ways, said Steven Teutsch, the topic of population health metrics harkens back to public health surveillance, a subject that has long been discussed in public health. He defined public health surveillance as “the ongoing systematic collection, analysis and interpretation of health-related data essential to the planning, implementation, and evaluation of public health practice, closely integrated with the timely dissemination of these data to those who need to know” (Thacker et al., 2012). He then highlighted a few salient points about public health surveillance. Such surveillance, he said, is ongoing and not a “one-shot affair.” It is systematic in that it is done in a coherent manner, and it involves the collection, analysis, and interpretation of health-related data essential to planning, implementing, and evaluating public health practices. For the most part, public health surveillance has been a part of governmental public health practice, but at this workshop the discussion includes public health in a broader sense. Public health surveillance “is closely integrated with the timely dissemination of those data to those who need to know them and most importantly, actually apply that information and those data to prevention and control in improving health,” said Teutsch.
The long tradition of public health surveillance has included a number of uses, such as detecting problems, estimating the magnitude of a
___________________
1 This section is based on remarks from Steven Teutsch, Senior Scholar at the University of Southern California’s Leonard D. Schaeffer Center for Health Policy and Economics, senior fellow at the Public Health Institute, and adjunct professor at the Fielding School of Public Health, University of California, Los Angeles, and the statements have not been endorsed or verified by the National Academies of Sciences, Engineering, and Medicine.
health problem in a population, documenting the distribution and extent of a problem, generating hypotheses about causes, stimulating control activities, and evaluating control strategies. Teutsch noted that while most people think of public health surveillance in terms of detecting outbreaks of infectious diseases and pathogen changes, it can be used to detect any kind of problem affecting public health.
Turning to the definition of a population, Teutsch noted that there are many different conceptions of populations and subpopulations (see Figure 2-1). In his opinion, “we should be thinking about this in the broadest sense as being the health of a total population and that the total population being that of a geopolitical area, while fully recognizing that there are many subpopulations about which one is interested,” he explained. “We
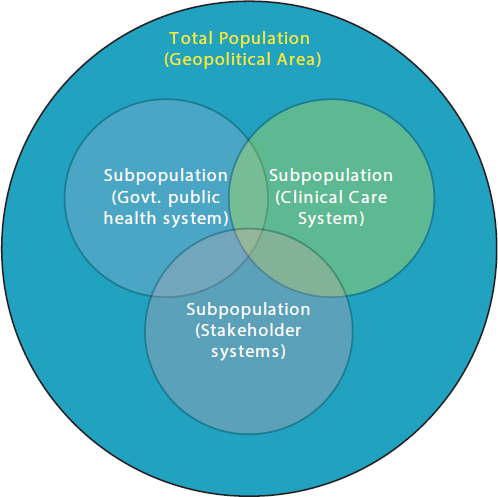
SOURCES: Teutsch presentation, July 30, 2015; Jacobson and Teutsch, 2012.
need to think about the entire population when we think about metrics and recognize that whenever we are dealing with subpopulations, they are only part of the problem and not representing the broadest sense of the total population.”
Teutsch noted that a 2012 IOM report (IOM, 2012a) identified three areas of population health for which metrics were needed: health outcomes, the health of communities, and health-adjusted life expectancy (HALE), which would be a summary measure of the health of the total population. To measure the health of the communities in which people live, metrics should account for social circumstances, the environment, policies, and other factors that reflect the health of communities, he explained. As an example, Teutsch mentioned the work in California by groups such as the Health in All Policies Task Force, housed in the state’s Sustainable Growth Council, and staffed by the California Department of Public Health in partnership with the Public Health Institute, and attempting to determine what a healthy community might look like. Such efforts paint a healthy community as a place that meets the needs of everyone across multiple dimensions by providing a quality and sustainable environment, adequate levels of economic and social development, social relationships that are supportive and respectful, and health and social equity.
One challenge in measuring these characteristics, said Teutsch, is to capture the breadth of what it takes to build a healthy community and to do so in a manner that provides succinct, understandable, and actionable data. Before discussing some of the different ways in which this challenge has been addressed, he explained some terms. A metrics set, he said, is an organized set of measures to assess and improve population health and health equity, while a core metrics set is a parsimonious set of measures that provides a quantitative indication of current status on the most important elements in a given field and can be used as a standardized and accurate tool for informing, comparing, focusing, monitoring, and reporting change (IOM, 2015). Good metrics sets need to drive some sort of action if they are to serve their purpose, Teutsch noted. Therefore they need to be compelling, comprehensive enough to cover the breadth of things of interest, easily understood, and supportive of change. He stressed that a good metrics set “needs to be parsimonious, and that in the end, [it has] to reflect things that are the most important so that [it] can help bring focus and stimulate action.” The individual measures in a good metrics set should be understandable, meaningful, compelling, mutable, and technically sound, he continued. They should also use available data at national, state, and local levels and provide information on subpopulations. He also said that many different groups develop metrics sets, and each group approaches the subject based on a particular purpose
and perspective. “That in some ways reflects why metrics sets do not align as well as we might expect,” he noted.
Teutsch then briefly reviewed a number of available metrics sets. One of the first sets of population health metrics was developed as part of the Healthy People initiative. The leading health indicators from Healthy People 2020 (Office of Disease Prevention and Health Promotion, 2015) includes the following:
- Access to Health Services
- Clinical Preventive Services
- Environmental Quality
- Injury and Violence
- Maternal, Infant, and Child Health
- Mental Health
- Nutrition, Physical Activity, and Obesity
- Oral Health
- Social Determinants
- Substance Abuse
- Tobacco
Although the Leading Health Indicators list does serve a purpose in setting a comprehensive set of national goals and objectives for improving the health of all Americans, Teutsch said it does not provide an accurate reflection of population health as likely viewed by the roundtable and most workshop attendees. The IOM undertook an effort to develop a more useful set of metrics for population health, and it produced a framework for health and health care indicator development (Figure 2-2). This effort, however, never went further than to develop this framework, said Teutsch.
The County Health Rankings (University of Wisconsin Population Health Institute, 2015), which have been available since 2004, separate health outcomes, such as length of life and quality of life, from the determinants of health that contribute to outcomes (see Figure 2-3). Teutsch said he finds it useful to look at the rough proportions of health that can be attributed to the four health factors of health behaviors, clinical care, social and economic environment, and physical environment. “This puts in perspective what is generally perceived in this country to be the relative importance of clinical care compared to all of the other factors that impact health,” he noted. Policies and programs, he explained, include the activities needed to move those health factors, and they are connected to roadmaps and other types of evidence-based processes. The America’s Health Rankings framework (UnitedHealth Foundation, 2015) (see Figure 2-4) is a partner to the county health rankings. This model is similar
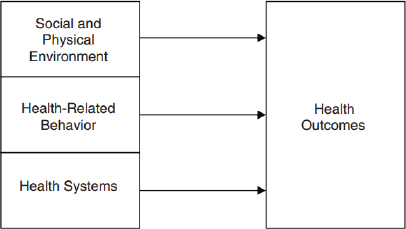
SOURCES: Teutsch presentation, July 30, 2015; IOM, 2009.
in many ways to the County Health Rankings model, but it places more emphasis on policies and combines community engagement and environmental factors.
The IOM’s Vital Signs report uses a different framework (IOM, 2015) (see Figure 2-5). One challenge associated with this model, said Teutsch, is that it is difficult to find measures for some of these factors. Another issue is that some of the terms, such as engagement, are not clearly defined.
The AARP Livability Index (AARP, 2015), said Teutsch, is a “nice resource” that includes many domains relevant to population health and aggregates them in a linear fashion without relative weights. Los Angeles recently launched a healthy community network (Think Health LA, 2015) organized around a website that provides a list of roughly 200 metrics. “It is a great resource, but it does not provide summary estimates,” said Teutsch. The Gallup-Healthways Well-Being Index (Healthways, 2015), which he called a “black box,” uses five domains to characterize well-being: sense of purpose, social relationships, financial security, relationship to community, and physical health. Both this index and the AARP index look at wellbeing from a broader perspective than simply population health, he noted. Teutsch also mentioned the National Equity Atlas (PolicyLink, 2015) as a useful source of data on equity and disparities, demographics, economic vitality, readiness, connectedness, and economic benefits.
A number of challenges are associated with all of these metrics sets, said Teutsch. One is the issue of parsimony versus completeness. “There is no good answer to what the right number of metrics is,” he said. His own bias, he noted, is that some composite measures that can then be disentangled are needed. For example, an air quality index would be a
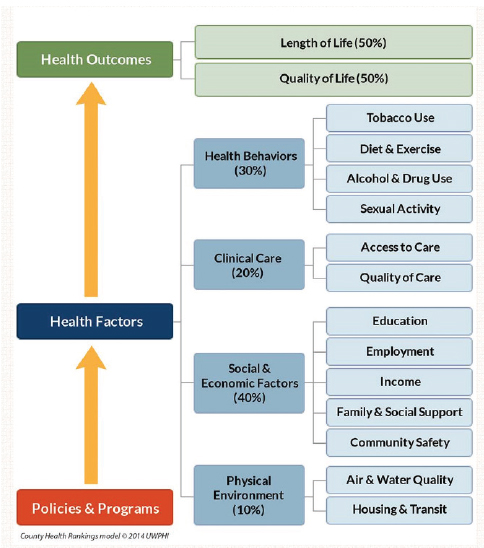
SOURCES: Teutsch presentation, July 30, 2015; http://countyhealthrankings.org/our-approach (accessed February 25, 2016).
poor measure for reflecting all of the environmental concerns that can impact the health of a community. What is needed instead, he said, would be something analogous to a consumer price index that the public could understand without needing to know how it was calculated from its component measures, yet could be broken down into its components when the need arises. Teutsch added that parsimony promotes focus.
Another challenge is to address the paucity of good equity measures for an entire community. Current approaches, Teutsch explained, gather
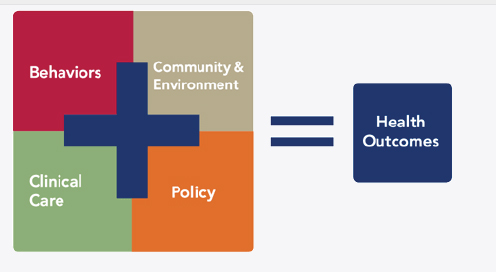
SOURCES: Teutsch presentation, July 30, 2015; United Health Foundation, 2015.
SOURCES: Teutsch presentation, July 30, 2015; IOM, 2015.
information on different demographic groups that can be analyzed for information on disparities. However, it is challenging to draw conclusions on how equitable a given community is from those measures. Outcome measures are also problematic in that they are not particularly useful for monitoring progress given how slowly population health outcomes change. “We need other measures to assess progress, a set of process measures that are relevant to a planned action,” he said.
The proliferation of core metrics sets, said Teutsch, is causing confusion among many constituents. “We could benefit from some authoritative leadership that pulls these together into a more coherent and smaller number that we use routinely and people become familiar with,” he said. Similarly, different metrics sets use data representing various levels of aggregation. The Vital Signs report, for example, uses national data, while America’s Health Ranking uses primarily state data and the County Health Rankings use county data. As the geographic unit gets smaller, down to the level of communities, the data often become scant, which Teutsch said is a problem when localities try to understand what is happening in their own community.
With regard to linking metrics to action, Teutsch noted that the County Health Rankings and Healthy People measures do a good job of using roadmaps that link various metrics to evidence-based interventions. These linkages can direct people to evidence-based resources on policies, programs, and systems change, he said. However, there is still the need to examine the components, actions, and systems changes that are needed in the measures themselves, Teutsch continued. He noted that the next presentation, on RWJF’s metrics for its action framework, would highlight a different type of metrics set, one designed to foster change. Along those lines, said Teutsch, is a need to develop more detailed measures that relate to specific interventions. He described the logic model from an IOM report (IOM, 2012b) on quality measures linked to the Leading Health Indicators from Healthy People 2020 (see Figure 2-6). This logic model, he said, tries to bridge the health outcomes monitored by the Leading Health Indicators to the conditions, interventions, resources, and capabilities that need to be in place at the policy, program, and systems levels to change those indicators.
As an example, he discussed how this model can be applied to tobacco use (see Figure 2-7). The model looks at the steps that the health care system and clinician can take to reduce tobacco use, as well as what kinds of policies and enforcement are needed. It identifies and defines possible interventions and the resources and capabilities that are needed to put those interventions into place. Alternatively, the model can start with resources and capabilities and look at how well an intervention would work given those initial constraints. Metrics can then be attached to each of these components.

SOURCES: Teutsch presentation, July 30, 2015; IOM, 2012b.
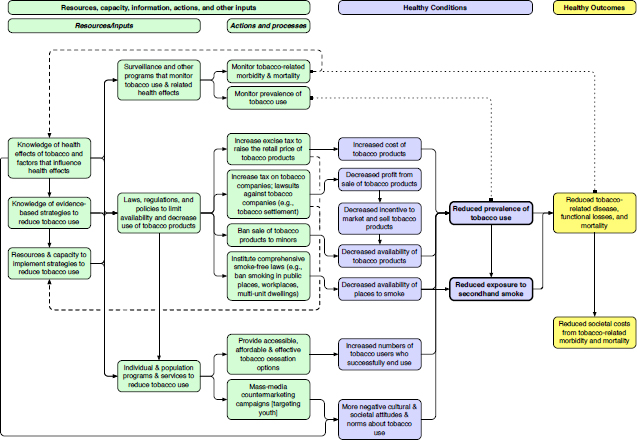
SOURCES: Teutsch presentation, July 30, 2015; IOM, 2012b.
“The best measures are the ones that drive action,” said Teutsch. “They provide the greatest health improvement and contribute to health equity for the total population.” He also noted that the greatest opportunities to improve population health reside outside the traditional health sector, as well as in systems and policy change, and that good measures are needed for those sectors, too. Measures must be tied to interventions, he added, and they need to be part of collective action and quality improvement processes if they are to drive change.
RWJF CULTURE OF HEALTH2
Building from the constructs, challenges, and opportunities that Teutsch introduced, Alonzo Plough described the process and framework that RWJF used to develop the set of national measures for its Culture of Health initiative. This framework and the associated measures, he said, are to serve as a catalyst for the national movement to build a culture of health in the United States. He also noted that these measures were developed through a collaboration with RAND, which will continue to be a key partner in the research that underlies the framework.
RWJF’s process of developing an action framework started with a big question, Plough stated. What is holding us back as a nation from achieving the health status and health equity to which we aspire? From this question came two additional questions: What do we know about that is evidence-based that we do not take to scale? What do we need to know more about to improve the health and health equity of the nation?
Given what is known about the importance of the social determinants of health, and the knowledge that many, or even most, of the assets that would drive change in those determinants are outside of the health care system, the challenge was to develop a framework and measures that engages those non-health sectors in an evidence-based manner and builds bridges to connect activities between the health and non-health sectors, Plough explained. As Teutsch noted, developing a set of measures that are both compelling and catalytic is critical, said Plough, and that is what RWJF has been doing for the past several months.
The process, he explained, included multiple meetings with leadership at the Centers for Disease Control and Prevention (CDC) and the National Institutes of Health, an extensive review of the literature and environment to identify evidence and linkages conducted by RAND,
___________________
2 This section is based on the presentation by Alonzo Plough, Vice President for Research-Evaluation-Learning and Chief Science Officer at the Robert Wood Johnson Foundation, and the statements have not been endorsed or verified by the National Academies of Sciences, Engineering, and Medicine.
and focus groups with 13 communities nationwide. He noted that RWJF conducted surveys about the Culture of Health strategy and tried to engage as many different political perspectives as possible. The framework that came out of this effort includes four action areas:
- Making health a shared value;
- Fostering cross-sector collaboration to improve well-being;
- Creating healthier, more equitable communities; and
- Strengthening integration of health services and systems.
RWJF, said Plough, believes the available evidence supports the idea that implementing what is known in each of these areas will over time create a culture of health and improve population health, well-being, and equity. He added that the foundation’s board of directors has made a 20-year commitment to creating this culture of health. “These are the population health and systems changes that are not going to happen overnight and involve the interdependence of many social, economic, physical environment, and even spiritual factors affecting health and well-being,” said Plough. In total, RWJF selected 41 Culture of Health national measures based on the availability of national data, their application to the entire lifespan and “health span,” the connection to broad determinants and upstream drivers, the appeal to multiple audiences, and equitability. He noted that achieving health equity in the United States is one of RWJF’s overarching concerns.
Rather than discussing each of the 41 measures, Plough gave an example from each of the four action areas. Starting with the first action area—making health a shared value—he explained that the three main drivers are mindset and expectation, a sense of community, and civic engagement. He noted that this is probably the most difficult of the action areas to measure because the changes that RWJF is trying to bring about require a gestalt shift in the way people think about health. One measure that RWJF believes is a reasonable indicator for this action area is the percentage of respondents who agree strongly that their health is influenced by peers, neighborhood, and broader community. The data sources for this metric will be the RAND American Life Panel Culture of Health survey (RAND, 2015). It is based on work on social cohesion (McMillan and Chavis, 1986).
For the second action area of the Culture of Health action framework—fostering cross-sector collaboration to improve well-being—the drivers are enumeration and quality of partnerships, resource investments across sectors, and policies that support collaboration. The foundation’s stakeholder engagement work found that many sectors not traditionally involved in health respond to the term “well-being” in a more actionable way than
when the problem is defined as being about health. A measure for this action item is the percentage of full-time personnel who have served as community policing or community relations officers or were designated to engage in community-oriented policing in the past year, and the data source will be the Bureau of Justice Statistics Census of State and Local Law Enforcement Agencies (Office of Justice Programs, 2015). Plough said that when this measure was first proposed, it was expected to be controversial, but given recent incidents around the country that highlight the distrust between communities and the police, the measure has become an important indicator of cross-sector collaboration. Another measure in this area, developed with the American Hospital Association (AHA), will examine the prevalence of sustainable and high-value hospital–community partnerships that go beyond Internal Revenue Service requirements and will use data from the AHA’s survey of chief executive officers. Plough noted this area does not overlap with other management systems, but it is important to the way in which the foundation believes change will happen. It is also closely aligned with many of RWJF’s grant-making activities and the partnerships it is working to catalyze.
The drivers for the third action area of the Culture of Health action framework—creating healthier, more equitable communities—are the built environment and physical conditions, the social and economic environment, and policy and governance. One measure for this area, which has been an RWJF focus area for many years, is the percentage of middle- and high-school students who report feeling safe on their walk to school. The data source for this metric will be the NIDA (National Institute on Drug Abuse) Monitoring the Future survey (NIDA, 2015). This measure, explained Plough, shows significant racial and ethnic disparities in the percentage of students who feel safe and, as with many of the other measures, provides a window on actions that would bring sectors together to make a difference. “It is a measure of a problem, but it is also a measure that speaks to the kind of engagement that we want to get to resolve that problem,” said Plough.
For the fourth action area of the Culture of Health action framework—strengthening integration of health services and systems—the drivers are access, consumer experience and quality, and balance and integration. A measure for this action item is the percentage of the population whose health care provider is part of an accountable care organization, and Leavitt Partners will provide the data for this metric. Plough called this a placeholder measure for what is called value-based prevention-oriented care. Other measures will focus on consumer experience and quality and on providing a better balance between preventive and acute services, and in particular, on the integration of social services into the health care continuum.
For the desired outcome—improved population health and wellbeing—the drivers are well-being, chronic disease management, adverse experiences, and cost, and there are measures for each of those drivers. Examples will include disability-adjusted life years for chronic disease burden, adverse childhood events, end-of-life costs, family out-of-pocket costs, and some well-being measures used by other countries. One measure, for example, will be the average annual Medicare payment for a descendant in the last year of life. The data source will be Medicare claims data.
Plough said RWJF tried not to duplicate existing metric sets, but did try to complement them. “We paid particular attention to our sister set of measures in County Health Rankings and Roadmap, which is a very important measurement system at the foundation,” said Plough. For example, the Culture of Health measures include the number of states with expanded practice laws for nurse practitioners as a window on actions to improve access to health care, which the County Health Rankings track. With regard to the Vital Signs (IOM, 2015) metrics, Plough noted four specific areas of synergy. Making health a shared value, for example, matches up with Vital Signs’s domain of engaged people, while creating healthier more equitable communities is synergistic with Vital Signs’s healthy people domain. Culture of Health’s strengthening integration of health services and systems action area is synergistic with the Vital Signs domain of care quality and lower cost. The improved population health, equity, and well-being outcomes align with the Vital Signs domain of engaged people, healthy people, care quality, and lower cost.
RWJF has tried to look at potential measures to understand how engaged people are in health improvement efforts, such as a Twitter measure to gauge how social media affects engagement, and how multisector partnership can impact engagement. Plough noted that RWJF has created partnerships with the Federal Reserve and community developers to create more affordable housing and ease residential segregation, and with the National YMCA and United Way to leverage the culture of health, but it needs indicators to measure how effective those collaborations are at improving health.
An important issue when developing a national metric system, said Plough, is deciding how to tie it into changes in public health at the local level given that health happens locally. “How do you understand whether the measures, the dynamics, and the action areas that we have posited make sense and reflect effective, collective action to improve health and well-being at a local level?” he asked. To answer that question, RWJF is launching a Sentinel Community Study that aims to understand the evolution of collective action for health in all of its variations and to identify new measures using sentinel surveillance. This initiative will not just study best practices but the variety of practices drawn from the work of
communities at different levels of development with the goal of identifying clusters of programs that are effective in developing collective action around health. Plough said it will track some 30 communities with different geographic and sociodemographic characteristics and use mixed methods of data collection and monitoring. RWJF is also collaborating with the University of Chicago to identify the different ways in which people across the nation think about the factors that generate health and the role of market versus governmental forces. Data collected in the 30 communities will show how different communities try to build a culture of health and the role that metrics play in those efforts. The data from that study will be available via a new website that the foundation will launch simultaneously with this study.
At the same time the foundation is launching what it considers to be a bold strategy using measures that are not all conventional, it is trying to build an evidence base to support this approach to improving the health of the nation. To that end, RWJF is launching three new research programs: Evidence for Action, Policies for Action, and Systems for Action. These programs, said Plough, will emphasize the imperative of the translational role of research so that the research is meaningful and will engage the sectors that need to use this information to build the culture of health. Evidence for Action, which has already launched from its national program office at the University of California, San Francisco, has a rolling application period. Policies for Action, which will launch with Temple University serving as the national program office, aims to build what Plough called the science of health in all policies. Systems for Action, which is an evolution of Glen Mays’s work at the University of Kentucky on public health services and systems research, will study how to integrate public health systems with other systems to improve health and well-being.
In closing, Plough said that taken together, these measures and the framework characterize where RWJF is aligning all of its resources going forward to build a culture of health. He noted that RWJF will release version 2.0 of these measures in late 2016, and that it will be using its website and other engagement strategies to solicit comments on how it might improve this effort going forward.
MULTISECTORAL METRICS3
Good social indicators serve multiple functions, said Rajiv Bhatia. One function is to communicate the magnitude of needs and problems.
___________________
3 This section is based on the presentation by Rajiv Bhatia, Executive Director of The Civic Engine, and the statements have not been endorsed or verified by the National Academies of Sciences, Engineering, and Medicine.
Indicators can emphasize or imply the cause of problems, for example, whether health is an individual or a collective responsibility. Indicators or metrics also serve as benchmarks, a means to measure progress toward a goal, as well as a driver of rules for policies, laws, and institutions. Many health laws and policies, said Bhatia, use indicators in their implementation, for example, environmental and occupational health standards. Finally, indicators or metrics help hold responsible parties accountable. “If we are going to hold people and other sectors accountable for not considering and not acting on health in their decision making, we are going to need indicators that both sides feel [is] credible as evidence of inaction,” said Bhatia.
His first experience with metrics came in the late 1990s, when San Francisco began repurposing historically industrial land for residential and office uses. Communities in the city were complaining that development was increasing pollution and noise without building community serving infrastructure, such as schools, parks, and libraries. The San Francisco Health Department responded by bringing together nonprofit organizations, businesses, and public agencies to examine growth plans through a health and equity lens and consider what healthy growth would look like. The 40 community organizations involved in this examination wanted a yardstick to measure progress and to hold the city accountable to a vision of healthy development. In response, San Francisco developed the Sustainable Communities Index as a system of performance indicators to measure land use and growth plans. “We did not come to this process thinking that we were going to develop an indicator set,” said Bhatia, “but there was a clear target for action and a clear purpose from the outset. That, I think, was essential to the success of this work.”
Bhatia noted that the Sustainable Communities Index uses local data and is not replicable on a national scale. It includes 90 neighborhood-scale measures and is not parsimonious. City agencies first used the Index to analyze whether four neighborhood development plans addressed the problems the indicators were identifying. For example, the indicators showed that neighborhoods with planned growth excelled in some health-related resources, such as access to public transit, but had gaps in other resources, such as access to recreation and quality elementary education (see Figure 2-8). These findings demonstrated that the existing development plans lacked the tools to address these access issues, thereby justifying a number of actions, including instituting a development impact fee that went to a community resource fund, and increasing the affordable housing set-aside.
Of the 90 measures in the Sustainable Communities Index, only a handful actually resulted in an action and response through the city’s planning process, said Bhatia. Some indicators helped to set numerical targets for planning policy and action thresholds for environmental land
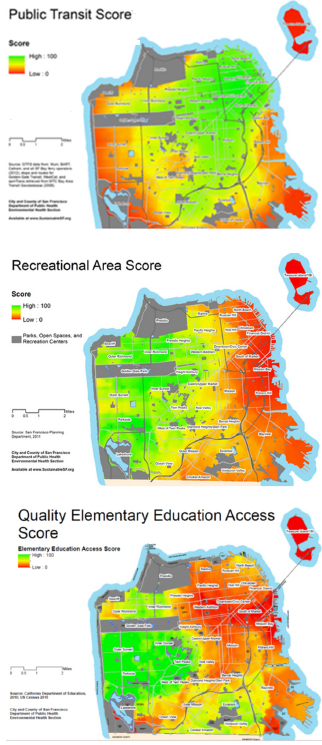
Recreational Area Score—A relative measure of the number of acres of public recreation space within 2 miles, weighted by distance. Source: San Francisco Planning Department, 2011. City and County of San Francisco Department of Public Health Environmental Health Section.
Quality Elementary Education Access Score—Source: California Department of Education 2010; U.S. Census 2010. City and County of San Francisco Department of Public Health Environmental Health Section.
SOURCES: Bhatia presentation, July 30, 2015. Public Transit Score: http://www.sfindicatorproject.org/indicators/view/58 (accessed August 2, 2016); Recreational Area Score: http://www.sfindicatorproject.org/indicators/view/91 (accessed August 2, 2016); http://www.sustainablecommunitiesindex.org/img/indicators/pdf/School_Access_2010.pdf (accessed August 2, 2016).
use regulations. In one case, the city used an existing indicator as a novel application of this regulation—the federal particulate matter (PM) 2.5 measure—that it collected at a street-level scale. The indicators were also used to justify impact fees, change the way infrastructure funding was targeted in the city, and promote community advocacy.
One lesson learned from this example, said Bhatia, is that indicators could be effective in catalyzing population health action in multiple sectors when they reflected collective needs and priorities determined by community stakeholders and were measured at a human scale. “Many people cannot relate to citywide statistics,” said Bhatia, who added that data today are becoming what he called hyper-personalized. “If you can know everything about your environment through your mobile device, why consider a citywide average? We need to pay attention to how people relate to data today when we think about the scale of indicators.”
Bhatia said, too, that the indicators were more effective in catalyzing action when they documented unequal and harmful conditions, particularly when they disproportionately affected children, than when they were documenting unequal access to a good. They were also most successful at catalyzing action when they identified responsible parties and responsive actions and when they could be integrated into institutional rules.
Based on that experience, Bhatia decided the proper approach to indicators was not to use the set of 90, or even a subset, but to design an indicator for a particular problem and its solution set. As an exam-
ple, Bhatia discussed the indicator that the city developed to measure pedestrian injury density to document the spatial concentration of serious pedestrian injuries on busy streets in mixed-use neighborhoods. The existing frame of the problem he explained, was that pedestrian injuries had roots in bad behavior, not road design. Furthermore, the city’s traffic calming and police enforcement solutions were not being applied where the most severe injuries were occurring. The new indicator, computed as the linear density of severe injuries on a road, showed that 5 percent of San Francisco’s streets were responsible for 55 percent of the severe and fatal injuries (see Figure 2-9), and it justified redeploying enforcement and engineering resources. The new indicator, said Bhatia, was highly effective in changing city policy and programs because it was designed for purpose and with consideration of the barriers to be addressed. He noted that this seems to be the approach that RWJF is taking with its measures.
On a regional level, Bhatia recounted an effort of the Bay Area Metropolitan Transportation Commission that integrated health and neighborhood well-being indicators to prioritize transportation funding based
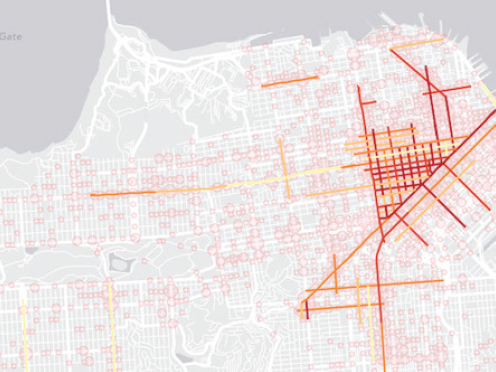
SOURCE: Bhatia presentation, July 30, 2015.
on community goals and priorities. The regional transportation agency wanted to broaden the way it evaluated how it was spending federal transportation money from just measuring how quickly people were getting to work to using a broader set of livability measures. The agency developed several regional measures for transportation system performance (see Figures 2-10 and 2-11), and integrated into these health and equity measures used to evaluate both the overall regional plan and individual transportation project performance. The agency used some, but not all, of the health measures to estimate individual project cost/benefit ratios (see Figure 2-12). He noted that these comprehensive decision criteria were only relevant to the 15 percent of the federal transportation funding available for discretionary projects and did not affect the majority of funding committed to legacy projects.
Turning to the national level, Bhatia discussed some of the early lessons learned from the Healthy Communities Index project sponsored by the U.S. Department of Housing and Urban Development (HUD) to support investments in the physical, social, and economic determinants of health. HUD initiated this project specifically to respond to the need for a comprehensive and uniform practice for monitoring neighborhood level determinants of community health, he explained. “HUD wanted to get to measures at the neighborhood level, to have uniformity, and to go beyond those available from the American Community Survey and other sources like that,” said Bhatia.
The project began in 2012 with four indicator selection criteria. An indicator had to have an established, evidence-based nexus to population health and it had to be measurable at a neighborhood scale, which meant that it was already being collected or that local data could be processed uniformly to construct neighborhood-level indicators. Selected measures had to be connected to available actions to improve the indicator and the measures had to be relevant to community needs and priorities. A group of domain experts examined 220 indicators reviewed against these criteria, producing a set of 90 that went through a final review process. A national advisory committee commented on the proposed set, and HUD selected 37 core indicators and 5 city-level contextual indicators that were organized in 10 domains.4
This project is currently in a pilot phase in Albuquerque, Minneapolis, Providence, and San Diego—jurisdictions which have collected the measures, ranked every neighborhood on all 37 indicators, and posted
___________________
4 The domains of the Healthy Communities Index indicators: environmental hazards, natural areas, transportation services, housing, social cohesion, educational opportunities, employment opportunities, neighborhood characteristics, economic health, health systems, and public safety.
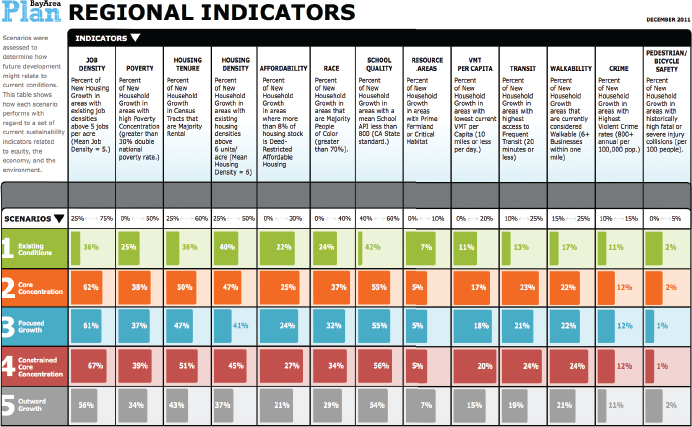
NOTE: VMT = vehicle miles traveled.
SOURCE: Bhatia presentation, July 30, 2015.
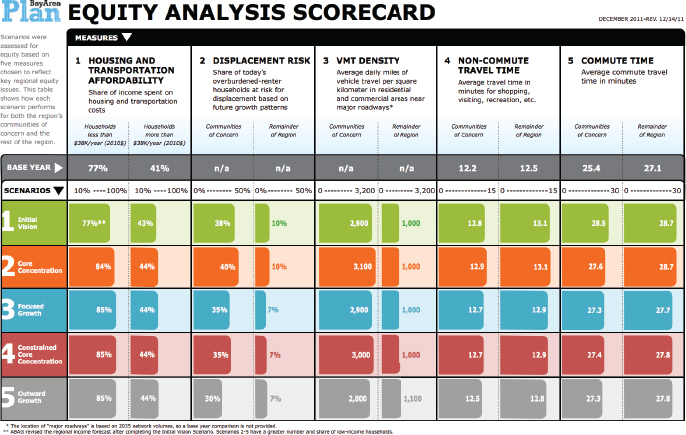
NOTE: ABAG = Association of Bay Area Governments.
SOURCE: Bhatia presentation, July 30, 2015.
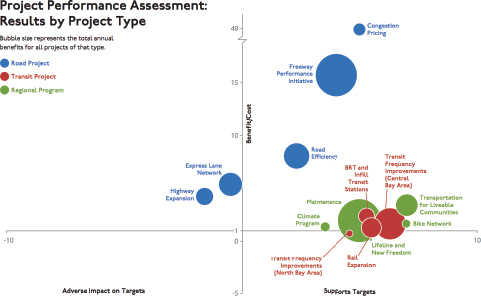
SOURCE: Bhatia presentation, July 30, 2015.
the results on websites. The cities are now in a process of stakeholder engagement to determine how to best use the indicators. So far, multiple cities have been able to implement uniform methods to “measure health resources at a neighborhood scale in multiple cities,” said Bhatia. He considers the ability to reconcile multiple data sources with community–defined neighborhood definitions a particular innovation of the work.
At the same time, he noted that the top-down national approach has limited community engagement, buy-in, and application in the pilot cities. Stakeholders want to be in the driver seat in selecting the measures used to assess the health of communities. By contrast, the indicators initiative in San Francisco started with engagement and offered community organizations the ability to decide what measures were important. He noted that while the engagement that is happening now with the HUD project has been positive, people are going to need time to own these measures. “They are not going to accept these measures as the ones that they need to solve their problems,” said Bhatia. “I think that is an important lesson.” He also noted these measures were intended to lead to action, but because the data came first rather than in response to a specific problem or set of problems, the indicators are still searching for applications.
Bhatia underscored the point that indicators themselves do not nec-
essarily lead to progress. As an example, he used the Gross Domestic Product (GDP), an indicator with “an army of economists and Wall Street behind it,” and the Genuine Progress Indicator (GPI), which was created to be a more holistic measure of well-being. Although GDP has grown substantially, GPI has remained largely unchanged since the mid-1970s (see Figure 2-13). “There is not much of an engine behind that indicator,” said Bhatia.
Bhatia concluded his talk by describing two simple prototypes of highly effective indicators: a speedometer and a blood pressure cuff. Both provide measures that can lead to action—stepping on the gas or brake pedal to change velocity in the case of the speedometer, or changing health behaviors or taking high blood pressure medication in response to readings from the blood pressure cuff. “While these may seem to be strange examples, they represent working indicators,” said Bhatia. He
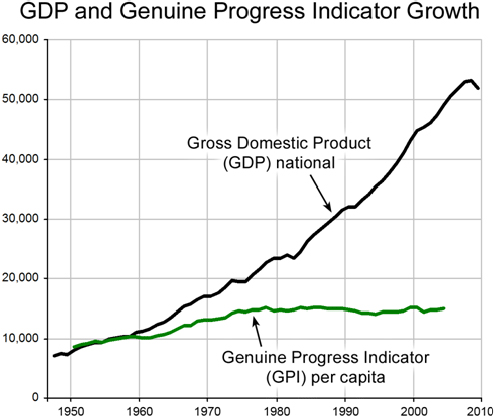
SOURCE: Bhatia presentation, July 30, 2015.
encouraged a shift from thinking about data first to thinking about purpose first.
DISCUSSION
Veronica Shepherd from the San Francisco Department of Public Health asked the panelists how people can hold organizations accountable when they themselves face many daily struggles to meet basic needs. Bhatia said the ability to hold organizations accountable is a function of power and prestige and that anyone struggling to meet basic needs is not likely to have either of those. He agreed that without a certain level of having basic needs met, it is difficult for people to be engaged participants, whether it be in the medical system or the political system.
Israel Nieves-Rivera from the San Francisco Department of Public Health asked the panelists if gentrification was factored in their work with county health rankings. Teutsch said he could not speak directly to the matter of gentrification, but he did recount Bhatia’s remarks about GDP not painting a complete picture of the nation’s well-being. On the surface, increases in GDP, said Teutsch, would suggest the nation is doing great, but GDP does not include the consequences of externalities such as climate change, environmental health services, ecosystem destruction, and the displacement of people. “Part of the problem we have with some of our metrics is that we think they are measuring one thing, but they also blind us to many of the other factors that are really central,” said Teutsch. “That leads to some significant imbalances, whether they are equity issues or environmental issues, because they are not central. That is why our metrics have got to be relevant to the issues that we care about.” Bhatia added that most metric sets and measurement techniques look at a cross-section of a community at one specific time point, but tracking and understanding gentrification, a dynamic process, requires following a cohort over time. This is an important issue, he said, because measures of health of a community might improve with gentrification. One new approach, he said, is to measure changes in spatial disparities, which can be done with cross-sectional data. Another approach is to follow sentinel individuals in communities, though the latter involves some challenging privacy issues.
Helen Wu from the University of California, Davis, Institute for Population Health Improvement also noted the importance of identifying measures that accurately reflect issues of concern. She questioned how the field is going to move from measuring indicators to making progress without better metrics. Plough noted that RWJF has two measures of housing—residential segregation and housing unaffordability as measured by housing costs being equal to or greater than 50 percent of
income—that it believes will address some of the issues around income inequality and that may help understand actions that can improve life conditions in a community without gentrification. “We use those measures to catalyze actions to bring developers in to create approaches to mixed income housing that can improve housing stock without gentrification,” explained Plough. This approach, he said, combines an action element with the measure so that the measure and actions are synergistic.
Teutsch said collective action among constituents in a community is important and that constituent groups have to hold each other accountable. “You need the local commitment to do things that matter locally or change doesn’t happen,” said Teutsch. “You can drive actions by helping communities look at the real outcomes they want, find interventions that they are prepared to take on, and then [make them] hold themselves mutually accountable.” Bhatia agreed with both Plough and Teutsch and said the goal should be to design a system that has an action, a measure of its success, and a feedback loop.
Matt Stiefel from the Kaiser Permanente Care Management Institute commented that Teutsch’s list of criteria for good indicators did not list latency, the time between publication of a measure and action taken. He also noted that Teutsch introduced a broader and more geographically focused set of indicators than has been used traditionally in health care, but that they all suffer from providing data that are old and may not reflect current progress. Bhatia agreed that latency can be important for some issues, but not all. He cited environmental conditions, which tend to be more stable, as a case where older data may have continued relevance. Kindig pointed out that RWJF is using Twitter data as more timely metrics of well-being. Teutsch added that the field is still trying to determine how best to tap into this kind of data. He also said that outcomes do not change that fast, processes and actions change more quickly. However, measuring changes in processes and actions requires local data that oftentimes do not exist. He also noted the overarching problem that the nation’s data systems are slow, are not local, and suffer from inadequate investment.
Kindig agreed with the last statement with regard to the mortality data that he uses in policy research, though he noted that a measure such as low birth weight can be more proximal and more directly related to policy. Kelly Hunt from the Hunt Strategy Group commented on the importance of teaching community members who are working on population health projects to collect their own data, something that she is doing in conjunction with the New York State Health Foundation. “To get real-time information and keep people active and seeking change at the ground level, we have to help everybody collect that information themselves,” said Hunt.
Abigail Kroch from Contra Costa Health Services asked about the
collinearity of so many of the indicators given that the primary drivers of poor health outcomes are race, particularly African American, and poverty. “We are overwhelming these communities with negative indicators that can be as disparaging as they can be a call to action,” said Kroch. Plough replied that RWJF was cognizant of that issue and said the foundation’s 41 measures represent a move away from identifying disparities and deficits to one that focuses more on assets and on measures that can be moved through collective action. He added that there is a need to triangulate around the many different mechanisms through which those disparities can be addressed. Kindig noted that 20 years ago, metrics focused on tobacco use rates, infant mortality, and little else. “If we have too many social indicators we are paying attention to, that is something we need to deal with, but it certainly is a sign of progress in our field,” said Kindig.
Margaret Guerin-Calvert from the Center for Healthcare Economics and Policy at FTI Consulting said some communities she works with have baseline data, but are not satisfied that national or state averages are good aspirational goals for their communities, both with regard to process and outcome measures. She asked the panelists if they had suggestions for best practices to help define aspirational-specific targets for measuring progress. Teutsch agreed that this was a challenge, noting that the Healthy People objectives, for example, are simply national percentage reductions. “It is helpful to have local data that are from relevant comparison areas that can be used as a standard,” said Teutsch. He noted that some available datasets could serve as reasonable benchmarks. He added that the benchmarks established in the IOM report For the Public’s Health: Investing in a Healthier Future (IOM, 2012a) were to serve as goals to reach the averages for health outcomes and health care costs of other developed nations in the world and to send a message about the problems facing the U.S. health care system with regard to outcomes and costs. Bhatia said local groups should set local targets based on what they want, believe they can achieve in a given timeframe, and believe is right for their community.
Susan Burden from the Beach Cities Health District noted that her organization has found that communities understand the measures in the Gallup-Healthways poll. She also commented that the idea of measurement with a purpose inspires her and asked if there is any research on that concept. Teutsch replied that surveillance is essentially measurement with a purpose with respect to achieving a certain end. Burden responded that one problem is that data that are collected nationally are often bunched in sectors that are not applicable locally, a point with which Teutsch agreed. Bhatia suggested that part of the problem is that indicators are being proposed from the top down rather than in partnership with the communities
that need data to drive change. “We have to do things in partnership,” said Bhatia. “We need to ask, Who is the engine? Who has the controls?”
Plough pointed out that RWJF uses the term “national measures” when referring to its metrics set because it can get national averages for them, but that the goal is for them to serve as catalysts for thinking about what is most meaningful at other levels, be it at the community, neighborhood, or block level. He used jazz as an analogy, where the proposed measures are just the initial tune and the end result includes what the band members do with key changes and variations. “In the development of metrics that matter, it is important to have frameworks that speak to the urgency of the problems we collectively want to solve, but have nuanced, locally generated ways of finding the right metric to do that,” said Plough.
This page intentionally left blank.


