
3
Using Metrics Locally
The workshop’s second panel included three presentations illustrating how metrics can be used locally. Julie Willems Van Dijk, Associate Scientist and Co-Director of the County Health Rankings and Roadmaps Program at the University of Wisconsin, spoke briefly about the County Health Rankings and Roadmaps, and Megan Joseph, Director of Community Organizing at the United Way of Santa Cruz County, California, spoke about her organization’s work using data to shape youth violence programs. Michael Bilton, Senior Director of Community Health and Benefit at Dignity Health, then discussed the use of local metrics to shape his organization’s socially responsible community and population health improvement initiatives. Following the presentations (highlights provided in Box 3-1), Willems Van Dijk moderated an open discussion.
COUNTY HEALTH RANKINGS AND ROADMAPS1
One thing that she has learned over the previous 6 years of working on the County Health Rankings and Roadmaps, said Julie Willems Van Dijk, is that for most communities, county-level data are not actionable. To address that problem, she and her colleagues, as well as researchers in other groups, are working on methods for providing better links to
___________________
1 This section is based on remarks from Julie Willems Van Dijk, Associate Scientist and Co-Director of the County Health Rankings and Roadmaps Program at the University of Wisconsin, and the statements have not been endorsed or verified by the National Academies of the Sciences, Engineering, and Medicine.
local data. She noted that the County Health Rankings added a measure on income equality in 2015 as a start on getting at equity within a county instead of just comparing counties to counties. “This is an important area for focusing action,” said Willems Van Dijk. She then acknowledged that the term “health” can be misleading and serve as a barrier to use, and that data has to be about purpose first.
The County Health Rankings (see Figure 2-3, in Chapter 2, for the County Health Rankings model), Willems Van Dijk explained, are not primarily a data project, a remark she said she was making with great respect for her colleagues who collect the data. “It is about using data to raise awareness about this model and about putting some pieces of data in context so that we wake up people who do not understand what is happening in their communities,” she said. The County Health Rankings, she added, are only intended to be a starting point for a discussion about data. Over the course of the project, she has found that this model, while not perfect, is one to which people can relate. “In particular, it is helping to move the discussion about social and economic factors from one that is about the demographics we report in a community health assessment to actionable areas for improving the health of our communities,” said Willems Van Dijk.
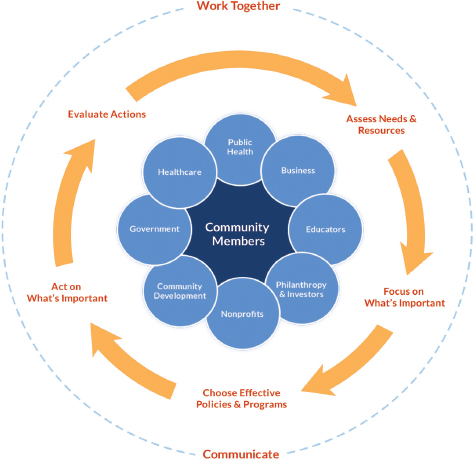
One of the best kept secrets about County Health Rankings and Roadmaps, said Willems Van Dijk, is the set of tools and resources associated with the project’s action model (see Figure 3-1). These tools and resources
SOURCE: Willems Van Dijk presentation, July 30, 2015.
are designed to help community leaders who want to take action to think about how they can work together to assess needs and resources and focus on what is most important. “You can go into the action center and find succinct guidance and linkages to numerous tools to help do that in your community,” said Willems Van Dijk. Included in the tool set is a robust evidence analysis tool called “What Works for Health” that reviews the literature and rates the evidence supporting the various actions a community might take.
Willems Van Dijk said her career goal is to move beyond community health assessment—she hopes to eliminate that terminology—to action. “We need to use data to identify the most important areas and then target our actions, and we need to use data to monitor and track progress as defined locally in a meaningful way,” she said. “We need to leverage man-
datory assessments such as the ones the Internal Revenue Service requires of hospitals and the accreditation process available to local health departments and the voluntary assessments such as the ones that United Way of Santa Cruz does in a community to achieve meaningful action.” The goal, Willems Van Dijk added, should be to move from the situation where 90 percent of the effort is spent on assessment to one of action and doing something meaningful to improve health. In concluding her remarks, she said that she hoped this session of the workshop would provide examples of how to make the transition from measurement for measurement’s sake to measurement with a purpose.
MOVING FROM DATA TO ACTION IN A COMMUNITY2
Three years ago, a few critical incidents involving youth violence prompted the community in Santa Cruz County, California, to come together and look at how it was dealing with the problem of youth violence, explained Megan Joseph. The discussions clarified that the community had many programs, but they were not connected or operating with a common plan or goal. The time was right, however, to do things differently, she said, and that resolve led to an effort to undertake a community assessment of youth violence prevention using the United Way of Santa Cruz County’s Community Assessment Project’s indicators. The 12-month assessment, which began in December 2013, collected data on approximately 60 different indicators that were then used to inform a 15-month planning process, said Joseph. One output from the planning process was a mission statement for the Youth Violence Prevention Task Force that was created based on shared values the group agreed to follow:
An equitable and united county where all youth are engaged in family, school, and community; where all youth have a sense of safety and wellbeing; where all youth feel they have a voice and are empowered to use it; and where all youth are able to access opportunities for successful transition into adulthood.
Joseph said this mission statement also reflects the core principles used to drive this process. One such core principle, she said, is to take a public health approach to addressing youth violence. “We knew we needed to look at those social and economic factors driving youth violence in our community,” she said. “We wanted to make sure we were using
___________________
2 This section is based on the presentation by Megan Joseph, Director of Community Organizing at the United Way of Santa Cruz County, California, and the statements have not been endorsed or verified by the National Academies of Sciences, Engineering, and Medicine.
balanced strategies that were not just using suppression or prevention but included everything in between.” The task force also wanted to make sure it was using data from multiple sources, reflecting the knowledge that the core data it could access were important, but did not include all of the voices that needed to be represented and all of the stories informing the trends in violence that were spurring action. Collecting qualitative as well as quantitative information proved to be an important component of the data-gathering process, said Joseph.
Another of the task force’s core values was to focus on demonstrating an understanding of the disparities and inequities the data revealed and to create a plan for addressing them. Joseph noted the task force made sure the strategies it chose to push forward reflected the knowledge it had gained from involving the community in the data-gathering and planning activities. The task force also focused on what Joseph called “authentic community engagement” that stressed going into those sectors of the community that are often underrepresented in such efforts and letting the youth and families in those parts of the community present their perspectives and their understanding of what the data meant to them, how they were represented in those data, and what efforts to bend the curve on youth violence should look like. Joseph noted that the strategic plan resulting from these activities launched in May 2015, and at the time of the workshop several components of the plan were already in motion. “This could not just be an assessment,” said Joseph. “It was an assessment and an action from day one.”
Joseph credited her organization’s partners in this effort—Applied Survey Research, the Lucille and David Packard Foundation, and the Criminal Justice Council of Santa Cruz County—and hundreds of volunteers for putting aside their differences and coming together to develop this strategic plan. This was not an easy process, she said, given that some of the partners had adversarial relationships regarding youth violence—having different ideas on what gangs and public safety meant, for example. Building bridges, said Joseph, required a values-informed framework, something that would bring disparate partners together for the first time to “truly look at what could be our North Star, what could get us to our goal together.” That framework, she said, was one of results-based accountability (RBA), which focused on six steps (see Table 3-1) starting with identifying the population (Step 1), which was youth ages 10 to 24, and the specific desired results for the community (Step 2).
Once the population and desired results were identified, the task force picked those indicators that provided a gauge of progress toward those results and then looked for stories behind those indicators. In their application of the RBA Steps 3 and 4, Joseph said the group looked at 60 indicators, and then examined the story behind the trend on an indicator
TABLE 3-1 Bending the Youth Violence Curve in Six Steps
| RBA Step | Action Item |
|---|---|
| 1 | Population: Identify the population you will be discussing |
| 2 | Result: Identify the specific result |
| 3 | Indicator: Identify data points that will measure your progress |
| 4 | The Story Behind the Trend: Identify what the indicators say, what |
| the causes and forces are that affect these indicators | |
| 5 | Key Partnerships: Identify partners with a role to play in turning the curve |
| 6a | Steps Toward Action: Identify the five best ideas for Turning the |
| Curve and improving the results | |
| 6b | Strategies: Identify which strategies are best suited to turning the curve in the areas identified above |
NOTE: RBA = results-based accountability.
SOURCE: Joseph presentation, July 30, 2015.
such as graduation rates. “If rates are going down for a certain population in our community” she asked, “What do we do with that? Why is that? What is the cause? What is the root cause? What are people’s experiences, lived experiences of that? That is what we worked really hard to get behind.” Community engagement with data can be tricky, said Joseph, given that people can gloss over the numbers unless there are concrete stories that can explain trends and turn numbers into reasons to care about what happens. Next, the task force built partnerships (Step 5) based on what it knew it needed to bend the youth violence curve, and only then did it develop strategies for action (Steps 6a and 6b). “We decided that we wanted to do that last because we wanted people to come in the room and let go of their pet projects, let go of their programs, let go of what they thought worked, and get down to the difference we wanted to make, what the numbers say, what our community is telling us, and then build something together,” explained Joseph. “That really did reduce the barriers between groups and bring people to the table who we never thought we would even get to the table.” More importantly, she added, those groups and individuals stayed at the table.
The plan, said Joseph, had three focus areas—families, neighborhoods, and youth development—and the indicators used to measure results covered those three areas. Data came from an array of sources, including family and youth focus groups; an online education survey with educational leaders across the county; ride-alongs with the Santa Cruz and Watsonville police departments; and interviews with more than 60 stakeholders representing business, community-based organi-
zations, education, government, and justice. More formal data sources included the American Community Survey, California Department of Justice, California Healthy Kids Survey, Child Welfare Services, Community Assessment Project, and Department of Education reports. The probation department gang taskforce even provided data it had never given before. For this project, in keeping with the framework of results-based accountability, it was important to choose indicators that would be measured over time to produce trend data and provide indications of progress. Another important action was to use indicators that had what Joseph called “communication power,” that people could understand and with which they could connect.
She noted the importance of looking at new and innovative ways of measuring social determinants and some of the “softer factors” around youth violence for which there were no measures that were meaningful at the neighborhood level. For example, the task force knew that neighborhood connectivity and social capital are important to safety at the neighborhood level, but there was no direct measure of those factors. Instead, it looked at the Community Assessment Project for suitable proxy measures. For example, one proxy measure for social connectivity and social capital was how much people believe they can go to their neighbor for help, which is a question in the biannual survey that the Community Assessment Project conducts. She called on the research community to help develop indicators for these “softer” components of community health.
To ensure that it had the most inclusive qualitative data possible and authentic community inclusion, the task force worked to get alternative education schools to conduct the California Healthy Kids Survey, which previously had been administered only in traditional schools. “That was a big shift for our community, and we are excited to see what the first year’s data say,” said Joseph. She noted that the qualitative process—putting meat on the bones of the data, as she put it—brought disparities to life. “Yes, they were there in the initial data, but we wanted to make sure that the qualitative processes informed what we were seeing in the data and what strategies we needed to enact,” said Joseph, who then discussed several examples of the qualitative data the task force collected.
Safety at school is an important indicator when dealing with youth violence, and the California Healthy Kids Survey showed a disparity across the county as to how safe students felt at school (see Figure 3-2). These data showed that students in the Pajaro Valley Unified School District and the San Lorenzo Valley School District felt less safe in their schools compared to students in the other schools in Santa Cruz County. A deeper dive, including a comment from one of the alternative education teachers in the Pajaro Valley district, found that one of the biggest factors for whether a student would become involved with a gang was whether
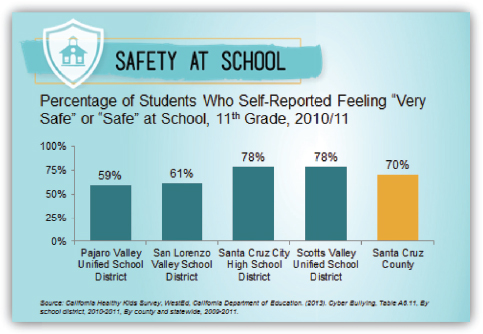
SOURCE: Joseph presentation, July 30, 2015.
the student had safe transportation to school—students who had to walk to school were more likely to be tapped to join a gang. That was a big “aha” moment, said Joseph, because that was something the task force could address, which it is doing through a new Safe Havens program.
Equity has always been an important consideration, but it was not always at the forefront of discussions when this process started, said Joseph. As the quantitative and qualitative data started showing clear disparities, the conversations of the task force’s workgroups shifted to make equity and disparities a central part of the discussions. “They became a driving force of why people wanted to be at the table and do this work,” said Joseph, and that shift led to a myriad of different, specific strategies to address those disparities. One effort, for example, found that disparities in the use of prosocial youth activities was not a result of such activities not being available, but because of access problems: they were too expensive, located in the wrong place or the wrong time, or required unavailable transportation to get to them. “Access equity became a big ‘aha’ for us and something that we could do something about,” said Joseph.
She then highlighted an example of the kind of insights that can be gained when data are transparent and stakeholders own up to what the
data reveal. Data from the probation department showed that 88 percent of the youth in Santa Cruz County who were tried as adults were Latino. “There are many easy explanations and answers for that if you do not want to own that, so we dug deeper,” said Joseph. Doing so revealed that after accounting for similar charges, Latinos are still tried more often as an adult. That finding enabled the task force, through its partnerships, to advocate for change.
Joseph noted the importance of trusted partnerships in gaining access to data, and as an example she showed some newly acquired data on gangs (see Figure 3-3). “Having law enforcement at the table and be[ing] able to understand this from a data perspective was a huge door opening for us,” said Joseph, who explained that it took one police lieutenant to come to the table, to see the value of participating in the task force and of having good data to inform actions, to bring about a change in attitude among the police departments in the county.
Another result of digging more deeply into data was a change in school disciplinary policies to address disparities in high school graduation rates. In particular, one director of student services at the school with the biggest disparities in graduation rates looked more deeply at the data and proposed changes in school policies that reduced suspensions by 60 percent and expulsions by 40 percent in 1 year. A closer look at youth employment data found that jobs were available but that employers were not hiring area youth because of the way they looked, talked, or dressed. “We need to engage employers differently and engage youth to be good employees and to make sure that those jobs that did exist were accessible to the youth that wanted them,” said Joseph. “Again, there was more to the story behind that initial look at the data that gave us direction.”
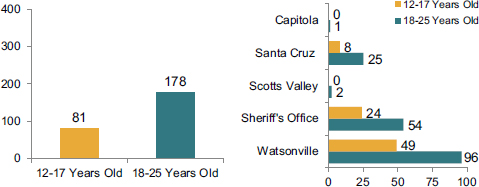
SOURCES: Joseph presentation, July 30, 2015; Santa Cruz County Gang Task Force.
This effort has not been without challenges, said Joseph. Some challenges arose from a lack of accurate, up-to-date, objective data. Some sources, such as the Department of Justice, have difficulty providing timely data. In some cases, methods of data collection varied significantly, making it difficult to compare data on truancy and school discipline, for example, across school districts. One recommendation from the task force calls for an effort to work with school districts to create a uniform system of measurement. Another challenge was a lack of resources to conduct as many deep levels of analysis as desired, particularly with regard to geography and racial and ethnic disparities. “Getting to that level of data is expensive, and we are a small community,” said Joseph.
Some of the self-reported data sources do not always represent everyone in the community, and sometimes stakeholders are unaware of pertinent data sources that could better inform their policy-making activities. “We had a superintendent who did not know the California Healthy Kids Survey existed in her district, and now she does,” said Joseph. “We are proud to be able to engage people in that way and reduce some of those barriers.” Another challenge, and a big “aha” moment for the task force, was the realization that some stakeholders look at the data and still deny a problem exists. In those cases, telling the story behind the data, and not just providing numbers and data sources, has proven particularly important for promoting action.
Today’s biggest challenge, said Joseph, is implementation. Communities are now aware of the data illustrating the problems they face, she said, but the data also reveal the strengths on which these communities can build. After launching the strategic plan in May 2015, the task force started seeking resources to set in motion a prioritized set of strategies at the community level, not at the county level at which this plan was created. “We are now looking at what each jurisdiction, each neighborhood, wants to do,” said Joseph. “We believe everyone has a contribution to make in implementing this plan.” The task force is also seeking resources to deepen its analysis of the disparities and geographies so it can document progress at an incremental level and to evaluate its processes. “It is a challenge to piece together local resources with larger resources that can truly support what is possible with this work,” said Joseph.
MOVING FROM DATA TO ACTION IN A HEALTH SYSTEM3
Dignity Health, explained Michael Bilton, is a large health care system with hospitals in Arizona, California, and Nevada. In fiscal year 2014,
___________________
3 This section is based on the presentation by Michael Bilton, Senior Director of Community Health and Benefit at Dignity Health, and the statements have not been endorsed or verified by the National Academies of Sciences, Engineering, and Medicine.
Dignity Health operated 39 acute care facilities and a wide range of outpatient facilities, employed 55,000 employees, had $10 billion in operating revenue, and provided $1.3 billion in community benefits and absorbed another $674 million in unpaid Medicare costs. He noted that of this $1.3 billion approximately $210 million were funds the system spent other than providing financial assistance to poor patients. Those expenditures paid for proactive community health programs, subsidized health services that Dignity Health supports as a community resource, health research, and education of health professionals. A theme of his presentation, he said, would be considering how to maximize the value of those community benefit funds where the system has greater discretion about how to allocate them, and in particular with regard to population health improvement initiatives. “How do we think about doing that in the most effective way possible? A part of that answer is to focus on population health metrics,” said Bilton.
Dignity Health, explained Bilton, was founded as a faith-based system and employs a number of programs that help address the many facets of community health, including a socially responsible investment program, ecology initiatives, its community benefit and community health improvement programs, a global mission program, and two grants programs. A community grant program, funded by a formula applied to each hospital, supports projects in local communities, and a new social innovation partnership grant program supports collaboration among nonprofit organizations to design innovative ways to address social determinants of health and thereby better serve the health and well-being of their communities.
At Dignity Health, population health is a strategy to manage health not just inside hospitals and care centers, but also outside the walls through education, programs, advocacy, resources, and partnerships. In the health care delivery system context, Bilton said there are two sides to population health. One is the community health needs assessment and community-focused programs side of what a hospital and health system do, while the other side is population health management as it relates to changing reimbursement systems and the advent of accountable care organizations, bundled payments, and the like. He noted that Dignity Health recently hired a new director of community and population health to begin aligning these two sides at both the system and facility level, a key component of its strategy going forward for population health.
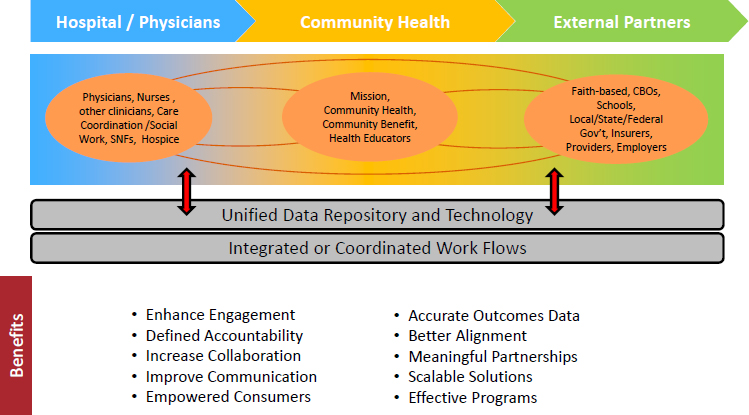
Three components of Dignity Health’s engagement in population health improvement today include physicians and hospitals, community health programs funded by Dignity Health grants and by grants, and work with external partners such as faith-based organizations, schools, and public health agencies, each conducting their own set of activities (see Figure 3-4). Metrics can be found in each of these silos, said Bilton, and there is not much connectivity among these three components, particu-
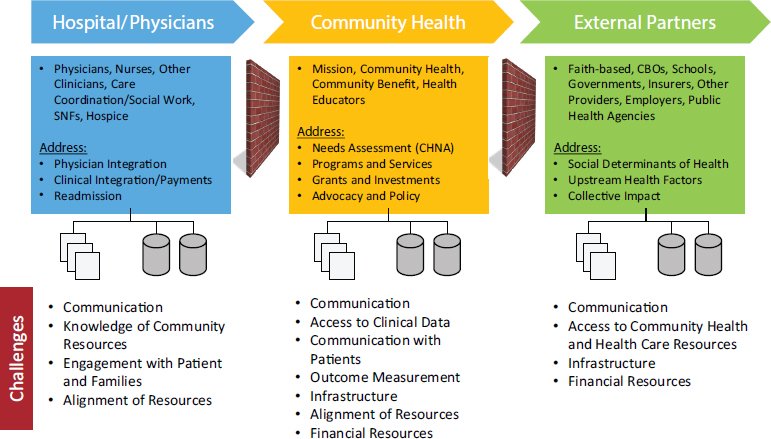
NOTE: CBO = community-based organization; CHNA = community health needs assessment; SNF = skilled nursing facility.
SOURCE: Bilton presentation, July 30, 2015.
larly among the very discrete health outcomes for the people who receive care at Dignity Health and the social determinants that impact patients before they come into the facility and that are being addressed by external partners. The goal, then, is for Dignity Health to use its community health programs as a bridge between these two sides of population health and create a continuum from the care experience to the system’s engagement in its communities (see Figure 3-5). In addition to the new director of community and population health, Dignity Health is creating interdisciplinary teams within its facilities that include care managers and community outreach staff. “Ultimately, this is going to be both a workflow and a data and information technology (IT) infrastructure issue,” said Bilton. “We are going to need relationships in the organization and an IT infrastructure to support them.”
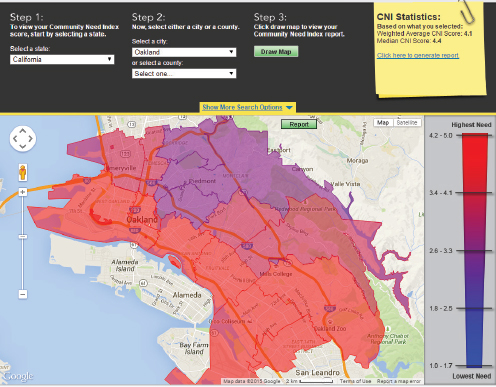
Population health metrics reside in multiple places inside Dignity Health, said Bilton. Like all other nonprofit health systems and hospitals, it conducts Community Health Needs Assessments every 3 years. It also compiles a Community Need Index, which was one of the system’s early forays into thinking about population health from a social determinants perspective, and it has community benefit reports and plans and the data in its health IT systems. Dignity Health created its Community Need Index a decade ago in partnership with Truven Health Analytics. It comprises a set of nine indicators in five areas that include income, culture and language, education, insurance, and housing as determinants of health or barriers to good health. The indicators are updated annually at a zip code level, and Dignity Health makes a mapping tool available free online (see Figure 3-6). It uses this index as a tool for creating needs assessments that it builds into its planning for community health programs and for community and other partner engagement. It also uses the maps as conversation starters to help pinpoint the neediest areas in a community. Bilton stated that today, zip code–level analysis is not local enough in some cases, and the health care system is considering ways to address that limitation.
Dignity Health uses its community and population health metrics to drive implementation strategies. “We need to use these data not only to set goals for ourselves, but as enablers to decide what actions to take and to evaluate those actions,” said Bilton. He noted Joseph’s comment about a lack of resources for data collection, and he said that same lack of resources exists on the evaluation side. He called for more research on how metrics can be used to assess both the scale of program interventions and their impacts, as they relate to changing outcomes at the population level. Priorities for its Community Grants Program are guided using data from the community health needs assessment and applicants must tie their proposals back to priorities and the associated implementation
NOTE: CBO = community-based organization; SNF = skilled nursing facility.
SOURCE: Bilton presentation, July 30, 2015.
SOURCE: Bilton presentation, July 30, 2015.
plans that Dignity Health’s hospitals are required to develop and that are explicitly focused on community metrics.
Population health data also inform Dignity Health’s own grant-seeking activities for building resources to address high-priority needs. To some degree, they also inform Dignity Health’s policy advocacy work that includes a social determinants framework around harmful chemicals, community conditions that do not promote strong health, and community health needs assessment priorities, said Bilton.
He then commented on the ways in which hospitals and health care delivery organizations beyond Dignity Health are beginning to use and incorporate population health metrics into the flow of patient care. For example, hospitals are now looking at the role community factors play in hospital readmission rates (Herrin et al., 2015) and at adjusting risk for socioeconomic and other sociodemographic factors (NQF, 2014). They are also capturing social and behavioral domains and measures in electronic health records (IOM, 2014), a development that will give the nation’s health
care delivery system more intelligence about addressing those needs. More importantly, said Bilton, an increasing number of projects and partnerships are building the capacity to work with social resources so that health care systems can begin to better identify those needs, incorporate them into decision making and care, and then have the capacity to connect people to community assets in new ways.
With regard to making population health metrics relevant, Bilton said it is important to establish a context for their use. For example, having data on mortality and morbidity associated with diabetes, combined with prevention quality indicators and admission rates for preventable conditions in a community, provides a more complete picture for action. Behavioral Risk Factor Surveillance Surveys (BRFSS), he noted, can provide information about behaviors and knowledge that contribute to those factors, as can data on food deserts and locations of fast food restaurants and convenience stores. “If we contextualize our indicators, I think we can build a story to tell,” said Bilton. He added that many indicator reports are filled with dozens of pages of tables and graphs with minimal descriptive or interpretive contextual content. “Those compendia of data are critical and they have a use, but they are more effective as reference documents in my view,” he said.
In his opinion, the field needs to focus more on purpose and build population health dashboards to address the issue of parsimony. He acknowledged that there may be a variety of different dashboards to fit specific purposes—a hospital or health system may have a different dashboard than a public health agency or the United Way—but a dashboard aligned with specific targets would, in his opinion, tell a better story to motivate action. Part of putting metrics into context, said Bilton, is stating them in terms of quantiles or rankings, which can also motivate action. “Data absent context do not motivate most people,” said Bilton.
Another strategy for making metrics relevant, he said, is to relate broad and sometimes abstract indicators to more practical and tangible indicators. As an example, national- or even county-level data taken to the level of neighborhoods and subpopulations can identify specific contributing factors that can enable a set of actions to target those factors and make those actions more relevant to a specific group of people. “If we can demonstrate results for 100 people, or 1,000 people, or 10,000 people at a time, we can begin to make progress,” said Bilton. He also said the evaluation and performance improvement process aspects of population health metrics are also keys to making them relevant for action.
DISCUSSION
Susan Hull from Wellspring Consulting commented on how exciting it is that health care systems are including a minimum dataset on social
and behavioral determinants of health in the electronic health record and on the informatics challenges associated with thinking about those measures in a dynamic, real-time manner that would make them meaningful to the health care provider, patient, family, and neighborhood. She then asked the panelists for suggestions on how to approach that informatics challenge and if they had any ideas on how care might change as a result of having that information. One way that care would change, said Bilton, is by creating new relationships among the care providers, care coordinators, and community health staff. As an example, he said that a care manager at Dignity Health today may have knowledge of and access to some community resources, and is likely screening for some social determinants of health, but may not have the same relationship with community resources that the community health staff has.
Bilton noted that a regional care coordinator at Dignity Health recently asked him for the community health needs assessments and implementation plans for some of the system’s hospitals, a sign that these new relationships are starting to affect the way in which health care’s role is being understood. “We are beginning to build that sort of awareness as we continue to talk about population health improvement,” said Bilton, who added that providing informatics tools will only help to accelerate the awareness of the importance of population health factors in improving health. He also raised the importance of including population health in professional education curricula.
A workshop participant raised the point that health care systems may be working toward connecting people to social resources, but in many cases the necessary social resources are not present in a community. Bilton replied that many health care systems are aware of this problem and are seeking to address it by providing grants and making investments in community resources. He added that he believes health care systems can play a role in advocating for expansion of community services, and he wondered if new payment models and new definitions of the continuum of care will enable wrapping community services into reimbursable care. What will be needed to enable that to occur is evidence that demonstrates the effectiveness of those community services with regard to improving population health and data systems to support managing and coordinating those services.
Jean McGuire from Northeastern University asked Bilton if he had an idea which community health metrics would matter in terms of informing investment strategies in upstream services. Bilton replied that he and his colleagues at Dignity Health have started to think about those metrics but do not yet have a specific set in mind. He cited one example, not specific to Dignity Health, of a letter sent by the AHA to the Internal Revenue Service about the idea of counting support of stable housing as a com-
munity benefit for hospital reporting purposes. The key here, he said, was the wealth of research-based evidence showing that stable housing has a beneficial impact on health. “I would look for those places where there is evidence of a connection between a social and environmental condition, health status, and health care seeking behavior,” said Bilton, citing asthma as a great example in which there is strong evidence identifying the environmental triggers that are place-specific.
Veronica Shepherd asked Joseph to comment on the mechanisms that her organization uses to create pathways to economic sustainability for community youth at risk of engaging in violent behavior and ending up in the justice system. One step that the task force has taken, said Joseph, has been to open summer jobs programs to youth who previously were not eligible because they did not meet grade point average and other requirements and then provide them with the supports and skills needed to meet employer demands. Toward this end, the program’s Community Action Board is working with local Chambers of Commerce to educate employers about the benefits of working with this particular youth population. She noted that the Chambers have a Jails to Jobs initiative that starts in jail and connects youth to employers. Santa Cruz County is also following the lead of Alameda County’s A Good Hire program that helps address employers’ concerns—mostly myths, she said—about hiring someone with a criminal record.


