
4
Measurement and Health Equity
In introducing the workshop’s third panel on metrics for identifying disparities and inequities in health care, David Kindig said that population health has two goals—raising the average level of the nation’s health and reducing the health equity gap—yet in his view, the metrics community spends more time developing measures for the mean and less time on measuring disparities and equity. “Of course, you are not going to improve the mean if you do not reduce the gaps,” said Kindig.
This panel featured three presentations; highlights are provided in Box 4-1. Session moderator Steven Woolf, Director of the Center on Society and Health and Professor of Family Medicine and Population Health at Virginia Commonwealth University, provided a short introduction to
the subject of measuring health inequity. Thomas LaVeist, Professor and Director of the Johns Hopkins Center for Health Disparities Solutions at the Johns Hopkins Bloomberg School of Public Health, discussed some of the challenges of using metrics to describe population health inequities, and Sarah Treuhaft, Director of Equitable Growth Initiatives at PolicyLink, spoke about the National Equity Atlas as a tool for building an equitable economy.
MEASURING HEALTH DISPARITIES1
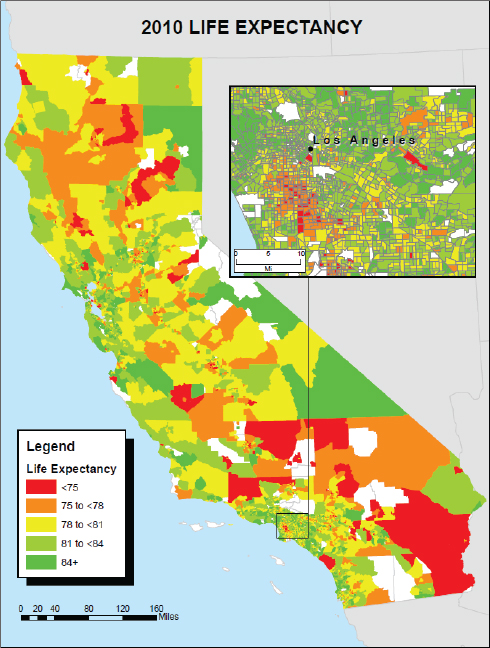
The subject of how to measure health inequity has existed for a long time, said Steven Woolf (Satcher et al., 2005), who noted that there is still a debate about how to define equity, equality, equal opportunity, and justice. There are also methodological questions, he added, about how best to measure health inequity to correctly reflect how health is shaped by sex, race, ethnicity, or cultural background, as well as by social determinants such as income and poverty. How metrics are presented so that they communicate to the public is also important. For example, he said life expectancy is a crude metric for much more complicated health outcomes, but his experience has shown that simple maps showing geographic disparities in life expectancy (see Figure 4-1) resonate deeply with the public. There was extensive media coverage when his group released life expectancy maps for Atlanta, Chicago, New York City, and Richmond, Virginia. The New York Times asked for the source data and produced an interactive graphic on its website2 to enlighten its readership about how life expectancy varies by neighborhood (Tavernise and Sun, 2015).
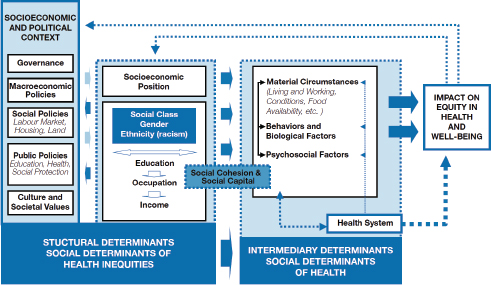
Given that health inequities are pervasive in the United States and widely acknowledged, the challenge is to identify what causes them, and purposeful metrics should provide knowledge for understanding the root causes of these disparities, said Woolf. The County Health Rankings and Roadmaps model provides one view of the different domains of health, but the conceptual model of the World Health Organization (WHO, 2010) shows the complexity of the linkages between these domains (see Figure 4-2). From an analytic perspective, said Woolf, thinking about measuring the drivers of health inequity requires think-
___________________
1 This section is based on remarks from Steven Woolf, Director of the Center on Society and Health and Professor of Family Medicine and Population Health at Virginia Commonwealth University, and the statements have not been endorsed or verified by the National Academies of Sciences, Engineering, and Medicine.
2 See http://www.nytimes.com/interactive/2015/04/29/health/life-expectancy-nyc-chiatl-richmond.html?_r=0 (accessed February 8, 2016)
SOURCE: Woolf presentation, July 30, 2015.
SOURCES: Woolf presentation, July 30, 2015; WHO, 2010.
ing about equity across these specific domains. For example, health disparities across neighborhoods exist for a variety of reasons, including
- education and income;
- unsafe or unhealthy housing;
- stores and restaurants selling unhealthy food;
- limited opportunities for residents to exercise, walk, or cycle;
- proximity to highways, factories, or other sources of toxic agents;
- limited access to primary care doctors and good hospitals;
- unreliable or expensive public transit that isolates residents from good jobs, health and child care, and social services; and
- residential segregation and features that isolate communities.
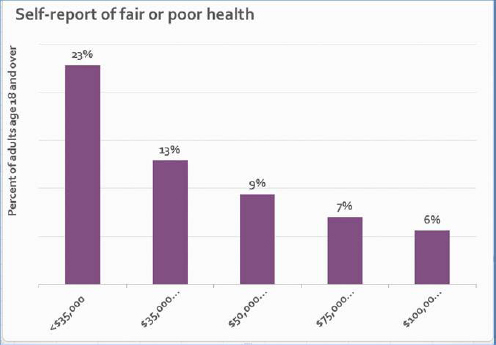
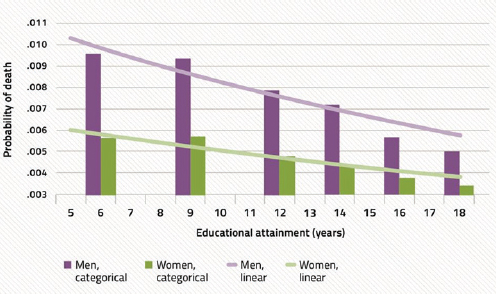
After noting that two of the better known social determinants of health are income (see Figure 4-3) and education (see Figure 4-4), Woolf described an analysis he and his colleagues conducted showing the number of lives that would be saved if every American had the mortality rate of those with some college education (see Figure 4-5). The goal of this analysis, he said, was to give the public a sense of the magnitude of these root causes.
Increasingly, said Woolf, the conversation about health disparities is turning to the role of place. “It is not just the classic social determinants of health that exist in people’s households or in their personal lives, but
SOURCE: Woolf presentation, July 30, 2015.
SOURCES: Woolf presentation, July 30, 2015; Ross et al., 2012.
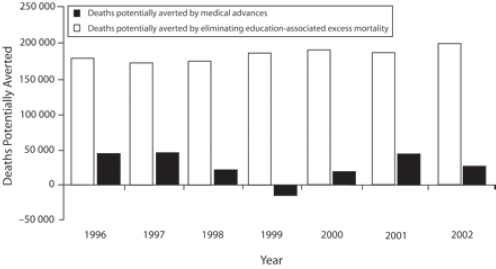
SOURCES: Woolf presentation, July 30, 2015; Woolf et al., 2007.
the measurement of equity requires [greater emphasis] on understanding place and its influence on health outcome,” he explained. “We are coming to appreciate more how place shapes opportunity.” He noted that the public health community is used to thinking about the connection between place and health and talking about including health in all policies, but it is opportunity and wellbeing more generally—not just health—that resonates more broadly with policy akers. Place matters to opportunity at a more fundamental level. To illustrate this, he used a tree as an analogy, with the trunk of the tree representing opportunity and the branches representing health, crime, social services, the environment, jobs, and other outcomes. Woolf used this analogy to suggest that this group think more holistically about the metrics for understanding equity. “Maybe the question is less about how we in the health field measure health inequity and more about how we as a society measure inequity in general.” He advocated core measures of inequity in opportunity, along with metrics of the manifestations of inequity in various domains—health among them.
Another important factor, he said, is to remember the historical context when measuring inequity. For example, Woolf and his colleagues looked at factors that shape health disparities in various neighborhoods of Baltimore and examined the issue of redlining, a set of housing policies from the 1930s that cast the die for neighborhoods in Baltimore mired in a cycle of persistent poverty, disadvantage, and unemployment (Evans et al., 2012). The areas highlighted in the redlining map were the same neighborhoods struggling today with problems of violence, socio-
economic disadvantage, and poor health outcomes. The recent civil unrest that occurred in Baltimore took place in those same neighborhoods. He noted that unrest in places such as Ferguson, Missouri, and Baltimore is creating a growing public awareness of the inequality that exists simply because people are born in or mired in the wrong geography.
The larger point, he said, is that health outcomes and health inequities are shaped by a complex set of factors. In addition to the temporal and longitudinal analyses that earlier speakers had noted were important, the field should also think about metrics that account for the factors across the life course of individuals. He cited the fatal arrest of Freddie Gray, which sparked the riots in Baltimore. Gray’s problems did not begin with his arrest, said Woolf. Rather, they started when he was an infant living in a dilapidated house contaminated by peeling lead-based paint, Woolf noted. Lead poisoning later contributed to his behavioral problems during childhood and ultimately to his arrest. “Understanding this larger ecological context from the life course perspective will help us think about how to measure inequality in a way that measures those kinds of temporal patterns,” said Woolf. A better understanding of adverse childhood experiences and their effects on health throughout life will require new metrics, he added.
This is not just an inner city problem, as Woolf illustrated with data from the County Health Rankings showing worse health outcomes in eastern Kentucky (see Figure 4-6). Very poor health outcomes, as well as
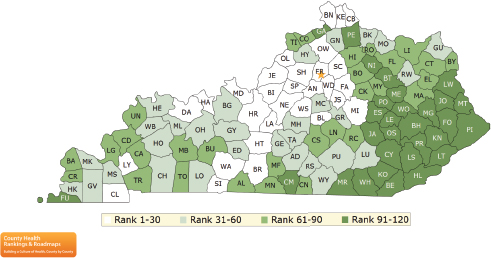
SOURCE: Woolf presentation, July 30, 2015.
persistent poverty and other social disadvantages, occur in coal fields that were once vibrant in earlier generations, he said. “Increasingly, we have to become sociologists and political scientists to understand that today’s economic conditions exist because of policy and economic choices made years ago about the coal industry that set into motion this pattern,” said Woolf. “If we are going to close the gap, then we need to have policies addressing that history.”
In closing, Woolf reiterated Steven Teutsch’s recommendation to develop a logic model that identifies which factors are responsible for driving health inequities. “Such a logic model can help in establishing indicators and metrics for setting policy priorities. We can see how far we are getting in addressing the root causes that the logic model tells us are responsible for our outcomes,” said Woolf.
DESCRIBING POPULATION HEALTH INEQUITIES3
There is a small but growing body of literature, said Thomas LaVeist, on the creation of indices of health equity (Harper et al., 2008, 2009, 2010). But as Woolf said previously, it is important to define terms such as equity, equality, and disparities before going too far down the road of metrics development. “If we are to create a purpose, a goal for metrics, it is important for us to think about what we mean by these terms and what we are trying to accomplish,” said LaVeist. “Are we looking for equality or are we looking for inequities? Both are valuable and valid goals, but they are not the same goal.” As an example, he discussed a study he conducted that identified racially integrated communities around the country that did not have disparities by race and socioeconomic status as measured by high school graduation rates and median income. One of those communities was in southwest Baltimore and there were, in fact, no disparities in health status by race because both African Americans and whites were experiencing the same high rates of adverse health events. “Race is not protective if you live in an environment that is going to produce bad health outcomes,” said LaVeist. Equity was not the problem in this community, he added, disparity was. He also mentioned in passing that there is a small and growing literature on the creation of indexes that are conceptually similar to GDP, which as Rajiv Bhatia had mentioned earlier, has a huge engine behind it and is an index that has meaning to most people.
___________________
3 This section is based on the presentation by Thomas LaVeist, Professor and Director of the Johns Hopkins Center for Health Disparities Solutions at the Johns Hopkins Bloomberg School of Public Health, and the statements have not been endorsed or verified by the National Academies of Sciences, Engineering, and Medicine.
Before turning to the subject of his presentation—a description of how metrics can be used to understand inequalities and some of the pitfalls involved in doing so—LaVeist noted that the National Cancer Institute (NCI) has created software that is free and available on its website for calculating health disparities (NCI, 2013). It was originally developed, he explained, to analyze data from NCI’s Surveillance, Epidemiology, and End Results (SEER) Program, but the program can import other datasets as well. He said he has used this program a bit and found it to be robust and interesting.
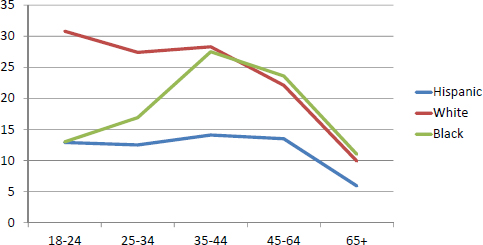
Age-adjusted mortality rates by race, ethnicity, and gender (see Figure 4-7) have fallen over the years, but the relative rates have remained unchanged, said LaVeist, who noted there are limits to simply comparing rates among different groups. For example, the prevalence of smokers shows little difference between African American and white males, suggesting that there is not an equity problem with respect to smoking. However, plotting smoking prevalence by age and race (see Figure 4-8) reveals several patterns that LaVeist explained have implications for how interventions are planned and where resources are devoted. This analysis shows that smoking rates are much higher among whites compared to African Americans and Latinos during the teenage years, but that while the rate among whites declines over time, the rate among African Americans and Latinos, and particularly among the former, rises into adulthood. A similar pattern is seen among women (see Figure 4-9).
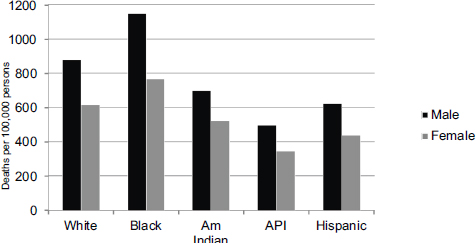
NOTE: Am Indian = American Indian; API = Asian or Pacific Islander.
SOURCES: LaVeist presentation, July 30, 2015; U.S. National Center for Health Statistics, 2011.
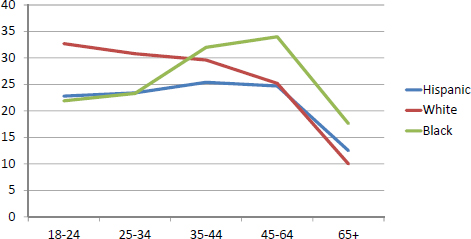
NOTE: x-axis = age; y-axis = percent of persons who were current smokers.
SOURCES: LaVeist presentation, July 30, 2015; U.S. National Center for Health Statistics, 2003.
NOTE: x-axis = age; y-axis = percent of persons who were current smokers.
SOURCES: LaVeist presentation, July 30, 2015; U.S. National Center for Health Statistics, 2003.
What this analysis suggests is that are different mechanisms triggering tobacco use among different ethnic groups. For white teens, smoking is youthful experimentation that begins to decline as they move into adulthood, while LaVeist suspects that among Latinos, and even more so among African Americans, smoking is a coping mechanism in response to stress. “If we are going to craft messages to prevent smoking and to implore people to stop smoking, we would take different strategies and target people at different points in the life course,” said LaVeist. Typically, he added, smoking prevention efforts focus on teenagers.
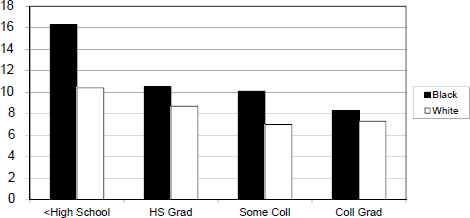
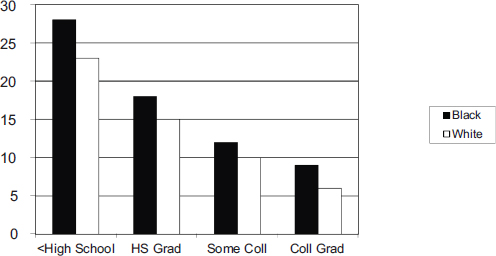
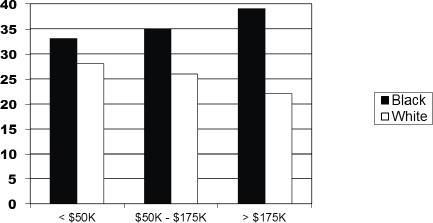
Another issue to consider, said LaVeist, is social position or socioeconomic status. An analysis of a variety of health outcomes shows a similar pattern in which as education increases, the absolute rate of adverse health outcome decreases, with absolute rates among African Americans being higher than for whites (see Figures 4-10 and 4-11). Similarly, looking at health outcomes as a function of income shows that for most disorders, increasing income decreases risk (see Figure 4-12), with the exception being hypertension. White Americans, said LaVeist, show the typical pattern of increasing levels of income leading to decreased risk of hypertension, but African Americans show the opposite pattern (see Figure 4-13). “The underlying phenomenon is different, and by simply calculating rates, we mask this difference,” said LaVeist.
NOTE: x-axis = education level; y-axis = percent of persons with diabetes; Coll = college; HS = high school.
SOURCES: LaVeist presentation, July 30, 2015; original analysis of data from 2005 National Health Interview Survey.
NOTE: x-axis = education level; y-axis = percentages of persons self-reporting “fair” or “poor” health; Coll = college; HS = high school.
SOURCES: LaVeist presentation, July 30, 2015; original analysis of data from 2005 National Health Interview Survey.
NOTE: x-axis = income level; y-axis = percentage self-rating health as “very good” or “excellent.”
SOURCES: LaVeist presentation, July 30, 2015; original analysis of 2003-2008 Medical Expenditure Panel Survey.
NOTE: x-axis = income level; y-axis = percent with hypertension diagnosis.
SOURCES: LaVeist presentation, July 30, 2015; original analysis of 2003-2008 Medical Expenditure Panel Survey.
One solution often used to deal with this kind of issue is to use multivariate modeling or regression modeling, LaVeist said, but that regression modeling alone is not good enough. As an example, he used data from the 2005 National Health Interview Survey on all adults age 40 or older, of which there were more than 33,000 people (see Box 4-2). A simple analysis comparing African Americans and whites having at least one activity of daily living (ADL) limitation and falling in one of three income categories shows that the odds ratio declines as income increases. The bivariate relationship between race and ADL limitation yields an odds ratio of 1.46, leading to the conclusion that African Americans have a 46 percent greater odds of having at least one ADL limitation compared to whites. A similar calculation for ADL regressed on income shows the odds ratio declining as income increases. However, said LaVeist, putting income and race together in a multivariate regression yields a different result. In the lowest income category, there is a small, but statistically significant difference between African Americans and whites. Also at higher income levels, the number of African Americans with at least one ADL limitation is so small that the results are not statistically significant (see Table 4-1). LaVeist noted that the National Health Interview Survey is one of the largest datasets available, yet it does not permit even this simple analysis. “How many papers have you read on race disparities with smaller datasets and much more complex analyses?” asked LaVeist, who admitted publishing such papers himself. “Simple regression models do not solve this problem.”
TABLE 4-1 Cross-Tabulation of Race and Activities of Daily Living Within Income Groupings
| White | Black | Total | P-Value | |
|---|---|---|---|---|
| <$20K | 6.1% | 7.6% | 6.4% | .031 |
| e = 304 | e = 97 | e = 401 | ||
| $20K-$75K | 2.1% | 2.1% | 2.1% | .50 |
| e = 343 | e = 45 | e = 388 | ||
| >$75K | 1.0% | 1.7% | 1.0% | .10 |
| e = 56 | e = 8 | e = 64 |
SOURCES: LaVeist presentation, July 30, 2015; analysis of data from 2005 National Health Interview Survey.
One of the biggest issues with addressing race disparities, LaVeist explained, is racial residential segregation and the fact that races live in the country together, but experience the country differently because the risk environment is so different. Plotting all U.S. cities with a population of 100,000 or more by the Index of Dissimilarity, an index used to measure the degree to which census tracts in the city are racially integrated, shows that the average score in 2010 comparing African Americans and whites was 0.57, or 57 percent segregated, with a large spread, showing the dramatic variation across cities in terms of how segregated they are (see Figure 4-14) that would be missed by looking simply at the mean value. The same plot for Hispanics and whites shows a similar pattern, with a mean score of 0.48 in 2010 (see Figure 4-15).
LaVeist then addressed the common and problematic misuse of risk ratios, particularly when looking at trend data. To illustrate this problem, he used a hypothetical example of a statistic revealing a race difference of 50 deaths per 1,000 that falls by 10 deaths per 1,000 for both racial groups
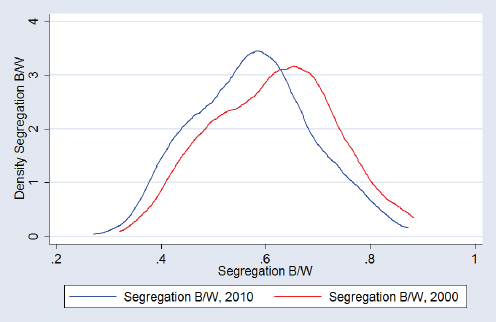
SOURCES: LaVeist presentation, July 30, 2015; data from U.S. Census, 2000 and 2010.
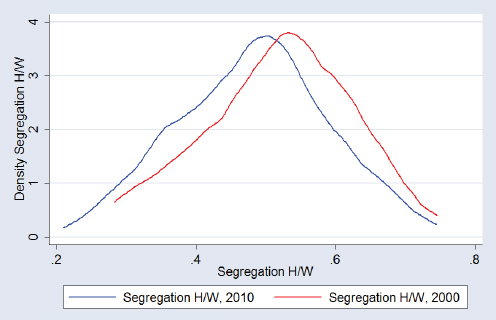
SOURCES: LaVeist presentation, July 30, 2015; data from U.S. Census, 2000 and 2010.
every 5 years (see Table 4-2). Reliance only on the ratio of rates would lead to the conclusion that the disparity has increased dramatically over time, even with equal improvement for both racial groups. “This is what happens when we try to use a rate ratio to try to look at trend data,” said LaVeist. “This is something that we must stop doing without providing the full context of the absolute difference in addition to the relative difference.”
As he had noted earlier, some indexes are available for expressing inequality, and each uses what LaVeist said are unsuccessful approaches for addressing the problems he raised. Relative risk indexes, as he showed, are not ideal for trend analysis. The Theil Index, which calculates variance relative to the population average, suffers from the problem that population averages are also dynamic. An alternative approach that he suggested, one that he has found effective with policy makers because it is intuitive, is to look at excess deaths. Given that Asian Americans have the lowest death rate, it is possible to calculate how many fewer deaths would have occurred if every other racial or ethnic group had the same death rate as Asian Americans (see Figure 4-16). A more accurate picture of disparities, said LaVeist, is obtained by plotting the percentage of excess deaths relative to Asian Americans (see Figure 4-17).
Another approach LaVeist has found effective moves away from health metrics entirely and instead calculates the economic impact of health inequalities. An analysis he and his colleagues conducted (LaVeist et al., 2009) that looked at the cost of premature death, use of direct medical care, and the indirect cost to the economy of lost productivity, showed that between 2003 and 2006, eliminating disparities could have reduced direct medical care expenditures by $229.4 billion and the total economic cost was $1.24 trillion over that 4-year period.
LaVeist concluded his presentation by describing the documentary film he is creating on African American health as part of a large community engagement program. “When you talk to people in communities, it is difficult to talk about these statistics in ways that they really understand,”
TABLE 4-2 A Hypothetical Example of Increasing Risk Ratios
| Year | 1960 | 1965 | 1970 | 1975 | 1980 | 1985 | 1990 | 1995 | 2000 | 2005 |
|---|---|---|---|---|---|---|---|---|---|---|
| Black | 150 | 140 | 130 | 120 | 110 | 100 | 90 | 80 | 70 | 60 |
| White | 100 | 90 | 80 | 70 | 60 | 50 | 40 | 30 | 20 | 10 |
| Diff | 50 | 50 | 50 | 50 | 50 | 50 | 50 | 50 | 50 | 50 |
| Ratio | 1.5 | 1.55 | 1.65 | 1.71 | 1.83 | 2 | 2.25 | 2.67 | 3.5 | 6.0 |
NOTE: Diff = Difference.
SOURCE: LaVeist presentation, July 30, 2015.
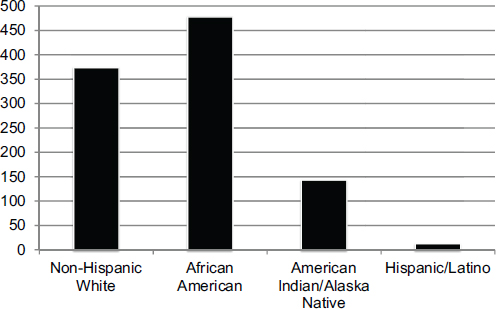
SOURCES: LaVeist presentation, July 30, 2015; U.S. National Center for Health Statistics, 2011.
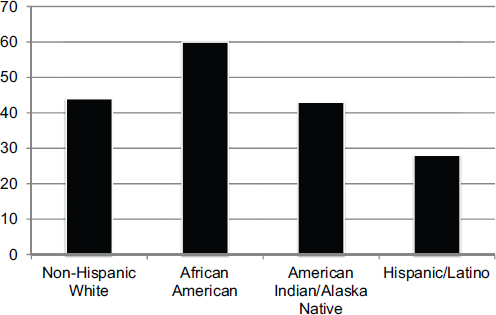
SOURCES: LaVeist presentation, July 30, 2015; U.S. National Center for Health Statistics, 2011.
he explained. The statistic he uses most frequently when talking to the general public is life expectancy, and the key number here is 4 to 6 years, the disparity between white and African Americans in life expectancy. The way he is framing this statistic for the documentary is to have people react to the question, “What could you do with 6 additional years of life?” In one case, he posed that question to a woman in a wheelchair from the Brownsville neighborhood in Brooklyn, which has the lowest life expectancy in New York and was his neighborhood growing up. Her response was, “In 6 years there could be a cure.”
THE NATIONAL EQUITY ATLAS4
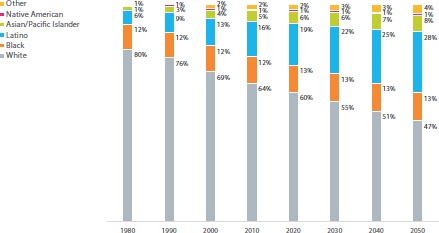
PolicyLink, explained Sarah Treuhaft, is a national research and action institute whose mission is to advance economic and social equity. That mission led PolicyLink to partner with the Program for Environmental and Regional Equity (PERE) at the University of Southern California to develop a National Equity Atlas (PolicyLink, 2014) as a data and policy tool for making the case for equity and changing the narrative on how to create a more equitable society. The narrative that PolicyLink is trying to create, laid out in a paper Treuhaft and her colleagues published in 2011 (Treuhaft et al., 2011), is one in which equity is seen as a superior growth model for the economy. That paper made the case that as America’s demographics shift to one that will have people of color as the majority of its population (see Figure 4-18), equity becomes an economic as much as a moral imperative for the nation as a whole.5
To illustrate this imperative, Treuhaft recounted a visit she made to a community center in the Gulfton neighborhood of Houston, a city which vies with Oakland for being the most diverse city in the United States. Gulfton is the city’s densest neighborhood and is home to a diverse community of immigrant, African American, and white residents. The children at this community center all wore bright jerseys with a number on the back denoting the years in which those children would graduate from college. “These are school children in a neighborhood that has a 40 percent poverty level and a third of the children will drop out of school, yet they had these aspirations and were in a program that was helping them get there,” said Treuhaft. “This is our future. Our future looks like this neighborhood, and equity is about enabling those children and people
___________________
4 This section is based on the presentation by Sarah Treuhaft, Director of Equitable Growth Initiatives at PolicyLink, and the statements have not been endorsed or verified by the National Academies of Sciences, Engineering, and Medicine.
5 Due to the tight schedule, this panel was not followed by a discussion period, but the closing discussion offered opportunities for questions and comments about this panel, along with the others.
SOURCES: Treuhaft presentation, July 30, 2015; data from U.S. Census Bureau, 2012 and 2013.
like them, as well as adult members of their community, to achieve their goals and reach their full potential.”
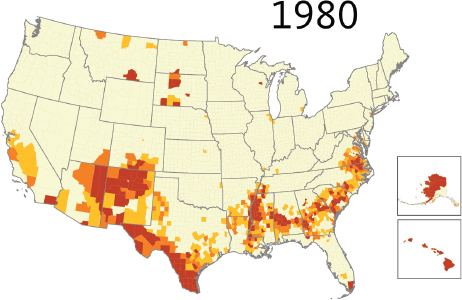
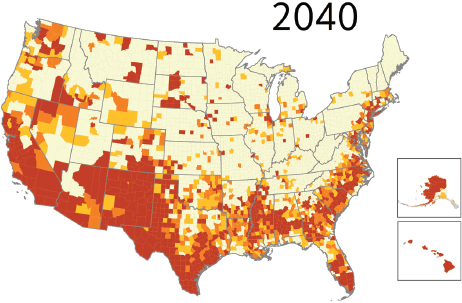
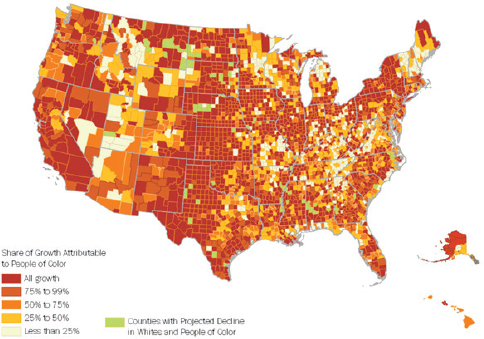
PolicyLink, explained Treuhaft, believes in the power of data to start conversations, measure and track change, and advance this narrative about the importance of equity and inclusion. The data, she said, illustrate the demographic change that the nation is undergoing, both in terms of the percentage of the population that people of color will represent (see Figures 4-19 and 4-20) and the share of population growth (see Figure 4-21). Growth projections, she said, show that even in parts of the country that will still be predominantly white in coming decades, people of color will account for most of the growth in these areas. This change is creating a dynamic in which the senior population will leave the workforce and become more dependent on the growing population of people of color who will be the next generation of workers. “The demographics show that the contributions of every new worker are going to be increasingly important to the community as a whole because the burden of caring for the elders is going to be shifting onto them,” said Treuhaft.
These demographic changes are not just about the future, however. Of the nation’s 100 largest cities, 65 already have a majority population of people of color. The majority of the babies being born in the United States are children of color, as are the majority of children under age 5 and the majority of youth in public schools. “A large part of our framing is around the barriers that these children face to reaching their potential, and the fact that we are leaving valuable human capital on the table,” said Treuhaft.
SOURCES: Treuhaft presentation, July 30, 2015; PolicyLink and the Program for Environmental and Regional Equity (PERE).
SOURCES: Treuhaft presentation, July 30, 2015; PolicyLink and PERE.
SOURCES: Treuhaft presentation, July 30, 2015; PolicyLink and PERE.
The narrative that PolicyLink is promoting is informed by research that supports a new consensus within the field of economics highlighting the risk of rising inequality to the nation’s economic prosperity, said Treuhaft. She noted a recently released study from the International Monetary Fund examining the rise in inequality across nations and finding that it hinders sustained growth and prosperity (Dabla-Norris et al., 2015). Studies from the Organisation for Economic Co-operation and Development (Cingano, 2014) and others support this finding as well. She also mentioned research by PolicyLink and PERE showing how much stronger the economies of U.S. cities would be if the racial income gap was closed (see Figure 4-22). These gaps, she explained, are a function of differences in hours worked and differences in wages. Summed across the nation, they project that the increase in GDP from eliminating racial economic disparities would be $2.1 trillion annually.
One focus of the National Equity Atlas is to help tailor PolicyLink’s framing to regions. PolicyLink, Treuhaft explained, defines an equitable region as one in which all residents—regardless of their race/ethnicity and nativity, gender, family income, or neighborhood of residence—are
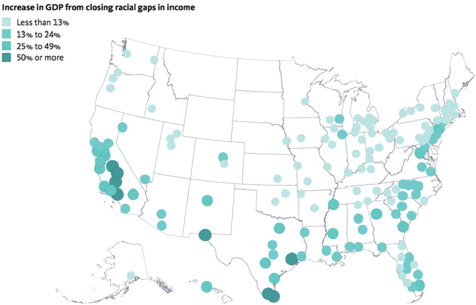
NOTE: GDP = Gross Domestic Product.
SOURCE: Treuhaft presentation, July 30, 2015.
fully able to participate in the region’s economic vitality, contribute to the region’s readiness for the future, and connect to the region’s assets and resources. From the definition, Treuhaft and her colleagues developed a framework with three characteristics that is used to prepare regional equity profiles:
- Economic vitality—are all of a region’s residents able to contribute to the region’s economy?
- Readiness—is the region ready with the workforce and human capital needed for the future?
- Connectedness—are all of the region’s residents connected to the region’s assets and resources?
In addition to examining these three components, the framework looks at demographic shifts. “We found that demographic change can be an effective way to start a conversation around disparities and inequities,” said Treuhaft. “Conversations around race are hard, but the demographic shifts provide an entrée because people can see it happening in their communities.” She explained that the human capital component of readi-
ness includes education levels and health equity, and that connectedness includes housing, transportation, and neighborhood poverty.
The database powering the Atlas was built for the 150 largest metropolitan regions in the United States (see Figure 4-23), plus all 50 states and the District of Columbia, and the United States as a whole. In October 2015, the PolicyLink and PERE team added data on the 100 largest cities to the Atlas. The data sources included the Integrated Public Use Microdata Series, U.S. Census Bureau, Geolytics, BRFSS, Bureau of Economic Analysis, and Bureau of Labor Statistics. Treuhaft noted that although the Atlas provides some unique data, one of its functions is to make disaggregated Census data more easily accessible because many advocates and policy makers do not find the Census Bureau’s FactFinder tool easy to use. With funding from the HUD Sustainable Communities Initiative, she and her colleagues were able to work with 12 regions to develop detailed equity profiles. These regions were selected based on their interest in and willingness to develop these profiles and use the study to inform regional collaboration and policy strategies. The process, she explained, started with PolicyLink and PERE providing data looking at equity in a region and getting feedback from that region, which would also provide local data. Regional participants would then help Treuhaft and her team interpret the data and produce a story that was useful to the regions in helping them move forward their advocacy efforts. She noted the importance of the col-
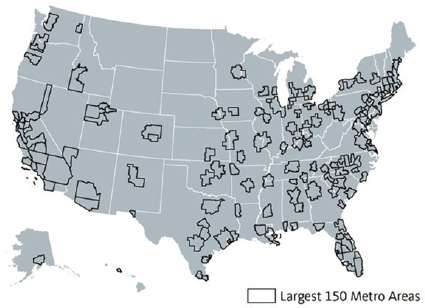
SOURCES: Treuhaft presentation, July 30, 2015; Ruggles et al., 2015.
laborations among city and suburban officials as well as representatives of different political persuasions, different community sectors, and civil rights organizations that were fostered by this activity and required as part of the HUD grant.
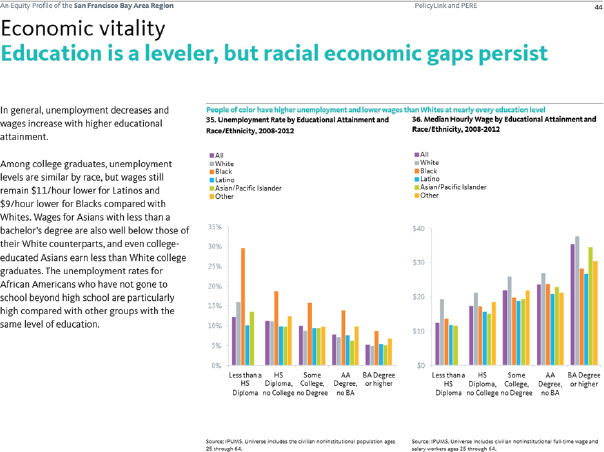
Treuhaft showed an example of a data profile and commentary (see Figure 4-24), and while she did not discuss in depth what goes into these profiles, she noted that they are based on some 100 indicators disaggregated to the maximum extent possible by race, ethnicity, nativity, income, and gender. She also described some lessons learned regarding disaggregation. For example, in southeast Florida, it was necessary to disaggregate data to reflect the large black immigrant population there, while in Detroit, the large Middle Eastern population was not reflected in any of the normal census categories.
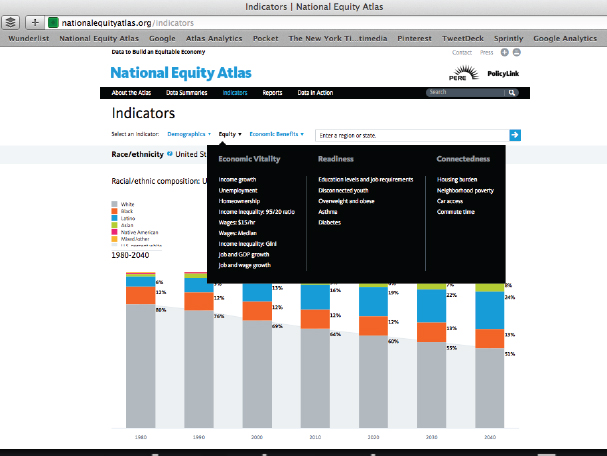
The National Equity Atlas website, explained Treuhaft, embeds the central narrative and the indicator framework, and it attempts to democratize data and make them more broadly available and ready to use in policy contexts. The homepage focuses on the framing around demographic change, the threat of inequities, and the benefits of investing in equity. She provided a snapshot of the indicators (see Figure 4-25) and noted that they are arrayed in the three categories that form the messaging and profile framework. In creating these Web pages, Treuhaft and her colleagues focused on data visualization in the form of useful charts, maps, and graphics that people share and use to start discussions around equity. The Atlas also provides what Treuhaft called “wraparound supports” to help people interpret these data. She explained that the goal is to provide people with information for understanding how to look at the data, interpret it, and understand how it matters and connects to the goal of inclusive growth. The Atlas also provides examples of the types of policy strategies that regions can use to make progress on these indicators and examples of community successes.
She then discussed several examples of how people are using these and similar data to inform their strategies. The mayor of Minneapolis, said Treuhaft, campaigned on the message that racial inclusion is key to the city’s and region’s growth and prosperity. Oakland, California, just created an Office of Equity, and in Rhode Island, the governor used the state’s profile as the impetus to launch a new initiative focused on diversity, equity, and inclusion and created a new office to promote minority contracting and equity in hiring within the state government. The mayor of New Orleans has started a new effort called the Economic Prosperity Strategy, crafted with assistance from PolicyLink and others, after seeing local data showing that 52 percent of the city’s African American males were jobless. One aspect of this strategy brings together the city’s anchor institutions—its hospitals and education centers—that are planning on
SOURCE: Treuhaft presentation, July 30, 2015.
SOURCE: Treuhaft presentation, July 30, 2015.
adding some 30,000 jobs over the next several years and connects them to this large unemployed male population.
Dubuque, Iowa, a smaller city of approximately 60,000 people not included in the Atlas, is using the National Equity Atlas framework and data profiles to conduct its own community dialog and create its own community equity profile. Treuhaft explained that while Dubuque’s residents are predominantly white, IBM has a facility there that brings higher skilled immigrants into the community, and there is a growing population of African Americans moving from Chicago who are of lower income and living in Section 8 housing. “They are using this process of looking at the data to think about how to include everyone in the local economy,” said Treuhaft. PolicyLink is also using these data in its own advocacy work, such as its efforts, through the Alliance for Boys and Men of Color, to reform harsh school discipline practices and expand economic opportunities for men and boys of color in California. Atlas data are also being used to inform data-driven journalism, such as a series on educational achievement gaps from the National Journal.
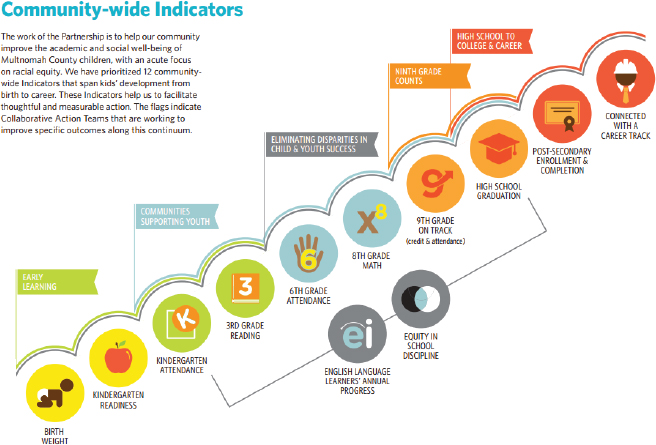
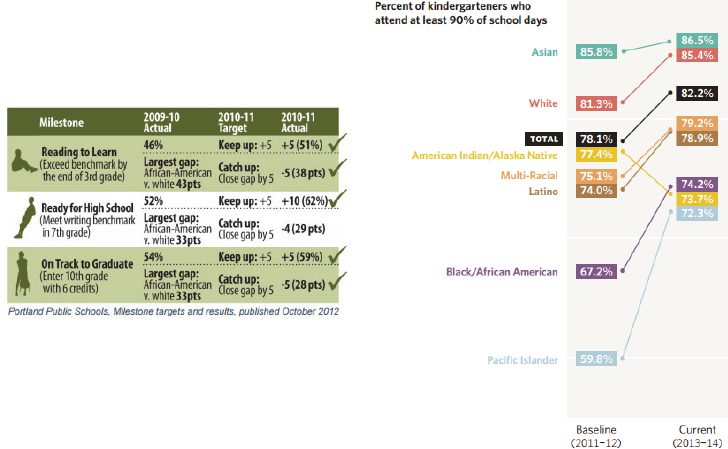
Treuhaft concluded her presentation with an example of how data can inform strategies that promote continuous improvement. Multnomah County’s Cradle-to-Career Effort, spearheaded by the All Hands Raised Partnership, follows a series of benchmarks and milestones children need to meet to be on the path to careers (see Figure 4-26). This effort is creating a system that can regularly gather local data and disaggregate it by race to track how the county’s children are doing on these milestones (see Figure 4-27). Treuhaft says her team plans to continue to develop the National Equity Atlas to support efforts to advance equitable growth.
SOURCE: Treuhaft presentation, July 30, 2015.
SOURCE: Treuhaft presentation, July 30, 2015.
This page intentionally left blank.


