
2
The STEM Workforce Landscape
To set the stage for the remainder of the day’s discussions and provide background on the state of science, technology, engineering, and mathematics (STEM) education and the U.S. STEM-capable workforce, the workshop featured three formal presentations prior to the first panel discussion. Rush Holt, chief executive officer of the American Association for the Advancement of Science (AAAS), spoke about the importance of revamping the way science is taught in U.S. schools and universities to reflect advances in science education and make science more appealing to all of the U.S. population, not just science majors. Next, Kelvin Droegemeier, vice chair of the National Science Board (NSB), chair of the NSB Science and Engineering Indicators Committee, and vice president for research at the University of Oklahoma, described findings from the NSB’s study on the state of the STEM workforce. Irwin Kirsch, director of the Center for Global Assessment at the Educational Testing Service (ETS), then reviewed data from the Organization for Economic Cooperation and Development (OECD) showing how U.S. adults compare to those from other countries on STEM skills.
MODELING WHAT WE TEACH
The central message of Holt’s presentation was that science educators should model what they want to teach at all levels of the educational system, and he presented a list of what that modeling should include. “The first thing I would argue we want to teach, at all levels of science education, is that what we as scientists do is grounded in evidence,” said Holt. “We must teach a respect for evidence, a delight in evidence, a comfort with
evidence, a facility for evaluating evidence, and a demand that everyone who talks with us about scientific matters should talk about their pursuit of evidence.” That this is not currently a key focus of science education in the United States, he argued, is a significant problem with how the nation makes public policy decisions, conducts consumer affairs, and sets business practices. It also negatively affects how average Americans make decisions in their daily lives and is responsible, he said, for the lack of appreciation for the power of science to tackle important problems.
As examples of why this lack of reverence for evidence is a societal problem that should be addressed with every student at every level of education, Holt cited the fact that millions of Americans do not vaccinate their children, and millions more Americans believe this is acceptable; that there are millions of Americans who deny the evidence of climate change; and that the majority of high school biology teachers avoid teaching evolution. “There are teachers we have educated in our colleges who think they can teach biology without teaching the central organizing principle of biology,” said Holt.
Another way in which we need to model what we teach, he said, is in the way education policy and curricula are developed. “Our teaching methods should be based on evidence, which means that we should honor research on teaching pedagogy in our academic departments,” said Holt. He noted he recently visited a university science department with multiple tenure track positions in science education, and he hoped more departments would follow suit. If the goal is to model what we teach—evidence-based thinking—the science community should not make unsubstantiated claims about the state of affairs regarding whether there are too many or too few science majors or interdisciplinary majors. The fact is, he said, the data currently available do not support either position.
Another important thing to teach is that different perspectives are good because they lead to creativity, and having different perspectives is often essential to effective problem solving. In other words, said Holt, diversity is good, and the sooner that U.S. academia begins to model that by increasing the diversity of its faculty, the better off the nation will be. The reason to address the lack of diversity in U.S. academia, said Holt, is not because it is politically correct or humane policy, but because it is essential for the future of U.S. science. “If science is going to not just strive but succeed, we need to very quickly come to terms with the diverse population of the country and eagerly embrace diversity and build diversity in our scientific enterprise,” said Holt. He noted that, in round numbers, more than 70 percent of the U.S. STEM workforce is white and that women are leaving many STEM disciplines at a disproportionate rate. Only in the biological sciences, he said, do women have a “respectable presence” in percentage terms; whereas, in the chemical,
physical, and materials sciences, women hold less than 30 percent of the jobs. “If we want to model what we want to teach, and I would hope we want to teach creativity, problem solving, and the variety of perspectives that are necessary for that, then we should be hard at work on increasing diversity,” said Holt.
In addition to modeling diversity, it is also important to model inclusion by teaching science as if it is intended for everyone. Holt noted that in 1990 the AAAS published Science for All Americans (Rutherford and Ahlgren, 1990), which laid out principles for teaching science more effectively, and yet in the intervening quarter of a century the nation has made little progress in improving the science literacy of its citizens. As an example of how this deficit in scientific literacy manifests itself, he recounted an incident that occurred when he was a member of Congress. A still-unidentified party sent anthrax spores through the mail, and Holt’s fellow members came to him to find out how big a threat this was to their safety on the assumption that since he was a scientist—Holt is a physicist who before he was elected to Congress was assistant director of the Princeton Plasma Physics Laboratory—he must know about Bacillus anthracis. “These very smart, very able, very diligent members of Congress were saying, ‘I’m not a scientist and you are, and only scientists know science,’” said Holt, who added. “Never mind that they were asking a physicist about anthrax, but I quickly learned about it because I did not mind getting some medical journals and reading about anthrax, something that none of my colleagues, many smarter than I am, chose to do. Why not? Because they had been taught in school that science was for scientists, and that they did not need to take those Advanced Placement courses in high school, and they certainly did not need to take science courses in college.” This failure to educate the public at large about science leaves the country with about 80 percent of the population not knowing “even the basic essence of science or even having the ability to ask questions that can be answered empirically and verifiably,” said Holt. The lack of appreciation for the essential methods of science—that questions can be answered empirically and verifiably—means that every economic debate in the country, he noted, is based on ideology, not evidence, even though economics is in large part an empirical science, generating evidence an ordinary person should be able to evaluate and that all citizens should demand be the basis of any policy argument their elected officials make.
Today, said Holt, science is taught as a set of known facts to be memorized, “but if we want to model what we teach, science courses should be designed around what we don’t know, which is the way science is done.” He recounted that the late physician and science essayist Lewis Thomas once noted that too many people do not understand the high adventure that is science. “This way of asking questions so that they can be answered
empirically and verifiably is a powerful concept,” said Holt. “It sets science apart from other ways of knowing the world and knowing the universe.” Thomas, said Holt, called science the shrewdest maneuver to knowing how the universe works, a phrase that he said brings science down to earth, that makes science something in which any well-educated person can take part. “What we really need to teach is this shrewd maneuver, the process of science, the thrill of the chase, the beauty of the discovery process, the team approach,” said Holt. Doing so, he suggested, offers the possibility of reversing the erosion in the appreciation of science and the disturbing retention number of science majors.
In summary, he said taking the attitude that the scientific community should be modeling what it teaches has implications for the composition of college and university faculty, for how materials are presented, for the target audience, and for the cost and accessibility of education. It has implications, he argued, for the disciplinary approach with which science has been taught for the past 150 years, and while there are signs of change in all of these areas, there is still a long way to go. “I’m not an expert in how you teach science, but I think I can say that we would do well if we designed programs that model what it is we want to teach our students.”
REVISITING THE STEM WORKFORCE
“Much has been said about the state of the science and engineering1 (S&E) workforce,” said Droegemeier as an introduction to his presentation on the NSB’s Revisiting the STEM Workforce report, which was released in February 2015. Yet several factors motivated NSB’s decision to examine this topic anew, he explained, including a desire to bring context and nuance to the debate of whether there is a shortage or glut of STEM workers, to provide insights that could help move this debate forward, and to identify data and research gaps.
He also noted that three major factors drove NSB’s thinking when it prepared this report. First, the nation’s human capital is essential to its science and technology ecosystem, and the National Science Foundation (NSF) invests in people through its support of research and graduate education and its support of the development of tools for research. Second, the STEM workforce landscape is changing. At the time of NSF’s founding in 1950, and even in NSB’s first edition of the Science and Engineering Indicators in 1972, the STEM workforce was synonymous with scientists and engineers, often with advanced degrees, performing research and development
__________________
1 The NSF defines science and engineering fields to include the life sciences, psychology, physical sciences, environmental sciences, mathematics and computer sciences, engineering, social sciences, and other sciences not classified elsewhere, including multidisciplinary fields.
in university, industry, or government laboratories. More recently, said Droegemeier, NSB has begun to recognize that STEM knowledge and skills are critical to a far more extensive portion of the U.S. workforce than in the past and that a broad range of STEM-capable workers, including individuals without a formal STEM degree, contribute to economic competitiveness and innovation.
The third major factor influencing NSB’s thinking, Droegemeier explained, was that the 2014 Indicators report could provide a data-driven portrait of the STEM workforce that might shed light on such longstanding and seemingly intractable policy questions as the following:
- Are we producing a sufficient supply of STEM workers to meet labor demands, or is there actually a glut of STEM workers?
- Are we providing our students with the skills needed to meet occupational demands?
- Is there a “skills gap” or “mismatch”?
Droegemeier noted the report offers three major insights. The first insight is there is no consensus definition of the STEM workforce and it consists of many sub-workforces. “One reason for the vastly different analyses about the state of the STEM workforce is because the definition of a STEM worker is not consistent from article to article and report to report,” he said. “For example, some common definitions of the STEM workforce exclude workers with less than a bachelor’s degree, while other definitions may omit social scientists or health care workers.” Most definitions of the STEM workforce, he added, are based on degree or occupational classifications, yet these can leave out those who use STEM skills in their work but who do not have a formal STEM degree or those with a STEM degree who work in a non-STEM job. He noted that depending on how the workforce is defined—whether by degree, occupation, or fields included—the size of the STEM workforce varies dramatically. For example, in 2010, there were approximately 139 million individuals in the U.S. workforce (Bureau of Labor Statistics, 2015), and among them, 5.4 million were in jobs NSF classifies as science and engineering jobs. However, 19.5 million individuals possessed a bachelor’s degree or higher in a science and engineering field and 16.5 million Americans held jobs they claimed required a bachelor’s degree level of science and engineering expertise (NSF, 2014). “Considering the STEM workforce through all of these lenses is especially important if we wish to understand more broadly how STEM skills are used in the workplace and how these workers contribute to innovation and national competitiveness,” said Droegemeier.
NSB also found that the term “STEM workforce” obscures the heterogeneity of the workers in STEM-related jobs. What analysts call the
STEM workforce is, in fact, a mix of “sub-workforces” that Droegemeier explained can be understood by degree or education level, occupation, geography, and career stage. Each of these sub-workforces has different characteristics in terms of the demand for workers, career experiences, and the education and training that workers need throughout their career. Given those different characteristics, he said, it is clear many of the most pressing questions about the STEM workforce, however it is defined, cannot be answered by treating it as a monolith. “When NSB applied this insight to the question of whether there are too many or too few STEM workers, it became clear there was no straightforward yes or no answer,” said Droegemeier. “The answer to this and many related questions about the workforce is ‘it depends.’ It depends on who you consider a STEM worker and which sub-workforce is being discussed.”
The second insight in the NSB report is that individuals with STEM knowledge and skills do not necessarily follow a linear STEM pipeline from receipt of a STEM degree to a job in the same STEM field, nor does a STEM degree indicate that an individual will have a job in a STEM field. In fact, in the United States, STEM knowledge and skills enable career pathways to STEM and non-STEM occupations alike. “Some of us on the board were surprised to learn that only one-third of individuals with an S&E degree are employed in a job classified as S&E, and over half of these individuals are employed in jobs that are considered non-STEM using most definitions,” said Droegemeier. The degree with which individuals with a STEM degree pursue career paths both in and out of STEM varies by degree level, he explained. While approximately one-third of the individuals with a science and engineering bachelor’s degree work in a science and engineering job, this number increases to 51 percent for those with a master’s degree in a science and engineering field and to 74 percent among those with a doctorate.
In addition to variation by degree level, there are also differences based on degree field, which he illustrated using screenshots from an interactive, online tool created by the U.S. Census Bureau that allows users to explore the relationship between college majors and occupations. The first example he showed (Figure 2-1) illustrated that many engineering degree holders, for example, do work in engineering jobs, but others are employed in computer sciences and in non-STEM fields such as education, business and financial, and even arts and entertainment. In contrast, the majority of social science degree holders follow career pathways into non-STEM jobs (Figure 2-2). These visuals, he said, highlight that STEM degrees open up careers in a range of occupations. “While in some fields the link between degree and occupation is tighter than in others, these visuals call into question the idea that an individual necessarily proceeds from a STEM degree to a job in that same STEM field,” said Droegemeier. “In practice the association between
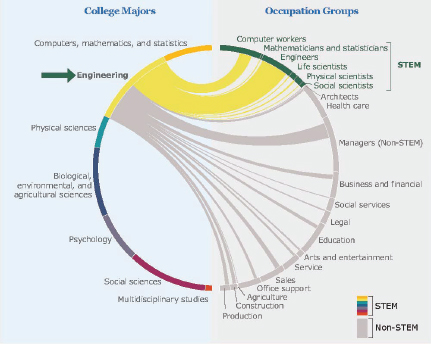
NOTE: Presented in Droegemeier slide 7.
SOURCE: Published in National Science Board, 2015; Data from U.S. Census Bureau, 2014.
degree and occupation is somewhat loose, with individuals with STEM knowledge and skills having the flexibility to embark on numerous career paths both in and out of STEM.”
At the same time, these data represent a static picture of employment and do not capture the dynamic experience of workers over the course of a career and the reality that STEM jobs are changing rapidly, he noted. “The idea that one earns a STEM degree and then spends one’s career in a STEM job does not reflect reality,” said Droegemeier. Workers can gain experience, undergo workplace training, and engage in continuing education activities. They can also develop new competencies and knowledge areas on the job, or they may obtain another degree. Each of these actions may move workers in new directions, such as taking a non-STEM management position or starting a new company. Similarly, today’s workforce destinations are not static. The rapid advancement of technology means that today’s
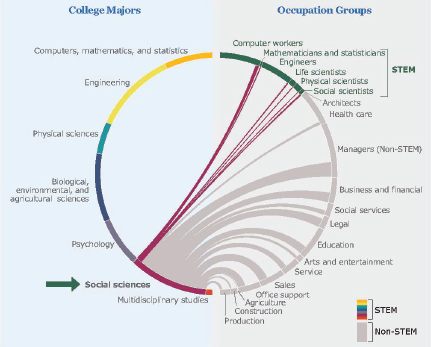
NOTE: Presented in Droegemeier slide 8.
SOURCE: Published in National Science Board, 2015; Data from U.S. Census Bureau, 2014.
students may find employment in jobs and job categories that do not exist today, and the jobs they obtain will change over the course of their careers. “We need to start collecting data in ways that more accurately capture and portray this more complicated pathway scenario that we have in this country,” said Droegemeier. “That was an important point for the NSB.”
In his opinion, the idea of workforce pathways triggers better questions about frequently discussed workforce issues. For example, instead of asking how many degree holders in the computer sciences are needed to fill a given number of jobs, it might be better to ask what skills and capabilities do all students need to maximize their career options, or what continuing education opportunities do incumbent workers need to thrive over the course of a career amid changing workplace conditions. “This idea of pathways, that degree is not career destiny, also forces us to think about how we define success in postsecondary STEM education,” said Droegemeier. “Is success
only measured by how many STEM graduates actually work in their field of degree or in STEM more generally? Or should our goal simply be to help individuals to be productive members of society and to be lifelong learners?”
The third important insight from the NSB report is that STEM knowledge and skills enable pathways leading to careers throughout the U.S. economy, which means STEM students have a range of career options. NSB, said Droegemeier, considers this to be a good thing, both for the individual who has career flexibility and for businesses that rely on having access to highly skilled workers who can adapt to rapidly evolving needs. However, this apparent flexibility also raised concerns for the NSB. “Given NSB and NSF’s mission and the importance of research and development (R&D) to innovation, NSB is not agnostic to the career choices of STEM graduate students and incumbent workers with advanced degrees,” said Droegemeier. “We want to attract a diversity of talented students into these critical R&D pathways, and we want them to have positive and productive experiences once they are on them. Therefore, it is important to monitor and assess the condition of workforce pathways, particularly those central to NSF’s mission, and identify risks and challenges to them.” Questions raised by this insight that NSB considers important include the following:
- Are undergraduate and graduate students informed about career pathways?
- Do they start out in an R&D STEM job, but then switch to a non-STEM pathway somewhere along the way, and if so, why?
- What impact do fluctuations in federal funding or structural changes within academia have on their careers?
- What other factors impact career pathways?
The NSB report also discusses roadblocks preventing some individuals from obtaining the STEM skills they will need to pursue desired career pathways in today’s economy. Droegemeier said the report notes that persistent achievement gaps mean the myriad career opportunities enabled by STEM are unavailable to many of the nation’s students. The report also notes that many women and underrepresented minorities who do embark on STEM studies or STEM careers encounter roadblocks that dissuade them from pursuing certain pathways or cause them to leave STEM. “STEM is for everyone and STEM skills provide empowerment for individuals,” he said. “Too often, women and students of color who may be struggling with a STEM course are encouraged to drop it and switch to something ‘easier,’ but this is exactly the wrong advice. They need to be challenged and encouraged and not treated as if they are not smart enough to get the job done.”
In summarizing the key findings of the report, Droegemeier said,
“Taken together, the report’s insights show that as science and technology continue to permeate our economy, STEM knowledge and skills play an indisputable role in fostering individual opportunity and national competitiveness. They also show that workers with STEM knowledge and skills at all degree levels are employed throughout the U.S. economy and add value in different ways, and that as more jobs require STEM skills, the distinctions between STEM and non-STEM workers are blurring.” These findings, he explained, led NSB to reflect on whether policymakers need to be thinking beyond a distinct and separate STEM workforce and instead be discussing what it would take to create a STEM-capable U.S. workforce. He explained that fostering such a workforce—composed of individuals with distinct career interests and aspirations who require different educational and training opportunities throughout their careers—will require government, educational institutions, and businesses to fulfill their individual and collective responsibilities to assess, enable, and strengthen career pathways for all students and incumbent workers.
While the report does not offer specific recommendations, it does emphasize the role of universities is to equip students with the generalizable knowledge and competencies necessary to learn, think critically, and embark on numerous pathways, said Droegemeier. Community colleges, career and technical education programs, and newer “business-needs-oriented” educational efforts, such as professional science master’s programs, can provide a bridge between education and skills training. Leaders in the business community can help foster a strong STEM-capable U.S. workforce by considering how employer-provided on-the-job-training, reskilling, and other professional development activities could help strengthen their workforce and improve their competitiveness.
Regarding NSF’s role in fostering a STEM-capable workforce, Droegemeier highlighted a few of its ongoing activities. The National Center for Science and Engineering Statistics, for example, is addressing limitations in the ability to assess the state of the workforce, by
- working with the federal statistical community to collect more and better longitudinal data on individuals with STEM knowledge and skills;
- collecting data on factors that influence career pathways, especially for women, underrepresented minorities, veterans, and persons with disabilities;
- expanding its coverage of certifications and other nondegree credentials that are important for technical workers and other professional occupations; and
- partnering with NSF directorates to develop more and better indicators of K-12 STEM education and the career progression of scientists and engineers supported by NSF’s funding mechanisms.
NSF also supports STEM education research aimed at identifying core STEM competencies and enhancing STEM learning in a variety of settings and career stages.
Droegemeier concluded his remarks by noting that NSB sees this report as a starting point for a new approach to the U.S. STEM workforce. As such, NSB intends to follow up on this report with short, timely, rigorous pieces that highlight some of the central issues of the report. For example, NSB will look at what is known about career destinations for holders of STEM doctorate degrees. It also intends to introduce additional nuance to discussions about diversity in STEM by looking at the different roadblocks faced by women from underrepresented groups compared to those faced by men from underrepresented groups.
AMERICA’S MILLENNIALS AND THE
FUTURE OF THE U.S. ECONOMY
The ETS report America’s Skills Challenge: Millennials and the Future focuses on adult skills and is drawn from the Program for the International Assessment of Adult Competencies (PIAAC) survey ETS conducted under contract with OECD, said Kirsch. Unlike school-based surveys, which he explained focus on specific ages or grades of in-school students, PIAAC was designed as a household study of nationally representative samples of adults ages 16 to 65. “School-based samples are limited to what you can learn from students in the classroom, and we felt this gave us a more representative picture of the distribution of what human capital looks like in each of the participating countries,” said Kirsch. “This is the first large-scale survey designed as a computer-delivered, one-on-one, in-person assessment, which allowed us to broaden what could be measured, implement computer scoring for all items, and incorporate a multistage adaptive testing algorithm.”
Twenty-four countries participated in the first round of the project (Table 2-1), and the data from round one were published at the end of 2013. Data from the second round, which will be combined and compared with the data from round one, will be published in 2016, Kirsch noted. When completed, the project will have surveyed adults in 40 countries, many of which trade and compete with the United States in the global economy.
Before discussing the round one results, Kirsch described PIAAC. Its main instruments include a 30- to 40-minute background questionnaire and components that assessed reading, literacy, numeracy, and problem solving in technology-rich environments. This last assessment, he explained, could only be done on a computer. “It is important to understand that electronic information is similar to, but not identical to, printed tests, and that a paper test is a static test,” he said. “If someone is given a problem to solve in an
| Round 1 Countries | Round 2 Countries | Round 3 Countries | |
|---|---|---|---|
| Australia | Italy | Chile | Argentina (Buenos Aires) |
| Austria | Japan | Greece | Colombia |
| Belgium | Korea, Rep of | Indonesia | Ecuador |
| Canada | Netherlands | Israel | Hungary |
| Cyprus | Norway | Lithuania | Kazakhstan |
| Czech Republic | Poland | New Zealand | Mexico |
| Denmark | Russian Federation | Singapore | Peru |
| Estonia | Slovak Republic | Slovenia | |
| Finland | Spain | Turkey | |
| France | Sweden | ||
| Germany | United Kingdom | ||
| Ireland | United States | ||
NOTE: Remade from Kirsch slide 4.
SOURCE: Goodman et al., 2015.
NOTE: Remade from Kirsch slide 4.
SOURCE: Goodman et al., 2015.
electronic-based environment, they may find different information and use it differently.” PIAAC data, said Kirsch, provide a better understanding of the distributions of key skills and proficiencies at both the national and the international levels. They also shed light on the extent skills translate into better opportunities for individuals and economies and help evaluate how effective a nation’s education and training systems and its social and workplace practices are in developing required skills and proficiencies.
In his presentation, Kirsch focused on millennials, the respondents who were born after 1980 and who were ages 16 to 34 at the time of the survey. Millennials are important, he said, because they are the most recent products of our educational systems, and according to various reports, they have attained the most years of schooling of any previous cohort. In addition, millennials will be the labor force for the next 40 to 50 years, and as such, will shape the world’s economic, political, and social landscape.
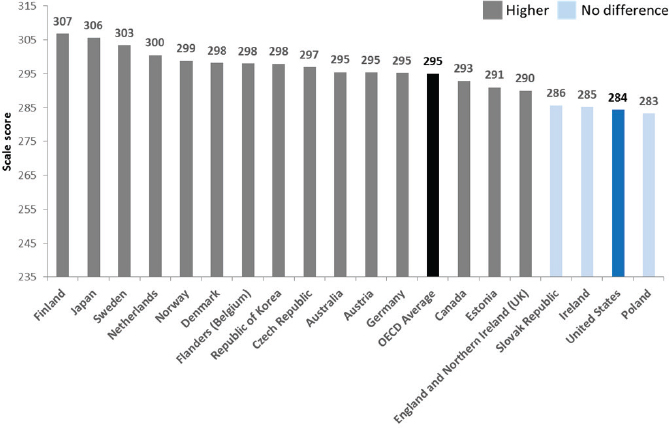
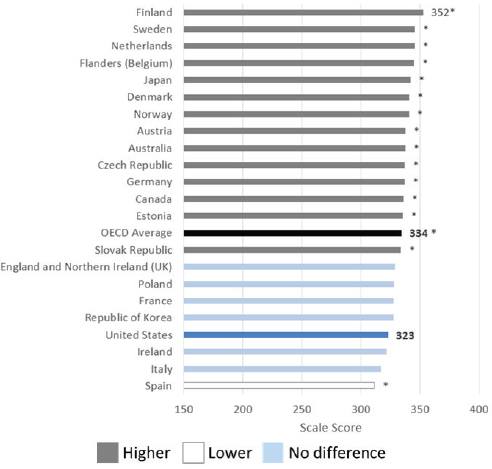
In literacy, U.S. millennials scored lower than 15 countries, with only millennials in Spain and Italy scoring lower (Figure 2-3), while on numeracy, U.S. millennials ranked last along with Spain and Italy within statistical significance (Figure 2-4). On measures of problem solving, U.S. millennials again ranked last, along with the Slovak Republic, Ireland, and Poland within statistical significance (Figure 2-5). “In none of these three areas does the United States stand out, and we should not feel good about how we do relative to other countries,” said Kirsch.
He also noted that a comparison of PIAAC data with results from the U.S. Adult Literacy and Lifeskills Survey (ALL) conducted in 2003 shows
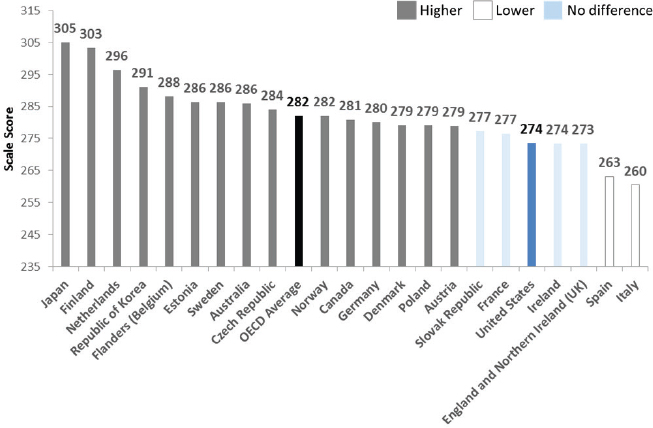
NOTES: “No difference” denotes no statistically significant difference. Presented in Kirsch slide 8.
SOURCE: Goodman et al., 2015.
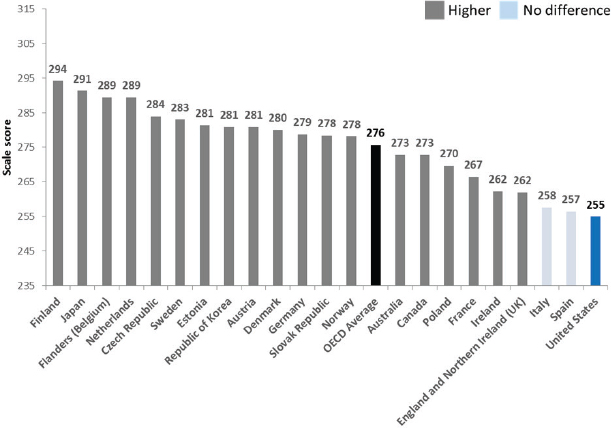
NOTES: “No difference” denotes no statistically significant difference. Presented in Kirsch slide 10.
SOURCE: Goodman et al., 2015.
NOTES: “No difference” denotes no statistically significant difference. Presented in Kirsch slide 10.
SOURCE: Goodman et al., 2015.
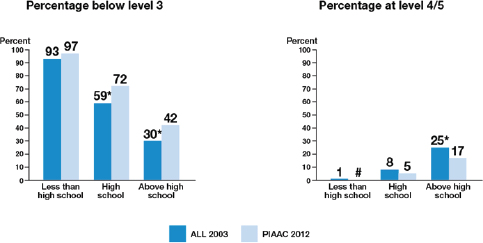
that U.S. millennials have attained more education in the decade since the ALL survey—more people are graduating high school and a larger percentage are going beyond high school to get some postsecondary education—but their average scores have fallen for all levels of educational attainment. Averages can be misleading, though, so he and his colleagues examined the distribution of scores on a scale of one to five, with a score of three being the level that OECD considers necessary to participate in modern society and have access to all of the benefits of society. U.S. results have also gotten worse since 2003 (Figure 2-6). “At a time when we want the distribution of American adults to shift to higher scores, meaning they are more literate, the distribution is shifting toward the less literate and less numerate,” said Kirsch.
Kirsch noted that some have argued this is not necessarily a significant problem because the best U.S. millennials will still outcompete the best from other countries, so he and his colleagues looked at the data from those individuals scoring in the 90th percentile. Again, U.S. millennials did not do well, with only Spain ranking lower than the United States (Figure 2-7), with the difference between the United States, Ireland, and Italy being statistically insignificant. “Even our best are falling further behind other countries,” said Kirsch. No country’s millennials in the 10th percentile scored lower in numeracy than those from the United States, he added.
NOTE: Presented in Kirsch slide 12.
SOURCE: Goodman et al., 2015.
NOTES: “No difference” denotes no statistically significant difference. Presented in Kirsch slide 13.
SOURCE: Goodman et al., 2015.
Where the United States does rank highly is in the gap between the high and low performers. “Economists talk about inequality in income, but they also talk about inequality in education and skills,” said Kirsch. “Our gap is much larger than the OECD average.” He said some pundits claim U.S. performance is so low because of the impact of immigration, but excluding immigrants from the analysis still leaves U.S. millennials scoring at the bottom. “These data point to the challenges and issues we face as a nation if our goal is to develop a STEM-capable workforce prepared to compete in the 21st century global economy,” said Kirsch.
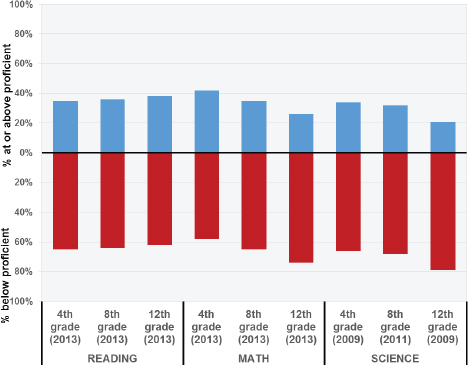
Kirsch noted that some experts want to ignore international assessments because the United States is more inclusive than other countries, but data from the U.S. Department of Education’s 2013 National Assessment of Education Progress (NAEP) show that more than half of U.S. students were below proficient in reading, math, and science by the time they finish fourth grade, and three-quarters of high school students score below proficient when they graduate high school (Figure 2-8). The same relative results are seen on ACT and SAT scores, where a large percentage of students score below established benchmarks for proficiency (Figure 2-9). These data, said Kirsch, argue against the notion that U.S. high school students score poorly on the NAEP because they are not motivated. In fact, he said, less than half of the students who take the ACT, who he considers to be motivated, score at or above proficient on science, math, and reading.
NOTE: Presented in Kirsch slide 17.
SOURCE: Data are from U.S. Department of Education, Institute of Education Sciences, National Center for Education Statistics, NAEP, accessed from the NAEP Data Explorer, September 3, 2015, by Kirsch.
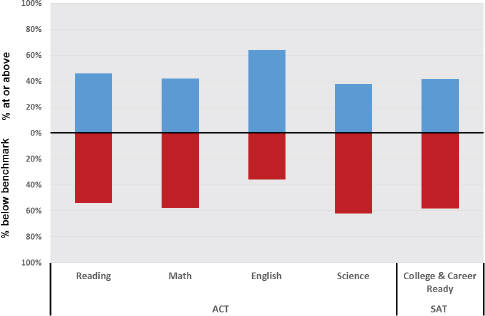
NOTE: Presented in Kirsch slide 18.
SOURCES: ACT data are from: ACT. (2015). The Conditions of College & Career Readiness 2015. Available at https://www.act.org/research/policymakers/cccr15/index.html; accessed on January 26, 2016. SAT data are from: The College Board. (2015). 2015 College Board Program Results. Available at https://www.collegeboard.org/program-results; accessed on January 26, 2016.
These results matter, said Kirsch, because education and skills are closely tied to earnings, employment, and other noneconomic outcomes. In fact, he said, over the past 3 decades the annual and lifetime earnings gaps of both U.S. men and women by educational attainment have widened considerably (Autor, 2014), contributing to substantial inequalities in earnings, incomes, and wealth (Figure 2-10). This growing inequality in family incomes has important consequences for the differential opportunities of children and their academic achievement, said Kirsch. “How do people participate in society with these levels of proficiency? This is not just a workforce issue,” he said. He also noted that people are more likely to marry those with the same level of educational attainment, a change that has occurred over the past 3 to 4 decades and that amplifies the differences in family income and increases income inequality.
While some may doubt that this matters in the United States, the data tell a different story. “Not only do we see how these inequalities affect
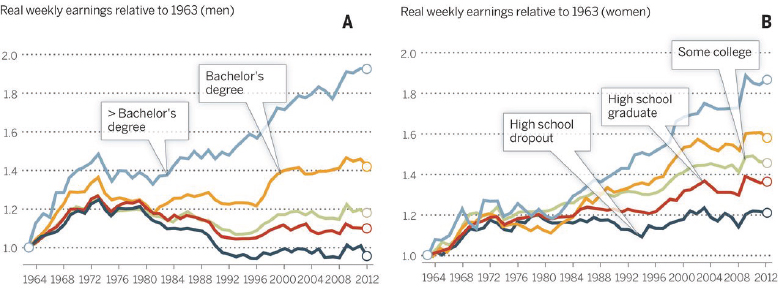
NOTES: For both parts of figure, light blue indicates more than a bachelor’s degree; orange, a bachelor’s degree; green, some college; red, high school graduate; and dark blue, high school dropout. Presented in Kirsch slide 20.
SOURCE: Autor, 2014.
individuals and individual outcomes, and families and family outcomes, but the data are telling us this affects the transmission of opportunity to the next generation,” said Kirsch. “This would be a big enough challenge to the country if it only affected the millennials. We could figure out ways to address this problem if we believed it would pass, but the data tell us just the opposite. The accumulation of advantages and disadvantages in one generation gets passed on to the next generation.” To support this argument, Kirsch cited longitudinal data from an ETS colleague showing that where a student was as a teenager in 1997 in terms of family income and scores on the Armed Services Vocational Aptitude Battery (ASVAB) has a direct effect on whether they will have a bachelor’s degree or higher in 2008. “Is this the America that we intend to be?” asked Kirsch.
One conclusion he draws from these data is the United States is becoming a country that is educated, but also one in which far too many students graduate without skills. “Our policies equate education and skills,” said Kirsch. “Our policies are focused on keeping kids in school so they graduate high school, to get them to go to college, and to take on debt to go to college, but what the data show is far too many of these kids do not develop skills.” According to the community college presidents he has spoken to, some 60 to 80 percent of students starting community college take remedial classes, so not only are they spending money on remedial classes but they are not accumulating college credits. In addition, the percentage of students who start at community colleges in remedial classes and graduate is low (Snyder and Dillow, 2011). “We have to think about our policies in terms of skills, not just credentials. It is not enough to get students to take classes if they are not acquiring skills. It is not enough to get them to sit in classes if they are not taking the courses that will develop needed skills and that we are passing them without those skills,” said Kirsch. “The data show educational attainment is the single best predictor of where you go in life when you finish school, but it is your skills that take over and create much more monetary power as you progress in your time in the workforce. I would argue we need to focus on skills, not just attainment.”
The enormity of the challenge the U.S. faces is twofold, Kirsch continued. On the one hand, the data show this problem is not limited to a single group or locale. “Our averages have to go up so that we have more people at the higher level and fewer people at the lower level of education so that we reduce the disparity in opportunity,” said Kirsch. “But we also have to keep in mind these challenges are being driven by forces that continue to gain strength with little evidence they will pass by us on our own. Instead, they will get worse if we as a nation do not take action.”
In closing, Kirsch mentioned ETS’s Opportunity in America program. This program’s goal is to build on the extensive literature on inequality and disparity and create a framework for moving the country forward. He
noted that, while there are many excellent programs that aim to address inequality and disparity, “the data suggest their effectiveness is attenuated because they are not stitched together in a way that maintains the growth attained in programs earlier in the development process,” said Kirsch. He noted the importance of treating inequality and disparity as a systemic problem, not just one of U.S. schools not doing their job well. “Yes, schools play a critical role in educating children, but there are many programs outside of school with a big impact, and kids who come from better circumstances spend more time in these extracurricular learning environments,” he explained. He also said that any successful program will have to be sustained for many years. “This problem did not develop overnight, and we will need several generations of work with clear indicators to measure progress,” said Kirsch. “There is no magic bullet. The extent to which we as a nation commit to dealing with this problem will determine what we look like as a country and the quality of our democracy.”
DISCUSSION
Following Kirsch’s presentation, Richard Freeman, from Harvard University, claimed Kirsch underestimated the value of the data on skills. Freeman noted that PIAAC skills data relates more strongly to earnings than does education, suggesting that national efforts should focus on improving skills, not education per se, and that research should examine how students gain skills outside of the school system. He also noted that the United States is distinct among countries in the wide earnings distribution seen among people with the same exact PIAAC skill scores. Kirsch responded there is a set of skill use variables in the PIAAC dataset that looks at those who are employed and what they do in their jobs. He acknowledged that more of that type of measure needs to be included in future surveys.
Daniel Atkins, from the University of Michigan, asked Kirsch if his organization or others have looked at recent movements, such as connected learning, that try to establish more synergy between formal and informal learning settings. Kirsch replied he did not know of any efforts along those lines. He added there are conversations at ETS about devoting some of its research agenda to understanding these less formal educational environments given the recognition that informal educational venues are going to be important going forward. Kirsch noted it used to be true that when the U.S. economy recovered from downturns, people who had lost their jobs during those downturns returned to the same jobs. Those days are gone, he said, and the nation needs to think seriously about how to retrain those workers so they can fill the new jobs requiring new skill sets being created. He worries that online education and retraining assumes there is a baseline level of skills. “As we think about making all of these online courses available, we need to ensure we don’t increase the gap because those individuals
with skills will get more and those who do not could fall further behind,” said Kirsch.
Stephanie Teasley, from the University of Michigan, shared Kirsch’s concern about growing inequality, but said the field should exercise caution about using standardized test scores as the means by which inequality is measured. “Poor kids who do not test well do not go on to college, but rich kids who do not test well can afford to get training to test better,” said Teasley. “In fact, many colleges are going to test-optional admissions procedures to reflect the fact that these tests are inherently discriminatory. As we talk about skills and pathways, I think we need to be careful because standardized tests have been a major driver of pipelines.” Kirsch, acknowledging that her point was well taken, reiterated that PIAAC is not a school-based test, does not use multiple-choice questions, and was developed with input from many countries. “What I was trying to show was we ignore the current status of U.S. adults at our peril,” he said. “We do need to look for other measures, but we should not throw them out because they are standardized tests.”
Debra Stewart, former president of the Council of Graduate Schools, asked if the PIAAC data provided any insights into the robustness of American Ph.D. programs given they are generally regarded as the international gold standard. Kirsch replied that Ph.D. holders are too small of a cohort to produce meaningful data in any nationally representative sample, but said the United States continues to be the envy of the world for higher education and particularly graduate and medical education.
Ted Childs Jr., from Ted Childs, LLC, made a number of points. First, he commented on the demographic shift occurring in the United States, one that over the next 30 years will produce a country in which 200 million people, about half of the U.S. population, will be people of color. He then noted there are several major U.S. cities in which the dropout rate exceeds 50 percent, and he also pointed to data for 15-year-olds from 60 countries showing that American students are not in the top 10 in math, science, or reading. In his opinion, the nation is “flushing our black and Hispanic kids down the tubes and that our best students come from the school systems where we make our most substantial investment,” and he felt that this situation is a national security issue. Kirsch said he agreed completely with Childs and added that, while demographically the country has become less segregated residentially by color, it is becoming more segregated residentially by class for whites, Hispanics, and African Americans. “All of these forces are changing the opportunities in America, and we are leaving too many children behind, not just by color,” said Kirsch. “We are becoming more of a caste-based system, where circumstances of birth determine so much of your outcome, and I do not think that is a situation we want to be moving toward as a country. This has to be a national priority, for the consequences of doing nothing are not acceptable.”
This page intentionally left blank.


