
7
Case Studies
INTRODUCTION
This chapter presents several case studies, each of which connects power grid problems to mathematical and computational challenges. The chapter’s overall goal is to illustrate some current mathematical and computational techniques in greater detail than could be captured in earlier chapters. The first section provides an overview of some of the key optimization software used at one of the electricity markets mentioned in Chapter 2 (PJM) and discusses how solving the mathematical challenges would improve its capabilities. That is followed by a case study addressing how to predict and handle high-impact, low-frequency events that could threaten our critical infrastructure. The section “Case Study in Data-Centered Asset Maintenance: Predicting Failures in Underground Power Distribution Networks” discusses the prediction of failures that occur more commonly in which a single piece of equipment fails. This ties into the problem of data-driven asset maintenance, where each asset is a physical component of the grid (e.g., a cable or a transformer) that needs to be maintained before it fails. The section “Case Study in Synchrophasors” discusses synchrophasors, which utilize sensors that can determine both the magnitude and phase angles of power system voltages at rates of 30 to 60 samples per second. The final section presents a case study on real-time, inverter-based control, where potential problems are not only detected, but fast calculations and controls also are utilized to push signals back toward their reference settings.
CASE STUDY IN OPTIMIZATION: PJM’S DAILY OPERATIONS
PJM is a regional transmission organization that coordinates the movement of wholesale electricity in all or parts of Delaware, Illinois, Indiana, Kentucky, Maryland, Michigan, New Jersey, North Carolina, Ohio, Pennsylvania, Tennessee, Virginia, West Virginia, and the District of Columbia. Acting as a neutral and independent party, PJM operates a competitive wholesale electricity market and manages the high-voltage electricity grid to ensure reliability for more than 61 million people. PJM Market Operations coordinates the continuous buying, selling, and delivery of wholesale electricity through the energy market. In its role as market operator, PJM balances the needs of suppliers, wholesale customers, and other market participants, and monitors market activities to ensure open, fair, and equitable access. The operation of PJM’s various markets requires the use of many software applications, which vary in purpose and complexity. The next subsection contains a high-level description of applications that are used to support the operation of PJM, which show how important optimization tools are to the power grid in general.
Day-Ahead Market
As covered in Chapter 2, the purpose of the day-ahead market is to make the generator commitment decisions a day ahead of time so the generators have sufficient time to start up or shut down. This market utilizes several different key applications, which are discussed in this subsection.
The Resource Scheduling and Commitment application is a mixed-integer program responsible for committing the bulk—more than 90 percent—of the resource commitments for the PJM system. The following equation presents a simplified version of the unit commitment problem that PJM solves every day to commit resources in the day-ahead market. The objective function of day-ahead unit commitment is to minimize the total production cost of the system while adhering to the enforced transmission limitations. That is,
Minimize
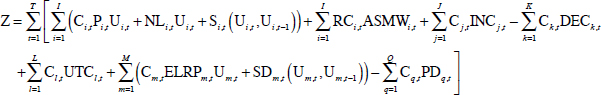
where
| Ci,t | = cost of generating unit i at time t |
| Pi,t | = power (MW) generation of unit i at time t |
| Ui,t | = commitment status of unit i at time t (1 or 0) |
| Ui,t-1 | = commitment status of unit i at time t − 1 (1 or 0) |
| NLi,t | = no-load cost of unit i at time t |
| Si,t | = start-up cost of unit i at time t |
| RCi,t | = reserve cost of unit i at time t |
| ASMWi,t | = ancillary service (MW) of unit i at time t |
| Cj,t | = offer price of increment offer j at time t |
| Ck,t | = bid price of decrement bid k at time t |
| INCj,t | = MW for increment offer j at time t |
| DECk,t | = MW for decrement bid k at time t |
| Cl,t | = offer price or up-to-congestion transaction l at time t |
| UTCl,t | = MW of up-to-congestion transaction bid l at period t |
| Cm,t | = cost of economic load response resource m at time t |
| ELRPm,t | = MW of economic load response resource m at time t |
| Um,t | = commitment status of economic load response resource m at time t (0 or 1) |
| Um,t | = commitment status of economic load response resource m at time t − 1 (0 or 1) |
| SDm,t | = shutdown cost of economic load response resource m at time t |
| Cq,t | = bid price of price sensitive demand bid q at time t |
| PDq,t | = MW of price-sensitive demand bid q at time t |
Subject to the following constraints:
1. Power balance constraint
![]()
2. Ancillary reserve constraint
![]()
3. Capacity constraints
where
| Rt | = reserve requirement at time t |
| = maximum output limit of unit i at time t | |
| = minimum output limit of unit i and time t | |
| = maximum MW of increment offer j at time t | |
| = maximum MW of decrement offer k at time t | |
| = maximum MW or up-to-congestion offer l at time t | |
| = maximum output limit of economic load response m at time t | |
| = minimum output limit of economic load response m at time t |
For simplicity, neither the objective function nor the constraints are shown in the above unit commitment problem formulation, but they are included in the actual day-ahead market clearing software. Some elements that are in the actual formulation but omitted here for simplicity are transmission limitations enforced in the day-ahead market; temporal constraints of units such as start-up times and minimum run times; and the pumped storage hydro-optimization model that PJM currently uses.
A second piece of software used in the day-ahead market is the scheduling, pricing, and dispatch (SPD) application, a linear program that dispatches physical generation and demand resources already committed by resource scheduling and commitment. It can also dispatch virtual bids, including increment offers, decrement bids, and up-to-congestion transactions. Virtual bids are fundamental components of two-settlement markets in every independent system operator (ISO) /regional transmission organization (RTO) in the United States. They are financial instruments bid in by market participants to arbitrage differences between the day-ahead markets and real-time markets. The main benefits of virtual bids are mitigating the unbalance in supply and demand of market power and facilitating the convergence of price and unit commitment.
The third package is known as the simultaneous feasibility test (SFT), which is a contingency analysis program that performs a security analysis of the day-ahead market (details on contingency analysis are covered in Chapters 1 and 3). The SFT screens each dispatch hour for N – 1 overloads. If one is encountered, the SFT application passes information back to the SPD application regarding the N – 1 overload, and the SPD application enforces a specific transmission constraint to mitigate the overload and dispatches resources and calculated prices to appropriately reflect this limitation.
Real-Time Markets
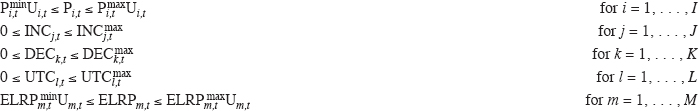
The set of applications described in this section is part of the suite of applications that works simultaneously to control and price the PJM system in real time. The suite of applications includes tools that procure the ancillary services discussed in Chapter 2 and that provide resource commitment and dispatch functionality and, ultimately, the calculation of 5-minute locational marginal costs (LMPs) across the system (LMPs are also discussed in Chapter 2). In the real-time market tools there is no equivalent of the SFT application that exists in the day-ahead market. This is because N – 1 security constraints are identified by the security analysis package in PJM’s Energy Management System and are passed right into the dispatch tools listed below. A block diagram of these applications is given in Figure 7.1, with each briefly discussed.
The Ancillary Services Optimizer is software that solves a mixed-integer program to optimize PJM’s hour-ahead ancillary services. This application jointly optimizes energy and reserves.
The Intermediate Term Security Constrained Economic Dispatch is a mixed-integer program that provides a time-coupled 2-hour forecast and unit commitment. This application uses forecast data and generator offer parameters to create a dispatch trajectory and unit commitment plans for the next 2 hours. The generator dispatch points calculated by this application are not used for system control. The main purpose of this application is to provide intraday unit commitment information to the system operator.
The Real Time Security Constrained Economic Dispatch (RT SCED) is a 10-min forward linear program that produces the economic dispatch points for all resources on the PJM system. PJM uses this application to dispatch all online generation resources from their current operating point to their most economic operating point based on a 10-min-ahead forecast of system conditions. For example, an RT SCED solution that is executed at 7:45 a.m. uses the current operating state of the system provided by the state estimator as a set of initial conditions. The application then uses load and constraint forecast information for 7:55 a.m., in addition to generator offer information such as ramp rates and the real power minimum/maximum limits, to dispatch the set of online generation resources of PJM in a least-cost fashion to meet system expectations 10 min into the future. This application runs every 5 min or on command by the PJM system operator.
The Locational Pricing Calculator is an application that is identical to the RT SCED application except that the market prices calculated in this application are for the entire network model as opposed to just for generation buses.
Capacity Market—Reliability Pricing Model Optimization
This is the market-clearing engine that clears the PJM capacity markets’ base residual and incremental capacity auctions. This application is a mixed-integer program that is used to clear PJM’s 3-year forward capacity auction. The main capacity auction, the Base Residual Auction, is run annually 3 years before the actual year for which the capacity is committed. This application uses demand curves to express the willingness to pay for capacity and supply offers to clear the market.
Financial Transmission Rights
Financial transmission rights (FTRs) provide a mechanism by which market participants can hedge against potential losses in the LMP market by providing a stream of revenue when there are price differences in the LMPs between different locations in the system, along what is known as an energy path. FTRs are acquired through auctions. Associated with FTR auctions is the SPD application, which is a linear program that dispatches FTR bids up to cleared quantities. The clearing of an FTR auction is similar to the clearing of point-to-point transactions like up-to-congestion transactions in the day-ahead market. These bid types are described by source and sink locations, as well as a maximum willingness to pay for the price spread between the locations. If the transaction clears, it imposes a flow on the transmission system that is based on the source and sink location and the topology of the system.
Challenges for the Day-Ahead Unit Commitment Formulation
The day-ahead market unit commitment problem is the most complex problem solved by most ISO/RTOs that operate power markets. Building on what was presented in the section “Day-Ahead Markets,” the problem could also be formulated using a Lagrangian relaxation where commitment decisions are approximated. The section on Day-Ahead Markets presents a mixed-integer program (MIP) formulation, where binary variables are used to more precisely model discrete decisions. While the MIP provides a more precise solution, it also takes longer to solve than the approximated Lagrangian relaxation solution. The MIP formulation that PJM utilizes to solve the day-ahead market unit commitment problem produces an efficient, reliable unit commitment that is the basis for the next operating day. Like anything else, however, it can be improved with the proper direction and investment.
ISOs and RTOs solve many other optimization problems to schedule and dispatch the system and clear power markets, but all can be derived by simplifying the day-ahead market unit commitment problem. Therefore, typically any challenges encountered in the solution process will be evident somewhere in the day-ahead market. Below is a brief summary of some of the common challenges PJM encounters:
- Significant increases in bid and offer volumes will increase the MIP solution time because of an increased number of binary and continuous variables.
- Large numbers of transmission constraints combined with continuous variables can cause a very dense matrix, which limits the ability to use more efficient sparse matrix solution techniques. Additionally, large numbers of continuous variables increase the time to solve each linear program (LP) in the search tree during the MIP searching process.
- Increasing the MIP gap to improve convergence tolerance and consistency between the LP and MIP solutions degrades performance exponentially. Decreasing the MIP gap to improve performance may result in nonunique MIP solutions.
The above challenges are in some way related to the size and scalability of the general unit commitment problem that exists today. The challenges in solution time presented by these issues typically have been addressed by increasing computer processing capability. If Moore’s law continues to hold true, the increases in computer capability may be able to meet the needs of the current unit commitment problem PJM solves. This does not change the need for mathematical work in the short term, however, nor does it change the fact that the problem is likely to become substantially larger as the power grid changes.
In order to make a step change in the size and complexity of the unit commitment problem being solved, there likely needs to be a significant increase in processing capability or a reformulation of the problem. For example, the ability to solve an ac unit commitment problem would be a significant breakthrough for ISO/RTOs in terms of unit commitment accuracy and efficiency. In today’s dc models, voltage and reactive constraints are linearized into dc approximations that attempt to model voltage restrictions that are real power flow limitations. This practice has been in place since the inception of power markets in the United States in the late 1990s; however, the practice still results in some unit commitment and market inefficiencies that a better model of ac constraints during the commitment, dispatch, and pricing process could improve.
An example of a simplification that is widely used is the modeling of a reactive limit in a dc model. Currently, reactive limits are an input into the dc problem based on offline studies and a predefined local area unit commitment, as opposed to being optimized as part of the unit commitment problem itself. In reality, the level of the reactive limit will vary based not only on the actual units committed but also on where they are dispatched, because of the relationship between active power and reactive power on generators. Currently, this level of granularity cannot be modeled efficiently enough to solve the problem within the time frame of the day-ahead market; therefore, the outcome of that market may be less efficient than it could have been. The general result is less transparent market prices and out-of-market uplift payments.
Approximated voltage constraints can also be problematic. From a market efficiency perspective, dispatching to a dc approximation of a voltage constraint can create some undesirable outcomes. For example, suppose 100 MW of FTR are sold on an energy path based on the thermal limit of the facility. If that path is then constrained in the day-ahead market or in real time to a flow less than the 100 MW of the FTRs sold because it is being used as a thermal proxy for a voltage constraint, the result will be underfunded FTRs on that path. The level of underfunding will vary depending on the difference between the FTR and day-ahead market and real-time market flows, as well as the shadow price to control the thermal surrogate.
In the dc-only solution in use today, voltage constraints are linearized so that they can be enforced in a linear program. This solution has its shortcomings; however, it is likely that there is a point of diminishing returns with the full ac model such that expansion of the problem beyond a certain point would yield little or no discernable benefit. The most efficient solution might be a blend of the two; the efforts focused on improving the model should consider the benefits and drawbacks of each.
For example, the breakpoint for gaining accuracy by implementing additional ac constraints in the model may stop at a certain voltage level (or in a certain geographic area surrounding a reactive or voltage constraint), such that those constraints would only need to be implemented selectively. This would cut down on the complexity added to the model, while adding the information needed to resolve these types of constraints more efficiently.
CASE STUDY IN MATHEMATICAL NEEDS FOR THE MODELING AND MITIGATION OF HIGH-IMPACT, LOW-FREQUENCY EVENTS
Worldwide, the bulk power system is one of the most critical infrastructures, vital to society in many ways, but it is not immune to severe disruptions that could threaten the health, safety, or economic well-being of the citizens it serves. The electric power industry has well-established planning and operating procedures in place to address “normal” emergency events (such as hurricanes, tornadoes, and ice storms) that occur from time to time and disrupt the supply of electricity. However, the industry has much less experience with planning for, and responding to, what the North American Electric Reliability Corporation (NERC) calls high-impact, low-frequency (HILF) events (NERC, 2010).
The events that fall into this category must meet two criteria. First, they need to be extremely rare or they may never have actually occurred but are plausible. Second, their impact must be potentially catastrophic across a broad portion of the power system. These are events that if they occurred, could bring prolonged blackouts on a large scale, have an adverse economic impact reaching into the trillions of dollars, and kill millions of people. Our modern, just-in-time economy is becoming increasing fragile with respect to disruptions to critical infrastructures in which even short-time, localized blackouts are quite disruptive. Imagine if the power went out for many millions of people and would not be coming back on for weeks or months!
NERC identified several events that fall into the HILF category, including (1) coordinated physical attacks or cyberattacks, (2) pandemics, (3) high-altitude electromagnetic pulses (HEMPs), and (4) large-scale geomagnetic disturbances (GMDs). One such disturbance, a solar corona mass ejection, is shown in Figure 7.2. The identification of these risks was not new with the 2010 report (NERC, 2010), and some work has been done over the years to try to mitigate their impacts. One example is the recently published Electric Grid Protection (E-Pro) Handbook (Stockton, 2014). Yet, collectively, HILF events present an interesting case study on the mathematical and computational challenges needed for the next-generation electric grid.
The existing power grid is certainly resilient, often able to operate reliably with a number of devices unexpectedly out of service. While blackouts are not rare, most are small in scale and short term, caused by local weather (e.g., thunderstorms), animals, vegetation, and equipment failures. Regional blackouts, affecting up to several million people for potentially a week or two, occur less frequently. Such events are usually due to ice storms, tornados, hurricanes, earthquakes, severe storms, and, occasionally, equipment failure.
As an example, the derecho that happened in late June 2012 in the U.S. Mid-Atlantic and Midwest was one of the most destructive and deadly, fast-moving, and severe thunderstorm complexes in North American history. It was 200 miles wide, 600 miles long and registered winds as high as 100 mph as it tracked across the region. The morning after the event approximately 4.2 million customers were without electricity across 11 states and the District of Columbia, and restoration took 7 to 10 days (DOE, 2012). A second example that same year was Superstorm Sandy, which caused 8.5 million customer power outages across 24 states, causing damage estimated at $65 billion (Abi-Samra et al., 2014).
While tragic for those affected, aid from unaffected utilities helps to speed the recovery, and electric utility control centers have long experience in dealing with weather-related events. For example, during Superstorm Sandy utilities conducted the largest movement of restoration crews in history, with more than 70,000 utility personnel from across the United States and Canada deploying to support power restoration, and power restoration was an overriding priority for all U.S. federal departments, including the Department of Defense (Stockton, 2014).

HILF events are in another, almost unthinkable category in which outages could affect tens of millions for potentially months. But ignoring these threats will not make them go away. HILF events are a category where fundamental research in the mathematical sciences could yield good dividends. The event types in this category are different and they require unique solutions. However, they also have commonalities that the committee describes here in presenting some of the relevant mathematical and computational research challenges.
Interdisciplinary Modeling
The HILF events are all interdisciplinary and hence cannot be solved by experts from any single domain. GMDs start at the Sun, travel through space, interact with Earth’s magnetic fields to induce electric fields at the surface that are dependent on the conductivity of Earth’s crust going down hundreds of kilometers and that ultimately cause quasi-dc currents to flow in the high-voltage transmission grid, saturating the transformers, causing increased power system harmonics, heating in the transformers, and higher reactive power loss and resulting in a potential voltage collapse (NERC, 2012). In March 1989 a GMD estimated to have a magnetic field variation of up to 500 nT/min caused the collapse of Hydro-Québec’s electricity transmission system and damaged equipment, including a generator step-up transformer at the Salem Nuclear Plant in New Jersey. More concerning is the potential for much larger GMDs, such as the ones that occurred in 1921 and 1859, before the development of large-scale grids, with magnetic field variations estimated to have been as much as 5,000 nT/min; such GMDs could cause catastrophic damage to different infrastructures, including the electric grid (Kappenman, 2012).
HEMPs have time scales ranging from nanoseconds to minutes. On the longer time scale of minutes, HEMP E31 is similar to an extremely large GMD, except with a faster rise time, requiring power system transient stability (TS) and TS-level modeling. Hence HEMPs would involve not only the disciplines surrounding GMD but also those surrounding the dynamics of nuclear explosions. A pandemic could affect a huge number of people, simultaneously impacting a large number of coupled infrastructures, including health, water, natural gas, and police and fire services. To defend against coordinated physical attacks would require a combination of power system knowledge and knowledge associated with the protection of physical assets, whereas defense against coordinated cyberattacks would need a combination of power system and cybersecurity domain knowledge. In modeling across different domains, each with its own assumptions and biases, mathematicians would be well positioned to help bridge the gaps between disciplines.
Rare Event Modeling
There is a need for research associated with HILFs in the area of rare event modeling. HILF events can be thought of as extreme manifestations of often more common occurrences. For example, while extreme GMDs are quite rare, more modest GMDs occur regularly, resulting in increasing quantities of data associated with their impacts on the grid. The same could be said for pandemics, while a large-scale attack on the grid would be a more severe manifestation of the disturbances (either deliberate or weather-induced) that occur regularly. The research challenge is extrapolation from the data sets associated with the more benign events.
Resilience Control Center Design
HILFs will stress the power system’s cyberinfrastructure. This could come about as a result of either a direct cyberattack or the stressing of computational infrastructure and algorithms in ways not envisioned by their design specifications. As an example, one impact of a GMD (or a HEMP E3) would be increased reactive power consumption on the high-voltage transformers. However, existing state estimator (SE) models do not provide for these reactive losses. Hence it is likely that during a moderate to severe GMD the SE would not converge, leaving the
___________________
1 The E3 component (a designation of the International Electrotechnical Commission, or IEC) of the pulse is a very slow pulse, lasting tens to hundreds of seconds, that is caused by the nuclear detonation heaving the Earth’s magnetic field out of the way, followed by the restoration of the magnetic field to its natural place.
control center without the benefit of the other advanced network analysis tools. Another issue is the potential inundation of data in either the communication infrastructure or in the application software. For example, during the blackout of August 14, 2003, operators in FirstEnergy Corp.’s control center were overwhelmed with phone calls, whereas the Midcontinent ISO real-time contingency analysis experienced hundreds of violations (U.S.-Canada Power System Outage Task Force, 2004). Resilient control center software design and testing is a key area for future research. Effective visualization of stressed system conditions is also an important area for computational research.
Resilience Power System Design
Ultimately the goal of HILF research is to either eliminate the risk or reduce its consequences. As such, there are a number of interesting research areas to pursue depending on the type of HILF. Of course, a starting point for this work is the ability to have reasonable models of the events, and the economic impacts of all mitigations need to be considered. One promising area is the extent to which the impact of GMDs and HEMP E3s can be mitigated through modified operating procedures, improved protection systems, or GMD blocking devices on transformer neutrals. Algorithms for GMD blocking device placement could leverage advances in mixed-integer programming algorithms. The impacts of cyberattacks or physical attacks could be mitigated by adaptive system islanding. The deployment of more distributed energy resources, such as solar photovoltaics (PV), could make the grid more resilient if they were enhanced by storage capabilities or coupled with other, less intermittent resources to allow more of the load to be satisfied by potentially autonomous microgrids.
CASE STUDY IN DATA-CENTERED ASSET MAINTENANCE: PREDICTING FAILURES IN UNDERGROUND POWER DISTRIBUTION NETWORKS
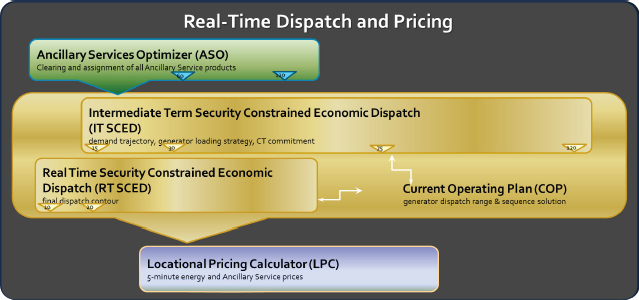
Figure 7.3 illustrates the genesis of a manhole fire and its results. The oldest and largest underground power distribution network in the world is that of New York City. A power failure in New York can be a catastrophic event, where several blocks of the city lose power simultaneously. In the low-voltage distribution network that traverses a whole city underground, these events are caused by the breakdown of insulation for the electrical cables. This causes a short circuit and burning of the insulation, a possible buildup of pressure, and an explosion of a manhole cover leading down to the electrical cables, with fire and/or smoke emanating from the manhole. The power company
would like to predict in advance which manholes are likely to have such an event and to prevent it. There can be problems beyond the low-voltage network, for instance in the feeder cables of the primary distribution network, or in the transformers that step down the power between high and low voltage, in the transmission system, or in any other part of the system. If reliability-centered asset maintenance can be effectively performed, the number of outages and failures that occur in the city could be substantially reduced.
In each borough of New York City, the power company, Consolidated Edison (ConEdison), has been collecting data about the power network since the power grid started, at the time of Thomas Edison. Back then, these data were collected for accounting purposes, but now ConEdison records data from many different sources so the data can be harnessed for better power grid operations. Some of the types of data sets that ConEdison collects are as follows:
- Company assets. Data tables of all electrical cables, cable sections, transformers, connectors, manholes, and service boxes (access points to the energy grid), including their connectivity and physical locations, physical properties (e.g., manufacturer of the copper cable), installation dates, and other relevant information.
- Trouble tickets. Records of past failures or outages, sometimes in the form of text documents.
- Supervisory control and acquisition (SCADA). Real-time measurements of the performance of equipment from monitors.
- Inspection reports. Records of each equipment inspection and the inspection results.
- Programs. Records of other preemptive maintenance programs, such as the vented cover replacement program, where solid manhole covers are replaced with vented covers that mitigate explosions, and the stray voltage detection program, where a mobile device mounted on a truck drives around the city and records stray voltage from already electrified equipment.
Discussed briefly below are some of the serious challenges in harnessing data from the past to prevent power failures in the future. See Rudin et al. (2010, 2012, 2014) for more details.
Data Integration
Data integration is a pervasive and dangerous problem that haunts almost all business intelligence. This is the problem of matching data records from one table to data records from another table when the identifiers do not exactly match. For instance, if the aim is to determine which electrical cables enter into which access points (manholes, service boxes) in Manhattan, a raw match without additional processing would miss over half of the cable records. Given that there is enough electrical cable within Manhattan to go almost all the way around the world, this data integration problem could lead to severe misrepresentation of the state of the power system. Data integration can be severely problematic generally. For one thing, companies need to locate records that provide a full view of each entity. They would like to know, for instance, that inspection reports detailing a particular faulty cable in a particular manhole are connected to customer complaints in a particular building, but there are many ways that this can go wrong: A cable identifier, manhole identifier, or street address that is mistyped in any of the tables could cause this connection to be missed.
One way to handle this problem is to create a machine learning classification model for predicting high-quality matches between two records from different tables. Let x be a vector of a pair of entities, one from each of the two tables to be joined. For example, consider cables and manholes where the three manhole identifiers are (1) type (manhole or service box), (2) number (e.g., 1,624), and (3) mains and service plate (M&S) for a three-block region of New York City. Let xi1 = 1 if there is an exact match between all three identifier fields, let xi2 = 1 if there is an exact match between the manhole types and numbers and the M&S plates are physically close to each other, etc. Given a sample of labeled pairs, where yi = 1 when the match is correct and yi = 0 otherwise, a classification problem can be formed as described in Chapter 4.
Handling Unstructured Text
Much of the data generated by power companies is in the form of unstructured text. The data could include trouble tickets, inspection reports, and transcribed phone conversations with customers. The field of natural language processing involves using sophisticated clustering techniques, classification techniques, and language models to put unstructured text into structured tables that can be used for business intelligence applications. ConEdison, for instance, has generated over 140,000 free text documents describing power grid events over the last decade within Manhattan. These text documents contain the main descriptions of power grid failures on the low-voltage network and thus are a key source of data for power failure predictions. If these text documents can be translated into structured tables that can be used within a database, these text documents can become extremely valuable sources of data for studying and predicting power failures.
Rare Event Prediction
Many classification techniques (such as logistic regression) can fail badly when the data are severely imbalanced, meaning there are very few observations of one class. Power failures are rare events, so it can be difficult to characterize the class of rare events if very few (or none) have been observed. If failures happen only 1 percent of the time, a classification method that always predicts no failure is right 99 percent of the time, but it is completely useless in practice. This problem of imbalanced classification is discussed next.
Causal Inference
Many power companies are starting to take preemptive actions to reduce the risks of failure. These actions could include, for instance, equipment inspections or preemptive repairs. To justify the expenses of these programs, one must estimate the benefits they provide. Without such estimates, it is unclear how much benefit each program creates or indeed whether there is a benefit. For instance, on the New York City power grid, a study (Rudin et al., 2012) called into question the practice of high potential (hipot) testing on live primary distribution cables. Hipot testing is where a live cable is given a much-higher-than-usual voltage, under the assumption that if the cable is weak it is more likely to fail during the test and can thus be replaced before it fails during normal operation. The problem is that the test itself can damage the cable. Other examples are manhole inspection programs and vented manhole cover replacement programs: To justify the costs of these programs, one needs to estimate their effectiveness. In this case, where the test itself does damage, predicting failures does not suffice; one needs to predict what would have happened to untreated cases had they been treated, and one needs to predict what would have happened to treated cases had they not been treated (the counterfactual).
Visualization and Interpretation of Results
Visualization of data is a key aspect of the knowledge discovery process. With ever more complex information arising from the power system, new ways of making sense of it are needed. For instance, for data from a distribution network such as New York’s, it is useful to visualize aspects of the electrical cables, manholes, geocoded locations of trouble tickets where problems arise, inspections, and more. Modern visualization tools can be interactive: One can probe data about local areas of the power grid or explore data surrounding the most vulnerable parts of the grid. One particular type of tool designed for New York City is called the “report card” tool (Radeva et al., 2009). With this tool, an engineer can type in the identifier for a manhole and retrieve an automated report containing everything that must be known to judge the vulnerability of the manhole to future fires and explosions.
Machine-Learning Methods Comprehensible to Human Experts
Most of the top 10 algorithms in data mining (Wu et al., 2008) produce black-box models that are highly complicated transformations of the input variables. Despite the high prediction quality of these methods, they are
often not useful for knowledge discovery because of their complexity, which can be a deal breaker for power grid engineers who will not trust a model they cannot understand.
It is possible that very interpretable yet accurate predictive models do exist (see Holt, 1993, for instance). However, interpretable models are often necessarily sparse, so finding them is computationally hard. There is a fundamental trade-off between accuracy, interpretability, and computation; current machine-learning methods are very accurate and computationally tractable, but with tractability trade-offs or statistical approximations to reduce computation, it may be possible to attain models that are more interpretable and even more accurate.
The challenges above are not specific to New York; they are grand challenges that almost every power company for a major city faces. Solutions to the problems discussed here can be abstracted and used in many different settings.
CASE STUDY IN SYNCHROPHASORS
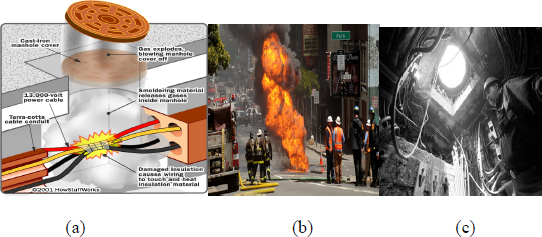
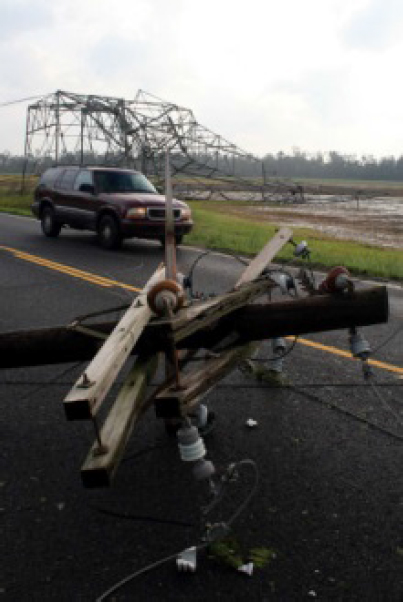
Hurricane Gustav made landfall near Cocodrie, Louisiana, at 9:30 a.m. CDT on September 1, 2008, as a strong category 2 storm (based on 110 mph sustained winds) and a central pressure of 955 millibars.2 As usually happens with these types of events, there was significant damage to both electric transmission and distribution infrastructure. An example of the devastation is shown in Figure 7.4.
For Entergy, the electric utility company operating in this area, Hurricane Gustav caused the second largest number of outages in company history, behind only Hurricane Katrina. Gustav restoration rivals the scale and difficulty of Hurricane Katrina restoration.3 Unlike for previous storms, however, Entergy was able to utilize cutting-edge measurement technology to facilitate the restoration of its system. As the storm disrupted individual circuits, an electrical island was formed within Entergy’s service territory. What this means is that some generators were serving load using infrastructure that was electrically separated from the remainder of the interconnected power grid. Historically, this situation would have been difficult to manage in the control room, and it would likely have required de-energizing the loads, connecting the generators to the remainder of the grid, then reconnecting the load in the restoration sequence of events. However, because Entergy had previously deployed synchrophasor technology in its control room, the system operators were able to better observe the operation of the electrical island and utilize this information to facilitate its reconnection with the remainder of the grid as an intact electrical island.
Overview of Synchrophasors
As discussed in earlier chapters, a synchrophasor is a time-synchronized measurement of an electrical quantity, such as voltage or current. In addition to measuring the magnitude of the quantity being measured, the accurate time reference also measures the phase angle of that quantity. The enabling technology underlying this measurement approach is an accurate time reference. One common and ubiquitous time reference is the Global Positioning System, which provides microsecond-class timing accuracy. This is sufficient to measure phase angles with better than 1° accuracy. (For example, if the user desires to measure the angle with 1° accuracy on a 60-Hz system, the time error must be less than 4.6 μsec.)
The phasor measurement unit (PMU) can also calculate derived parameters associated with other electrical quantities, including frequency, rate of change of frequency, power, reactive power, and symmetrical components, by processing the raw voltage and current information that is measured by the instrument. Widely adopted standards, such as IEEE C37.118.1, govern the definition of these measurements. There are also different classes of PMUs that have been defined based on whether speed or accuracy is the primary consideration, given different assumptions that can be made by the equipment vendor for sampling and filtering algorithms. The M-class, for measurement, emphasizes accuracy, while the P-class, for protection, emphasizes speed of detection, which may sacrifice steady-state accuracy. Future modifications to these standards are defining dynamic performance requirements.
___________________
2 National Weather Service Weather Forecast Office, “Hurricane Gustav,” last modified September 1, 2010, http://www.srh.noaa.gov/lch/?n=gustavmain.
3 Entergy, “Hurricane Gustav,” http://entergy.com/2008_hurricanes/gustav_video_2.aspx. Accessed December 15, 2015.
There are other benefits of synchrophasors beyond those achievable from traditional measurements that are provided by SCADA telemetry. Because PMUs provide data with multiple frames per second (a modern PMU is capable of measuring at least 30 samples per second), dynamic characteristics of the power system can be measured. This is a valuable data source to calibrate dynamic power system models. Furthermore, accurately time-stamping the measurements can aid in the investigation of system disturbances (blackouts).
Internationally, the use of synchrophasors has been increasing dramatically in the past several years. After the technology was adopted and proven by early adopters over the past few decades, and with the cost of the technology steadily decreasing, more and more operational entities have adopted the technology. Some applications are given next.
Application of Synchrophasors
One of the first applications of this technology was to support planning engineers. Having high-speed, timestamped data was helpful for calibrating and validating dynamic models of the power system. New insights were gleaned concerning the dynamic behavior of the grid. Additionally, blackout investigations made extensive use of these measurements whenever they were available. The key attributes of the measurements sought for these applications were that they were high speed and time stamped.
One of the early applications in the power system control room was visualization to provide operators enhanced wide-area situational awareness. Because the relative phase angles between different regions of the power grid are directly proportional to the real power flowing across the network, displaying the phase angles across a wide-area power system depicts the power flowing across the network in a comprehensive and intuitive manner.
Also, because it is also affected by the net impedance between different points in the network, the phase angle can also serve as a proxy for system stress across critical boundaries. For example, given a constant power transfer across a corridor, if one of the lines is removed from service, the angle across the corridor will increase. Some utilities have adopted alarms and alerts for their operators based on measured phase angles.
Bringing synchrophasors directly into the state-estimation process can also improve the accuracy of those tools. Some utilities have deployed hybrid state estimation, where synchrophasor data are added to SCADA data in the state estimation, where others are evolving toward linear state estimators that are fed solely from PMUs. The linear state-estimation process can reduce measurement error by fitting the measured data to a real-time model of the power system.
More advanced applications are investigating the use of synchrophasors as inputs to Special Protection Systems. These schemes trigger automated responses based on real-time changes to system conditions. The synchrophasor data can arm the system and can also be used to trigger an automated response if that is appropriate.
Today PMUs are deployed primarily on the transmission system, but the industry is beginning to explore their use at the distribution level for power quality, demand response, microgrid operation, distributed generation integration, and enhanced distribution system visibility.
Mathematical Challenges to Improve Synchrophasor Measurements
Today’s synchrophasor measurement systems are governed by industry standards that define their accuracy requirements.4,5 However, these accuracy requirements are only defined for steady-state measurements. In an attempt to reconcile the different applications of the measurements and how different vendors would make trade-offs in their sampling and filtering algorithms associated with speed and accuracy of the measurements, different classes of synchrophasor measurements have been defined. The so-called M-class (measurement) provides a more accurate estimate of the measurement but is allowed to take longer to converge on the measured value. The P-class (protection) is designed to operate faster and is primarily intended to quickly assess the new state of the system after a change in conditions, such as would occur during a fault or other system change. However, neither aforementioned class of measurements will necessarily provide consistent results between different vendor products for continuously time-variant conditions, such as a persistent dynamic instability, or in the presence of other imperfections in the measured signal, such as harmonics. Part of the challenge is that the entire premise of defining what a synchrophasor is applies only to a steady-state representation of the power system, and the changes are neither consistently nor comprehensively well defined. For example, the relationship between phase angle and frequency is not clearly defined whenever either of these parameters is changing. In much the same way that advanced mathematical algorithms are used to extract weak signals from a noisy environment in the communications domain, there is an opportunity for algorithmic advancement to provide a better foundation for extracting meaningful signals from power system measurements, particularly those associated with dynamical systems.
___________________
4 IEEE C37.118.1-2011 (IEEE Standard for Synchrophasor Measurements for Power Systems) and C37.118.1a-2014 (IEEE Standard for Synchrophasor Measurements for Power Systems—Amendment 1: Modification of Selected Performance Requirements).
5 International Electrotechnical Commission (IEC) IEC 67850-90-5.
CASE STUDY IN INVERTER-BASED CONTROL FOR STABILIZING THE POWER SYSTEM
The committee considered two cases of power grid instability that could have been avoided with better analytical and mathematical tools. The first example is in Texas, where wind power farms in northwest Texas were producing power that is carried by weak transmission lines to the large load centers in east Texas (Dallas, Austin, Houston, San Antonio, and others). The turbines and the cables both have built-in controls to help dampen oscillations, in particular, in (1) the thyristor-controlled series capacitor (TCSC) transmission lines, which means that their line power flow can be directly controlled, and in (2) the doubly fed induction generators (DFIGs) of wind farms whose voltage is electronically, rather than mechanically, controlled. If any electrical signals vary from the control center’s reference settings, this needs to be remedied very quickly. The cables and the wind farms are equipped with fast electronic inverter-based controls, which change the stored energy in the equipment whose power is electronically controlled to push the signal back toward its reference settings. However, the controls on the Texas equipment did not work properly, and this led to oscillatory dynamics between the controllers of wind power farms and line flow controllers of weak transmission lines delivering wind power to the faraway loads such as Dallas. The new technical term for these instabilities is subsynchronous control instabilities, which had not been experienced by any power grid before the situation in Texas. For details of operational problems related to large wind power transfer in Texas, see ERCOT System Planning (2014).
Similarly, in Germany, by government regulation, all of the wind power produced in the northwest of Germany must be delivered by the grid. However, the German power grid is not strong enough to handle this massive variability nor is it controlled online. Because of this, it is not always possible to deliver wind power to the major cities in the south of Germany (Munich in particular). Instead, power spills over to the Polish and Czech power systems, which complain about this and wish to build high-voltage dc tie links to block the German wind power from entering their grids. In addition, a serious problem of harmonic oscillations, similar to the problem observed in Texas, has been observed.
Situations like those in Texas and Germany could be avoided in the future if analytical capability in inverter-based control could be advanced—that is, the fast calculations performed in response to signals deviating from their reference settings. A lot of technology currently being developed will require inverter-based control. Mature versions of power inverter control are the automatic voltage regulators and power system stabilizers, both controls for exciters, of conventional power plants. More recent inverter control is being deployed for storage control of intermittent power plants, such as DFIGs and flywheels placed on wind power plants; for real and/or reactive power line flow and voltage control of series controllers, such as TCSCs and shunt capacitors (static var compensators); for control of storage placed on PVs; and for control of variable-speed drives ubiquitous to controllable loads, such as air conditioners, dryers, washers, and refrigerators. Recently there have been large investments in better switches, such as silicon nitride switches. For example, the National Science Foundation’s Energy Research Center for Future Renewable Electric Energy Delivery and Management (FREEDM) system works on designing such switches and using them to control substation voltages and frequencies (http://www.freedm.ncsu.edu), and there are several efforts to design more durable and compact switches with higher voltage levels (ARPA-E’s GENI program is one).
The basic role of inverter control is unique in the sense that it is capable of controlling very fast system dynamics; the cumulative effects of kilohertz rate switching are capable of stabilizing fast frequency and voltage dynamics that are not otherwise controllable by slower controllers, in particular power plant governors. EPRI has led the way to Flexible AC Transmission Systems (FACTS) design for several decades. Interestingly, the early work made the case for using FACTS to control line reactances, and, as such, being fundamental to increasing maximum power transfer possible by FACTS-equipped transmission lines. The decrease in line reactance directly increases power transfer by the line. More recently, there has been major research and development aimed at inverter-based control for microgrids, which is based on placing inverter controls on each PV and directly controlling reactive power-voltage (Q-V) and real power-angle (P-theta) transfer functions of closed-loop PVs (Consortium for Electric Reliability Technology Solutions-microgrid concept, http://certs.aeptechlab.com). Similarly, when modeling inverter-based storage control (flywheels, DFIGs) it is assumed that voltage/reactive power and real power/energy can be controlled directly by inverters so that the closed-loop model is effectively a steady-state droop characteristic. An emerging idea is that
inverter-based control placed on direct-energy resources could be used to ensure stable response of power systems with massive deployment of intermittent resources; in effect, inverter-based control could replace inertial response of governor-controlled conventional power plants.
The approaches to stabilization in future power grids require careful new modeling and control design for guaranteed performance. As shown by the examples in Texas and Germany discussed above, at the lower distribution grid level, today’s inverter control practice of maintaining the PV power factor at unity has been known to result in unacceptable deviations of voltages close to the end users.
The problems in Texas and Germany are only early examples of the problems that could be caused by poor tuning of inverter control. They point to the need to model the dynamics relevant for inverter control to the level of detail necessary so that controllers are designed for provably stable response to each given range and type of disturbance. Some challenges are as follows:
- Modeling realistic fast dynamics. Most models currently used in control centers do not even attempt to model the fast dynamics relevant for assessing the performance of power electronically switched automation embedded in different components throughout the complex power grids. This is a very difficult problem since it requires accurate modeling of fast nonlinear dynamics and control design, which are often close to bifurcation point conditions. Some recently reported theoretical results on this topic were derived under highly unrealistic assumptions, such as “real-reactive power decoupling”—that the grid is entirely inductive (which is not possible when one relies on capacitive storage for voltage/reactive power control)—and that the loads are simple constant impedance loads. Modeling the fast dynamics with realistic assumptions and in a computationally fast way would be a big step forward.
- Aggregation of small inverter controllers. Another problem in power grids still to be studied concerns modeling dynamical effects of aggregate small inverter controllers on closed-loop dynamics in the grid. Modeling and designing switching control to avoid the real-world problems described above in using power electronics represents a grand challenge for modeling and computational methods. This challenge must be addressed if benefits from hardware improvements in power electronic switching are to be realized without excessive cost.
REFERENCES
Abi-Samra, N., J. McConnach, S. Mukhopadhyay, and B. Wojszczyk. 2014. When the bough breaks: Managing extreme weather events affecting electrical power grids. IEEE Power and Energy Magazine 12(5):61-65.
DOE (U.S. Department of Energy). 2012. A Review of Power Outages and Restoration Following the June 2012 Derecho. August. http://www.oe.netl.doe.gov/docs/Derecho%202012_%20Review_080612.pdf.
ERCOT System Planning. 2014. Panhandle Renewable Energy Zone (PREZ) Study Report. http://www.ercot.com/content/news/presentations/2014/Panhandle%20REnewable%20Energy%20Zone%20Study%20Report.pdf.
Fink, L.H., and K. Carlsen. 1978. Operating under stress and strain. IEEE Spectrum 15(3):48-53.
Holt, R.C. 1993. Very simple classification rules perform well on most commonly used datasets. Machine Learning 11(1):63-90.
Kappenman, J. 2012. A perfect storm of planetary proportions. IEEE Spectrum, February. http://spectrum.ieee.org/magazine/2012/February.
NERC (North American Electric Reliability Corporation). 2010. High-Impact, Low-Frequency Event Risk to the North American Bulk Power System. A Jointly-Commissioned Summary Report of the North American Electric Reliability Corporation and the U.S. Department of Energy’s November 2009 Workshop. June. http://www.nerc.com/pa/CI/Resources/Documents/HILF%20Report.pdf.
NERC. 2012. Effects of Geomagnetic Disturbances on the Bulk Power System. Special Reliability Assessment Interim Report. February. http://www.nerc.com/files/2012GMD.pdf.
Radeva, A., C. Rudin, R. Passonneau, and D. Isaac. 2009. Report cards for manholes: Eliciting expert feedback for a machine learning task. Pp. 719-724 in International Conference on Machine Learning and Applications, 2009. ICMLA ‘09. doi:10.1109/ICMLA.2009.72.
Rudin, C., R. Passonneau, A. Radeva, H. Dutta, S. Ierome, and D. Isaac. 2010. A process for predicting manhole events in Manhattan. Machine Learning 80.
Rudin, C., D. Waltz, R.N. Anderson, A. Boulanger, A. Salleb-Aouissi, M. Chow, and H. Dutta. 2012. Machine learning for the New York City power grid. IEEE Transactions on Pattern Analysis and Machine Intelligence 34(2): 328-345.
Rudin, C., S. Ertekin, R. Passonneau, A. Radeva, A. Tomar, B. Xie, and S. Lewis. 2014. Analytics for the power grid distribution reliability in New York City. Interfaces 44(4).
Stockton, P. 2014. E-Pro Handbook. Executive Summary. Electric Infrastructure Security (EIS) Council. http://www.eissummit.com/images/upload/conf/media/EPRO%20Handbook%20Executive%20Summary.pdf.
U.S.-Canada Power System Outage Task Force. 2004. Final Report on the August 14, 2003, Blackout in the United States and Canada: Causes and Recommendations. http://energy.gov/oe/downloads/us-canada-power-system-outage-task-force-final-report-implementation-task-force.
Wu, X., V. Kumar, R. Quinlan, J. Ghosh, Q. Yang, H. Motoda, and G. Mclachlan. 2008. Top 10 algorithms in data mining. Knowledge and Information Systems 14:1-37.


