
2
Organizations and Markets in the
Electric Power Industry
INTRODUCTION
In order to move forward with the mathematical and computational research needed to develop the next-generation electric grid, it is crucial to understand not just the physical structure of the grid but also its organizational structures.
Physically, a large-scale grid is ultimately an electrical circuit, joining the loads to the generators. However, it is a shared electrical circuit with many different players utilizing that circuit to meet the diverse needs of electricity consumers. This circuit has a large physical footprint, with transmission lines crisscrossing the continent and having significant economic and societal impacts. Because the grid plays a key role in powering American society, there is a long history of regulating it in the United States at both the state and federal levels.
Widespread recognition that reliability of the grid is paramount led to the development of organizational structures playing major roles in how electricity is produced and delivered. Key among these structures is the Federal Energy Regulatory Commission (FERC), the North American Electric Reliability Corporation (NERC), and federal, regional, and state agencies that establish criteria, standards, and constraints.
In addition to regulatory hurdles, rapidly evolving structural elements within the industry, such as demand response, load diversity, different fuel mixes (including huge growth in the amount of renewable generation), and markets that help to determine whether new capacity is needed, all present challenges to building new transmission infrastructure. With these and many other levels of complexity affecting the planning and operation of a reliable power system, the need for strong, comprehensive, and accurate computational systems to analyze vast quantities of data has never been greater.
HISTORY OF FEDERAL AND STATE REGULATION WITH REGIONAL STANDARDS DEVELOPMENT
Since the creation of Edison’s Pearl Street Station in 1882, electric utilities have been highly regulated. This initially occurred at the municipal level, since utilities needed to use city streets to route their wires, necessitating a franchise from the city. In the late 1800s, many states within the United States formed public utility regulatory agencies to regulate railroad, steamboat, and telegraph companies. With the advent of larger electric power utility companies in the early 1900s, state regulatory organizations expanded their scopes to regulate electric power companies.
Some challenges related to large size and scalability have been offset by increasing computer processing capabilities. Nevertheless, to make a significant improvement in the efficiency and accuracy of the unit commitment process (the process of finding the least-cost dispatch of available generation resources to meet the electrical load) made possible by modeling and solving an ac power flow formulation, there must be either a substantial increase in processing capability or a reformulation of the problem. The ability to solve an ac unit commitment problem, compared to the linearized dc approximation solution in place today, could significantly improve the modeling and efficient dispatch of resources during the commitment, dispatching, and pricing processes.
Out-of-market actions taken by system operators have countered many of the shortcomings of the dc approximation currently in use. These actions typically are not well captured in the dc model, and the side effects create market inefficiencies, such as uplift payments and underfunded transmission rights.
Regulatory Development
Almost from their inception, electric utilities were viewed as a natural monopoly. Because of the high cost of building distribution systems and the social impacts associated with the need to use public space for the wires, it did not make sense to have multiple companies with multiple sets of wires competing to provide electric service in the same territory. Electric utilities were franchised initially by cities and later (in the United States) by state agencies. An electric utility within a franchised service territory “did it all.” This included owning the increasingly larger generators and the transmission and distribution system wires, and continued all the way to reading the customer’s meters. Customers did not have a choice of electric supplier (many still do not). Local and state regulators were charged with keeping electric service rates just and reasonable within these franchised service territories.
As electric utilities grew and expanded, holding companies formed that allowed for the rapid growth of the electric utility industry. This growth created regulatory challenges for local and state utility commissions. Many holding companies engaged in interstate commerce, which went beyond local and state commissions’ regulatory authority and capacity.
Following the crash of the stock market in 1929, the U.S. Congress passed the Public Utility Holding Company Act of 1935, which increased the regulation of electric utilities by limiting their operations to a single state or forcing divestiture so that each public utility company served only a limited geographic area (EIA, 1993).
In 1920, Congress had created the Federal Power Commission (FPC) to coordinate hydroelectric projects under federal control. The Federal Power Act of 1935 and the Natural Gas Act of 1938 gave the FPC the power to regulate the sale and transportation of electricity and natural gas. This power subsequently expanded to include the regulation, sale, and transportation of interstate electricity and natural gas.
In 1967, the FPC recommended the formation of a council on power coordination made up of representatives from each of the nation’s regional coordinating organizations to assist in resolving interregional coordination matters (FERC, 2015d).
Reliability Organization Development
On June 1, 1968, the electricity industry formed NERC in response to the FPC recommendation and the 1965 blackout, when 30 million people lost power in the northeastern United States and southeastern Canada.
In 1973, the utility industry formed the Electric Power Research Institute to pool research and improve reliability.
After another blackout occurred in New York City in July 1977, Congress reorganized the FPC into the Federal Energy Regulatory Commission (FERC, 2015d) and expanded the organization’s responsibilities to include the enactment of a limited liability provision in federal legislation, allowing the federal government to propose voluntary standards (NERC, 2013a).
In 1980, the North American Power Systems Interconnection Committee (known as NAPSIC) became the Operating Committee for NERC, putting the reliability of both planning and operation of the interconnected grid under one organization.
In 1996, two major blackouts in the western United States led the members of the Western System Coordinating Council to develop the Reliability Management System. Members voluntarily entered into agreements with the council to pay fines if they violated certain reliability standards (NERC, 2013a).
In response to the same two western blackout events, NERC formed a blue-ribbon panel and the Department of Energy formed the Electric System Reliability Task Force. These independent investigations led the two groups to recommend separately the creation of an independent, audited self-regulatory electric reliability organization to develop and enforce reliability standards throughout North America.
Both groups concluded that federal regulation was necessary to ensure the reliability of the North American electric power grid. Following those conclusions, NERC began converting its planning policies, criteria, and guides into reliability standards (NERC, 2013a).
On August 14, 2003, North America experienced its worst blackout to that date, with 50 million people losing power in the midwestern and northeastern United States and in Ontario, Canada (NERC, 2013).
On August 8, 2005, the Energy Policy Act of 2005 authorized the creation of an electric reliability organization and made reliability standards mandatory and enforceable. On July 20, 2006, FERC certified NERC as the electric reliability organization for the United States. From September through December 2006, NERC signed memoranda of understanding with Ontario, Quebec, Nova Scotia, and the National Energy Board of Canada (NERC, 2013a).
Following the execution of these agreements, on January 1, 2007, the North American Electric Reliability Council was renamed the North American Electric Reliability Corporation. Following the establishment of NERC as the electric reliability organization for North America, FERC approved 83 NERC Reliability Standards, representing the first set of legally enforceable standards for the bulk electric power system in the United States.
On April 19, 2007, FERC approved agreements delegating its authority to monitor and enforce compliance with NERC reliability standards in the United States to eight regional entities, with NERC continuing in an oversight role (NERC, 2013b).
North American Regional Entities
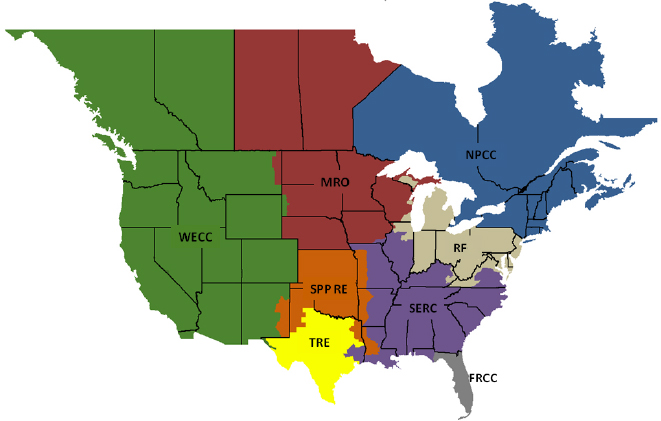
There are many characteristic differences in the design and construction of electric power systems across North America that make a one-size-fits-all approach to reliability standards across all of North America difficult to achieve. A key driver for these differences is the diversity of population densities within North America, which affects the electric utility design and construction principles needed to reliably and efficiently provide electric service in each different area.
There are eight regional reliability organizations covering the United States, Canada, and a portion of Baja California Norte Mexico (Figure 2.1). The members of these regional entities represent virtually all segments of the electric power industry and work together to develop and enforce reliability standards, while addressing reliability needs specific to each organization (NERC, 2013b).
Changes in Regulation
Starting in the late 1970s, FERC began to discuss and explore ways to deregulate the electric power industry to comply with reform of the Public Utility Holding Company Act. A series of orders set in motion the legal framework to provide consumers with a greater choice of suppliers for their electricity.
The Energy Policy Act of 1992 established these changes. FERC followed up on this effort in 1996 with Orders 888 and 889, which required transmission owners to provide “equal and open access” to others seeking to transmit energy over transmission owners’ facilities (FERC, 2015d).
FERC issued Order 2000 in 1999 to ensure equal access to transmission within the United States. Order 2000 created the framework for the formation of independent system operators (ISOs) and regional transmission organizations (RTOs) and provided the specific criteria that transmission entities must meet in order to qualify as an ISO or RTO. The formation of these organizations was deemed necessary in order to create transparent electricity trading markets where independent market operators calculate and post prices to facilitate the efficient sale of electricity (FERC, 2015d).
U.S. WHOLESALE POWER MARKETS
As mentioned in Chapter 1, one of the many benefits an interconnected electric grid provides is the ability for different players to enter into power transactions. Initially these were bilateral transactions between neighboring electric utilities sharing transmission tie lines. This exchange of power initially took place by the utilities adjusting their area control error calculations (the difference between generation and load scheduled between geographic areas). These calculations enabled operators to determine how the exchanges of power would take place.
As communication technologies improved, utility members developed power pools to allow sharing of generation resources. For example, PJM started in 1927 with three electric utilities sharing generation resources and jointly planning transmission. Both the New York power pool and the New England power pool were formed to take advantage of economy of scale. By the 1980s, improved communication and computer technologies enabled the automatic exchange of buy-and-sell offers for electricity to take place on an hourly basis. Thus, markets were established so electricity providers and users could benefit from competition and transparent pricing.
FERC’s Order 2000 led to the eventual formation of nine organized wholesale power markets in the United States and Canada (as of May 2015), with general geographic locations shown in Figure 2.2. Many areas of the United States are not presently covered by organized markets, however. Utilities in those areas continue to engage in power transfers through other means such as bilateral transactions. Different practices are employed in different areas, and the institutional structure may change. Currently Duke Power, Southern Company, and the Tennessee Valley Authority in the Southeast, and the Bonneville Power Administration in the Pacific Northwest are among those that largely utilize bilateral transactions. The organized wholesale power markets in the United States are these:
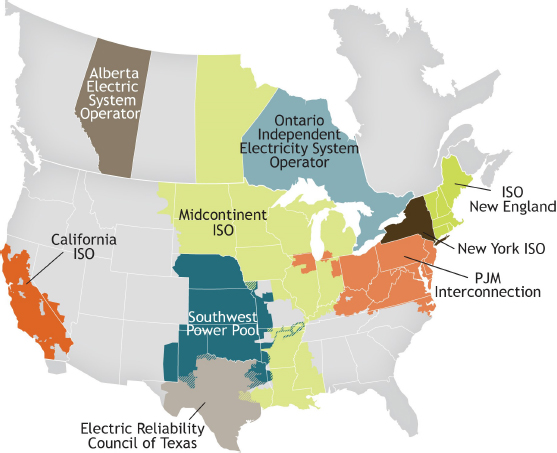
- California Independent System Operator (California ISO, or CAISO). A single-state independent system operator that serves approximately 30 million customers across 26,000 miles of transmission lines with an installed generation capacity of 65,000 MW.
- Electric Reliability Council of Texas (ERCOT). A single-state independent system operator that serves approximately 24 million customers across more than 43,000 miles of transmission lines with an installed generation capacity of 86,000 MW.
- ISO New England (ISO-NE). A multistate independent system operator that serves approximately 14 million customers across 8,130 miles of transmission lines with an installed generation capacity of approximately 32,000 MW.
- Midcontinent ISO (MISO). A multistate independent system operator that serves approximately 48 million customers across 65,250 miles of transmission lines with an installed generation capacity of 205,759 MW.
- New York Independent System Operator (NYISO). A single-state independent system operator that serves approximately 19.5 million customers across 11,056 miles of transmission lines with an installed generation capacity of 37,978 MW.
- PJM Interconnection (PJM). A multistate independent system operator that serves approximately 61 million customers across 62,556 miles of transmission lines with an installed generation capacity of 183,604 MW.
- Southwest Power Pool (SPP). A multistate independent system operator that serves approximately 6.2 million customers across 48,930 miles of transmission lines with an installed generation capacity of 77,366 MW.
- Alberta Electric System Operator and Ontario Independent Electricity System Operator are also shown in Figure 2.2.
Common Features of Electric Markets
While there are certainly differences among these markets, their physical power systems and regulatory constraints require them to provide certain common basic services. For example, because of the unit commitment and start-up constraints, all have a day-ahead market in which generator commitment decisions are made the previous day to ensure that there is sufficient generation available to match the forecast electric load.
However, since day-ahead forecasts are never perfect and unexpected events can occur, all of these markets also have a real-time energy market, sometimes referred to as a balancing market, to ensure that actual generation matches the load on a continuous basis. Other commonalities are financial transmission rights markets, regulation markets, reserve markets, and synchronized reserve markets.
These markets currently also offer demand response service—programs that encourage consumers to reduce their use of electricity during certain high-demand periods in return for a reduction in their power bills. In addition, all U.S. wholesale power markets have binding must-offer requirements in their day-ahead markets and also allow virtual transaction1 participation (IRC, 2014).
Electricity Market Co-optimization
The energy markets operated by each of these ISO/RTOs allow agreements to be set 1 day ahead and in real time. Energy prices are co-optimized with some ancillary service products—which are the additional requirements, beyond just electric energy, for operating the electric grid. Examples include reactive power needed to maintain transmission voltages within acceptable limits, load frequency control to continually match the total generation to the total load (plus losses), power supply reserves to bring generation and load back into balance following an unexpected loss of generation, and black-start services to restart critical generation after a large-scale system blackout.
One natural co-optimization is between the generation capacity that is used to produce energy and the capacity available for reserve use, because the same capacity resources cannot provide both energy and reserves simultaneously. Co-optimization is typically simultaneous with market solutions and occurs every 5 min in near real time with the objective function to minimize the cost of production. For example, CAISO co-optimizes energy and ancillary services in its 15-min real-time unit commitment interval; however, its dispatch at the 5-min interval is not co-optimized with ancillary services (IRC, 2014).
PRICING
At present, all U.S. energy markets that calculate their locational marginal prices (LMPs) use a variation of the generic security-constrained optimal power flow (SCOPF) algorithm covered in Chapter 1. LMPs set wholesale electric energy market prices based on actual operating conditions at a specific time and place. When transmission system limits prevent the lowest-priced electricity from flowing into a location, grid operators dispatch more expensive generation to meet the demand. As a result, the wholesale price of electricity will likely be higher in that location than elsewhere.
In this approach offers are received from the resources (e.g., generators), indicating the price at which they will provide a certain quantity of electric energy to the market (e.g., 50 MW for 1 hr at $100/MWh). In the day-ahead market these offers are matched with the forecast electric load in the SCOPF to determine which generators will actually be committed. Resources that are priced too high are not accepted and hence do not run.
The SCOPF then calculates the LMPs. As covered in Chapter 1, “Physical Structure of the Existing Grid and Current Trends,” the LMPs indicate the marginal cost to provide electricity to a particular bus in the grid. In the absence of any transmission system constraints (congestion) or any incremental transmission losses, the LMPs at all the buses would be identical. This is seldom the case, however, so each LMP usually includes a congestion component. In addition, six U.S. energy market LMP values include a marginal transmission loss component. The
___________________
1 Virtual transactions are a fundamental component of two-settlement markets; they are used to arbitrage price differences between the day-ahead market and the real-time market.
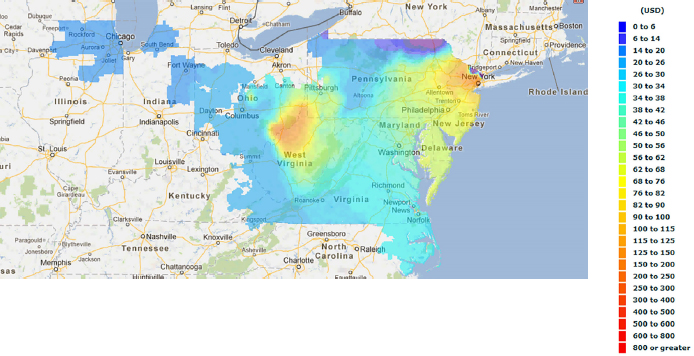
lone exception is ERCOT, where losses are charged to load based on a load ratio share. Figure 2.3 shows LMP superimposed on the PJM footprint. Interestingly, sometimes the LMPs can actually be negative. In such locations generators would have to pay to produce electricity, and customers would get paid for their usage.
Energy Pricing Example
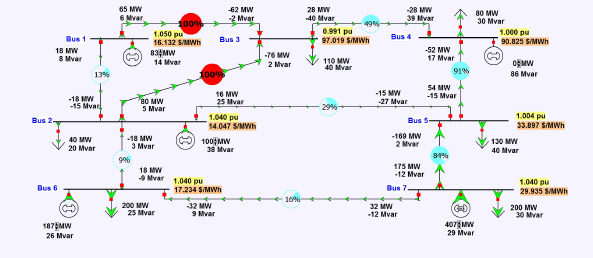
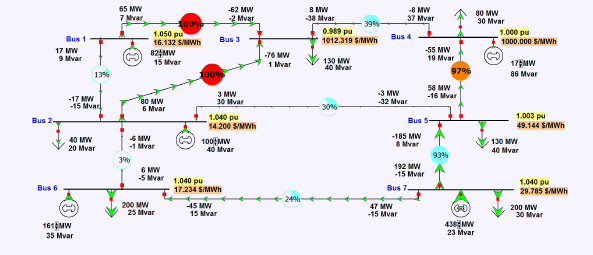
As an illustration of LMP pricing and the impact of energy offer caps, Figure 2.4 shows the seven-bus system from Chapter 1 with all generators offering to provide power at their previous prices, except the generator at bus 4, offering in at the maximum of $1,000/MWh. Not unsurprisingly, these units are not dispatched and receive no revenue. Their high offer has changed the LMPs throughout the system and altered the system congestion, so that two lines are now loaded to their maximums. However, if the system load is slightly different with a modest increase in the bus 3 load, for example, the LMPs change drastically, with the bus 4 generator now being dispatched at 17 MW, having an LMP of $1,000/MWh, and receiving $17,000/hr in revenue. This example is illustrated in Figure 2.5 and illustrates the potentially high sensitivity of the LMPs to small system changes.
Day-Ahead Market
CAISO, ERCOT, MISO, NYISO, PJM, and SPP energy and ancillary services are simultaneously co-optimized in their day-ahead markets. ERCOT’s day-ahead market also simultaneously co-optimizes congestion-hedging products with energy and ancillary services by maximizing bid-based revenues and minimizing offer-based costs (subject to resource and network constraints). ISO-NE’s day-ahead market respects operating reserve requirements but does not co-optimize energy and operating reserves (IRC, 2014).
Unit Commitment
In the day-ahead time frame, the CAISO, ERCOT, ISO-NE, MISO, PJM, and SPP markets employ a day-ahead reliability unit commitment process. CAISO’s process physically commits resources for reliability based
on forecast demand. Results are published simultaneously upon completion of the day-ahead market process. ERCOT runs a daily and an hourly process to ensure enough generators are online to meet the load forecast. MISO performs its process at 4 p.m. after the day-ahead market closes. MISO also performs additional evaluations as needed throughout the operating day.
PJM performs its commitment at 6 p.m. after the day-ahead market closes and as needed until the operating day begins. SPP’s commitment runs prior to, and commits resources for, the operating day to minimize the cost of capacity as computed based on resource offers. SPP also performs an intraday reliability unit commitment process that runs at least every 4 hours to maintain system balance.
The optimization for the day-ahead market uses a dc power flow and a mixed integer program for optimization. The dc power flow does not represent voltage constraints well. With faster supercomputers and improved analytics, a solution with a full ac power flow may now be possible.
PJM also operates a day-ahead scheduling reserve market used to ensure energy reserves are available for up to 30 minutes to deal with unexpected system conditions during the operating day (IRC, 2014).
Scarcity Pricing
LMP markets are designed to send transparent price signals to market participants to make both short-term decisions about how to use existing resources (either generation or load), as well as to make longer-term decisions about where to locate new resources to reduce system congestion.
Most of the time the markets work as planned. However, scarcity can occur when there are not enough resources to balance the generation and the load, a potential system emergency. At such times, special scarcity pricing mechanisms are used to both incentivize the existing resources to help maintain grid reliability and allow longer-term entry of new resources at the best locations on the grid. Currently, CAISO, ERCOT, MISO, NYISO, PJM, and SPP have scarcity pricing mechanisms in place.
In CAISO, both ancillary services and shortage pricing are based on the scarcity demand curve, which takes into account both relevant regulations and power supply reserves. CAISO’s highest scarcity price is $1,000/MWh, which is the energy bid cap.
ERCOT uses an operating reserve demand curve to set scarcity pricing and has a cap of $9,000/MWh under scarcity conditions. MISO’s scarcity pricing is based on the regulation and operating reserve demand curve, with the regulation offer cap at $500/MWh and the supplemental offer cap at $100/MWh.
NYISO shortage pricing is included within its optimization tools for energy and ancillary services. PJM sets shortage prices using an operating reserve demand curve that sets the price to serve as a “penalty factor” for being unable to meet the reserve requirement. The penalty factor cap is $850/MWh as of June 2015 (IRC, 2014).
Capacity Markets
Capacity markets are a mechanism to help ensure that there will be sufficient generation capacity to match the anticipated load. This is needed because construction of new generation facilities can take a long time—usually well over a year. Currently, only ISO-NE, MISO, NYISO, and PJM contain capacity market constructs, albeit these constructs differ considerably. Here is the high-level description of each capacity market:
- ISO-NE. The ISO-NE forward capacity market is designed to acquire qualified resources 3 years in advance of the commitment period. This meets the installed capacity requirement established by ISO-NE system planning and the stakeholder process, and encourages the retention and development of resources to maintain adequate operating reserves. There is a forward capacity auction each year, where market participants obtain a capacity supply obligation to deliver physical capacity by the start of a commitment period. Capacity supply obligations can be acquired or shed bilaterally or in reconfiguration auctions.
- MISO. MISO has a resource adequacy capacity market that voluntarily procures capacity in an annual auction to supply energy based on aligned regulations.
- NYISO. The NYISO conducts three types of installed capacity (ICAP) auctions: the capability period auction, the monthly auction, and the ICAP spot market auction. On any day for which it supplies unforced capacity, a provider is obligated to schedule or bid into the day-ahead market (or declare itself to be unavailable) an amount of energy that is not less than the installed capacity equivalent of the amount of unforced capacity it is supplying to the New York control area.
- PJM. The PJM capacity market—the reliability pricing model—procures long-term capacity resources 3 years ahead, whereby committed, dispatchable resources are obligated to offer into the day-ahead market.
U.S. BILATERAL MARKETS
Markets in the U.S. Southeast and Northwest are made up predominantly of vertically integrated utilities engaging in bilateral transactions between two market participants.
The Northwest electric region covers Idaho, Montana, Nevada, Oregon, Utah, Washington, Wyoming, and a small portion of northern California. Approximately two-thirds of the electric power production comes from
hydroelectric sources in the northwestern United States. The surplus power production has historically been sold into California and the U.S. Southwest (FERC, 2015a).
The Southeast electric region covers all or portions of Alabama, Florida, Georgia, Mississippi, North Carolina, South Carolina, and Tennessee. Coal and natural gas have been the predominant marginal fuel types in this region (FERC, 2015b).
The Southwest electric market encompasses the Arizona, New Mexico, southern Nevada, and the Rocky Mountain Power Area (RMPA) subregions of the Western Electric Coordinating Council. Peak demand is approximately 42 GW in summer. There are approximately 50 GW of generation capacity, composed mostly of gas and coal units.
The Southwest relies on nuclear and coal generators for baseload electricity, with gas units generally used as peaking resources. The coal generators are generally close to coal mines, resulting in low delivered fuel costs. Some generation is jointly owned among multiple nearby utilities, including the Palo Verde nuclear plant, the nation’s largest nuclear plant, with three units totaling approximately 4,000 MW, which has owners in California and the Southwest (FERC, 2015c).
EXAMPLES OF INTERNATIONAL MARKETS
Open access to transmission and competition in wholesale markets has been developing around the world for over 25 years. The United Kingdom was first. Australia has the highest price cap on its “energy only” market. Japan is the latest country to move to markets to encourage investment to replace the nuclear capacity that was shuttered after the March 11, 2011, Tōhoku magnitude 9.0 earthquake and tsunami. It can be useful to understand how these and other foreign markets are evolving.
Australian National Electricity Market
The Australian National Electricity Market (NEM) has five trading regions that geographically cover the eastern and southern portion of Australia: Queensland, New South Wales, Victoria, South Australia, and the island state of Tasmania, which is connected underwater to Victoria. The NEM produces approximately 200 TWh (terawatt-hour) of electricity annually, which makes up about 80 percent of Australia’s total energy consumption from an installed generation capacity of about 45,900 MW (AEMC, 2015).
The NEM is an energy-only pool, where all generators are required to sell all output into the market. It matches generation bids with load requirements every 5 minutes in the most cost-efficient manner and provides dispatch instruction to generators whose bids clear. The NEM averages the 5-minute prices and posts spot prices every 30 minutes for each of the five trading regions. The market price cap is set by the NEM rules and is currently $12,500/MWh. Additionally, the NEM has a price floor of –$1,000/MWh (EEX, 2015).
The Australian Energy Market Operator (AEMO) operates the NEM as well as gas markets in Australia. The two markets are cleared at the same time but are not co-optimized. The gas markets include the Declared Wholesale Gas Market in Victoria, the Short-Term Trading Markets, and the Wallumbilla Gas Supply Hub. AEMO’s corporate brochure states “AEMO oversees the vital system operations and security of the National Electricity Market Power System and the Victorian Gas Declared Transmission System” (AEMO, 2014).
AEMO notes that electricity consumption in the NEM began to decline in 2010. This was due to a combination of factors, including commercial and residential customers reducing consumption in response to higher electricity retail prices; increasing energy efficiency measures; increases in solar photovoltaic installations (thanks to government incentives); and weaker energy demand from industrial manufacturing facilities (AEMO, 2014).
German Electricity Market
The German electricity market is the largest in Europe, with an installed generation capacity of approximately 125 GW. The current annual energy consumption within the German electricity market is around 550 TWh per year. Four transmission system operators run the transmission system in Germany. They procure primary, secondary, and
tertiary control reserves via the German Control Reserve Market, which allows participation by plant operators and electricity consumers (German Transmission System Operators, 2015).
Following the Fukushima nuclear plant accident in Japan, the German government made the decision to shut down the country’s eight oldest nuclear power plants. The country plans to shut down the remaining nine nuclear power plants by 2022. Germany has also set aggressive climate change initiatives to reduce greenhouse gas emissions. Its targets exceed those set by the Kyoto Protocol, which called for a reduction (compared to 1990 levels) in greenhouse gas emissions of 20 percent by 2020. Germany has established a national target for reductions of 40 percent by 2020 and 80 to 95 percent by 2050.
To make up for the changing energy resource mix, Germany has put in place an aggressive program of increasing supplies of energy from renewable resources. It aims to have between 40 and 45 percent of the energy consumed to be sourced from renewable resources by the year 2025. Despite the increase in renewables, coal has made a comeback in Germany because of the country’s goal to shutter nuclear plants.
In order to fund this investment in renewable resources, Germany introduced feed-in tariffs, which have increased retail prices while they have lowered the wholesale price of energy in Germany, creating revenue challenges for existing resources. As a result of the feed-in tariffs, the average price of electricity for industrial customers in Germany is above the European Union average and significantly above the average price of power for U.S. industrial customers (German Federal Ministry for Economic Affairs and Energy, 2015).
CONCLUSIONS
The day-ahead market unit commitment problem is the most complex math problem solved by most of the ISO/RTOs that operate power markets. There are many other optimization programs used by ISO/RTOs to schedule and dispatch the electric power system and clear power markets, but they are simplifications of the unit commitment problems.
The most common challenge ISO/RTOs encounter with market-clearing engines, and specifically the unit commitment problem, relates to problem size and scalability. Several factors, including significant increases in bid and offer volumes, large numbers of transmission constraints, and a large number of continuous and binary variables, can slow solution time. The interaction between them can increase problem complexity exponentially.
Progress toward better modeling of ac constraints on the system would significantly advance the accuracy and efficiency of the unit commitment solution and the overall market. The committee envisions that the next-generation grid will only increase in complexity.
Recommendation 1: The Department of Energy should develop and test a full ac optimal power flow (ACOPF) model with an optimization algorithm using all nodes in the market area, taking advantage of supercomputers and parallel processing, and respecting all thermal and voltage constraints.
The committee believes that this research should include several versions of the ACOPF. It should include modeling all nodes in the market area reflecting different degrees of nonlinearity, size, and connectedness, and respecting all thermal and voltage constraints. In order to enable a solution of the much larger models necessitated by the next-generation grid, computational testing of these models should be undertaken with the flexibility to allow advantage to be taken of advances in high-end computing including parallel and distributed systems. The optimization methods used should reflect a careful examination of the validity and effectiveness of emerging techniques for nonlinear, nonconvex optimization that are based on applying techniques for convex and mixed-integer optimization and reduced-order modeling, as called for in Recommendation 8.
REFERENCES
AEMC (Australian Energy Market Commission). 2015. “National Electricity Market.” http://www.aemc.gov.au/Australias-Energy-Market/Markets-Overview/National-electricity-market. Accessed March 2015.
AEMO (Australian Energy Market Operator). 2014. “AEMO Pivotal to Australia’s Energy Future.” Brochure. http://www.aemo.com.au/~/media/Files/Other/corporate/AEMO_Corp_Brochure14.2.ashx. July.
EEX (Energy Efficiency Exchange). 2015. “How the Energy Market Operates.” http://eex.gov.au/energy-management/energy-procurement/energy-pricing/how-the-energy-market-operates. Accessed March 2015.
EIA (Energy Information Administration). 1993. Public Utility Holding Company Act of 1935: 1935-1992. U.S. Department of Energy. http://www.eia.gov/electricity/archive/0563.pdf. Accessed March 2015.
FERC (Federal Energy Regulatory Commission). 2015a. “Electric Power Markets: Northwest.” http://www.ferc.gov/market-oversight/mktelectric/northwest.asp. Accessed March 2015.
FERC. 2015b. “Electric Power Markets: Southeast.” http://www.ferc.gov/market-oversight/mkt-electric/southeast.asp. Accessed March 2015.
FERC. 2015c. “Electric Power Markets: Southwest.” http://www.ferc.gov/market-oversight/mkt-electric/southwest.asp. Accessed December 15, 2015.
FERC. 2015d. “History of FERC.” http://www.ferc.gov/students/ferc/history.asp. Accessed March 2015.
German Federal Ministry for Economic Affairs and Energy. 2015. “Energy of the Future: An Overall Strategy for the Energy Transition.” http://www.bmwi.de/EN/Topics/Energy/Energy-Transition/overall-strategy.html. Accessed March 2015.
German Transmission System Operators. 2015. “Market for Control Reserve in Germany.” https://www.regelleistung.net/ip/action/static/market-information. Accessed March 2015.
IRC. 2014. “Market Design Executive Summary.” IRC Markets Committee. October 9. http://ircweb.businesscatalyst.com/Documents/Report/20150312_2014IRCMarketDesignExecutiveSummary.pdf.
IRC (Independent System Operator/Regional Transmission Organization (ISO/RTO) Council). 2015. “About the IRC.” http://www.isorto.org/about/default. Accessed March 2015.
NERC (North American Electric Reliability Corporation). 2013a. “History of NERC.” http://www.nerc.com/AboutNERC/Documents/History%AUG13.pdf. August.
NERC. 2013b. “Regional Entities.” http://www.nerc.com/AboutNERC/keyplayers/Pages/Regional-Entities.aspx. Accessed March 2015.


