
5
Preparing for the Future
INTRODUCTION
Planning the foundations of analytic research for the next-generation electric grid requires consideration of how the grid is likely to change in the future. That is the focus of this chapter. However, in preparing for the future it is prudent to contemplate a quote from Winston Churchill: “It is always wise to look ahead, but difficult to look further than you can see.”1 The future is always uncertain, and in planning foundational research it would be a mistake to think that the future is just some extrapolated view of the present. There will always be disruptive technologies, as central station electricity itself was disruptive to the economy of the 1880s. Hence the focus of this chapter is not to try to predict a single most likely scenario, but rather to explore the range of uncertainties that could unfold. The ultimate goal is to present research foundations that can future-proof the grid so that regardless of how the grid evolves, the United States is prepared.
UNCERTAINTY IN WHAT LIES AHEAD
The grid of today is changing with the rapid integration of renewable energy resources such as wind and solar photovoltaic (PV) and the retirement of substantial amounts of coal generation. For example, in early 2015 in the United States, there was installed capacity of about 65 GW of wind and 9 GW of solar PV (out of a total of 1,070 GW), from less than 3 GW of wind and 0.4 GW of solar just 15 years back (EIA, 2009). However, this needs to be placed in context by noting that during the natural gas boom in the early 2000s, almost 100 GW of natural gas capacity was added in just 2 years! And solar thermal, which seemed so promising in 2009, has now been mostly displaced by solar PV because of dropping prices for the PV cells. Further uncertainty arises because of the greater coupling of the electric grid to other infrastructures such as natural gas, water, and transportation. Finally, specific events can upset the best predictions. An example is the Japanese tsunami in 2011, which (among other factors) dimmed the prospects for a nuclear renaissance in the United States and elsewhere.
Some of the uncertainty currently facing the industry is illustrated in Figure 5.1. The drivers of this uncertainty are manifold: (1) cyber technologies are maturing and are becoming available at reasonable cost—these include sensing, such as phasor measurement units (PMUs), communications, control, and computing; (2) emergence of
___________________
1 National Churchill Museum, “Winston Churchill and the Cold War,” https://www.nationalchurchillmuseum.org/winston-churchill-and-thecold-war.html. Accessed September 15, 2015.
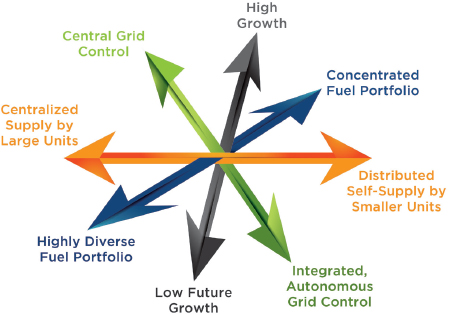
qualitatively new resources, such as renewable distributed energy resources (DERs)—PVs, wind generation, geothermal, small hydro, biomass, and the like; (3) new quest for large-scale storage—stationary batteries, as well as low-cost storage batteries such as those for use in electric vehicles; (4) changing transmission technologies such as increased use of flexible ac transmission system (FACTS) technologies and/or increased use of high-voltage direct current (HVDC) lines and the integration of other dc technologies; (5) environmental objectives for reducing pollutants; (6) industry reorganization, from fully regulated to service-oriented markets; and (7) the need for basic electrification in developing countries, which affects the priorities of equipment suppliers. Given these drivers, it is hard to predict exactly long-term power grid scenarios. However, to help future-proof the grid, the committee offers the advice that follows in the remaining sections of this chapter.
TECHNOLOGIES THAT WILL ENHANCE THE OBSERVABILITY OF THE GRID
Since the advent of the electric power grid, measurement technologies have been a necessary component of the system for both its protection and its control. For example, measuring the currents flowing in the power system wires and the bus voltages are two key quantities of importance. The currents are measured using current transformers, which convert the magnetic field of the primary circuit to a proportionally smaller current suitable for input to instrumentation. The voltages are measured using potential transformers (PTs), which utilize traditional transformer technology of two windings coiled on a common magnetic core to similarly proportionally reduce the line voltage to a voltage suitable for instrumentation. Through the middle of the 20th century higher voltages and coupled capacitive voltage transformers used capacitors as a voltage divider as a more practical alternative to a PT for extra-high-voltage transmission. Other instruments exploiting either the electric or the magnetic fields have been developed. More recently, optical sensors can convert the voltages and currents as a directly measured quantity (Niewczas and McDonald, 2007).
Bringing these measurements to a central location has been possible for many decades. Technologies such as Supervisory Control and Data Acquisition (SCADA) use specialized protocols to transmit the information gathered in substations through analog-to-digital conversion in various sensors that are directly connected to remote terminal units (RTUs). A typical SCADA architecture exchanges both measurement and control information between the front end processor in the control center and the RTUs in the substations. Modern SCADA protocols support
reporting of exceptions in addition to more traditional polling approaches. These systems are critical to providing control centers with the information necessary to operate the grid and to providing control signals to the various devices in the grid to support centralized control and optimization of the system.
SCADA systems in use today have two primary limitations. First, they are relatively slow. Most systems poll once every 4 sec, with some of the faster implementations gathering data at a 2-sec scan rate. Second, they are not time synchronized. Often, the data gathered in the substation and passed to the central computer are not timestamped until they are registered into the real-time database at the substation. And as the information is gathered through the polling cycle, sometimes there can be a difference between the pre- and postevent measurements if something happens during the polling cycle itself.
First described in the 1980s (Phadke et al., 1983), the PMUs mentioned in earlier chapters utilize the precise time available from systems such as the Global Positioning System. The microsecond accuracy available is reasonable for the accurate calculation of phase angles of various power system quantities. More broadly, high-speed time-synchronized measurements are broadly referred to as wide area measurement systems. These underwent significant development beginning in the 1990s and can now provide better measurements of system dynamics with typical data collection rates of 30 or more samples per second. Significant advances in networking technology within the past couple of decades have enabled wide area networks by which utilities can share their high-speed telemetry with each other, enabling organizations to have better wide area situational awareness of the power system. This is addressing one of the key challenges that was identified and formed into a recommendation following the August 14, 2003, blackout (U.S.-Canada Power System Outage Task Force, 2004).
There are several benefits of wide area measurement systems. First, because of the high-speed measurements, dynamic phenomena can be measured. The 0.1- to 5-Hz oscillations that occur on the power system can be compared to simulations of the same events, leading to calibration that can improve the power system models. It is important to have access to accurate measurements corresponding to the time scales of the system. Second, by providing a direct measure of the angle, there can be a real-time correlation between observed angles and potential system stress.
The measurements from PMUs, known as synchrophasors, can be used to manage off-normal conditions such as when an interconnected system breaks into two or more isolated systems, a process known as “islanding.” For example, during Hurricane Gustav, in September 2008, system operators from Entergy (the electric utility company serving the impacted area in Louisiana) were able to keep a portion of the grid that islanded from the rest of the Eastern Interconnection operating after the storm damage took all of the transmission lines out of service, isolating a pocket of generation and load. The isolated area continued to operate by balancing generation and load. The system operators credited synchrophasor technology with allowing them to keep this island operational during the restoration process (NERC, 2010).
Researchers are looking at PMU data to expedite resolution of operating events such as voltage stability and fault location and to quickly diagnose equipment problems such as failing instrument transformers and negative current imbalances. More advanced applications use PMU data as inputs to the special protection systems or remedial action schemes, mentioned in Chapter 3 for triggering preprogrammed automated response to rapidly evolving system conditions.
All telemetry is subject to multiple sources of error. These include but are not limited to measurement calibration, instrumentation problems, loss of communications, and data drop-outs. To overcome these challenges, state estimation, introduced in Chapter 3, is used to compute the real-time state of the system. This is a model-fitting exercise, whereby the available data are used to determine the coefficients of a power system model. A traditional state estimator requires iteration to fit the nonlinear with the available measurements. With an overdetermined set of measurements, the state estimation process helps to identify measurements that are suspected of being inaccurate. Because synchrophasors are time aligned, a new type of linear state estimator has been developed and is now undergoing widespread implementation (Yang and Bose, 2011). The advantage of “cleaning” the measurements through a linear state estimator is that the application is not subject to the data quality errors that can occur with the measurement and communications infrastructure. Additional advances are under way, including distributed state estimation and dynamic state estimation.
One of the more recent challenges has been converting the deluge of new measurements available to a utility, from synchrophasors and other sources, into actionable information. Owing to the many more points
of measurement available to a utility from smart meters and various distribution automation technologies, all organizations involved in the operation of the electric power grid are faced with an explosion of data and are grappling with techniques to utilize this information for making better planning and/or operational decisions. Big data analytics is being called on to extract information for enhancing various planning and operational applications.
One such challenge includes the improved management of uncertainty. Whether it be the uncertainty associated with estimating future load or generation availability or the uncertainty associated with risks such as extreme weather or other natural or manmade disaster scenarios that could overtake the system, more sophisticated tools for characterizing and managing this uncertainty are needed.
Better tools to provide more accurate forecasting are also needed. One promising approach is through ensemble forecasting methods, in which various forecasting methods are compared with one another and their relative merits used to determine the most likely outcome (with appropriate confidence bounds). One such example is an ensemble-based Bayesian model averaging technique (Vlachopoulou et al., 2013).
Finally, better decision support tools, including intelligent alarm processors and visualization, are needed to enhance the reliability and effectiveness of the power system operational environment. Better control room automation over the years has provided an unprecedented increase in the effectiveness with which human operators handle complex and rapidly evolving events. During normal and routine situations, the role of the automation is to bring to the operator’s attention events that need to be addressed. However, during emergency situations, the role of the automation is to prioritize actions that need to be taken. Nevertheless, there is still room for improving an operator’s ability to make informed decisions during off-normal and emergency situations. More effective utilization of visualization and decision-support automation is still evolving, and much can be learned by making better use of the social sciences and applying cognitive systems engineering approaches.
TECHNOLOGIES THAT WILL ENHANCE THE CONTROLLABILITY OF THE GRID
The value of advanced analytics is only as good as our ability to effect change in the system based on the result of those analytics. Whether it is manual control with a human in the loop or automated control that can act quickly to resolve an issue, effective controls are essential. The power system today relies on the primary, secondary, and tertiary hierarchical control strategies that were introduced in Chapter 4 to provide various levels of coordinated control. This coordination is normally achieved through temporal and spatial separation of the various controls that are simultaneously operating. For example, high-speed feedback in the form of proportional-integral-derivative controls operates at power plants to regulate the desired voltage and power output of the generators. Supervisory control in the form of set points (e.g., maintain this voltage and that power output) is received by the power plant from a centralized dispatcher. Systemwide frequency of the interconnected power system is accomplished through automatic generation control, which calculates the desired power output of the generating plants every 4 sec.
Protection schemes that are used to isolate faults rely on local measurements to make fast decisions, supplemented by remote information through communications to improve the accuracy of those decisions. Various teleprotection schemes and technologies have been developed over the past several decades to achieve improved reliability by leveraging available communications technologies. In addition, microprocessor-based protective relays have been able to improve the selectivity and reliability of fault isolation, including advanced features such as fault location. One example is the ability to leverage traveling wave phenomena that provide better accuracy than traditional impedance-based fault location methods (IEEE, 2015).
All of these methods described above have one thing in common: judicious use of communications. For historical reasons, when communications were relatively expensive and unreliable, more emphasis was placed on local measurements for protection and control. Communications were used to augment this local decision making. With the advent of more inexpensive (and reliable) communication technologies, such as fiber-optic links installed on transmission towers, new distributed control strategies are beginning to emerge. Additionally, classical control approaches are being challenged by the increased complexity of distribution networks, with more distributed generation, storage, demand response, automatic feeder switching, and other technologies that are dramatically
changing the distribution control landscape. It will soon no longer be possible to control the power system with the control approaches that are in use today.2
One of the approaches being considered is more comprehensive application of market-based, real-time control signals that traverse the entire electricity delivery infrastructure, from transmission to distribution, including supply and end use. One such approach that has been proposed is “transactive energy” or, alternatively, “transactive control.”3 This approach will enable the supplier to communicate the availability of power given the various real-time constraints at the point of delivery and provide an opportunity for consumers to communicate their willingness to curtail the delivery of their power as conditions dictate.
Perhaps the biggest challenge underlying the mathematical and computational requirements for this research is the fact that any evolution from today’s operating and control practices will require that newly proposed methods cannot be best-effort methods; instead, a guaranteed performance (theoretical and tested) will be required if any new methods unfamiliar to the system operators are to be deployed. Today there is very little theoretical foundation for mathematical and computational methods capable of meeting provable performance goals over a wide range of operating conditions. More specifically, to arrive at the new mathematical and computational methods needed for the power system, one must recognize that the power system represents a very large-scale, complex, and nonlinear dynamic system with multiple time-varying interdependencies. A systematic framework for modeling, defining performance objectives, ensuring control performance, and providing multidimensional optimization will be helpful.
EFFECTS OF CLIMATE CHANGE
Many of the assumptions associated with the long-term operation of the electricity infrastructure are based on climatic conditions that prevailed in the past century. Climate changes appear likely to change some of those basic planning assumptions.
If policy changes are made to mitigate carbon emissions, parallel changes to the entire power generation infrastructure and the transmission infrastructure connecting our sources of electricity supply will be necessary. This gets into institutional issues such as the availability of capital investment to accommodate these changes, and policies associated with how to recover the costs of the investments. The traditional utility business model would need to be changed to accommodate these developments (Finnigan, 2014).
If the average intensity of storms increases, or if weather events become more severe (hotter summers and/or colder winders), basic assumptions about the cost effectiveness of design trade-offs underlying the electric power infrastructure would need to be revisited. Examples of this are the elements for hardening the system against wind or water damage, the degree of redundancy that is included to accommodate extreme events, and the extent to which dual-fueled power plants are required to minimize their dependency on natural gas.
MATHEMATICAL AND COMPUTATIONAL CHALLENGES IN GRID ARCHITECTURES
At present, the system is operated according to practices whose theoretical foundations require reexamination. In one such practice, industry often uses linearized modes in order to overcome nonlinear temporal dynamics. For example, local decentralized control relies on linear controls with constant gain. While these designs are simple and straightforward, they lack the ability to adapt to changing conditions and are only valid over the range of operating conditions that their designers could envision. If the grid is to operate in a stable way over large ranges of disturbances or operating conditions, it will be necessary to introduce a systematic framework for deploying more sensing and control to provide a more adaptive and nonlinear dynamics-based control strategy. Similarly, to overcome nonlinear spatial complexity, the system is often modeled assuming weak interconnections of subsystems with stable and predictable boundary conditions between each, while assuming that only fast controls are
___________________
2 Hawaiian Electric Company, Inc., “Issues and Challenges,” http://www.hawaiianelectric.com/heco/Clean-Energy/Issues-and-Challenges. Accessed December 1, 2015.
3 Pacific Northwest SMART GRID Demonstration Project, “Our Electricity System Is Changing,” last modified April 2015, http://www.pnwsmartgrid.org/transactive.asp. Accessed December 1, 2015.
localized. Thus, system-level models used in computer applications to support various optimization and decision-support functions generally assume steady-state conditions subject to linear constraints. As power engineers know, sometimes this simplifying assumption is not valid.
Other open mathematical and computational challenges include integrating more nondispatchable generation in the system or other optimized adjustment of devices or control systems. These opportunities for advancing the state of the art for computing technologies could be thoughts of as “deconstraining technologies”: The nonlinear ac optimal power flow can be used to help reduce the risk of voltage collapse and enable lines to be used within the broader limits; FACTS, HVDC lines, and storage technology can be used for eliminating stability-related line limits; and so on.
The problem of unit commitment and economic dispatch subject to plant ramping rate limits needs to be revisited in light of emerging technologies. It is important to recognize that ramping rate limits result from constraints in the energy conversion process in the power plant. But these are often modeled as static predefined limits that do not take into account the real-time conditions in the actual power generating facility. This is similar to the process that establishes thermal line limits and modifies them to account for voltage and transient stability problems. As the dynamic modeling, control, and optimization of nonlinear systems mature, it is important to model the actual dynamic process of energy conversion and to design nonlinear primary control of energy conversion for predictable input-output characteristics of the power plants.
In closing, instead of considering stand-alone computational methods for enhancing the performance of the power system, it is necessary to understand end-to-end models and the mathematical assumptions made for modeling different parts of the system and their interactions. The interactions are multitemporal (dynamics of power plants versus dynamics of the interconnected system, and the role of control); multispatial (spanning local to interconnection-wide); and contextual (i.e., performance objectives). It will be necessary to develop a systematic framework for modeling and to define performance objectives and control/optimization of different system elements and their interactions.
MATHEMATICAL AND COMPUTATIONAL CHALLENGES IN LOCAL DISTRIBUTION GRID ARCHITECTURES
Today transmission and distribution are often planned and operated as separate systems. The fundamental assumption is that the transmission system will provide a prescribed voltage at the substation, and the distribution system will deliver the power to the individual residential and commercial customers. Historically, there is very little feedback between these separate systems beyond the transmission system operator needing to know the amount of power that needs to be delivered and the distribution system operator knowing what voltage to expect. It has been increasingly recognized, however, that as different types of distributed energy resources, including generation, storage, and responsive demand, are embedded within the distribution network, different dynamic interactions between the transmission and distribution infrastructure may occur. One example is the transient and small-signal stability issues of distributed generation that changes the dynamic nature of the overall power system (Donnelly et al., 1996; Cardell and Ilic, 2004; Nazari and Ilic, 2010). It will be important in the future to establish more complete models that include the dynamic interactions between the transmission and distribution systems.
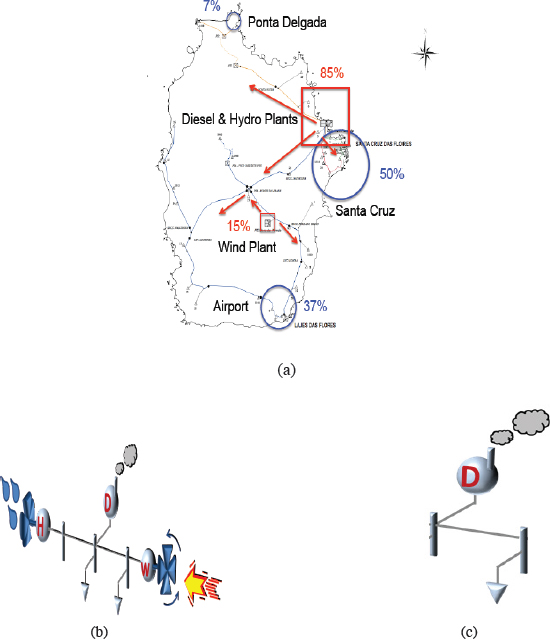
In addition, there is a need for better planning models for designing the sustainable deployment and utilization of distributed energy resources. It is critical to establish such models to support the deployment of nondispatchable generation, such as solar, with other types of distributed energy resources and responsive demand strategies. To illustrate the fundamental lack of modeling and design tools for these highly advanced distribution grids, consider a small, real-world, self-contained electric grid of an island (Ilic et al., 2013). Today’s sensing and control are primarily placed on controllable conventional power plants since they are considered to be the only controllable components. Shown in Figure 5.2a is the actual grid, comprising a large diesel power plant, small controllable hydro, and wind power plant. Following today’s modeling approaches, this grid gets reduced to a power grid, shown in Figure 5.2b, in which the distributed energy resources are balanced with the load. Moreover, if renewable plants (hydro and wind) are represented as a negative predictable load with superposed disturbances, the entire island is represented as a single dynamic power plant connected to the net island load (Figure 5.2c).
In contrast with today’s local grid modeling, consider the same island grid in which all components are kept and modeled (see Figure 5.3). The use of what is known as advanced metering infrastructure (AMI) allows information about the end user electricity usage to be collected on an hourly (or more frequent) basis. Different models are needed to exploit this AMI-enabled information to benefit the operating procedures used by the distribution system operator (DSO) in charge of providing reliable uninterrupted electricity service to the island. Notably, the same grid becomes much more observable and controllable. Designing adequate SCADA architecture for integrating more PVs and wind power generation and ultimately retiring the main fossil power plants requires such new models. Similarly, communication platforms and computing for decision making and automation on the island require models that are capable of supporting provable quality of service and reliability metrics. This is particularly
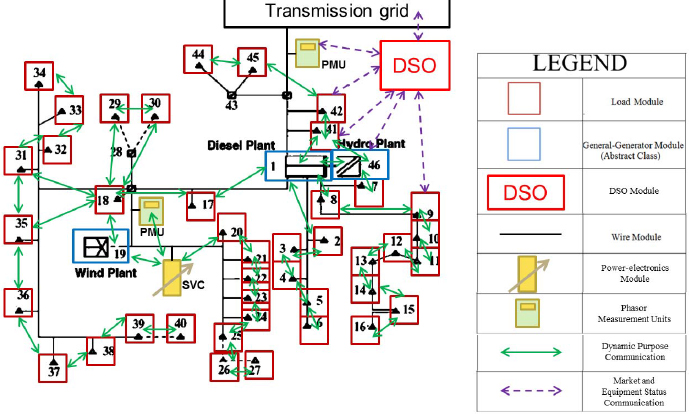
important for operating the island during equipment failures and/or unexpected variations in power produced by the distributed energy resources. The isolated grid must remain resilient and have enough storage or responsive demand to ride through interruptions in available power generation without major disruptions. Full distribution automation also includes reconfiguration and remote switching.
MATHEMATICAL AND COMPUTATIONAL CHALLENGES IN MANAGING INTERDEPENDENCIES BETWEEN THE TRANSMISSION AND LOCAL DISTRIBUTION GRIDS/MICROGRIDS
Based on the preceding description of representative power grid architectures, it is fairly straightforward to recognize that different grid architectures present different mathematical and computational challenges for the existing methods and practices. These new architectures include multiscale systems that range temporally between the relatively fast transient stability–level dynamics and slower optimization objectives. They consist, as well, of nonlinear dynamical systems, where today’s practice is to utilize linear approximations, and large-scale complexity, where it is difficult to completely model or fully understand all of the nuances that could occur, if only infrequently, during off-normal system conditions but that must be robustly resisted in order to maintain reliable operations at all times. In all these new architectures the tendency has become to embed sensing/computing/control at a component level. As a result, models of interconnected systems become critical to support communications and information exchange between different industry layers. These major challenges then become a combination of (1) sufficiently accurate models relevant for computing and decision making at different layers of such complex, interconnected grids, (2) sufficiently accurate models for capturing the interdependencies/dynamic interactions, and (3) control theories that can accommodate adaptive and robust distributed, coordinated control. Ultimately,
advanced mathematics will be needed to design the computational methods to support various time scales of decision making, whether it be fast automated controls or planning design tools.
REFERENCES
Cardell, J., and M. Ilic. 2004. Maintaining stability with distributed generation in a restructured industry. Pp. 2142-2149 in IEEE Power Engineering Society General Meeting. doi:10.1109/PES.2004.1373260.
Donnelly, M.K., J.E. Dagle, D.J. Turdnowski, and G.J. Rogers. 1996. Impacts of the distributed utility on transmission system stability. IEEE Transactions on Power Systems 11(2):741-746.
EIA (Energy Information Administration). 2009. Electric Power Annual. http://www.eia.gov/electricity/annual/. Accessed December 1, 2015. Finnigan, J. 2014. Changing times for electric utilities. Forbes Magazine. March 7.
IEEE. 2015. IEEE Guide for Determining Fault Location on AC Transmission and Distribution Lines. IEEE Standard C37.114-2014. doi:10.1109/IEEESTD.2015.7024095.
Ilic, M., L. Xie, and Q. Liu (eds.). 2013. Engineering IT-Enabled Sustainable Electricity Services: The Tale of Two Low-Cost Green Azores Islands. Springer, New York, N.Y.
Ilic, M., K. Bachovchin, M. Cvetkovic, X. Miao, and A. Hsu. 2014. Physics-based foundations for cyber and market design in complex electric energy systems. Pp. 4635-4654 in IEEE Proceedings of the 53rd Annual Conference on Decision and Control (CDC). doi:10.1109/CDC.2014.7040113.
Nazari, M.H., and M. Ilic. 2010. Potential for efficiency improvement of future electric energy systems with distributed generation units. Pp. 1-9 in IEEE 2010 Power and Energy Society General Meeting. doi:10.1109/PES.2010.5589994.
NERC (North American Electric Reliability Corporation ). 2010. Real-Time Application of Synchrophasors for Improving Reliability. Princeton, N.J. October 18. http://www.nerc.com/docs/oc/rapirtf/RAPIR%20final%20101710.pdf.
Niewczas, P., and J.R. Mcdonald. 2007. Advanced optical sensors for power and energy systems applications. IEEE Instrument and Measurement Magazine 10(1):18-28.
Phadke, A.G., J.S. Thorp, and M.G. Adamiak. 1983. A new measurement technique for tracking voltage phasors, local system frequency, and rate of change of frequency. IEEE Transactions on Power Apparatus and Systems PAS-102(5):1025-1038.
U.S.-Canada Power System Outage Task Force. 2004. Final Report on the August 14, 2003 Blackout in the Unites States and Canada: Causes and Recommendations. April. http://energy.gov/sites/prod/files/oeprod/DocumentsandMedia/BlackoutFinal-Web.pdf.
Vlachopoulou, M., L. Gosink, T.C. Pulsipher, T. Ferryman, N. Zhou, and J. Tong. 2013. An ensemble approach for forecasting net interchange schedule. Pp. 1-5 2013 IEEE Power and Energy Society (PES) General Meeting. doi:10.1109/PESMG.2013.6672760.
Yang, T., and A. Bose. 2011. Fast estimation of the state of the power grid using synchronized phasor measurements. Pp. 5960-5963 in 2011 IEEE International Conference on Acoustics, Speech and Signal Processing (ICASSP). doi:10.1109/ICASSP.2011.5947719.


