
MEASURING MENTAL AND SUBSTANCE USE DISORDERS
IN THE GLOBAL BURDEN OF DISEASE STUDY
Theo Vos (University of Washington) discussed the Global Burden of Disease (GBD) study, focusing on estimates of mental and substance use disorders. He described the GBD as a systematic scientific effort to quantify the comparative magnitude of health loss due to diseases, injuries, and risk factors by age, sex, and geographic areas for specific points in time. The emphasis is on the concept of health loss, rather than a broader concept of general welfare loss.
Vos explained that the GBD is based on three key principles: (1) everyone deserves to live a long life in full health; (2) searching for answers to what is preventing people from achieving that goal; and (3) mapping out a comprehensive picture of what disables and kills people across countries, time, ages, and by gender. The GBD measures health loss for a population in comparison with a reference or a normative goal for a population that is living in full health with a life expectancy at birth of 86 years. As derived from a life table, at age 86 one still has remaining life expectancy. Even at age 105, according to the standard life table, one can expect 1½ additional years of life.
Vos explained further that the GBD values disabling consequences equally across countries and over time: this explicit egalitarian approach is used because the goal for everyone is the same, no matter where they live. The GBD’s main measure is the disability-adjusted life year (DALY), which combines mortality and disability information in a time metric.
Mortality is translated into years of life lost due to premature mortality, calculated by number of deaths multiplied by the remaining life expectancy from the standard. For disability, the GBD estimates the years of life lost due to time lived in states of less than full health: it is calculated by the prevalence of diseases and all the major disabling consequences of diseases, which are termed sequelae. Each sequela is multiplied by a severity weight between 0 and 1. This indicates the relative severity of that particular sequela relative to all other sequelae, and is anchored by zero disability (full health) to 100 percent loss of health at death.
The GBD study, commissioned by the World Bank, started in the early 1990s. Since 1997, it has been funded largely by the Bill & Melinda Gates Foundation, along with other sources of funding. The study design underwent several ad hoc revisions and updates in the 1990s. These revisions led to reduced internal consistency between estimates, which caused the team to revisit the methods in the 2000s. A capstone paper based on GBD was published in 2015,1 which represented a commitment for future annual updates of all of the data. The version dubbed GBD 2015 is under way and is expected to be published in the first half of 2016. Vos emphasized that the GBD is a “public good” that is the work of a network of over 1,400 recognized international collaborators with representation by 106 countries.
The GBD currently examines approximately 320 disease and injury categories. The number of sequelae is well over 2,000. A very large chunk of the latter are the sequelae related to the causes and nature of various injuries. For example, fractures, contusions, and head injury fall into 48 categories, but they are multiplied by 27 causes of injury. Currently, 78 individual risk factors or combinations of risk factors are taken into account.
Estimates are made for 188 countries in the world. Increasingly, subnational estimates are also produced based on the data to meet policy needs. For the GBD 2013, subnational estimates were provided for provinces in China, states in Mexico, and 11 delineations of the United Kingdom. For the current version they are making estimates by state for the United States, by prefecture for Japan, by province for South Africa, by district for Kenya, and by state for Brazil.
Vos provided an overview of the data collection and estimation steps, which start with a demographic component that estimates the total level
________________
1 Global Burden of Disease Study 2013 Collaborators. (2015). Global, regional, and national incidence, prevalence, and years lived with disability for 301 acute and chronic diseases and injuries in 188 countries, 1990-2013: A systematic analysis for the Global Burden of Disease study 2013. The Lancet, 386(9995), 743-800. Available: http://www.thelancet.com/pdfs/journals/lancet/PIIS0140-6736(15)60692-4.pdf [February 2016].
of mortality regardless of cause and yields the total number of deaths. Cause-of-death information is collected from vital registrations in an increasing number of countries, with increasing levels of completeness and better quality. These data are supplemented with verbal autopsy information from many countries that do not have functional vital registration systems. Police records and mortuary records are also used. Vos said that a significant effort is involved in cleaning the data from different sources and editing them for consistency in order to make them usable in statistical modeling. An additional step involves scaling all of the individual cases by demographics and time to provide estimates of years of life lost. Another major task involves attributing diseases to underlying risk factors or combinations of risk factors.
Producing the disability estimates involves deriving the disability weights and combining them with severity distributions, because many of the major disabling conditions have a very wide range of severity. Estimates of years lived with disability are produced after a comorbidity simulation is performed. The team also conducts systematic reviews of epidemiological parameters, largely incidence and prevalence, but also “risk of death,” and remission, which is defined as a cure rate, meaning an individual is totally free of disease and severity distributions. A tool was specifically developed for these purposes called DisMod-MR. MR (meta-regression) uses Bayesian statistical techniques, in which fixed effects on the study level characteristics facilitate cross-walking between different recall periods, different instruments, or different case definitions used in the studies in various sites. Fixed effects are also put on any country-level covariates that help predict the estimates: for instance, the per capita alcohol consumption in a country for alcohol use disorders. A hierarchy of random effects is used in which countries are grouped into 21 world regions on the basis of their geography and epidemiological profiles. Those regions are then grouped into seven super-regions.
Disability weights are gathered from nine population surveys and an open-access Internet survey using pair-wise comparisons. Vos said that finding adequate data to use for severity distributions has been one of the bigger challenges for the GBD. For some conditions, comparable information can be obtained from systematic review and using meta-analysis techniques. Mental disorders and musculoskeletal disorders make up more than 50 percent of the estimates of disability, but finding enough comparable information for analysis is the most challenging for these disorders.
As an example, Vos pointed to the estimates produced for major depression among females in the United States, for six time periods. Figure 4-1 shows the prevalence estimates by age groups, with the uncertainty coming from the DisMod-MR tool. The vertical bars are the 95
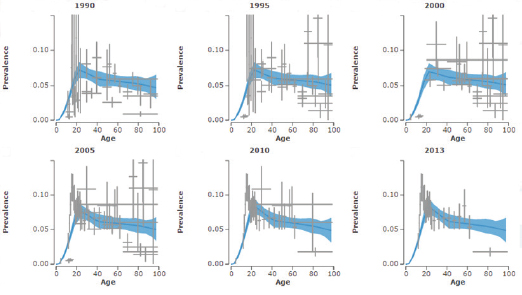
FIGURE 4-1 Estimates of major depression among females in the United States, 1990-2013.
SOURCES: Workshop presentation by Theo Vos, September 2015; data from the Global Burden of Disease study.
NOTE: Global Burden of Disease data and the analysis and visualization tools demonstrated during the workshop are available at http://www.healthdata.org/gbd/data [December 2015].
percent confidence intervals for the data points. The figure illustrates that even after adjusting for the differences in study-level covariates, there are still wide ranges of values, and there are some very high and very low estimates. The next step for the researchers is to try to statistically identify the best estimate, based on all of the available information.
Discussing disability weights in further detail, Vos explained that, in constructing the DALY, disability weights are the bridge between mortality and nonfatal outcomes. To measure health loss from nonfatal outcomes, weights were needed for all of the sequelae defined for the 300+ disorders with nonfatal outcomes. A parsimonious set of 235 health states were determined to cover all of the sequelae. Weights were then established that quantify the severity of outcomes as a percentage reduction from perfect health. For example, if the weight for blindness is 0.2 (i.e., a health loss of 20% resulting from blindness), then, according to the metric, five people living with blindness in a year are equivalent to 1 year of life lost due to disability.
Vos then described the data that provided the estimates for the disability weights. In the GBD 2010, information was collected from more than 30,000 respondents through face-to-face interview surveys in Bangladesh, Indonesia, Peru, and Tanzania; a telephone survey in the United States; and an open-access web survey.2 The survey included 108 of the then 220 health states, but all of the health states were included in the web survey. For the GBD 2013, information came from four European surveys.
Since the GBD 2010, the primary mode in which the responses are elicited is by paired comparisons, in order to make fielding these sorts of questions as simple as possible. Respondents are presented with two descriptions of hypothetical people, each with a randomly selected health state, and then are asked which of the two hypothetical people is the healthier. The questions are chosen for relative ease of administration, comprehension, and analysis. The researchers found that high literacy and numeracy levels were not essential in order for respondents to be able to answer the questions. The health states are presented with a lay description, but without a label to avoid some of the stigma associated with some disorders, such as epilepsy or AIDS.3
The estimated disability weights in the GBD 2010 survey showed considerable consistency among the results in the different sites, with
________________
2 Salomon, J.A., Vos, T., Hogan, D.R., Gagnon, M., Naghavi, M., Mokdad, A., … Murray, C.J.L. (2012). Common values in assessing health outcomes from disease and injury: Disability weights measurement study for the Global Burden of Disease study 2010. The Lancet, 380(9859), 2129-2143.
3 For further details on how the paired comparison questions are asked, see Salomon et al. (2012).
perhaps the exception of Bangladesh, for which the data were “noisier.” Average educational attainment varied across the sites, and it was particularly high in the web survey, which involved a convenience sample that included many respondents with college degrees or higher, but there was still remarkable consistency in the estimated weight results. Further statistical analysis validated the consistency in how people respond to the framing of the questions and the methods that were used, across different geographies.
In examining disability weights across various disorders, which ranged from 0 (no disability) to 1.0 (maximum disability), the researchers found the highest weight for the psychotic phase of schizophrenia (0.77) and the lowest for mild anemia (0.004). The majority of health states were at the lower end of the scale: this finding is important because many of the health states are conditions with high prevalence. The severity of conditions showed internal consistency. For example, the values for depression were 0.16 for mild, 0.41 for moderate, and 0.67 for severe.
Vos noted that the disability weights for the different health states have to be combined with epidemiological data to yield distributions across the different sequelae. Table 4-1 shows the most recent top 20 ranking of disabling conditions globally, with varying levels of severity.
Vos showed the workshop participants one of the GBD’s online data visualization tools with 2013 data years lived with disability, which is the disability component of the DALY. It showed that mental and substance use disorders represent a considerable proportion of the overall burden (21.2%) in the United States, with a very small annual rate of change between 1990 and 2013. He encouraged the workshop participants to explore the data for greater detail on specific disorders, through the GBD study website.4
Vos explained that, for some conditions, there are standard ways of describing severity. For example, vision impairment can be measured by defined thresholds of visual acuity, which is then mapped onto different levels of severity. For a number of diseases, people have converged on using similar sorts of methods over time, such as the Hoehn and Yahr5 classification for Parkinson’s. However, for many disorders, such as dementia, Vos and his colleagues had to search across several studies to get a consistent breakdown by severity for that disorder. Meta-analysis
________________
4 Global Burden of Disease data are available from http://www.healthdata.org/gbd/data. Also see http://vizhub.healthdata.org/gbd-compare/ and http://ihmeuw.org/3qad [December 2015].
5 Hoehn, M.M., and Yahr, M.D. (1967). Parkinsonism: Onset, progression and mortality. Neurology, 17, 427-442.
TABLE 4-1 Top 20 Ranking, Globally, of Disabling Conditions with Levels of Severity, 2013
| Disabling Conditions | Severity | |
| 1. | Low back pain | 8 |
| 2. | Major depression | 4 |
| 3. | Iron deficiency anemia | 3 |
| 4. | Neck pain | 4 |
| 5. | Other hearing loss | 12 |
| 6. | Diabetes | By sequelae |
| 7. | Migraine | 2 |
| 8. | Chronic obstructive pulmonary disease | 4 |
| 9. | Anxiety disorders | 4 |
| 10. | Other musculoskeletal | 7 |
| 11. | Schizophrenia | 2 |
| 12. | Fall | By sequelae |
| 13. | Osteoarthritis | 3 |
| 14. | Refraction and accommodation | 3 |
| 15. | Asthma | 4 |
| 16. | Bipolar disorder | 3 |
| 17. | Dysthymia | 2 |
| 18. | Medication headache | 2 |
| 19. | Dermatitis | 8 |
| 20. | Other mental and substance | 4 |
SOURCES: Workshop presentation by Theo Vos, September 2015; data from the Global Burden of Disease study.
techniques were then used to pool the data on the proportions with mild, moderate, and severe dementia.
For the severity of mental disorders, Vos said he and his colleagues had hoped to obtain comparable information from the World Mental Health Surveys (WMHS), but the data from the Sheehan Disability Scale, which is used by the WMHS, was skewed toward higher proportions of severe disease. There were similar problems in obtaining comparable data for severity in the case of several of the other disabling conditions, such as chronic obstructive pulmonary disease, asthma, osteoarthritis, back pain, and neck pain. Because of this, the GBD research team turned to three surveys with data available at the individual level, along with rich diagnostic information on mental disorders and physical disorders and a general health status measure. In this case, the common measure was the 12-Item Short Form Health Survey (SF-12), which has mental and physical health items. Vos noted that the drawback of the SF-12 is that it is not a freely available measure, but the cost for its use is relatively low.
The SF-12 has been embedded in the Medical Expenditure Panel Survey (MEPS) since 2000 and two waves of the National Epidemiological
Survey on Alcohol and Related Conditions (NESARC) from 2001-2002 and 2004-2005, as well as the Australian Mental Health Survey in 1997. A translation of SF-12 summary scores into the GBD disability weights was derived from small surveys asking individuals to fill in SF-12 based on GBD health as presented with their “lay description.” Thus, for each individual in the survey a measure of the total amount of disability experienced could be derived.
To make estimates for specific disorders, the researchers statistically parsed out the aggregate disability in people who have more than one condition to determine what component of that disability was contributed by each disorder of interest. The GBD relies on the notion that disability is multiplicative rather than additive. If a person has a condition with a severe disability of 0.7 and another condition with a disability of 0.4, then the aggregate is 0.72, calculated as 1– [(1 – 0.7) × (1 – 0.4)].
For each individual, the GBD derives the contribution to the overall disability from each individual disorder. To be consistent with the mapping of all severity distributions and distributions by sequela, the researchers use a continuous measure artificially derived from the SF-12 information to determine the proportions of people who have severe, mild, and moderate disease. The researchers also estimate explicitly the proportion of people who have no disability that can be attributed to the underlying disorder of interest.
Vos stated that the team has learned that not only is it important to take comorbidity into account in the overall estimates of disability, but also that when severity is analyzed, it is necessary to tease out what is contributed to disability by comorbidity and what is contributed by an individual disorder. An advantage of this method is that it can be used consistently across a range of prevalent disabling outcomes, ranging from back pain to mental disorders. The limitation of this method was that the data used were from two high-income countries and that data from the NESARC and the Australian Mental Health Survey are relatively old. It is not clear whether this approach would work equally well in other countries.
Vos further noted that another big disadvantage of having very limited high-quality data on severity is that the GBD cannot capture variations in severity distribution over time that could be attributed to treatment effects. For instance, it cannot capture recent advances in medications for rheumatoid arthritis, which are making a big difference in the severity of symptoms for people with this condition.
Vos concluded that significant progress could be made if greater consistency can be achieved in the way studies measure different levels of severity for major disabling conditions. He encouraged the use of similar methods that can better capture all aspects of diseases of interest and the
use of generic data collection instruments that can provide comparable information across a wide range of diseases. He acknowledged that the GBD approach on severity is limited in its ability to address the need for data on conditions that are not easily captured based on self-report, such as some of the childhood conditions or health states that limit people’s capacity to respond. Possible ways around this include proxy reports and clinician-administered tools.
USING ADMINISTRATIVE DATA, GENERAL HEALTH
SURVEYS, AND PRACTICE-BASED SURVEYS
Mark Olfson (Columbia University) focused on sources of data that differ from the household surveys that were discussed by other presenters. His goal was to discuss how these alternative data sources might be able to contribute to the understanding of mental disorders in the United States and to provide an overview of their limitations, as well as their strengths.
Olfson divided the datasets he covered into three groups: administrative datasets, population-based surveys, and provider-based surveys. He defined administrative datasets as databases that are generated as a by-product of medical billing. These datasets are not assembled with the idea that they are going to provide insights into the prevalence of mental disorders, but it is possible that researchers can obtain some information from them. Although others have discussed population surveys that collect data about mental disorders, Olfson concentrated on other surveys that contain some information about behavioral health, general health, and health care. The provider-based surveys discussed have information about the populations served by health care providers and the services that are delivered.
Administrative Data
As noted during the earlier session (see Chapter 2), electronic health records are limited to the population that uses the health care services. Olfson emphasized that this is true for all encounter data and claims data: it is an important limitation and one that is easy to lose sight of. However, in some cases this limitation may be less of a concern, if there is some evidence that a large proportion of a population of interest uses the services captured in the database, especially if the population is difficult to reach in other ways. For example, this situation might be the case for people with schizophrenia and other psychotic disorders.
It is also important to keep in mind that the diagnoses appearing in encounter databases have been generated by clinicians in the field. As
noted by others during the workshop, there are concerns about the reliability of these diagnoses in comparison with diagnoses that result from applying the DSM criteria in a more systematic way, as would be the case in a structured interview as part of a research study.
One of the potential strengths of administrative data is that there is typically a well-defined sample. Researchers know who is enrolled and typically also have relevant dates associated with each record. In addition to diagnoses, administrative databases also include information about treatment, which allows for an examination of changes in rates of disorders or the natural course of service use over time. This information is more precise than is the information available from population surveys. Although the populations change over time, the databases can provide a steady stream of information.
As has been discussed earlier, the mental disorders of people who do not receive treatment for them are not included in these databases, and the coverage rates vary by disorder. For disorders like circumscribed phobia or alcohol abuse, only 10 or 20 percent of the affected population may be receiving treatment during the course of one year. As pointed out by Regier, only about one-half of the people who meet the criteria for mental disorder on the basis of a structured interview will receive some mental health services in the course of a year, either from the specialized mental health sector or from the general medical sector.
When considering the mental disorders of people who are missing from these claims databases, it is important to recognize that they are not missing at random. The mental disorders that are captured in the claims data tend to be more severe, and people who are included tend to have other characteristics that are associated with treatment seeking.
For example, one study found that among people with diabetes who meet depression threshold with a Patient Health Questionnaire (PHQ) score of at least 10, about one-half were clinically detected and would be represented in a claims database in the course of a year, and the other half were clinically undetected and thus would not be in a claims database.6 The disorders that are present in a claims database tend to be associated with people who are somewhat younger, somewhat more severely depressed, and have more comorbidity, with a higher rate of panic attacks than those not in the claims database. In other words, those disorders included in the claims database are not representative of the disorders in the overall population.
Another limitation is illustrated by a study using data from local
________________
6 Katon, W.J., Simon, G., Russo, J., Von Korff, M., Lin, E.H., Ludman, E., Ciechanowski, P., and Bush, T. (2004). Quality of depression care in a population-based sample of patients with diabetes and major depression. Medical Care, 42(12), 1222-1229.
clinics in Pittsburgh.7 This study involved administering the Structured Clinical Interview for DSM (SCID) to patients and comparing them with chart diagnoses. The agreement was low, with kappa values in the slight to fair range, even when using broad diagnosis criteria. For more refined diagnoses, such as type 2 bipolar disorder in remission, the kappa values would be especially low. Olfson reiterated that it is important to be cautious about assuming that diagnoses appearing in claims databases are the same as the diagnoses obtained from administering a structured psychiatric interview the way it is done in a specialized community epidemiological survey.
Olfson said that there are a wide variety of different types of administrative databases that include both public payers (e.g., Medicaid, Medicare, Veterans Health Administration/Tricare) and commercial insurance (e.g., MarketScan, Health Care Cost Institute, IMS Pharmetrics). The databases share some general characteristics, but they differ in terms of how they are generated, aspects of their basic structure, and therefore their fundamental strengths and weaknesses.
Medicare and Medicaid Data
One of the most important administrative databases in the United States, particularly for adults and young people with more serious psychiatric disorders, is generated by the Medicaid system. Medicaid is the largest public payer for mental health services in the United States, covering about 60 million people. Even though the Medicaid system is quite large, Medicaid beneficiaries are very different from the overall population in terms of the burden of psychiatric disorders. A large proportion of people with severe mental illness are in the Medicaid program. Their eligibility is often due to their disability, not because of poverty, although many of them also have low incomes.
Olfson described a study that used MEPS data to compare the sources of health care coverage for people with schizophrenia: it found that 67 percent reported that they had coverage from Medicaid, 46 percent from Medicare, and 15 percent from private health insurance for at least one day during a given year.8 These rates are very different from the general population. As discussed throughout the workshop, people with
________________
7 Shear, M.K., Greeno, C., Kang, J., Ludewig, D., Frank, E., Swartz, H.A., and Hanekamp, M. (2000). Diagnosis of nonpsychotic patients in community clinics. American Journal of Psychiatry, 157(4), 581-587.
8 Khaykin, E., Eaton, W., Ford, E., Anthony, C.B., and Daumit, G.L. (2010). Health insurance coverage among persons with schizophrenia in the United States. Psychiatric Services, 61(8), 830-834.
schizophrenia are a difficult population to reach with traditional surveys because of nonresponse and because the prevalence rate is relatively low. However, a great majority of adults with schizophrenia are included in the Medicaid and Medicare databases, which perhaps represents another approach counting persons with mental illness that are missing from community surveys.
Commercial Insurance Administrative Data
The second major source of administrative claims data is commercial insurance databases, which generally have similar structures. Olfson said that their weaknesses and limitations are similar to those of the Medicaid and Medicare databases, in terms of only having information about treated populations, that is, not representing the entire population. They also have further limitations. They tend not to collect data on race and ethnicity, and they are generally not as rich in other demographic and geographic information as are the Medicaid and Medicare databases. It may also be more difficult to link them to other data sources. On the positive side, data from commercial insurance databases tend to be available more rapidly than the national Medicare data, which have a lag of about 2 years, and national Medicaid data, which have a lag of 3-4 years.
Summarizing the strengths of administrative claims data in comparison with population surveys, Olfson pointed out that these sources have fewer problems related to nonresponse and the coverage of difficult-to-survey populations. The data are also less susceptible to response bias. They are not dependent on respondent recall, because they are essentially archival information about visits that occurred and the diagnoses that were assigned. Administrative records are also less susceptible to self-report bias due to stigma, although social processes govern who accesses care and sometimes what diagnoses are entered into claims databases for the purposes of reimbursement. Olfson also reiterated that administrative claims databases have the strengths of being able to provide information about the diagnoses and treatment patterns of some difficult-to-survey populations and, for some of them, of being quite large.
Data from Population Surveys
Olfson then turned to several ongoing, federally funded general health surveys that can be a source of mental health data. He said that, although these surveys cannot produce a precise estimate of the prevalence of individual disorders, they have some information about either treated disorders or distress.
National Health Interview Survey
He first briefly mentioned the National Health Interview Survey (NHIS), which was covered in further detail in the presentation of Stephen Blumberg (National Center for Health Statistics). Olfson noted that the survey, which has been administered continuously since 1957, has a respectable response rate and provides an opportunity for characterizing some aspects of distress through data collected with the K6 instrument (see above). In some years, the NHIS also includes other items that are of interest and relevance to mental health, such as whether a person has ever been told that he or she has bipolar disorder, schizophrenia, mania, or psychosis, as well as a history of mental health care or counseling.
The Behavioral Risk Factor Surveillance System
Box 4-1 provides an overview of another health population survey, the Behavioral Risk Factor Surveillance System (BRFSS), which Olfson pointed out, has the distinct benefit of providing state-level estimates. Very few surveys, other than the National Survey of Drug Use and Health (NSDUH), do so, and for some policy purposes it serves an important function. The BRFSS is a telephone survey, and like most telephone-based surveys, it has a low response rate. In addition to the standard set of questions, states can elect to have additional optional questions administered. The box lists some of these optional state modules that have been administered at different points in time, including measures of depression (PHQ-8), distress (K6), diagnoses of anxiety and depression, and treatment related to mental health condition. Olfson noted that the PHQ-8 is the same instrument as the PHQ-9, but without the ninth item that asks about self-harm and suicide.
The National Health and Nutrition Examination Survey
Olfson then briefly highlighted the National Health and Nutrition Examination Survey (NHANES), which involves mobile survey units sent to local communities. The survey produces national estimates based on interviews with approximately 5,000 adults over two administration periods. Box 4-2 provides an overview of the NHANES and shows the mental health information that is collected as part of the survey. This includes the PHQ-9, which gives a more robust measure of depression with the inclusion of the ninth item on suicidality. Olfson added that the NHANES has a richer array of general medical information and physical health information than many other federal surveys. He pointed out that the NHANES has a rather narrow range of person-level psychopathology
BOX 4-1
Behavioral Risk Factor Surveillance System (BRFSS)
Size: 450,000 adults/year
Informant: Individual self-report
Design: State-based, telephone survey, state-based weights forced to U.S. population
Mental health information (optional state modules):
- PHQ-8 [Patient Health Questionnaire] (45 states in 2006 and 2008, 12 in 2010)
- Lifetime diagnosis of anxiety, lifetime diagnosis of depression (2006, 2008, 2010)
- K6: past 30 days (2007, 2009) (37 states)
- Mentally unhealthy days in last 30 days: 1 item, 50 states (2007, 2009)
- Treatment related to mental health condition: 1 item, 50 states (2007, 2009)
Strengths:
- State-level estimates
- Large sample size
Limitations:
- Few years
- Did not cover cellular phones before 2011 or those without phones
- Recall bias and social desirability effects
- Low response rates
SOURCE: Workshop presentation by Mark Olfson, September 2015.
data, although different modules have been used in previous years. The structure of the survey allows researchers to combine several years of data to accrue a larger sample and derive more stable estimates.
The Medical Expenditure Panel Survey
Olfson next described the MEPS, noting that Vos had also discussed it as one of the datasets used in the Global Burden of Disease study (see above). Olfson pointed out that the MEPS has elements of interest to mental health services researchers. As shown in Box 4-3, the MEPS is an annual community-based survey, with a sample based on the NHIS. Household respondents report on family members’ service use. The survey also includes the SF-12, PHQ-2, and K6. Outpatient service data from the MEPS have shown reasonable psychometric properties when compared with confirmed diagnoses in primary care samples.
Olfson said that estimates are derived every year and that the survey provides valuable trend data. One of the problems that the MEPS has struggled with, as other surveys, is decreasing response rates. Because of the gradual decline in the response rates, there are questions about whether results are as representative as they were in years past.
Olfson reiterated that he was only covering basic information about the population surveys he discussed, but as potential sources of existing data, they have several strengths: they are representative of the general population; unlike the administrative data sources, they yield information on untreated individuals; they are typically administered on an annual basis; and they can be analyzed cross-sectionally and over time. The drawbacks are that they do not have large sections dedicated to the assessment of mental health; they tend to cover only household populations, not people who are institutionalized in various settings; and their response rates have been declining.
BOX 4-2
National Health and Nutrition Examination Survey (NHANES)
Size: 5,000 adults/year
Informant: Individual self-report, physical health examination, lab testing
Design: Cross sectional, complex sampling, noninstitutionalized population
Mental health information:
- PHQ-9 [Patient Health Questionnaire], sleep disorders questionnaire, smoking status, mentally unhealthy days
- Prescribed medications past month
- Generalized anxiety disorder, panic disorder for young adults aged 20-39 (1999-2004)
Strengths:
- Nationally representative sample, acceptable response rate (69.5%, 2011-2012)
- Wealth of physical health data
Limitations:
- Small sample size
- Limited mental health information
- No expert validation of depression
SOURCE: Workshop presentation by Mark Olfson, September 2015.
BOX 4-3
Medical Expenditure Panel Survey (MEPS)
Size: Approximately 14,000 families, 35,000 persons (household component)
Design: Complex, household population, panels followed for up to 2 years
Mental-health related variables:
- Conditions
- Psychotropic medication purchases
- Psychotherapy/counseling visits
- Visits to mental health specialists
- Activity limitations
- –SF-12 Mental Component Summary (adult self-report)
- –Patient Health Questionnaire-2 (adult self-report)
- –K6 (adult self-report)
Strengths:
- Nationally representative, continuous sample
- Three interviews per year
Limitations:
- Modest response rate: 56.3% (2012)
- Household informant, except for SF-12, PHQ-2, and K6
- No systematic mental health status information
SOURCE: Workshop presentation by Mark Olfson, September 2015.
Practice-Based Surveys and Data
In the final part of his presentation, Olfson discussed practice-based surveys and data, which include information from health care providers. He said that the most well-known and well-trodden of these surveys is the National Ambulatory Medical Care Survey (NAMCS), which is focused primarily on office-based medical practice: see Box 4-4. Outpatient visits in hospitals and other emergency departments are captured in a companion survey, the National Hospital Ambulatory Medical Care Survey (NHAMCS). Personnel in the practices complete forms that describe the characteristics of the practice and provide data about visits in a particular sampling week. Information is provided on the reason for the visits, what the diagnoses were, and the treatment and services provided. Psychiatrists and other medical specialists are also included, in addition to general medicine and primary care providers. However, he noted, community mental health centers, substance abuse clinics, and other specialty
outpatient clinics are not covered in these data, which means that persons with substance use disorders and severe mental disorders would only appear in small numbers. The unit of analysis in these datasets is the visit, and one metric that can be derived from the NAMCS is visits per population. The difference between visits and person prevalence is an important distinction because people consume multiple visits in the course of a year, and there can be some duplication of individuals. It is tempting to think about the data as treated prevalence rates, but it is important to remember that they are not.
Olfson said that these databases in some ways resemble the administrative data discussed previously in that they contain similar encounter data but are based on the abstracts and include all payers. They provide a more robust look at outpatient care and patterns of diagnoses over time nationally, rather than the commercial administrative databases that cover different groups of insurers.
The NAMCS has recently been redesigned and is now about twice the size it used to be in terms of the number of visits, and state-level esti-
BOX 4-4
National Ambulatory Medical Care Survey (NAMCS)
Size: 30,000 visits/year (1993-2010), 76,000 (2012)
Design: Office-based physician visits during sampling week, complex design
Mental health information:
- Mental health reasons for visit
- Clinical diagnoses
- Medications prescribed or monitored
- Psychotherapy/counseling
- Depression regardless of diagnosis (2005-2010, 2012)
- Includes visits to psychiatrists
Strengths:
- Covers all payers
- Measures mental illness burden in office-based practice
- Trend analyses possible
Limitations:
- Counts visits, not unduplicated patients
- Modest to low response rate (60.6%, 2005-2010; 38.4%, 2012)
- Does not capture outpatient care provided in community mental health centers, substance abuse clinics, and other specialty outpatient settings
SOURCE: Workshop presentation by Mark Olfson, September 2015.
mates can now be derived. However, the response rate for the survey has fallen by almost one-half. Olfson believes this drop is a significant concern because of the risks of selection bias that can occur with low response rates. The 2011 data are not yet available, but they will become available in the next few months.
The final database Olfson described was the Hospital Cost and Utilization Project National (Nationwide) Inpatient Sample (HCUP-NIS): see Box 4-5. The HCUP-NIS is not a survey, but a compilation of discharge summary abstracts. This data collection has also been recently redesigned, and it now represents a 20 percent national sample of all the discharges from hospitals. The unit of analysis is each hospital discharge, not each unique patient, so there is also a potential for duplication of individuals in the data. The database contains only sparse information on characteristics of the population, but it does include diagnoses and procedures
BOX 4-5
Hospital Cost and Utilization Project National
(Nationwide) Inpatient Sample (HCUP-NIS)
Size: 8 million discharges from approximately 1,000 hospitals (annually)
Scope: Nonfederal, short-term general and other specialty hospitals
Design: 1988-2011 (participating states, weighted by hospital ownership, size, teaching status, location, region), 2012 (20% national sample of discharges, community hospitals)
Mental health information:
- Discharge diagnoses
- Procedures
- Disease severity measures (based on diagnoses, demographics, length of stay)
Strengths:
- Large sample size
- Covers all payers and includes uninsured patients
- National estimates
- Can be used to analyze trends
Limitations:
- Counts discharges, not unduplicated individuals
- Limited clinical information
- Does not include psychiatric hospitals, alcoholism, or chemical-dependency treatment facilities
SOURCE: Workshop presentation by Mark Olfson, September 2015.
that have been delivered in inpatient settings. The database also includes a disease severity measure that is derived from an algorithm using diagnoses, demographics, and length of stay. This four-point scale measure of severity allows comparisons across different diagnostic groups. Olfson noted that the HCUP-NIS would yield information on a very small slice of psychopathology in the community, but it is useful to consider it as part of the data sources available.
Olfson stressed that none of the databases he had described were designed for use in estimating prevalence of mental disorders in the population. Nonetheless, they can yield some insights on the topic. In particular, he said, they can be of value with regard to trends in treatment because their structures are largely conserved over time. He concluded by listing the elements that he would ideally want to see included in a mental health surveillance program:
- Major disorders (mood, anxiety, substance use, psychotic disorders)
- Impact on function (work, household, family, social)
- Quality of life
- Educational attainment
- Access to health care and mental health care
- General health outcomes
Discussion
D.E.B. Potter (Office of the Assistant Secretary of Planning and Evaluation) asked if Olfson could comment on the all-payer claims databases that some states are developing. Olfson replied that he is primarily familiar with the activities being undertaken in New York. He said that substantial funds are being set aside in some states to bring together the claims databases to try to obtain a complete picture of all reimbursed care that is provided. He said that he has yet to see much research come out of these efforts, but that he thinks they will fulfill an important gap at the state level, which is not filled by existing administrative databases that only reflect parts of the national picture, and only one payer. He said these all-payer claims databases may suffer from the same kinds of general issues that he described earlier with regard to being based on treated individuals and diagnoses that are assigned by clinicians.
Vos added that, from his experience working with commercial administrative data from Blue Cross/Blue Shield, he has seen surprisingly fleeting populations with few people steadily in the system, even over a period of 1 year. Over 3 years, it may be that only one-third of the people are continuously in the same system. The new state-based initiatives to develop all-payer claims databases will substantially increase the useful-
ness of these data sources if they can link individuals between separate payer systems.
Olfson underscored Vos’ point by saying that the length of time people stay in a given job is declining in the United States, with the average around 6 years. In addition, people who do not change jobs can still change health plans annually, and employers may change health plans for an entire employee group. It is also important to note the turnover in the Medicaid and Medicare population. As a result of these fluctuations, if one wants to analyze rates in a year, a proportion of cases are lost because some people are not eligible for the full year. Vos added that there may be selection bias, and Olfson agreed that the changes may not be random. Robert Gibbons (University of Chicago) said that the average length of tenure in a system is about 2½ years.
Gibbons also noted that it would be possible to look for cross-validation for these data in other databases, such as those of the Department of Veterans Affairs, or the Karolinska Institute, where researchers have linked Scandinavian databases. He mentioned that other relevant existing data sources would be ones like DARTNet, which is an integrated medical practice database run by the University of Colorado. It has about 400 practices covering approximately 4 million people. Olfson remarked that in the area of mental health there have been efforts over the years to put together practice-based research networks, which build on that idea. The difficulty is in having to rely on the good will and volunteerism of the participants.
Dean Kilpatrick (Medical University of South Carolina) asked whether the databases Olfson covered in his presentation could be used to supplement data from population-based surveys and what the implications would be in terms of potential double counting. Olfson said that, rather than trying to overcome difficulties that would arise in trying to supplement a population survey, the administrative databases may be more useful in providing information about rare events that are psychiatric in nature and about populations with high use and their characteristics. The strength of these databases is that they can provide information that is not possible to capture in population-based surveys. Olfson added that he would have to give more thought to whether administrative databases could actually help in estimating the size of populations.
Gibbons suggested that one possibility would be to develop a practice-based network, with the aim of adding practices in a way that is nationally representative. A good example of this approach is that of IMS Health, a network of 30,000 nationally representative pharmacies, which is based on a cluster sampling approach. Darrell Regier (Uniformed Services University) added that the design of the practice research network of the American Psychiatric Association (APA) is similar. In that case, the
researchers had access to the American Medical Association master file, and they were able to select a random sample of psychiatrists in the master file, regardless of their membership in the APA. This design was used for a number of major studies on the topics of parity insurance, Medicare Part D, and a number of other policy issues. He added that long-term support from associations is needed to sustain these types of efforts, and obtaining that support is challenging. Regier said that the Colorado DartNet network structure—in which a facilitator helps keep the providers engaged—is a better long-term strategy than the APA one in terms of maintaining stability of the groups.
THE NATIONAL HEALTH INTERVIEW SURVEY
Stephen Blumberg (National Center for Health Statistics) discussed the NHIS, one of the surveys covered briefly by Olfson. Blumberg said that it has never been a goal for the NHIS to measure serious mental illness, but some data on mental disorders have been collected since 1997, and efforts have been made over the years to enhance the data collected.
The NHIS is the primary source of information on the health of the U.S. civilian population living in households at the time of the interview. It is one of the major data collection programs of the National Center for Health Statistics (NCHS), which is part of the Centers for Disease Control and Prevention. The primary objective of the NHIS is to monitor the health and health care access of the population in the United States, through the collection and analysis of data on a broad range of health topics. The data are used widely throughout the Department of Health and Human Services to monitor trends in illness and disability and to track progress toward achieving the goals of the Healthy People initiative and other national health objectives. The NHIS has received much recent attention because of its ability to monitor the effects of the Affordable Care Act on health insurance, access to care, challenges that people encounter in paying medical bills, and other policy-relevant topics.
A multistaged clustered national sample of housing units from every state is used to represent the civilian noninstitutionalized U.S. population. The survey oversamples black, Hispanic, and Asian individuals, as well as adults aged 65 and older. The interviews are conducted in person, by Census Bureau interviewers. The NHIS has primarily been used for national and regional estimates. However, for the past few years, there were significant sample size increases in an effort to improve state-level estimates. In 2014, it became possible to produce estimates for all 50 states for certain measures that ask about every individual in the household (e.g., health insurance measures).
The base NHIS sample used to be 35,000 households and was later
increased to almost 45,000. The survey domains are broad and cover health status; functional limitations; health conditions; health behaviors and risk factors; injuries; health insurance, access, utilization, and barriers; and a host of demographic and socioeconomic characteristics. The core questions are a short set that remain unchanged from year to year. They are supplemented annually to collect data on current issues of national importance in three sections: a family core, a sample adult core, and a sample child core.
In the family core, a knowledgeable respondent in the family is asked about all of the members of the family. For the other two sections, one adult and one child are randomly selected from each family. For the sample child, the interviews are conducted with the parent or guardian of that child. The health conditions are predominantly measured in the sample adult section. For most of the conditions, the survey items ask whether a doctor or other health care professional diagnosed a particular condition, such as diabetes or hypertension.
The NHIS generally does not rely on medical screening or tests, as does the NHANES; but for the mental health data, a decision was made in the 1990s to include a screener in order to distinguish cases based on the severity of symptoms rather than purely based on the receipt of a diagnosis. At that time, there was no short battery of questions that could identify clinically significant community cases using lists of symptoms. Therefore, when the NHIS was redesigned in 1997, Ronald Kessler from Harvard University was commissioned to develop a short questionnaire of about six to eight items that would assess the severity of symptoms. This work ultimately resulted in what has come to be known as the K6, a measure of nonspecific psychological distress.
The development of the K6 started with more than 600 questions on symptoms and then used item response theory (IRT) methods to reduce that to a much smaller set. A 10-item measure was first developed, which then was reduced to the current 6-item measure. In applying IRT, the goal was to maximize the precision of the scale around the 90th-95th percentile because that was the expected threshold for clinical significance.
The version of the scale used in the NHIS asks about feelings during the month prior to the interview (see Box 4-6). Blumberg pointed out that there is another version of the scale, which is also referred to as the K6, that asks questions about the one month during the past year when the individual had the most severe and persistent emotional distress. The latter terminology was used in an effort to better measure serious mental illness using the 12-month “look back” that would be required by the definition of serious mental illness. Because the NHIS is not measuring serious mental illness, the K6 used in the NHIS is measuring distress in the past month.
In order to get information for the 90th-95th percentile goal, each
BOX 4-6
NHIS K6 Instrument for Measuring
Serious Psychological Distress
Now I am going to ask you some questions about feelings you may have experienced over the past 30 days. During the past 30 days, how often did you feel…
- So sad that nothing could cheer you up?
- Nervous?
- Restless or fidgety?
- Hopeless?
- That everything was an effort?
- Worthless?
ALL of the time, MOST of the time, SOME of the time, A LITTLE of the time, or NONE of the time
SOURCE: National Health Interview Survey Questionnaire. Available: ftp://ftp.cdc.gov/pub/Health_Statistics/NCHS/Survey_Questionnaires/NHIS/2015/english/qadult.pdf [January 2016].
of the symptoms is asked with response categories of all of the time (4 points), most of the time (3 points), some of the time (2 points), a little of the time (1 point), or none of the time (0 points). A cutoff score of 13 or higher means that the individual had to respond “most of the time” to at least one of these items and had elevated scores on everything else, and this yields prevalence estimates of serious psychological distress.
Figure 4-2 illustrates that, in the 2009-2013 NHIS, 3.4 percent of adults aged 18 and over reported serious psychological distress and that the rate was higher among women than men in every age group. Blumberg said that an analysis of the relationship between prevalence of serious psychological distress and income showed that lower income adults were more likely to experience serious psychological distress. The prevalence of serious psychological distress among non-Hispanic whites was lower than among Hispanics and non-Hispanic blacks.
Blumberg emphasized that the NCHS values the K6: it is considered to be one of the 15 key measures from the NHIS. Data from the K6 are therefore part of the NHIS early release program, which is a program that releases reports every 3 months prior to final processing and weighting of the annual data, in order to provide access to the most recent information. Blumberg pointed out that the percentage of adults with serious psycho-
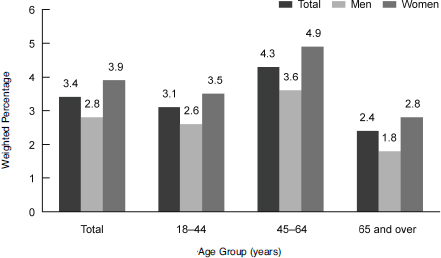
FIGURE 4-2 Adults with serious psychological distress, by sex and age: 2009-2013 National Health Interview Survey.
SOURCE: Weissman, J., Pratt, L.A., Miller, E.A., and Parker, J.D. (2015). Serious Psychological Distress Among Adults: United States, 2009-2013. NCHS data brief #203. Hyattsville, MD: National Center for Health Statistics.
logical distress between 1997 and 2015 has stayed around 3 percentage points, with a low of 2.4 percent in 1999 and a high of 3.8 in 2013. There was a significant increase of 1.1 percentage points between 2012 and 2013, which Blumberg said may have been related to a change in location of the psychological distress items on the survey. In 2014, the percentage came back down to 3.1 percent with the items in the same new place on the survey.
Blumberg noted that in the NHIS there is a follow-up question to the K6 that asks: How much did these feelings interfere with your life or activities? It is asked of all adults who reported at least one feeling on the K6 as experienced at least some of the time. However, NCHS has not used this item in any analyses. David Cella (Northwestern University) remarked that it is an item on functioning and could be analyzed to see which of the six symptoms affects functioning more or less than the others. Blumberg encouraged workshop participants to do additional analyses on the NHIS data, which are publicly available.
Blumberg also explained that the design of the NHIS incorporates annual supplements to periodically collect more information. In the 1997 redesign, a mental health supplement was added in an effort to obtain more detail about specific mental illness diagnoses. At the same time that
Ronald Kessler was working on the K6 as a core NHIS item, he was also under contract with NCHS to modify the Composite International Diagnostic Interview Short Form (CIDI-SF) to fit with DSM-IV criteria, with the idea that it would be used as a periodic supplement. The CIDI-SF was designed to estimate the prevalence of adults meeting the DSM-IV criteria for six different psychiatric outcomes and the DSM-III-R criteria for two addictive disorders.
The CIDI-SF is designed as a short series of symptom questions that follow the diagnostic stem questions. As an example, the series for major depression starts with two questions about whether the respondent felt sad, blue, or depressed for at least 2 weeks within the past 12 months and whether the respondent had lost interest in most things for at least 2 weeks within the past 12 months. A “yes” answer to one of these questions leads to a series of questions about how often this was experienced, and about depressive symptomology, feeling tired, having trouble concentrating, and feeling worthless. The aim is to determine whether the diagnostic criteria for major depression were met.
Despite developing the CIDI-SF for a number of different psychiatric outcomes in the 1999 periodic supplements, the only disorders that were included were major depression, generalized anxiety disorder, and panic attacks. Figure 4-3 presents the prevalence rates of these three disorders in 1999. As can be seen in the figure, nearly 9 percent of adults had any one of these selected mental disorders.
Blumberg said that the adult mental health supplement was never repeated. It is not clear why, but in 2001 and 2002 the NHIS was under some budget pressures, and there was more interest in supplements that other agencies were paying for than supplements that NCHS was paying for itself. Also, the validation studies on the CIDI-SF were never funded. Ultimately, it was only calibrated to the National Comorbidity Study data. Confirmatory clinical follow-up interviews were also not carried out for the CIDI-SF. Blumberg also presented information on a new initiative that is being undertaken with the Washington Group on Disability Statistics. The Washington Group was authorized by the U.N. Statistical Commission, following the U.N. International Seminar on the measurement of disability. Working from the structure of the International Classification of Functioning, Disability, and Health, this group was tasked with developing a small set of general disability measures to be used in censuses and other sample-based national surveys throughout the world.
The guiding principle for this work was that disability is the outcome of an interaction between a person and his or her environment, and it is therefore best measured as the ability of people to participate in their current environments. Some of the parameters for the new items were that the measures should be usable in surveys throughout the world, should
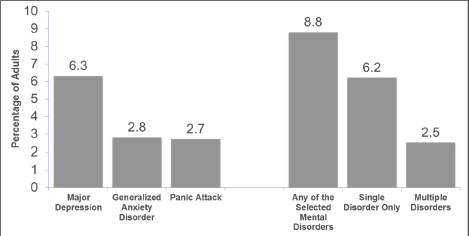
FIGURE 4-3 Prevalence rates for selected mental disorders among adults, past 12 months, 1999.
SOURCE: Dickey, W.C., and Blumberg, S.J. (2004) Prevalence of mental disorder and contacts with mental health professionals among adults in the United States: National Health Interview Survey, 1999. In R.W. Manderscheid and M.J. Henderson (Eds.), Mental Health, United States, 2002 (Chapter 8). Rockville, MD: Substance Abuse and Mental Health Services Administration.
provide comparable data nationally, should have elements that crossed cultures and varying economic backgrounds, and should be short. For example, the World Health Organization Disability Assessment Scale was not a candidate because it is too long.
The group first developed a six-item measure of disability, based primarily on body systems: seeing, hearing, walking, remembering, self-care, and communicating. The items were intended to be somewhat dimensional, and four answers were available for each: no difficulty, some difficulty, a lot of difficulty, or cannot do at all. After these dimensional measures were developed and tested, the group developed an extended question set on affect, pain, fatigue, and the disability that results from these. For example, the questions on affect ask: How often do you feel worried, nervous, or anxious? Do you take medication for these feelings? Thinking about the last time you felt worried, nervous, or anxious, how would you describe the level of these feelings? The three questions are then repeated, substituting depressed for worried, nervous, or anxious. The items were cognitively tested in 15 countries and field tested in 9 countries. The researchers concluded that the questions are well understood across cultures and across economic situations, and they yield a continuum that correlates well with functioning difficulties.
Blumberg pointed out that there is no item on functioning difficulty that specifically asks, for example, if that feeling limits people’s ability to carry out their daily activities. Functional items were part of the initial testing set, but they did not have the desired psychometric results. As discussed in earlier sessions, possible reasons may have been the difficulty in attributing one’s inability to carry on their daily activities to certain feelings. But, he added, people may compensate for their limited ability to do something by changing their environment so they can function better or will not be required to function in that way. For example, someone who starts to have difficulty hearing may choose not to go to the movies or not to go to a crowded restaurant. A person may or may not even be aware that the change is due to a functional limitation related to hearing. Another issue the researchers faced in measuring functional limitation concerned the cross-cultural nature of the functional item—what daily activities would apply across the board from western Europe to Sri Lanka to the Maldives?
Without a functional item, the Washington Group now faces the challenge of determining a cut point for clinical significance with the frequency and intensity questions. Nevertheless, the questions have been included in the NHIS as a supplement since 2010 and were added to the 2014 European Health Interview Survey. The Washington Group questions have also been endorsed by the Budapest Initiative, which is another U.N. Statistical Commission group that was tasked with developing measures of health states for inclusion in the European Health Interview Survey.
In concluding the presentation, Blumberg discussed the questionnaire redesign that the NHIS is currently undergoing for the 2018 data collection. Although no decisions have been made, it is likely that the Washington Group questions will become part of the NHIS core. The goals of the redesign are to improve measurement and to incorporate recent advances in survey methodology. The researchers are dealing with the challenges of shortening a 90-minute survey in order to increase response rates. They also want to harmonize the NHIS content with that of other federal health surveys as appropriate. In addition, they want to establish a long-term structure of ongoing and periodic topics rather than supplements that are used only once and then discontinued due to changes in funding or priorities. A more stable structure would allow NCHS and its stakeholders to better predict the topics that will be included in certain survey years and the data that will be produced. He said that the mental health topic may be built into the new structure, but this has not yet been decided.
As part of the questionnaire redesign process, NCHS is currently involved in stakeholder engagement and outreach. The overall timeline calls for qualitative and quantitative assessments in 2015 to 2016, the required review by the Office of Management and Budget, and public
comments from spring 2016 to spring 2017, questionnaire reprogramming in late spring 2017, and fielding of the new questionnaire in January 2018.
Cella remarked that the K6 cut point on the NHIS is sometimes a little lower than the 95th percentile and asked if there was a difference in data collection methods that Kessler used versus those used for the NHIS. Blumberg said that Kessler used data that were based on interview surveys in the United States and Australia, like the interview methods used in the NHIS. Lisa Colpe (National Institute of Mental Health) added that the cutoff of 13 was established through a pilot clinical calibration study and work done by SAMHSA as the researchers were refining it for their study. Ron Manderscheid (National Association of County Behavioral Health & Developmental Disability Directors and Johns Hopkins University) commented that the scale score of 13 was standardized in effect on a Global Assessment of Functioning (GAF) score of 50, but he noted that other work was done on a GAF of 60. That is why Kessler always talked about the cut point being between 5 and 6 percent.
Vos noted that Blumberg’s discussion of the Washington Group’s challenges in deriving functional limitation measures was very interesting in view of the GBD study’s experience. The GBD found large differences in how people in different countries respond to functional items, which may reflect economic circumstances and culture. He said that one of the major reasons the GBD concentrates more on health loss and impairments, rather than general welfare and functioning in overall life, is to have valid comparisons.
Fred Conrad (University of Michigan) remarked that face-to-face household interviews that are conducted for the NHIS do not seem to be the ideal context in which to collect information about stigmatized behaviors. He asked if the NHIS data show any evidence of underreporting because of the nature of the questions. For example, are the higher levels of prevalence for females than for males perhaps related to males being less willing to report sensitive information about symptoms in an interview? Blumberg replied that this difference would probably also apply outside of the interview context: men just do not want to admit, even to themselves, these symptoms. Blumberg said he does not know whether the K6 is susceptible to mode effects, but it would not be surprising if it was. He said that it would be possible to look at this issue by examining differences between the sample adult interviews that are done in person versus the relatively few that are done by telephone.9 Conrad added that an even better comparison would be with self-administration.
________________
9 The NHIS is primarily an in-person survey, but a small number of interviews are completed by telephone, after an initial in-person contact is made with the respondent: this is sometimes done to finish a partial interview.
Given that SAMHSA needs state-level estimates, Graham Kalton (Westat) asked Blumberg if NCHS has done any small-area estimation with the NHIS data. Blumberg said that they have, but he is not aware of small-area estimation using the K6. For example, he used it for estimates of cell-phone-only households. In addition, NCHS also used small-area estimation in connection with BRFSS data to obtain some estimates for the National Cancer Institute. Blumberg said that it would be interesting to look at the NHIS K6 state-level estimates from 2014 and see how they match up with the state-level estimates that SAMHSA has produced using the 30-day K6, if the samples are large enough for that comparison. Jonaki Bose (SAMHSA) said that SAMHSA has collected past year data at the state level, and it could also capture past 30 days data at the state level.


