
6
Research Methodology and Principles: Assessing Causality
One of the panel’s primary tasks was to provide information to the Federal Motor Carrier Safety Administration (FMCSA) on how the most up-to-date statistical methods could assist in the agency’s work. The theme of this chapter is that methods from the relatively new subdiscipline of causal inference encompass several design and analysis techniques that are helpful in separating out the impact of fatigue and other causal factors on crash risk and thereby determining the extent to which fatigue is causal.
A primary question is the degree to which fatigue is a risk factor for highway crashes. Efforts have been made to assess the percentage of crashes, or fatal crashes, for which fatigue played a key role. However, assessment of whether fatigue is a causal factor in a crash is extremely difficult and likely to suffer from substantial error for two reasons.
First, the information collected can be of low quality. Biomarkers for fatigue that can provide an objective measurement after the fact are not available. If drivers survive a crash and are asked whether they were drowsy, they may not know how drowsy they were, and even if they do know, they have an incentive to minimize the extent of their drowsiness. In most cases, the police at the scene are charged with determining whether a chargeable offense was committed; whether a traffic violation occurred; and whether specific conditions, such as driver fatigue, were or were not present. They must make this determination to the best of their abilities with limited information. It is commonly accepted and under-
standable that police underestimate the degree of fatigued driving and its impact on crashes.
Police assessments, augmented by more intense interviewing and other investigations, were used to determine factors contributing to crashes in such studies as the Large Truck Crash Causation Study (LTCCS) (see Chapter 5), in which the researchers attempted to determine the critical event (the event that immediately precipitated the crash) and the critical reason for that event (the immediate reason for the critical event) for each crash. To this end, they tried to provide a relatively complete description of the conditions surrounding each crash. This approach is fundamentally different from that of calculating the percentage of crashes attributable to different causes. Neither approach is entirely satisfactory: in the LTCCS approach, the concept of a “critical reason” is not well defined since many factors can combine to cause a crash, with no individual factor being solely responsible, while in the other approach, the attributed percentages can sum to more than 100 percent.
Second, in addition to low-quality information, the fact that crashes often are the result of the joint effects of a number of factors makes it difficult to determine whether fatigue contributed to a crash. Crashes can be due to factors associated with the driver (e.g., drowsiness, distractedness, anger); the vehicle (e.g., depth of tire tread, quality of brakes); the driving situation (e.g., high traffic density, presence of road obstructions, icy road surfaces, low visibility, narrow lanes); and the policies of the carrier, including its approach to compensation and to scheduling. The so-called Swiss cheese model of crash causation (Reason, 1990) posits that failures occur because of a combination of events at different layers of the phenomenon. Similarly, the so-called Haddon Matrix (Runyan, 1998) looks at factors related to human, vehicle, and environmental attributes before, during, and after a crash. A constructed matrix permits evaluation of the relative importance of different factors at different points in the crash sequence. These models acknowledge that a traffic crash has a multitude of possible causes that may not function independently, resulting in a fairly complex causal structure. Therefore, understanding the role of an individual factor, such as fatigue, in causing a crash can be a challenge.
Given that crashes can have many causes, increases and decreases in crash frequency over time can be due to changes in the frequency of any one of these causes. For instance, a harsher-than-usual winter might raise the frequency of crashes, everything else remaining constant. By ignoring such dynamics, one can be misled about whether some initiative was or was not helpful in reducing crashes.
To draw proper inferences about crash causality, then, it is important to understand and control the various causal factors in making comparisons or assessments—including those outside of one’s interest, referred
to as confounding factors. Therefore, to assess the degree to which fatigue increases crash risk, one must account for the dynamics of the confounding factors, including any correlation between them and the causal factors of interest. This can be accomplished through design or analysis techniques.
A common design that limits the influence of confounding factors is the randomized controlled trial. For reasons given below, however, most of the data collected in studies of motor carrier safety are observational, so methods are needed to help balance the impact of confounders on comparisons of groups with and without a causal factor of interest. By using such methods, one can better understand the role of fatigued driving and therefore help determine which policies should be implemented and warrant the allocation of resources to reduce crash risks due to fatigue.
The following sections begin by defining what is meant by causal effect. This is followed by discussion of the inferences that are possible from data on crashes and the various kinds of standardization that might be used on crash counts. Next is an examination of what can be determined through the use of randomized controlled trials and why they are not feasible for addressing many important questions. The advantages and disadvantages of data from observational studies—which are necessary for many topics in this field—are then reviewed. Included in this section is a description of techniques that can be used at the design and analysis stages to support drawing causal inferences from observational data and extrapolating such inferences to similar population groups.
DEFINITION OF CAUSAL EFFECT
The definition of a causal effect applied in this chapter is that of Rubin (see Holland, 1986). Assume that one is interested in the effect of some treatment on some outcome of interest Y, and for simplicity assume that the treatment is dichotomous (in other words, treatment or control). The potential outcome Y(J) is defined as the value of the outcome Y given treatment type J. Then the causal effect of the treatment (as contrasted with the control) on Yi is defined as the difference in potential outcomes Yi (1) – Yi (0), defined as follows: a selected unit i (e.g., a person at a particular point in time) given treatment Ji = 1 results in Yi(1), and the same selected unit given the control Ji = 0 results in Yi(0), with all other factors being held constant. For example, if what would have happened to a subject under a treatment would have differed from what would have happened to the same subject at the same time under control, and if no other factors for the subject changed, the difference between the treatment and the control is said to have caused the difference. The problem when applying this definition is that for a given entity or situation, one cannot
observe what happens both when Ji = 0 and when Ji = 1. One of these potential outcomes is unobserved, so one cannot estimate the unit-level causal effect. Given some assumptions about treatment constancy and intersubject independence, however, it is possible to estimate the average causal effect across a population of entities or situations. To do so, since one is comparing situations in which J = 1 against those in which J = 0, one must use techniques that make it possible to assert that the units of analysis are as similar as possible with respect to the remaining causal factors.
Understanding causality is an important goal for policy analysis. If one understands what factors are causal and how they affect the outcome of interest, one can then determine how the changes to causal factors even for a somewhat different situation from the one at hand will affect the probability of various values for the outcome of interest. If one simply determines that a factor is associated with an outcome, however, it may be that the specific circumstances produced an apparent relationship that was actually a by-product of confounding factors related to treatment and outcomes.
DRAWING INFERENCES AND STANDARDIZING CRASH COUNTS
As one example of confounding and the challenges entailed in drawing causal inferences, it is common for those concerned with highway safety to plot crash counts by year to assess whether road safety is improving for some region. This type of analysis can be misleading. For example, Figure 6-1 shows a large decline in total fatalities in truck crashes between 2008 and 2009. It is generally accepted that this decline was due to the substantial reduction in vehicle-miles traveled that resulted from the recession that started during that year. However, it is also possible that the decline was due in part to new safety technology, improved brakes, improved structural integrity of the vehicles, or increased safety belt use. Thus, looking at a time series of raw crash counts alone cannot yield reliable inferences.
As a first step in enabling better interpretation of the data, one could standardize the crash counts to account for the change in vehicle-miles traveled, referred to as exposure data. Thus an obvious initial idea is to use vehicle-miles traveled as a denominator to compute crashes or fatal crashes per miles traveled. In some sense, exposure data are a type of confounding factor, because a truck or bus that is being driven less is less likely to be involved in a crash. The lack of exposure data with which to create crash rates from the number of crashes is a problem discussed below. Another problem with normalizing crashes by dividing by vehicle-miles traveled is that the relationship between the number of crashes and
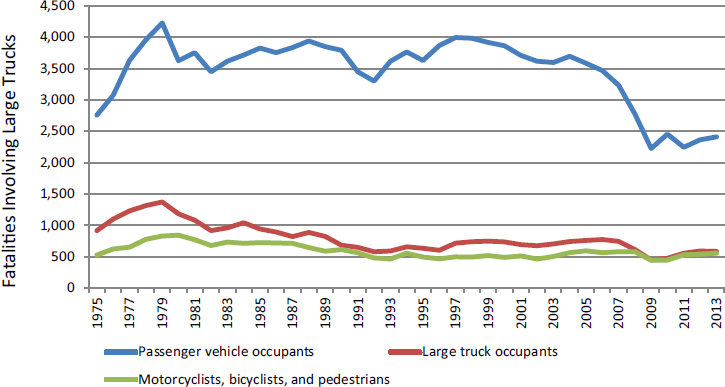
SOURCE: Insurance Institute for Highway Safety. Available: http://www.iihs.org/iihs/topics/t/large-trucks/fatalityfacts/large-trucks [March 2016] based on the U.S. Department of Transportation’s Fatality Analysis Reporting System.
the amount of exposure might be nonlinear, as pointed out by Hauer (1995). This nonlinearity is likely due to traffic density as an additional causal factor.
The idea of standardization can be extended. What if other factors could confound the comparison of time periods? For example, suppose that in comparing two time periods, one finds that more miles were traveled in 1 year under wet conditions than in the other year? To address this potential confounder, the data could be stratified into days with and without precipitation prior to standardizing by vehicle-miles traveled. Increasingly detailed stratifications can be considered if the data exist for various factors. Yet there are limits to which this can be done. At some point, one would have such an extensive stratification that there would likely be few or no crashes (and possibly even no vehicle-miles traveled) for many of the cells. To address that issue, modeling assumptions could be used in conjunction with various modeling approaches. For instance, one could assume that log [Pr(Crash)/(1 – Pr(Crash))] is a linear function of the stratifying factors, but this approach would rely on these assumptions being approximately valid.
An understanding of which factors are and are not causal and the extent to which they affect the outcome of interest is important in deciding on an appropriate standardization. Efforts at further standardization
by other potential casual factors or potential confounders are likewise constrained by the fact that police reports often include only limited information on the driver, the vehicle, and the environment.
At present, the main source of data for vehicle-miles traveled is the Federal Highway Administration (FHWA). However, these data are too aggregate and lacking in specifics to be used as denominators in producing crash rates for various kinds of drivers, trucks, and situations. Without exposure data, one might be able to separate collisions into those in which a factor was or was not present (although doing so is difficult, see Chapter 5). However, since one would not know how much crash-free driving had occurred when that factor was and was not present, one could not know whether the number of crashes when a factor was present was large or small.
ROLE OF RANDOMIZED CONTROLLED TRIALS
Much of what is known about what makes a person drowsy, how being drowsy limits a one’s performance, and what can be done to mitigate the effects of inadequate sleep derives from laboratory studies, which commonly entail randomized controlled trials. For instance, studies have been carried out with volunteers to see how different degrees of sleep restriction affect response time. For such an experiment, it is important for the various groups of participants to differ only with respect to the treatment of interest—for example, degree of sleep restriction—and for them not to differ systematically on any confounding factors. In randomized experiments, one minimizes the effects of confounders by randomly selecting units into treatment and control groups. As the sample size increases, the randomization tends to balance all confounders across the different groups. (That is, randomization causes confounders to be uncorrelated with selection into treatment and control groups.) Traditional randomized controlled trials also are usually designed to have relatively homogeneous participants so that the treatment effect can more easily be measured. This homogeneity is achieved by having restrictive entry criteria. Further, the treatment is usually constrained as well. While this homogeneity of participants and intervention improves assessment of the efficacy of the treatment effect, it often limits the generalizability of the results.
In addition to restrictive entry criteria, stratification or matching is used to provide greater control over potential confounding characteristics. If such techniques are not used, the result can be an imbalance between the treatment and control groups on such characteristics, even with randomization into groups. For example, one could have more elderly people in the treatment group than in the control group even with randomization. As the number of potentially causal factors increases, the opportunities for such imbalance also increase.
As discussed below, for a number of topics involving field implementation, randomized controlled trials are not feasible. One type of study, however—the randomized encouragement design—provides some of the benefits of such trials but may be more feasible. In such studies, “participants may be randomly assigned to an opportunity or an encouragement to receive a specific treatment, but allowed to choose whether to receive the treatment” (West et al., 2008, p. 1360). An example would be randomly selecting drivers to receive encouragement to be tested for sleep apnea and examining the effects on drivers’ health (following Holland, 1988). This type of design can be useful when the treatment of interest cannot be randomly assigned, but some other “encouragement” to receive the treatment (such as a mailer or monetary incentive) can be randomly provided to groups of participants.
Before continuing, it is important to reiterate that current understanding of the influence of various factors on highway safety and on fatigue comes from a variety of sources, including laboratory tests, naturalistic driving studies, and crash data (see Chapter 5). These various sources have advantages and disadvantages for addressing different aspects of the causal chain from various sources of sleep inadequacy, including violation of hours-of-service (HOS) regulations, to sleep deficiency, to lessened performance, to increased crash risk. One can think of these various sources of information as being plotted on a two-dimensional graph of fidelity versus control. Typically, as one gains fidelity—that is, correspondence with what happens in the field—one loses control over the various confounding factors. That is why it can be helpful to begin studies in the laboratory, but as one gains knowledge, some field implementation is often desirable. These latter studies will often benefit from methods described in the next section for addressing the potential impacts of confounding factors.
OBSERVATIONAL STUDIES
Observational studies are basically surveys of what happened in the field (e.g., on the road). If data were gathered from individuals who did and did not receive some intervention or treatment or did and did not engage in some behavior, one could compare any outcome of interest between those groups. However, any such comparison would suffer from a potential lack of comparability of the treatment and control groups on confounding factors. That is why techniques are needed to help achieve such balance after the fact. However, observational studies do have the advantage of collecting data that are directly representative of what happens in the field.
Further, such studies are generally feasible, which often is not the case for randomized controlled trials. For example, it is not possible to
randomize drivers to follow or not follow the HOS regulations. Such an experiment would obviously be unethical as well as illegal. Similarly, drivers diagnosed with obstructive sleep apnea could not be randomly divided into two groups, one treated with positive airway pressure (PAP) devices and the other not, to assess their crash risk on the highway. For most issues related to study of the role of fatigue in crashes, such random selection into treatment and control groups is not feasible.
With a few exceptions, the data currently collected that are relevant to understanding the linkage between fatigue and crash frequency are observational (nonexperimental). Therefore, methods are needed for balancing the other causal factors between two groups that differ regarding some behavior or characteristic of interest so those other factors will not confound the estimates of differences in that factor of interest. For example, not properly controlling for alcohol use may lead to an overestimation of the effects associated with fatigue for nighttime driving. Thus without careful design and analysis, what one is estimating is not the effect of a certain factor on crash frequency but the combination of the effect of that factor and the difference between the treatment and control groups on some confounding factor(s).
This point is illustrated by a study undertaken recently by FMCSA to determine whether the method of compensation of truck drivers is related to crash frequency. Here the type of compensation is the treatment, and crash frequency is the outcome of interest. A complication is that carriers who chose a specific method for compensation might have other characteristics over- or underrepresented, such as their method for scheduling drivers or the type of roads on which they travel. It is difficult to separate the effect of the compensation approach from these other differences among carriers.
Regression Adjustment
Instead of balancing these other causal factors by matching or stratifying, one might hope to represent their effect on the outcome of interest directly using a regression model. Here the dependent variable would be the outcome of interest, the treatment indicator would be the primary explanatory variable of interest, and the remaining causal factors would be additional explanatory variables. The problem with this technique is that the assumption that each of the explanatory variables (or a transformation of a variable) has a specific functional relationship with the outcome is a relatively strong assumption that is unlikely to be true. The farther apart are the values for the confounding factors for the treatment and control groups, the more one will have to rely on this assumption. (There are also nonparametric forms of regression in which the depen-
dence on linearity is reduced, but some more general assumptions still are made about how the outcome of interest and the causal factors interact, for example, see Hill [2011].)
Design Methods for Observational Data
This section describes three techniques used in conjunction with the collection of observational data in an attempt to derive some of the benefits of a randomized controlled trial by limiting the influence of confounding factors. Note that this is an illustrative, not a comprehensive list, and the terminology involved is not altogether standardized.
Cohort Study
A cohort of cases is selected and their causal factors measured as part of an observational study database. Then either the cases are followed prospectively to ascertain their outcome status, or that assessment is performed on historical records as part of a retrospective study.
Case-Control Study
To assess which factors do and do not increase the risk of crashes, one can identify drivers in an observational database who have recently been involved in crashes, and at the same time collect information on their characteristics for the causal factor(s) of interest and for the confounding causal factors. Then, one identifies controls that match a given case for the confounding factors from among drivers in the database who have not been involved in recent crashes. One next determines whether the causal factor(s) of interest were or were not present more often in the cases than in the controls. An example might be to see whether fewer of those drivers recently involved in a crash relative to controls worked for a safety-conscious carrier, controlling for the driver’s body mass index (BMI), experience, and other factors. If one did not match the two groups of drivers on the confounding factors, this approach could produce poor inference, since the two groups likely would differ in other respects, and some of those differences might be causal.
Case-Crossover Study
A case-crossover design is used to answer the question: “Was the event of interest triggered by some other occurrence that immediately preceded it?” (Maclure and Mittleman, 2000; Mittleman et al., 1995). Here, each case serves as its own control. The design is analogous to a crossover experiment
viewed retrospectively. An example might be a truck driver who had been involved in a crash. One might examine whether the truck driver had texted in the previous hour and then see whether the same driver had texted a week or a month prior to the crash, and again for several previous time periods. In that way, one would obtain a measure of exposure to that behavior close to the time of the crash and exposure more generally. (Of course, assessing whether a driver has texted is not always straightforward.)
Analysis Methods for Observational Data
This section describes some analytic methods that can be used to select subjects for analysis or to weight to achieve balance between a treatment and a control group on confounding factors.
Propensity Score Methods
One of the most common tools for estimating causal effects in nonexperimental studies is propensity score methods. These methods replicate a randomized experiment to the extent possible by forming treatment and comparison groups that are similar with respect to the observed confounders. Thus, for example, propensity scores would allow one to compare PAP device users and nonusers who appear to be similar on their prestudy health behaviors, conditions, and driving routines. The propensity score summarizes the values for the confounders into the propensity score, defined as the probability of receiving treatment as a function of the covariates. The groups are then “equated” (or “balanced”) through the use of propensity score weighting, subclassification, or matching. (For details on these approaches, see Rosenbaum and Rubin [1983]; Rubin [1997]; and Stuart [2010]. For an application of this method to highway safety, see Wood et al. [2015].)
Propensity score methods utilize a model as does regression adjustment, but not in the same way. Propensity score methods have two features that provide an advantage relative to regression adjustment: (1) they involve examining whether there is a lack of overlap in the covariate distribution between the treatment and control groups, and whether there are certain values of the covariates at which any inferences about treatment effects would rely on extrapolation; and (2) they separate the design from the analysis and allow for a “blinded approach” in the sense that one can work hard to fit the propensity score model and conduct the matching, weighting, or subclassification (and assess how well they worked in terms of balancing the covariates) without looking at the outcome.
Both propensity score methods and regression adjustment rely on
the assumption that there are no unmeasured confounding factors. Techniques described below, such as instrumental variables and regression discontinuity, are ways of attempting to deal with potential unmeasured confounding. The assumption of no unmeasured confounders cannot be tested, but one can use sensitivity analyses to assess how sensitive the results are to violations of that assumption (for details, see Hsu and Small [2013]; Liu et al. [2013]; and Rosenbaum [2005]).
Marginal Structural Models
Propensity score methods are easiest to use when there is a relatively simple and straightforward time ordering: (1) a point-in-time treatment with covariates measured before treatment, (2) a treatment administered at a single point in time, and (3) outcomes measured after treatment. For more complex settings with time-varying covariates and treatments, a generalization of propensity score weighting—marginal structural models—can be used (for details, see Cole and Hernan [2008] and Robins et al. [2000]). These approaches are useful if, for example, one has data on drivers’ PAP use over time, as well as on measures of their sleep or health status over time, and one wants to adjust for the confounding of health behaviors over time.
The basic idea of the marginal structural model is to weight each observation to create a pseudopopulation in which the exposure is independent of the measured confounders. In such a pseudopopulation, one can regress the outcome on the exposure using a conventional regression model that does not include the measured confounders as covariates. The pseudopopulation is created by weighting an observation at time t by the inverse of the probability of the observation’s being exposed at time t, that is, by weighting by the inverse of the propensity score at time t.
As noted, marginal structural modeling can be thought of as a generalization of propensity score weighting to multiple time points. To describe the method informally, at each time point, the group receiving the intervention (e.g., those receiving PAP treatment at that time point) is weighted to look similar to the comparison group (those not receiving PAP treatment at that time point) on the basis of the confounders measured up to that time point. (These confounders can include factors, such as sleep quality, that may have been affected by a given individual’s prior PAP use). As in propensity scoring, the weights are constructed as the estimated inverse of probability of receiving the treatment at that point in time. So those individuals who have a large chance of receiving the treatment are given a smaller weight, and similarly for the comparison group, which results in the groups being much more comparable. The causal effects are then estimated by running a weighted model of the outcome
of interest (e.g., crash rate) as a function of the exposure of interest (e.g., indicator of PAP use). (The measured confounders are not included in that model of the outcome; this is known as the “structural” model).
Use of Multiple Control Groups
Using multiple control groups is a way of checking for potential biases in an observational study (Rosenbaum, 1987; Stuart and Rubin, 2008). An observational study will be biased if the control group differs from the treatment group in ways other than not receiving the treatment. In some settings, one can choose two or more control groups that may have different potential biases (i.e., may differ from the treatment group in different ways). For example, if one wanted to study the annual change in crash rates due to truck drivers’ having increased their BMI by more than 5 points in the previous year to a total of more than 30, such truck drivers might be compared with drivers who had BMIs that had not changed by more than 5 points and still had BMIs under 30, and the same for bus drivers. If the results of these comparisons were similar (or followed an expected ordering), the study findings would be strengthened. Thus, for example, the findings would be stronger if one of the two control groups differed in that one had a higher expected level of unmeasured confounders than the treatment group had, while the other control group had a lower expected level, and the results were consistent with that understanding. If, however, one believed that there were no unmeasured confounders, but the control groups differed significantly from each other (so that the comparisons of the treatment and control groups differed significantly), that belief would have to be wrong, since the difference in control groups could not be due to the treatment. (This is referred to as bracketing and is described in Rosenbaum [2002, Ch. 8].)
Instrumental Variables
Another common technique for use with observational data is instrumental variables. This approach relies on finding some “instrument” that is related to the treatment of interest (e.g., the use of some fatigue alerting technology) but does not directly affect the outcome of interest (e.g., crash rates). In the fatigue alerting example, such an instrumental variable could be the indicator of a health insurance plan that provides free fatigue alerting devices to drivers. Drivers in that plan could be compared with those not in the plan, under the assumption that the plan might increase the likelihood of drivers using such a device but would not directly affect their crash risk, except through whether they used the device. The advantage here is that there would be a good chance that the drivers who did
and did not receive the free devices would be relatively comparable (possibly depending on additional entry criteria for the program).
The introduction of such instrumental variables can be a useful design, but it can be difficult to identify an appropriate instrumental variable that is related strongly enough to the treatment of interest and does not have a direct effect on the outcome(s) of interest. One potentially useful approach to addressing this issue is use of an encouragement design (similar to that discussed above), in which encouragement to receive the treatment of interest is randomized. Using PAP devices as an example, a randomly selected group of drivers would be given some kind of encouragement to use the devices. This randomized encouragement could then be used as an instrumental variable for receiving and using the device, making it possible to examine, for example, the effects of PAP use on crash rates. (For more examples of and details on instrumental variables, see Angrist et al. [1996]; Baiocchi et al. [2010]; Hernán and Robins [2006]; and New-house and McClellan [1998].)
Regression Discontinuity
Regression discontinuity can be a useful design when an intervention is administered only for those exceeding some threshold quantity. For example, everyone with a hypopnea score above some threshold would receive a PAP device, and those below the threshold would not. The analysis then would compare individuals just above and just below the threshold, with the idea that they are likely quite similar to one another except that some had access to the treatment of interest while others did not. Bloom (2012) provides a good overview of these designs.
Interrupted Time Series
Interrupted time series is a useful approach for estimating the effects of a discrete change in policy (or law) at a given time (see, e.g., Biglan et al., 2000). The analysis compares the outcomes observed after the change with what would have been expected had the change not taken place, using data from the period before the change to predict that counterfactual.
One useful aspect of this approach is that it can be carried out with data on just a single unit (e.g., one state that changed its law), with repeated observations before and after the change. However, the design is stronger when there are also comparison units that did not implement the change (such as a state with the same policy that did not change it), which can help provide data on the temporal trends in the absence of the change. This could be useful, for example, for examining the effect of a change in a company health program if data also were available from a company that did
not make the change at that time. These designs, with comparison subjects, are known as “comparative interrupted time series” designs.
A special case of comparative interrupted times series is difference-in-difference estimation, which is basically a comparative interrupted time series design with only two points, before and after the change. This approach compares the differences before and after the change between two groups, one that did and one that did not experience the change. This approach enables controlling for secular changes that would have taken place in the absence of the change of interest, as well as differences between the groups that do not change over time. (A good reference for these designs is Meyer [1995].)
Sensitivity Analysis
For propensity score approaches, instrumental variable analyses, and many of the other techniques described here, it is useful to determine the robustness of one’s inference through the use of sensitivity analysis. As noted above, one of the key assumptions of propensity score matching is that bias from unobservable covariates can be ignored. If one could model the effect of unobserved covariates, one could test this assumption by calculating the difference between estimated treatment effects—after controlling for observed covariates and the effect of unobserved covariates. If the estimated treatment effect were essentially erased by unobservable covariates, one could conclude that the treatment effect was due to the bias from unobservable covariates and was not a true treatment effect. However, testing the assumption is impossible because researchers do not have data on unobservable covariates. Therefore, a researcher would need to obtain a proxy for the bias from unobserved covariates, which would require a detailed understanding of the phenomenon being researched. As a result, sensitivity analysis procedures involve examining how much unmeasured confounding would need to be present to alter the qualitative conclusions reached and then trying to determine whether that degree of confounding is plausible. (For details, see Hsu and Small [2013]; Liu et al. [2013]; and Rosenbaum [2005].)
Generalizing Findings from Observational Studies to a Different Population
Often it is necessary to draw inferences for a population for which directly relevant research has not been carried out. A key example in the present context is drawing inferences about commercial motor vehicle drivers when the relevant research is for passenger car drivers. When is it safe to make such an extrapolation?
In this case, one needs first to assess internal validity for the population on which the relevant study was done, and then assess the generalizability of the findings to another population of interest. The internal validity question involves the strength of the causally relevant inference that can be drawn about a given research question for the population and treatment studied (which may differ from the population and treatment of interest). The answer will naturally depend on the study design and analysis plans. Different study designs have different implications regarding what can be concluded. The second issue is the generalizability of the findings. The hope is that the findings can be translated to the administration of the same or a closely related treatment for a similar population.
Criteria for determining the degree to which a study enables causal inference have been considered for many decades. In the area of medical and epidemiologic studies, one well-recognized set of criteria was advanced by Hill (1965). These criteria have evolved over time, and a summary of their modern interpretation is as follows:
- Strength of association between the treatment and the outcome: The association must be strong enough to support causal inference.
- Temporal relationship: The treatment must precede the outcomes.
- Consistency: The association between treatment and outcomes must be consistent over multiple observations among different populations in different environments.
- Theoretical plausibility: There must be a scientific argument for the posited impact of the treatment on the outcome.
- Coherence: The pattern of associations must be in harmony with existing knowledge of how the treatment should behave if it has an effect.
- Specificity: A theory exists for how the treatment affects the outcome of interest that predicts that the treatment will be associated with that outcome in certain populations but not associated (or less associated) with other outcomes and in other populations, and the observed associations are consistent with this theory. Furthermore, alternative theories do not make this same set of predictions (Cook, 1991; Rosenbaum, 2002).
- Dose-response relationship: Greater exposure to the risk factor is associated with an increase in the outcome (or a decrease if the treatment has a negative effect on the outcome).
- Experimental evidence: Any related research will make the causal inference more plausible.
- Analogy: Sometimes the findings can be extrapolated from another analogous question.
The panel suggests an additional criterion—the elimination of alternative explanations for observed associations—to be key in helping to establish a causal relationship.
While criteria for establishing causal relationships have evolved over time, the principles articulated by Hill are still valid. The panel wishes to emphasize the criteria of consistency, theoretical plausibility, coherence, and experimental evidence, which support the point that causal inference often is not the result of a single study but of a process in which evidence accumulates from multiple sources, and support for alternative explanations is eliminated. As described in this chapter, the past 30 years also have seen many advances regarding methods for estimating the effects of “causes” or interventions in nonexperimental settings.
There is value, then, in using a variety of approaches to better understand the arguments that can be made as to whether a treatment or an intervention has an effect. Doing so makes it possible to gain causally relevant knowledge from the collection of relevant studies so as to obtain the best possible understanding of the underlying phenomenon.
A good example of how causality can be established primarily through observational studies is the relationship between cigarette smoking and lung cancer. In the 1950s, Doll and Hill (1950) and others carried out a number of observational studies on the association between cigarette smoking and lung cancer. These studies had the usual limitations and potential for confounding factors common to such studies. Yet strong associations were found across multiple populations and settings, and this association also was shown to be monotonically related to the amount of smoking (see Hill’s criterion on the dose-response relationship above). Some, however, including R.A. Fisher, proposed an alternative explanation: that there existed a factor that increased both the likelihood a person would use tobacco and the risk of contracting lung cancer, such as a genetic variant that made a person more likely to smoke and more likely to contract lung cancer through independent mechanisms. This alternative hypothesis was placed in doubt by a sensitivity analysis showing that if such a factor existed, it would need to have an association with smoking at least as great as the observed association between smoking and lung cancer, and the proposed factors, such as genetic variants, were unlikely to have such a strong association with smoking. Other alternative hypotheses were systematically rejected (see Gail, 1996). Even though a randomized controlled study of tobacco use was clearly infeasible, it became clear through the variety of available studies that supported the hypothesis and failed to support the rival hypotheses that cigarettes were a causal factor for lung cancer.
The spectrum of observational study types includes retrospective cohort and case-control studies, prospective studies, and various types of
designs based on observational data, described by Shadish and colleagues (2002). These techniques, and additional ideas described here, have been applied in a number of policy areas and can be used to reduce the opportunity for confounding factors to influence outcomes when a study does not have a randomized controlled design.
Once treatment efficacy has been addressed through a causal understanding of the phenomenon, one is left with the question of the generalizability of the findings from the available studies to other populations and interventions. What one would like is to have a sufficiently clear understanding of the science underlying a finding of treatment efficacy that one can transfer the finding to the administration of the same or a closely related treatment for different populations. For an excellent discussion of this issue, see Pearl and Bareinboim (2011).
This page intentionally left blank.


