


Below is the uncorrected machine-read text of this chapter, intended to provide our own search engines and external engines with highly rich, chapter-representative searchable text of each book. Because it is UNCORRECTED material, please consider the following text as a useful but insufficient proxy for the authoritative book pages.
16 C h a p t e r 2 2.1 Shrp 2 Naturalistic Driving Study Data An onboard data acquisition system (DAS) was designed, manufactured, and installed in each volunteerâs own vehicle. Data were recorded continuously while the participantâs vehi- cle was operating and sampled at the original resolution of the sensors. Recorded data included vehicle speed, accelera- tion, and braking; all vehicle controls; lane position; forward radar; and video views forward, to the rear, and on the driverâs face and hands (see Figure 2.1). Additional details may be found at the study websites www.SHRP2nds.us/ and http://forums. SHRP2nds.us/. 2.2 Formal Data access procedures Institutional Review Board (IRB) approval was received through the Swedish IRB 00005875 Regional Ethical Review Board. The Federal Wide Assurance on file with the Depart- ment of Health and Human Services is FWA00016822, Chalmers University of Technology. The IRB review for Phases 1 and 2 was done by IRB 00005875; the continuing review was taken care of by IRB 00001183. A data requirements specifica- tion was formulated in cooperation with the data supplier, VTTI. After the data requirements specification was finalized, a data sharing agreement was executed and the data were received. 2.3 targeted General Crash population Five Lead-Vehicle Precrash Scenarios were selected according to the 37 precrash scenario typology for crash-avoidance research (Najm and Smith 2007). Najm and Smith established a common typology that is useful for both crash and near-crash scenarios. These scenarios were targeted (each crash or near crash was classified into one of these scenarios) because they were (a) highly ranked in crash frequency, functional years lost, and economic cost, (b) proven to be of particular relevance for inattention, and (c) suitable for planned analyses: ⢠Scenario 22: Following vehicle making a maneuver (fol- lowing vehicle making a maneuver and approaching lead vehicle). ⢠Scenario 23: Lead vehicle accelerating (following vehicle approaching an accelerating lead vehicle). ⢠Scenario 24: Lead vehicle moving at lower constant speed (following vehicle approaching lead vehicle moving at lower constant speed). ⢠Scenario 25: Lead vehicle decelerating (following vehicle approaching decelerating lead vehicle). ⢠Scenario 26: Lead vehicle stopped (following vehicle approaching a stopped lead vehicle). These five Lead-Vehicle Precrash Scenarios are approxi- mately mapped to the rear-end crash type used in National Automotive Sampling System (NASS) crash databases, includ- ing the General Estimates System (GES) and the Crashwor- thiness Data System (CDS) (Najm et al. 2003). Together, these five precrash scenarios constitute about 29%, or 1.7 million, of the crashes that occurred in the United States in 2004 (see Table 2.1). 2.4 event Sample-Size request Four types of events were requested for analyses: crash events (C), near-crash events (NCs), matched baseline events (MBLs), and random baseline events (RBLs). The Phase 2 data request was for a minimum of 220 event clusters. An event cluster is composed of three events: (1) one crash or near-crash event, plus (2) one random baseline event, and (3) one matched baseline event. That is, each crash or near-crash event was accompanied by two baseline events that make up an analysis âcluster.â Thus, the request was for a minimum of 220 crash Data Set Formation and General Methodology
17 Table 2.1. Characteristics of Targeted Crash Population, by Precrash Scenario Type 22. Following Vehicle Making a Maneuver 23. Lead Vehicle Accelerating 24. Lead Vehicle Moving at Lower Constant Speed 25. Lead Vehicle Decelerating 26. Lead Vehicle Stopped Total Crashes 85,000 (1.44%) 19,000 (0.32%) 210,000 (3.53%) 428,000 (7.2%) 975,000 (16.41%) 1,717,000 (28.9%) Vehicles involved 180,000 (1.69%) 40,000 (0.38%) 445,000 (4.16%) 936,000 (5.33%) 2,162,000 (20.21%) 3,763,000 (31.77%) People involved 249,000 (1.66%) 54,000 (0.36%) 612,000 (4.07%) 1,283,000 (8.54%) 3,032,000 (20.18%) 5,230,000 (34.81%) Economic cost (U.S. dollars) 1,212,000 (1.01%) 243,000 (0.23%) 3,910,000 (3.26%) 6,390,000 (5.33%) 15,388,000 (12.84%) 27,143,000 (22.67%) Functional years lost 18,000 (0.67%) 4,000 (0.15%) 78,000 (2.81%) 100,000 (3.62%) 240,000 (8.69%) 440,000 (15.94%) Source: 2004 GES Statistics. Figure 2.1. The four video views of the carâs interior.
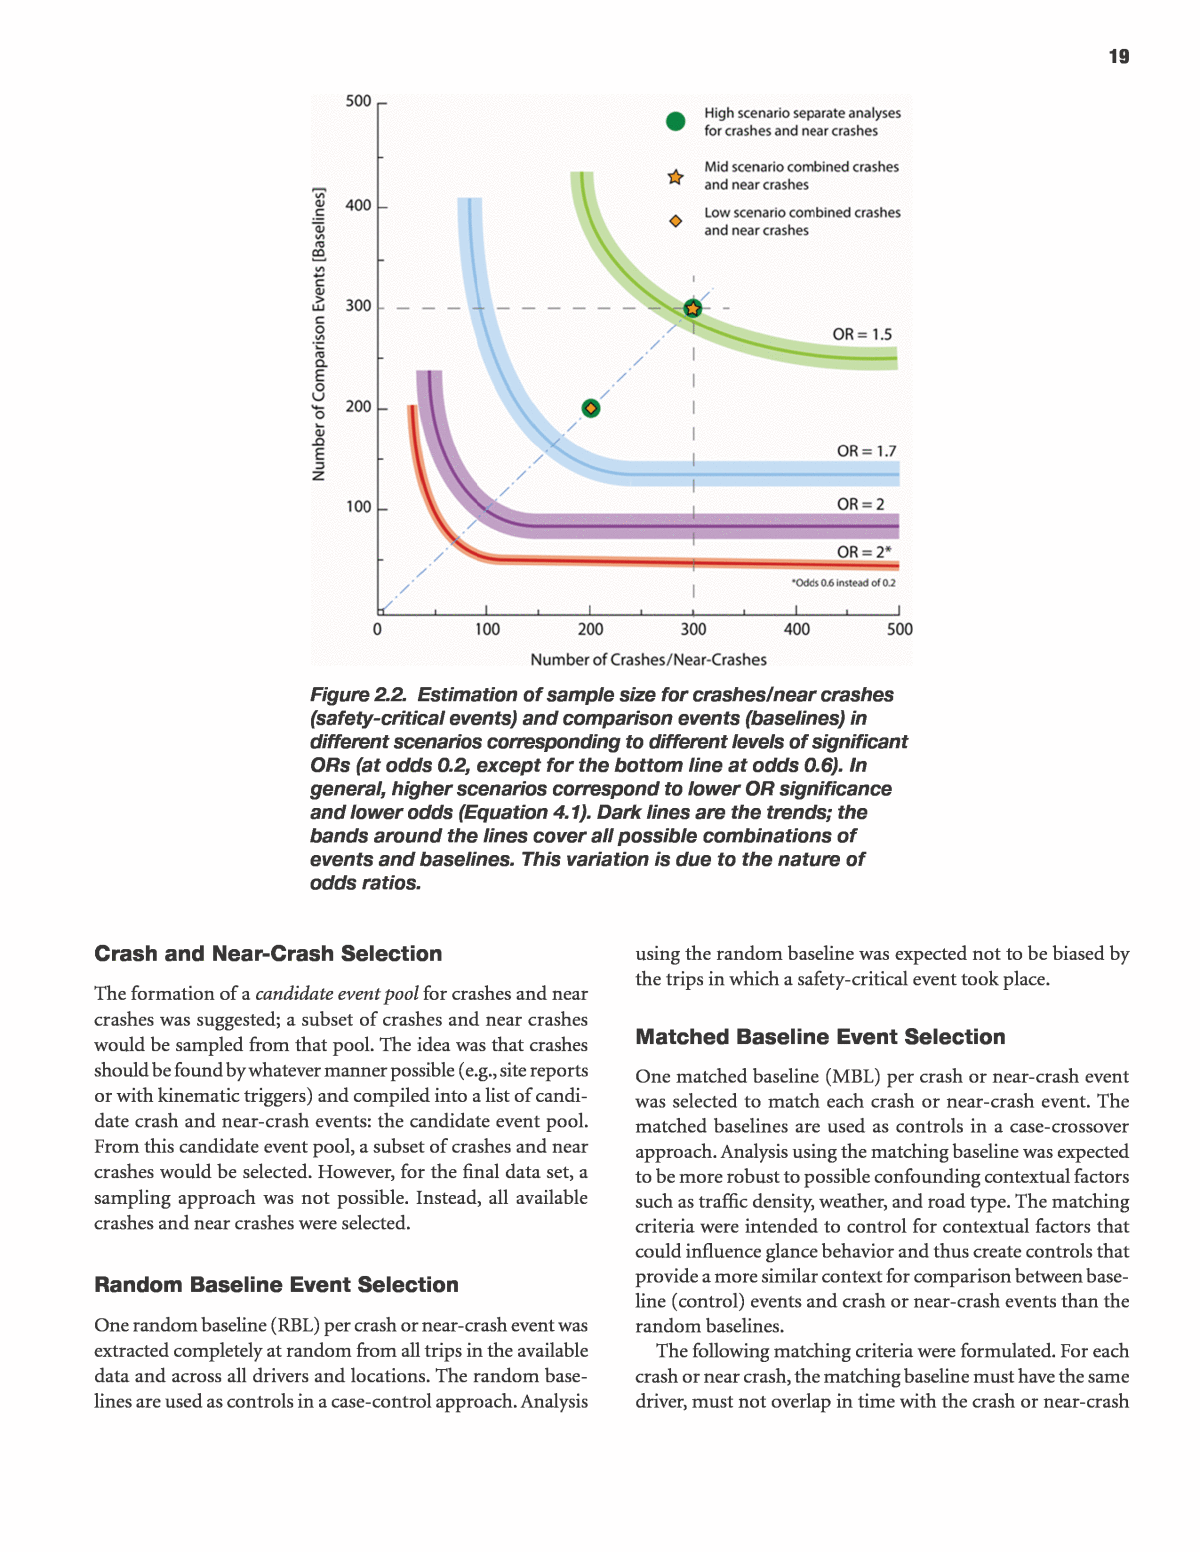
18 or near-crash events, a minimum of 220 MBLs, and a minimum of 220 RBLs, for a total minimum of 660 events. The exact proportion of crash versus near-crash events in the minimum 220 was difficult to predetermine as it was not known how many crashes would be available. The SHRP 2 database was not finalized at the time of extraction. However, a minimum of 100 crash events was requested. This 100-crash minimum was based on an estimation of how many lead- vehicle crashes (precrash Scenarios 22â26) should be avail- able in the final SHRP 2 data set and on the expectation that in-vehicle Automatic Crash Notification algorithms would immediately identify most crashes for immediate processing, even if the database was not fully uploaded. This estimate was calculated in the following manner. Because the five targeted precrash scenarios make up about 29% of the total number of crashes in the general population, and 29% of the 700 pro- jected SHRP 2 crashes equals 203 Lead-Vehicle Precrash Scenarioâtype crashes, and as half of these should be crashes in which the subject vehicle strikes a lead vehicle (as opposed to the following vehicle hitting the subject vehicle), it could be expected that there should be about 100 crashes in the SHRP 2 database that are eligible for our analysis. Further, for near crashes, it should be relatively easy to find a minimum of 100 near crashes, as the projected total number of near crashes was 7,000, or about 1,000 eligible Lead-Vehicle Pre- crash Scenario near crashes. The sample-size request was driven by an analysis of effect- size requirements for computation of odds ratios (ORs) and by budget considerations. An odds ratio is computed as a ratio of the odds in a safety-critical event (crash or near crash) and a comparison event (baseline event): ( ) ( )= â (2.1)OR Odds Safety Critical Event Odds Comparison Event Previous analyses of glance variables in the 100-car data showed that odds for comparison events are relatively inde- pendent from the glance variables, and significant ORs were as low as 1.3 (Victor and Dozza 2011; Liang et al. 2012). Further, OR significance depends on its confidence interval (CI), which can be calculated by computing the standard error (SE) and applying Equation 2.2. = ( )± (2.2)log 1.96CI exp OR SE In general, the lower the OR and the odds, the more sam- ples are needed to show statistical significance. Increasing the number of baselines helps achieve statistical significance; however, the beneficial effect of adding more baselines dis- sipates when the number of baselines is approximately four times as large as the number of safety-critical events. Fig- ure 2.2 illustrates these features and trends by examining four different scenarios with different OR and odds values inspired by previous analyses of the 100-car data set (Victor and Dozza 2011; Liang et al. 2012). The high scenario cor- responds to reaching a significant OR equal to 1.5, with odds for comparison events equal to 0.2. In this high scenario, it is possible to compute ORs in separate analyses of 200 crashes and 300 near crashes. In the medium scenario, OR = 1.7 and odds = 0.2. In the low scenario, OR = 2 and odds = 0.2. In the minimum scenario, OR = 2 and odds = 0.6. In the medium and low scenarios, crashes and near crashes are grouped together for the OR calculation. Figure 2.2 can be used, for instance, to appreciate that if 300 safety-critical events are available (vertical dashed line), then at least 300 baselines are necessary to show significance for OR as low as 1.5. Figure 2.2 also shows that if safety-critical events are less than 200, then achieving significance for OR equal to 1.5 may be hard even if a larger number of baselines is available. Figure 2.2 was generated using real data (up to 828 safety- critical events and 5,000 baselines) from the 100-car study (available at http://forums.vtti.vt.edu/index.php?/files/ category/3-100-car-data/). However, in this context, it should be considered a qualitative indication primarily because of dif- ferences in scenarios used. The safety-critical events expected from SHRP 2 for this projectâs analyses are restricted to a spe- cific set of precrash scenarios (lead-vehicle). As a consequence, both the odds and the OR may be different than in the 100-car study, in which many different scenarios were considered together. For reference, the significant OR levels found by Klauer et al. (2006, 2010) and Liang et al. (2012) were all above 2.02 for the Total Glance Time variable. 2.5 event Sampling A desired sampling procedure was formulated and requested. However, this procedure encountered many practical con- straints, and the actual sampling procedure used all crashes and near crashes that were available at the time of data extraction. A description of the amount of available, searchable data in the database when data were extracted was requested as multiple data deliveries took place throughout fall 2013 and spring 2014. It proved difficult to determine the amount of data that was searched because data were in various stages of processing and there were many technical difficulties. The data provider, VTTI, estimated that about 20% to 30% of the expected final data set was fully surveyed through kinematic triggers but that the full data set was âsurveyedâ by automatic notification processes (such as onboard Automatic Crash Notification algorithms, incident button presses, and site reports). That is, many crashes and some near crashes were found through automatic notification processes while the study was being run and were therefore prioritized for data processing above other incoming data. Thus, it is currently difficult to know how many of the final set of lead-vehicle crashes are included in the current data set.
19 Crash and Near-Crash Selection The formation of a candidate event pool for crashes and near crashes was suggested; a subset of crashes and near crashes would be sampled from that pool. The idea was that crashes should be found by whatever manner possible (e.g., site reports or with kinematic triggers) and compiled into a list of candi- date crash and near-crash events: the candidate event pool. From this candidate event pool, a subset of crashes and near crashes would be selected. However, for the final data set, a sampling approach was not possible. Instead, all available crashes and near crashes were selected. Random Baseline Event Selection One random baseline (RBL) per crash or near-crash event was extracted completely at random from all trips in the available data and across all drivers and locations. The random base- lines are used as controls in a case-control approach. Analysis using the random baseline was expected not to be biased by the trips in which a safety-critical event took place. Matched Baseline Event Selection One matched baseline (MBL) per crash or near-crash event was selected to match each crash or near-crash event. The matched baselines are used as controls in a case-crossover approach. Analysis using the matching baseline was expected to be more robust to possible confounding contextual factors such as traffic density, weather, and road type. The matching criteria were intended to control for contextual factors that could influence glance behavior and thus create controls that provide a more similar context for comparison between base- line (control) events and crash or near-crash events than the random baselines. The following matching criteria were formulated. For each crash or near crash, the matching baseline must have the same driver, must not overlap in time with the crash or near-crash Figure 2.2. Estimation of sample size for crashes/near crashes (safety-critical events) and comparison events (baselines) in different scenarios corresponding to different levels of significant ORs (at odds 0.2, except for the bottom line at odds 0.6). In general, higher scenarios correspond to lower OR significance and lower odds (Equation 4.1). Dark lines are the trends; the bands around the lines cover all possible combinations of events and baselines. This variation is due to the nature of odds ratios.
20 event, and must have a maximum amount of 1.5 seconds of standstill (<0.1 km/h). In addition to these three absolute cri- teria, the following optional matching criteria were defined (ordered from most important to least important): a lead vehicle should be present during the entire event (but the lead vehicle could change), a lead vehicle should not change, traffic flow should be matched to divided or undivided, the relation to intersection should be matched (not including inter- change), the event should be taken from the same trip, speed should not vary more than ±15 km/h in comparison with the crash or near-crash event, the event should be matched accord- ing to adverse weather (if present in crash or near crash), local- ity should be matched to limited access or not, traffic density should be within one category, and daylight should be matched to day or night. If a matched baseline could not be found to meet all criteria, then the order of importance was used to assist with prioritization in finding matches. 2.6 Final Sample Size The present analysis uses data extracted from the SHRP 2 Naturalistic Driving Study database up until the last data delivery was received April 7, 2014âbefore all SHRP 2 data were available to be searched. The final data set that was used for analyses comprises 46 crash events, 211 near-crash events, 257 matched baseline events, and 260 random baseline events. VTTI provided 47 crash events, 213 near-crash events, 260 matched baseline events, and 260 random baseline events in accordance with our data request. However, three events (one crash and two near crashes) were excluded because more than 30% of the glance data was missing in the 12 seconds preceding the crash point (in the crash events) or minimum time to collision (in the near-crash events). As a consequence, the corresponding matched baselines for these three events were also excluded. 2.7 export Format Data were provided from VTTI to SAFER in this format: ⢠A CSV file with all the time-series standard data from the data acquisition system along with a column for eyeglance location and one for lead-vehicle brake light activation, provided at a 10-Hz rate; ⢠A CSV file with all the time-series standard data from the data acquisition system along with a column for eyeglance location and one for lead-vehicle brake light activation, provided in a rectangular asynchronous format (i.e., each data value is accompanied by its exact timestamp instead of being linked to the closest 10-Hz time bin); ⢠A MATLAB workspace with data structures containing the information exported into the CSV files; ⢠A clip of the forward video corresponding to the time-series data segment; ⢠A clip of the rear video corresponding to the time-series data segment; ⢠A data dictionary spreadsheet; ⢠A baseline reduction spreadsheet; and ⢠An event reduction spreadsheet, containing the full contents of the SHRP 2 crash event video reduction and additional reduction specified by SAFER. 2.8 event Data Event data were delivered for each event as a set of variables that describes each event as a whole (in a single value such as precrash scenario type or driver age). For all events (C, NC, RBL, MBL), SHRP 2âdefined event data variables were delivered by the data provider. All event data variables were delivered, as defined in the SHRP 2 event data dictionary (SHRP 2 NDS Event Definitions and Variables v 2_1.pdf, available at https://insight.SHRP2nds.us/). In addi- tion, demographic questionnaire data and driving history ques- tionnaire data were delivered, as defined in SHRP 2 NDS Driver Assessment and Data Dictionary v1_1.xls (available at https:// insight.SHRP2nds.us/). In addition to the SHRP 2 event data variables, SAFER defined and asked the data provider for addi- tional event data variables. Additional event data variables were calculated after the data were delivered. Key Event Data Variables Only the key event data variables are defined here (for other variables, see the SHRP 2 data dictionaries). Event Severity. This is a general term referring to all valid triggered occurrences of an incident, near crash, or crash that begin at the precipitating event and end when the evasive maneuver has been completed. There were two categories. (1) A crash involves any contact that the subject vehicle has with an object, either moving or fixed, at any speed in which kinetic energy is measurably transferred or dissipated (examples and hints: includes other vehicles, roadside barriers, objects on or off of the roadway, pedestrians, cyclists, or animals). (2) A near crash involves any circumstance that requires a rapid, evasive maneuver by the subject vehicle, or any other vehicle, pedestrian, cyclist, or animal to avoid a crash. A rapid, evasive maneuver is defined as a steering, braking, accelerating, or any combination of control inputs that approaches the limits of the vehicle capabilities. As a general guideline, subject- vehicle braking greater than 0.5 g or steering input that results in a lateral acceleration greater than 0.4 g to avoid a crash con- stitutes a rapid maneuver. Precipitating Event. This is the state of environment or action that began the sequence under analysis. Put another
21 way, what state or action by this vehicle, another vehicle, person, animal, or nonfixed object was critical to this vehicle becoming involved in the crash or near crash? This is a vehicle kinematic measure (based on what the vehicle doesâan action, not a driver behavior). It occurs outside the vehicle and does not include factors such as driver distraction, fatigue, or inter- action with a child. This is the critical event that made the crash or near crash possible. Use the âbut forâ test: but for this event, would the crash or near crash have occurred? This is independent of who caused the conflict (fault). For example, Vehicle A is speeding and then Vehicle B crosses Vehicle Aâs path; the precipitating event is Vehicle B crossing Vehicle Aâs path. If two events occur simultaneously, choose the event that imparted the greatest effect on the crash or near crash. If more than one sequential event contributed to the crash or near crash, determination of which is the precipitating event depends on whether the driver had enough time or vehicular control to avoid the latter event. If the driver avoids one event and immediately encounters another potentially harmful event (with no time or ability to avoid the latter), then the precipitating event is the first obstacle or event that was suc- cessfully avoided (this is where the critical envelope begins and is the reference point for the other variables). If the driver has ample time or vehicular control to avoid the latter event, then that latter event is coded as the precipitating event (the critical envelope begins here, and all other variables are coded on the basis of this event). Note that for cases in which the origin of the precipitating event is not visible (e.g., Other vehi- cle ahead, stopped on roadway more than 2 seconds; or Pedes- trian in roadway), the start point for the precipitating event is when the event is first visible in the forward view of the subject vehicle. Note also that a parking lot is considered a roadway; thus, for instance, a barrier or light pole in the parking lot is considered an object in the roadway. Distraction 1, 2, 3. Distractions involve observable driver engagement in any of the listed secondary tasks, beginning at any point during the 5â6 seconds before the onset of the pre- cipitating event. Note that there is no lower limit for distrac- tion duration. If there are more than three distractions present, select the most critical or those that most directly affect the event (defined by event outcome or closest in time to the event occurrence). Populate this variable in numerical order (if there is only one distraction, name it Distraction 1; if there are two, name them Distractions 1 and 2). This variable was modified and renamed Secondary Task 1, 2, 3 in a later update to the SHRP 2 dictionary. Lead-Vehicle Precrash Scenario Type. This system of classi- fying the crashes is based on the precrash scenarios from Najm and Smith (2007) corresponding to rear-end crashes. The categories are Scenario 22, following vehicle making a maneuver; Scenario 23, lead vehicle accelerating; Scenario 24, lead vehicle moving at lower constant speed; Scenario 25, lead vehicle decelerating; and Scenario 26, lead vehicle stopped. 2.9 time-Series and Video Data Time-series data describe the event over time at a sampling frequency that is specific to each variable. The time-series data used in this project are complex; the aim of this section is to provide only the essential details that are needed to understand the analyses, not a complete documentation as that would be too lengthy. For all events (C, NC, RBL, MBL), SHRP 2âdefined time- series data variables were delivered by the data provider. All event data variables were delivered, as defined in the SHRP 2 data dictionary (SHRP 2 Researcher Dictionary for Time- Series Data, Version December 2, 2010). In addition to the SHRP 2 time-series variables, SAFER defined and requested that the data provider deliver additional time-series variables. Additional time-series variables were calculated after the data were delivered. This section describes the key processing issues and derivation of new variables that were done in addi- tion to those provided in the SHRP 2 time-series data set. Data Preprocessing Once the data were downloaded from the VTTI Scholar web- site, they were (1) processed to check quality and add new measures, (2) restructured to be compatible with the NatWare tools (Dozza 2010), and (3) complemented with information from the data dictionaries, demography, and vehicle type (to make them self-descriptive). Data processing. Data processing consisted of running a script to read all events from VTTI, checking the consistency of the data, and deriving new measures (e.g., Eyes off Path). This step highlighted which data were available for each of the events and pointed out possible incongruences. For example, speed from GPS and the network must be highly correlated, and some values of acceleration are definitely impossible. Data restructuring. Data restructuring is not essential but is of great help to simplify further analyses. In that respect it is a time investment at the beginning of the analyses. Besides mak- ing the data more user friendly and self-explanatory, data restructuring improves computation speed and makes it harder for the analyst to make mistakes (e.g., data are not referred to by arbitrary indexes but by labels). Also, by restruc- turing the data according to the NatWare 2.0 format, which is an evolution of the format used to analyze the 100-car public data (Dozza 2010), it was possible to reuse NatWareâs existing scripts and graphical user interfaces (GUIs) to speed up the analysis and pay off the time investment (Dozza 2013). Data completion. Data completion, similar to data restruc- turing, is not essential but highly desirable because it makes analysis easier and faster. The data dictionary, demographics, protocol, and vehicle information were linked through iden- tifiers to the data in the database.
22 Data quality analysis. The initial data processing (above) checked the data consistency and pointed to some quality issues. Further analyses identified other quality issues. The following key issues were identified and dealt with: ⢠Transition time coding procedure. The current International Organization for Standardization (ISO) standard specifies that glance time consists of transition time toward a target plus the subsequent dwell time on that target (ISO 15007). In Phase 1, we determined that the initial coding procedure added transition time to the preceding targetâs dwell time (e.g., as in Klauer et al. 2006). The transition classification procedure was modified for the final data set so that transi- tions were coded independently, thus enabling the researcher to add the transition time to the subsequent targetâs dwell time (as in the ISO standard) or to the preceding targetâs dwell time (as in Klauer et al. 2006). The present data set uses glance coding according to the ISO standard method with the transition time added to the subsequent targetâs dwell time. ⢠Mask Head Tracker signal quality. In Phase 1, an evaluation of the feasibility of using the Mask Head Tracker for auto- matic glance classification was performed by comparing it to manual video annotation. This evaluation indicated that it is not advisable to use head tracking data for Phase 2. Manual video annotation of eyeglances was chosen for Phase 2. ⢠Lead-Vehicle Precrash Scenarioâtype classification. This clas- sification included difficulties in classification. The Najm and Smith (2007) descriptions were not as easily interpreted as we had hoped, and there seems to be a lot of room for interpretation. For example, we were uncertain how to deal with lane-change conflicts, conflicts occurring during turns at intersections, and in particular, conflicts when the lead vehicle was stopped. Najm and Smith (2007) state in the description of Scenario 26 (lead vehicle stopped), âIn about 50% of the lead vehicleâstopped crashes, the lead vehicle first decelerates to a stop and is struck afterwards by a fol- lowing vehicle. This typically happens in the presence of a traffic control device or [when] the lead vehicle is slowing down to make a turn. Thus, this particular scenario overlaps with the lead vehicleâdecelerating scenario.â As it is not stated how long the stop lasted, we decided to use the reaction-time point as the deciding time (if vehicle was stopped when the driver started to react, then Scenario 26; if decelerating but not yet stopped or never stops, then Scenario 25). Develop- ment of standardized definitions is recommended. ⢠Data synchronization. Data synchronization quality issues were encountered and dealt with in various ways. ⢠Inconsistencies in format. Data formats were not uniform; for example, event data categories sometimes had additional spaces or commas or different spellings. ⢠Spatial offsets between sensors. When performing post- processing of radar with complementary data from manual annotation of the lead-vehicle width from video, the dis- tance between the radar and the front facing camera for each unique car model is desired but not available. Radarâcamera distance is used to get more accurate width estimates of the vehicle ahead and more seamless merging of the radar and lead-vehicle-width video annotation data sets. Additionally, to achieve optical parameters as the driver sees them; it would have been preferable to also know the forward- looking camera position in relation to the head of the driver in different seating positions. As this is not available in the SHRP 2 data set, generic estimates were made. Also, the dis- tance between the radar and the front bumper may play a (small) role in calibration. ⢠Subject-vehicle speed quality. The CAN speed precision, syn- chronization, and general quality vary greatly between the different events. The CAN speed quality can thus be differ- ent from one event to another. Several quality issues were identified, like gaps in the data (missing data) or low resolu- tion (large âstepsâ). Furthermore, the sampling rate of the CAN speed varies from 1 Hz to 10 Hz. Reasonability checks of the data were performed throughout the project, one example being speed comparison between CAN speed data and video, and comparison between by GPS speed and CAN speed. The CAN data were processed to get the subject- vehicle speed (SVspeed). Because of issues with synchro- nization and SVspeed resolution, attempts were made to combine GPS speed data, CAN speed data, and accelerom- eter data, but in the end only a simple linear interpolation of CAN speed was used. The interpolation was verified using integrated longitudinal acceleration. Analysis requir- ing SVspeed excluded certain events for which CAN speed was missing (due to nonexisting CAN on older model cars), and this is noted where needed in the analyses. ⢠Radar data quality. The radar quality was problematic, and the radar signals were generally not used in the final analy- ses. Instead, forward video manual annotation of vehicle width was used (see the time-series variable definitions below). Estimated range and range rate were derived from video-based width estimation. VTTI is in the midst of conducting a project addressing radar quality (the VTTI RADAR data project). The objec- tive of this project is to postprocess the data streams into measures characterizing driver behavior and forward con- ditions through automated means, extracting the follow- ing items from the radar: 44 Filter, interpolate, extrapolate; 44 Reorganize data to support analysis and research; 44 Select closest target in path of participant vehicle; 44 Eliminate ghost targets;
23 44 Allow trip summary data to be calculated, including number of targets tracked, time headway, and time to collision; 44 Path prediction in the context of determining lead vehicles; 44 Parse targets into lanes; and 44 Develop and refine the necessary data to be applied to the crash and near-crash algorithms that use radar variables. At this point there is insufficient information on the out- come of the VTTI RADAR data project to comment on how the identified quality issues will be addressed in the future. We believe that the video-based techniques described in this report will help improve radar data quality. These tech- niques can be used to fill in missing data, smooth data, and verify potentially inaccurate data. We recommend that researchers who are using radar data use forward video to provide verification and context to the radar data. ⢠Optical distortion in the forward video. When working with image processing or manual annotation of distances in an image, distortion of the image needs to be taken into account by rectification. Oak Ridge National Laboratory provided a set of calibration (checker board) videos and a first set of calibration parameters. However, after evalua- tion of this first parameter set, it was determined that the edges and corners of the images were not rectified enough for use in this project. Recalibration was made, but this produced results similar to the Oak Ridge parameter setâs. Yet another recalibration was performed, more focused on edge rectification using the Camera Calibration Toolbox for MATLAB (Bouguet 2010). The new calibration param- eters provided a significantly better rectification at the edges and corners of the image than the original data set and avoided much under- and overestimation of lead-vehicle widths when manually annotating video. Duration of Events For each event, 60 seconds of data from the data acquisition system were delivered if data were available in the trip for that period. For the crash events, the 60 seconds included 40 sec- onds before and 20 seconds after the crash point. For the near-crash events, the 60 seconds included 40 seconds before and 20 seconds after the minimum distance to lead vehicle. For the random baseline events, 60 seconds of data were selected at random from the available data. For the matched baseline events, 60 seconds of data were selected according to the matching criteria below if that much data were available in that particular trip. A prerequisite for many analyses was the manual video annotation of crash, near-crash, and baseline events. This manual video annotation produced, for example, glance behavior, event data, and data regarding lead-vehicle width (as specified below). Video annotation was performed by VTTI for all annotated variables except the lead-vehicle width, which was annotated by SAFER. For each event, VTTI manually annotated 20 seconds of data by viewing video and associated data (such as speed) for each frame of video. For the crash events, these 20 seconds included 15 seconds before and 5 sec- onds after the crash point, with the additional requirement that the data should include at least 5 seconds before the precipitating event. For the near-crash events, the 20 seconds included 15 seconds before and 5 seconds after the minimum distance to lead vehicle, with the additional requirement that the data should include at least 5 seconds before the precipitat- ing event. The minimum distance was used because it was eas- ily determined by video annotators. For the matched baseline and random baseline events, the 20 seconds of data for manual video annotation were annotated in the middle of the corre- sponding 60-second data from the data acquisition system (i.e., 20â40 seconds into the 60 seconds). Reference points. For time-series analyses, a reference point needs to be specified for each event type. ⢠Matched and random baseline reference points: For random baselines and matched baselines, the reference point was always set to 0 seconds at 15 seconds into the annotated 20-second data set that was received from VTTI, and that can be seen as a random point. ⢠Crash event reference points: For most analyses here (Chap- ters 6â8), crash events are aligned to the crash point (as determined from video annotation by VTTI) as the refer- ence point and set to 0 seconds. In analyses concerned with the precipitating event (Chapter 5), each crash event is realigned, or shifted, to match up in time to the precipitating event, which is the reference point. ⢠Near-crash reference points: For most analyses here, near- crash events are aligned to the optically defined minimum time to collision (minTTC) as the reference point and set to 0 seconds. In analyses concerned with the precipitating event (Chapter 5), each near-crash event is realigned, or shifted, to match up in time to the precipitating event as the reference point. Note that the data were originally delivered from VTTI to SAFER with minimum distance as the refer- ence point set to 0 seconds because that was easiest to deter- mine from video before minTTC was known. After SAFER manually video annotated the lead-vehicle width for each near-crash, the near-crash events were realigned to minTTC as the reference point set to 0 seconds, instead of the mini- mum distance point. MinTTC was chosen as the point within the near-crash event that was most safety critical. The consequence of this change of the near-crash reference point meant that a 12-second window was the maximum length that was used that included all events before the crash
24 point or minTTC. This was because the minimum distance point for some near crashes was up to 3 seconds later than the minTTC. Therefore, the 12 seconds before the crash point (in crash events), 12 seconds before minTTC (in near-crash events), and 12 seconds before the reference point in the matched and random baselines was chosen as the primary common time period for analyses. In analyses using data from manually coded lead-vehicle width (Chapters 7 and 8), a shorter time window is used because of limitations related to the size of the lead vehicle at far distance, as described there. Manual annotation of vehicle width in forward video. Given that the radar data were difficult to work with, a method was developed to derive kinematic and optical variables related to the lead vehicle (LV) by manually annotating lead-vehicle width in forward video. After an image rectification, the lead- vehicle-width annotation was performed for all crash, near- crash, and matched baseline events by viewing forward video and clicking on the outer edges of the left and right brake lights in every other video frame in a purpose-built tool. Random baselines were not annotated as they did not con- tain much lead-vehicle presence. The main steps of annota- tion are chronologically listed below. The real lead-vehicle width was set by identifying the car model or by selecting a standard width. After applying the dis- tortion rectification on the frames, the LV width was annotated. The annotation process was done on every other frame; there- fore the annotation had a frequency of 7.5 Hz. To transform this annotation into the range between the SV and the LV, the following steps were undertaken: (1) apply a square-kernel smoothing filter on the annotated signal (see definition of filtered lead-vehicle pixel width), (2) up-sample the signal to 15 Hz, (3) transform the annotated pixel width into the range between the LV and the SV. The spatial offset between the camera and the front bumper was set to 2.128 meters (see definition of range). For analyses using lead-vehicle-width-derived data (Chap- ters 7 and 8), we used a window of annotated lead-vehicle data (in crash events) from -10 seconds preceding the crash point (0 seconds) until 2 seconds after, (in near-crash events) from -10 seconds preceding the minTTC (0 seconds) until 2 seconds after, and (in matched baselines) from -10 sec- onds preceding the baseline reference point (0 seconds) until 2 seconds after. Inter-rater reliability testing was performed as part of the process to ensure quality of the lead-vehicle-width coding. This method was developed and described by Bärgman et al. (2013) using Video Even Recorders. According to Bärgman et al., the method accurately predicts ranges less than 10 meters. For ranges between 10 meters and 40 meters (car following), the error is less than 5% if the lead-vehicle-width estimation is accurate. The method should be used with care for ranges over 40 meters. To ensure high quality (low variance between annotators) of data used for analysis, a training process was used. Two events were annotated by five human reductionists (annotators) and analyzed for variability in coding. The results confirmed the conclusions from Bärgman et al. (2013) that annotator comparability is high for ranges up to 40 meters. The closer the lead vehicle, the more comparable (smaller coding variation, measured by smaller standard deviation) different annotations are. Eyeglance Time-Series Variables Glance Location. Eyeglance locations were manually annotated by VTTI by viewing the driver face video for every video frame (15 Hz). Technically, these glance locations are actually dwell times, as the transitions are coded separately (see ISO 15007). The following categories and locations were used. ⢠-4. No Video. Unable to complete glance analysis because the face video view is temporarily unavailable. Note that this sometimes occurs for one to two syncs at a time, and a âvideo not availableâ message may appear. If the glance location is the same before and after this occurs and the period is only one to two syncs long, then code through this period as the glance location present before and after. If the video-not-available period is longer than two syncs or it occurs during a transition, use the âNo Videoâ option. ⢠-3. Transition. Any frame that is between fixations as the eyes move from one fixation to the next. Note that the eyes often fixate while the head is still moving. This category is based on the eyeâs fixation rather than the headâs move- ment, unless sunglasses preclude the eyes from being seen. ⢠-2. No Eyes Visible. Glance location unknown: Unable to complete glance analysis due to an inability to see the driverâs eyes/face. Video data are present, but the driverâs eyes and face are not visible due to an obstruction (e.g., visor, hand) or glare. Use this category when there is no way to tell whether the participantâs eyes are on or off the road. This is the default and most often used âunknownâ option, but there may be times when the âoff roadâ option listed below may be appropriate. ⢠-1. Not annotated. Time-series data for which glance anno- tation was not performed. ⢠Forward (Center). Any glance out the forward windshield directed toward the direction of the vehicleâs travel. Note that when the vehicle is turning, these glances may not be directly forward but toward the vehicleâs heading. Count these as forward glances. Note also that when the vehicle is driving in reverse, forward will be out the back window. ⢠Left Windshield. Any glance out the forward windshield when the driver appears to be looking specifically out the left margin of the windshield (e.g., as if scanning for traffic before turning or glancing at oncoming traffic). This glance
25 location includes anytime the driver is looking out the windshield but clearly not in the direction of travel (e.g., at road signs or buildings). ⢠Right Windshield. Any glance out the forward windshield when the driver appears to be looking specifically out the right side of the windshield (e.g., as if scanning for traffic before turning, at a vehicle ahead in an adjacent lane, or reading a road sign). This glance location includes anytime the driver is looking out the windshield but clearly not in the direction of travel (e.g., at road signs or buildings). ⢠Left Window/Mirror. Any glance to the left-side mirror or window. ⢠Right Window/Mirror. Any glance to the right-side mirror or window. ⢠Rearview Mirror. Any glance to the rearview mirror or equipment located around it. This glance generally involves movement of the eyes to the right and up to the mirror. This includes glances that may be made to the rearview mirror to look at or interact with back seat passengers. ⢠Over-the-Shoulder (left or right). Any glance over either of the participantâs shoulders. In general, this will require the eyes to pass the B-pillar. If over the left shoulder, the eyes may not be visible, but this glance location can be inferred from context. Note that if it is clear from context that an over-the-shoulder glance is being made not to check a blind spot but instead to interact with a rear seat passenger (e.g., food/toy is being handed back), then code the glance as Passenger. If context cannot be known with a high level of certainty, then code as Over-the-Shoulder. ⢠Instrument Cluster. Any glance to the instrument cluster underneath the dashboard. This includes glances to the speedometer, control stalks, and steering wheel. ⢠Center Stack. Any glance to the vehicleâs center stack (verti- cal). Not to be confused with center console (cup holder area between driver and passenger), which is discussed under Interior Object. ⢠Cell Phone (electronic communications device). Any glance at a cell phone or other electronic communications device (e.g., Blackberry), no matter where it is located. This includes glances to cell phoneârelated equipment (e.g., battery chargers). ⢠Portable Music Player (iPod or similar MP3 device). Any glance at an iPod or other personal digital music device, no matter where it is located. ⢠Interior Object. Any glance to an identifiable object in the vehicle other than a cell phone. These objects include per- sonal items brought in by the participant (e.g., purse, food, papers), any part of the participantâs body that he or she may look at (e.g., hand, ends of hair), electronic devices other than cell phones (e.g., laptop, PDA), and also original equipment manufacturer (OEM)âinstalled devices that donât fall into other categories (e.g., door lock, window and seat controls). Glances to the center console (cupholder area between passenger seat and driver seat) are also included in this category. The object does not need to be in the camera view for a specific frame to be coded with this category. If it is clear from surrounding video that the participant is look- ing at the object, this category may be used. This category can be used regardless of whether the participantâs hands are/are not visible. Note that if the driver is looking at some- thing that the passenger is handing over, code the eyeglance as Passenger until the object is fully in the driverâs hand, then code it as Interior Object (unless it is a cell phone, in which case code it as Cell Phone). Also, if the driver is look- ing at something that the passenger is holding (but never hands to the driver), code it as Passenger Glance (not Inte- rior Object). Individual studies may ask reductionists to identify objects in logs or drop down menus, or may cate- gorize specific objects as Systems of Interest. ⢠Passenger. Any glance to a passenger, whether in front seat or rear seat of vehicle. Context will be needed (e.g., theyâre talking or handing something) to determine this in some situations. Note that this does not include glances made to rear seat passengers via the rearview mirror. Such glances should be coded as Rearview Mirror. Note that if the driver is looking at something that the passenger is handing over, code the eyeglance as Passenger until the object is fully in the driverâs hand, then code it as Interior Object (unless it is a cell phone, in which case code it as Cell Phone). Also, if the driver is looking at something that the passenger is holding (but never hands to the driver), code it as Passenger Glance (not Interior Object). ⢠Other. Any glance that cannot be categorized using the above codes. The lab manager should be informed of any- thing that could fall under this category, for appropriate follow-up. Some preapproved uses of the Other option are the following: when the driver is looking forward and then looks straight up at the sky as if watching a plane fly by; and when the driver is tilting his or her head back to drink and the eyes leave the forward glance but do not really focus on anything at all. ⢠No Eyes Visible. Eyes Are off Road. Unable to enter specific glance location due to an inability to see the driverâs eyes/ face. However, it is clear that the participant is not looking at the roadway. Video is present, but the driverâs eyes and face are not visible due to an obstruction (e.g., visor, hand), head position, or glare. Use this category when the eyes are not visible, and it is not clear what the participant is look- ing at, but the eyes are obviously not on the roadway. ⢠Eyes Closed. Any time that both the participantâs eyes are closed outside of normal blinking (e.g., the subject is falling asleep or rubbing eyes). As a rule of thumb, if the eyes are closed for five or more timestamps (1â3 second) during a slow blink, code it as Eyes Closed. Otherwise, code it as the Glance
26 Location present before the eyes closed. If one eye remains open, code the location according to the open eye. If only one eye is visible, code according to the visible eye. Eyes on Path. Eyes on Path represents a reduction of the Glance Location variable that is converted into Eyes-on-Path and Eyes-off-Path glances. It has three values: Eyes on Path, Eyes off Path, and Not a Number (NaN). First, glances are cre- ated by adding transition time toward a target to the subse- quent dwell time on that target (ISO 15007 definition). Note that the Glance Location variable has transitions separately coded. Thus, Eyes on Path corresponds to the Forward (Center) Glance Location with transitions added. Eyes off Path corre- sponds to Glance Location Categories 1â15 with transitions added. NaN corresponds to cases in which glance location was unknown (Glance Location Categories -2 and -1). There were no instances of No Video (Category -4). Eye closures were examined to decide how to handle them in relation to the Eyes-off-Path glance time-series variable. An eye closure was coded if the eyes were closed for five or more timestamps (1â3 second). In total, there were only eight eye closures in the entire data set. The duration of these ranged from 1â3 second to 3 seconds. In random baselines, there were two eye closures between 1â3 and 1 second long. In near crashes, there were two eye closures lasting between 1â3 and 1 second and one eye clo- sure, between 2 and 3 seconds. In crashes, there were two eye closures between 1â3 and 1 second duration and one between 1 and 2 second duration. Based on these results, eye closures were coded as Eyes off Path. The following variables were derived using the Eyes off Path time-series variable above: ⢠Proportion of Eyes off Path. Proportion (a proportion from 0 to 1) of time the eyes were off path during a given period of time. These include Off5to1afterPE, Off5to3PE, Off3to1PE, Off1to1afterPE, Off11to9, Off9to7, Off7to5, Off5to3, Off3to1, and Off1to1after. For example, Off5to1- afterPE denotes the proportion of time the eyes were off path in the 5 seconds before until 1 second after the precipi- tating event, Off1to1afterPE is from 1 second before until 1 second after the precipitating event, and so on. Similarly, Off3to1 denotes the proportion of time the eyes were off path from 3 seconds before until 1 second before the crash point (in crash events) or minimum time to collision (in near-crash events). Likewise, Off11to9 is from 11 seconds before until 9 seconds before the crash or minTTC point. These variables are directly comparable to the Total Eyes off Roadway Time (TEORT) variable used previously by, for example, Klauer et al. (2006) and to the Percent Road Cen- ter variable used by Victor et al. (2009) and evaluated in the multidistraction detection algorithm in NHTSA (2013). ⢠Eyes off Path. The amount of time (in seconds) the eyes were off path longer than a certain amount within a given period of time. These include Off0, Off0.1-0.5, Off0.5-1.0, Off1.0- 1.5, Off1.5-2.0, and Off2.0-6.0. For example, Off0.1-0.5 denotes the number of observations with Eyes off Path between 0.1 and 0.5 second in the 5 seconds before and 1 second after the precipitating event. Similarly, Off2.0-6.0 is the number of observations with Eyes off Path between 2 and 6 seconds in the 5 seconds before and 1 second after the precipitating event, and so on. This variable was defined as a categorical variable so that each window of 6 seconds could be classified as belonging to one mutually exclusive category or another. ⢠tg.off. Total glance time off path, the amount of time (in seconds) the eyes were off path in the 12 seconds before and 1 second after the crash or minTTC. ⢠Overlap. The duration of a glance that overlaps (inter- sects) with the 2-second point before the crash or minTTC. This can be either on the path (overlap.on) or off the path (overlap.off). ⢠pre.overlap. The duration of a single glance immediately preceding the off-path glance that overlaps with the 2-second point before the crash or minTTC. This can be either on the path (pre.overlap.on) or off the path (pre.overlap.off). ⢠max.off. The maximum off-path glance duration in the 12 seconds before the crash or minTTC. ⢠min.on. The minimum on-path glance duration in the 12 seconds before the crash or minTTC. ⢠Glances. The number of glances in the 12 seconds before the crash or minTTC. ⢠Complexity. A composite measure of off-path glance sequence complexity, according to Gabadinho et al. (2011). The index uses the number of transitions in the sequence as a measure of the complexity induced by the state ordering and the longitudinal entropy as a measure of the complexity induced by the state distribution in the sequence. ⢠Uncertainty. A composite measure based on the âuncertainty modelâ of the driving situation (Senders et al. 1967). These include uncertainty.3to1, min.uncertainty, m.uncertainty, and max.uncertainty. The model is based on the assumption that during off-path glances, uncertainty cumulatively increases about the road and the possible presence of other vehicles or obstacles, and that certainty cumulatively increases during on-path glances. Uncertainty.3to1 is the value in the 3 seconds to 1 second before the crash or minTTC point. Min.uncertainty is the minimum value in the 12 seconds before the crash or minTTC, m.uncertainty is the mean value in the 12 seconds before the crash or minTTC, and max.uncertainty is the maximum value in the 12 seconds before the crash or minTTC. Other Time-Series Variables Event Time. The time domain within each event plays out with negative values before 0 secondsâwhich is defined as
27 the crash point in crash events and the minimum time to col- lision in near-crash events, and is set at 15 seconds into the video annotated data in the random and matched baseline events. Driver Reaction Point. The onset of the first visible reaction of the subject-vehicle (SV) driver to the principal other vehi- cle, that is, the time at which the driver is first seen to recog- nize and begin responding to the event. This can involve any physiological reaction including body movement, posture, a change in facial expression, a movement of the leg toward the brakeâwhichever came first. Note that this is a time-series variable and different from the Driver Reaction event data variable, which is a specification of how the driver reacted (e.g., braking or steering) rather than a specific timestamp (when) as is defined here. Start of Evasive Maneuver. Ideally the point when the driver is initiating a brake or steering response, but here defined as the first time after the driver reaction point (time) when the SVspeed has a negative derivative (i.e., deceleration). If the derivative is negative already at the Driver Reaction Point, the Driver Reaction Point is used as the Start of Evasive Maneuver. Lead-Vehicle Pixel Width. The manually annotated (video- reduced) width of the lead vehicle in pixels, as seen from the forward video. This is used for all optical parameter and range/range rateâbased variables. The annotations are made on rectified (undistorted) images. Filtered Lead-Vehicle Pixel Width. Limited resolution, noise, and compression artifacts combined with the human factor (reductionist precision in âclickingâ at the edges of the lead vehicle) lowers the ability to consistently and accurately detect lead-vehicle pixel width over subsequent frames (for more detail, see Bärgman et al. 2013). In addition, the tool used for lead-vehicle-width annotation has a limited subpixel resolu- tion. The noise propagates to the calculation of optical variable (Theta, ThetaDot, Tau, invTau, etc.) and range-based variables (range and range rate). This noise is especially problematic for quantities involving a time derivative (e.g., ThetaDot and invTau) and especially at low pixel widths, for which the esti- mation uncertainty is large compared with the pixel width being estimated. Therefore, a square-kernel smoothing filter (convolution-like) with amplitude-adapted width is applied to the raw manually reduced pixel width time-series data. The basic idea behind the filter is as follows: Assuming there is a certain pixel width, W0, for which only one observation is enough to satisfactorily determine the pixel width, combined with the assumption of Gaussian noise with constant vari- ance regardless of the pixel width being measured, a con- stant relative uncertainty can be obtained by averaging N = (W0/W)2 observations. This expression can be obtained by noting that if the measured pixel width W is normally distri- buted around the true value W*, with variance s2, the average of N measurements is also normally distributed around W*, but with variance sN2 = s2/N. Thus, to obtain a certain relative error C = sN/W*, we need N = s2/C2W*2 measurements, and we can set C by choosing a W* = W0 for which we believe that N = 1 yields an acceptable relative error. As only one observa- tion is available at each frame, the observed pixel widths from N consecutive frames are averaged. Rapid changes in the dis- tance to the lead vehicle may result in rapid changes in the observed pixel width, which violates the assumption that N consecutive frames could be averaged. Therefore, the maxi- mum kernel size is limited, and the filter is applied multiple times instead. On the one hand, as the filter size is adaptive, an observa- tion at time ti with a filter width of Ni is influenced by a higher-amplitude observation at ti+k if k ⤠Ni/2. On the other hand, the observation at time ti+k is not influenced by the observation at time ti if k > Ni+k/2. Thus, the filter does not conserve the energy of the signal, but given other sources of error for this application, the effect should be negligible. Practically, this filter runs a square-kernel across the raw lead-vehicle pixel width time series, averaging across a dynamic number of width measurements (frames). The number of mea- surements used (kernel width) was determined by N = (W0/W)2, where we used W0 = 170 pixels, where W is the measured pixel width at each point in time. The implementation we used ran the filter three consecutive times and we allowed the N (kernel width) to be a maximum of only 5 pixels to minimize peak attenuation and phase shift. An example application can be seen in Figure 2.3. Range. The time-series range from the following vehicle to the lead vehicle, in meters. Calculated via manual annotation of lead-vehicle width in pixels, calculated as Range = Wreal/ Wpixels * f - Roffset, where Wreal is the estimated real width of the lead vehicle, Wpixels is the filtered annotated width of the lead vehicle in pixels, f is the focal length of the camera in pixels, and Roffset is the mean offset between the camera and the front bumper estimated from crashes. The real width of the lead vehicle was estimated by either identifying vehicle make and model from the image or, when that was not possible, using standard category widths per vehicle type (Table 2.2). The mean Roffset between the camera and the front bumper was estimated by getting the mean of the range at the time of crash (i.e., only crashes), M = 2.13 m, SD = 0.25 m. Range Rate. The time-series range rate between the subject vehicle and the lead vehicleâthat is, the derivative of the range between the two vehicles, effectively the relative speed, in meters per second. The derivative of the range was made with a three-point floating window linear regression. Subject-Vehicle Speed (SVspeed). The time-series speed of the following (instrumented) vehicle throughout the event; interpolated CAN speed.
28 Lead-Vehicle Speed (LVspeed). The time-series speed of the lead vehicle throughout the event, calculated by adding SVspeed and range rate. Theta (q). The angle of the rear end of the lead vehicle, as seen from the camera. The lead-vehicle pixel width is manu- ally annotated on a rectified image. Calculated by Theta = 2 * arctan(Wpixels/(2 * f )), where Wpixels is the filtered manually Table 2.2. Standard Lead-Vehicle Widths Vehicle Type Standard Width (m) Coupe 1.7 Sedan 1.75 Wagon 1.76 SUV 1.8 Pickup truck ~1.9 Semitrailer truck 2.5 Van 2.5 Car trailer ~1.9 Large car trailer 2.1 Customized sports car 1.82 Note: The âstandardâ lead-vehicle widths were used when make and model could not be extracted from images. For use in transformation from pixel width to range. annotated lead-vehicle width, and f is the camera focal length in pixels. ThetaDot (q-dot). The optical expansion of the rear of the lead vehicle. ThetaDot = d(Theta)/dt. The derivative is practi- cally calculated through a three-point floating window linear regression. Tau (t). Calculated by Tau = Theta/ThetaDot. invTau (t-1). Calculated by invTau = 1/Tau. Time to Collision (TTC). The time left until crash, given no actions by either the lead or the following (subject) driver. Two different uses/definitions. See Inverse Time to Collision. Minimum Time to Collision (minTTC). The smallest TTC in the event. Set to zero at the crash point for crashes. See also Inverse Time to Collision. Inverse Time to Collision (invTTC). In this analysis, invTau has two different definitions. First, it is the simple range rate divided by range (as defined previously). This version of invTTC (and TTC alike) is used in only a few sections in the report. In those cases, it is explicitly stated that invTTC is the range rate over range implementation. Second, in most parts of the report, invTTC is calculated through optically defined TTC, estimated directly from the optical angle in terms of Tau (t)âthat is, Theta (q) divided by its time derivative ThetaDot (q-dot) (Lee 1976). This assumes small angles. Optically, q and q-dot characterize the looming (optical expansion) of the lead vehicle. An advantage of using the optically (rather than the physically) specified TTC is that Figure 2.3. Annotated (raw) and filtered lead-vehicle pixel width in relation to filter size.
29 this is the type of information that humans presumably use to perceive and control the situation kinematics in driving and other forms of locomotion (although it is debated exactly what optical information is used for different types of tasks). Another benefit of using optically defined TTC is that no esti- mate of the real lead-vehicle width is needed, minimizing sources of error. Since TTC goes to infinity at zero relative velocity (e.g., at constant distance in normal following situa- tions), its inverse 1/TTCâreferred to as invTTCâis used in most analyses. Note that a main difference between the range rate/range implementation and the optical implementation is that the former is the estimated invTTC at the vehicle bumper, while the latter is the invTTC at the camera (by the rearview mirror). Time Headway (Headway). The headway and closing dis- tances were calculated on the basis of optical variables man- ually annotated from the forward video, as further described above. The headway between the subject vehicle and lead vehicle was calculated on the basis of the manually anno- tated optical angle q subtended by the POV at the camera and assumptions on vehicle width (see Range), as well as the SVspeed. Model-Estimated Injury Risk (MIR) index. An index related to the risk of an injury of a specific level (MAIS3+) for an event, given a hypothetical driver behavior (glance off-path behavior) and simulated following-vehicle kinematics, calcu- lated through mathematical simulations. Model-Estimated Crash Risk (MCR) index. An index related to the probability of an event becoming a crash, given a hypo- thetical driver behavior (glance off-path behavior) and simulated following-vehicle kinematics, calculated through mathematical simulations. Delta Velocity (DeltaV). Change in velocity of the involved vehicles because of the crash. This variable takes into account masses, and in our implementation assumes a fully plastic impact. It is based on range rate at impact and only available for crashes. For details, see Appendix A. Maximum Severity Delta Velocity (MSDeltaV). The relative velocity at impact if the subject vehicle continues with the same speed as just before the start of evasive maneuver (that is, not performing any evasive maneuver), multiplied with the mass ratio m2/(m1 + m2), where m1 and m2 are masses of the two involved vehicles, where m2 is the heavier of the two. For details, see Appendix A.
