


Below is the uncorrected machine-read text of this chapter, intended to provide our own search engines and external engines with highly rich, chapter-representative searchable text of each book. Because it is UNCORRECTED material, please consider the following text as a useful but insufficient proxy for the authoritative book pages.
1 Making Effective Fixed-Guideway Transit Investments: Indicators of Success Fixed-guideway transit projects, such as urban rail and bus rapid transit (BRT) lines, are among the largest infrastructure investments that cities and metropolitan areas make. With capital costs ranging from tens of millions to several billion dollars, decisions on whether to build a fixed-guideway transit project, and what kind of project to build, are not taken lightly by local officials or their funding partners. Such decisions may follow many years of plan- ning and analysis at the system, corridor, and project levels. It can cost millions of dollars just to develop and apply the analysis tools that are typically used to evaluate alternative projects. TCRP Project H-42, âAn Exploration of Fixed-Guideway Transit Criteria Revisited,â was undertaken to develop a relatively sophisticated, data-driven, indicator-based method for predicting the potential success of a fixed-guideway transit project. The goal was to develop a method that would predict the likelihood of project success based on the conditions present in the corridor and the metropolitan area. The project was partly intended to define success measures. For this research, success measures were defined based on project ridership and the change in transit system usage, and a set of indicators was identified that are strongly related to these measures based on an intensive data collection and statistical analysis process. Background To develop a basis and context for the analysis, the research team ⢠Reviewed literature on the connection between a transit projectâs success (such as rider- ship) and the characteristics of its service, measures of its connectivity, and features of the surrounding area; ⢠Evaluated factors that have been studied in the past in both defining and predicting transit success, particularly system ridership, as well as the tools used to measure and evaluate those factors; ⢠Catalogued data sources from which a research database could be built; and ⢠Conducted focus groups and interviews with transportation professionals to identify the factors that practitioners use to evaluate and predict the success of transit investments in real-world situations. Analysis The research team developed a geographic database of fixed-guideway transit projects built between 1974 and 2008, the corridors and stations where they operate, and the metro- politan areas they serve, as well as the routes and stops of almost all fixed-guideway transit systems in the United States. The team collected data on project and system ridership capital S u m m a r y
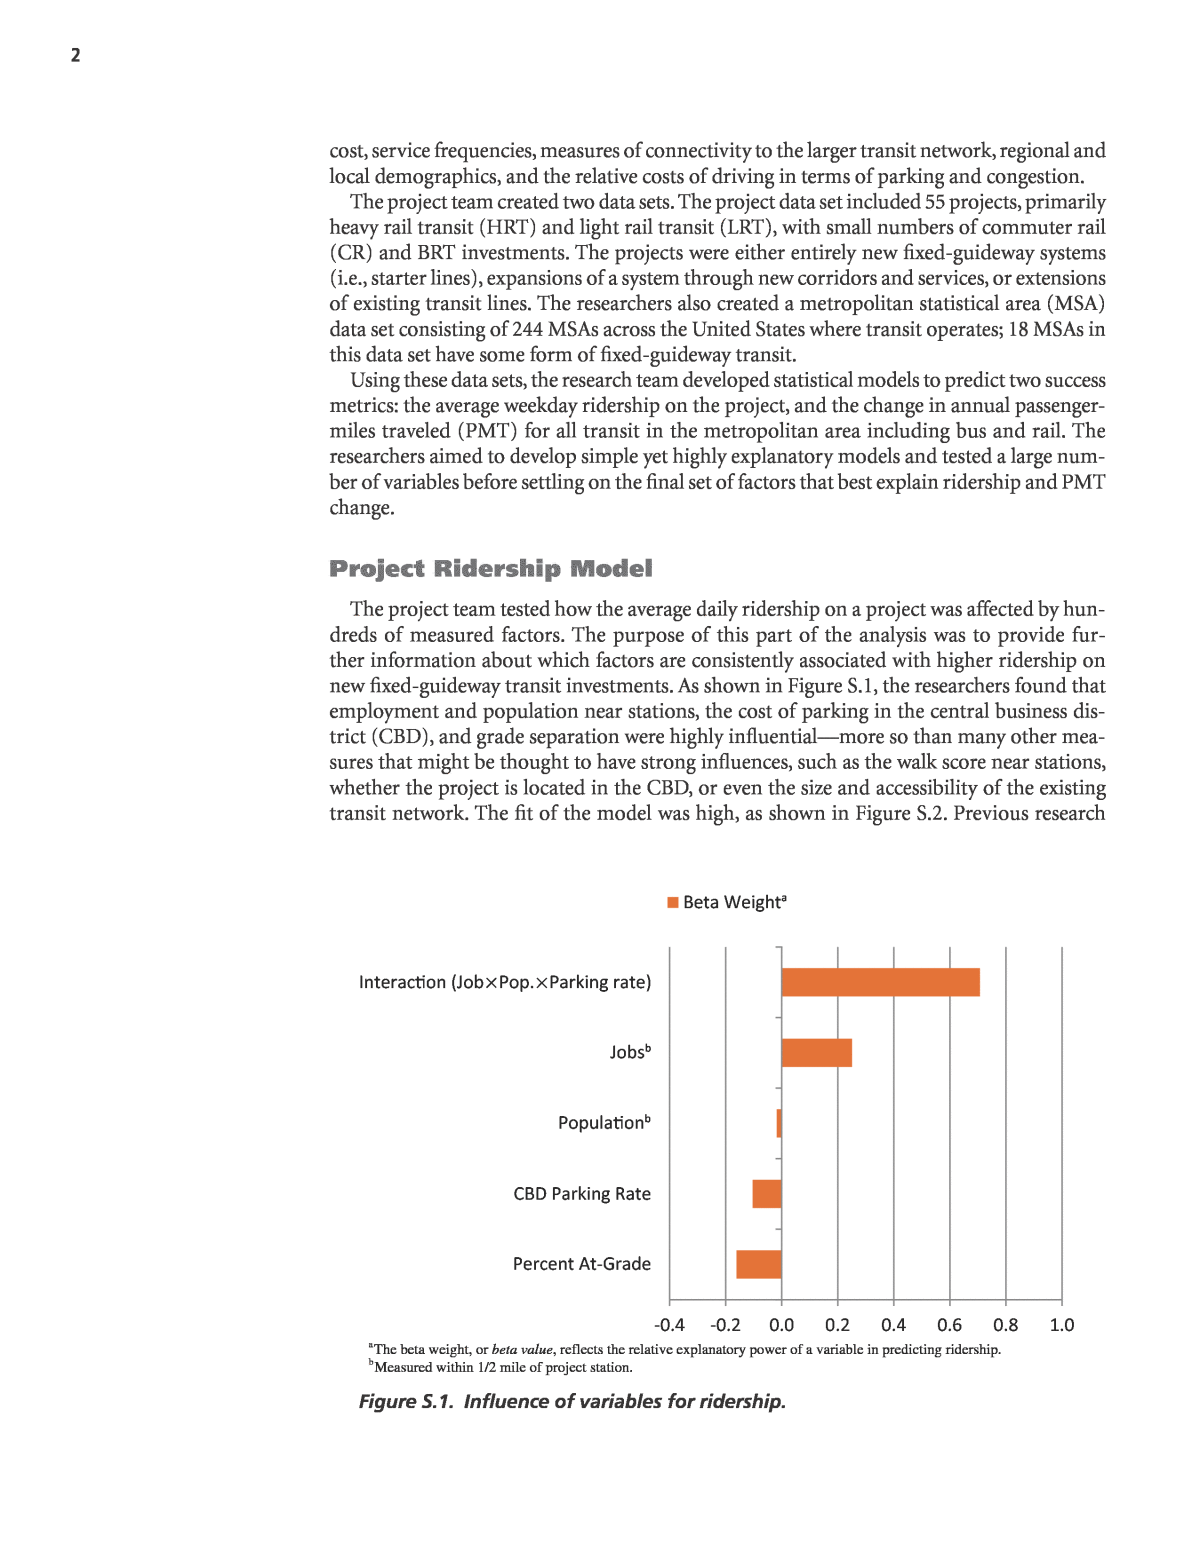
2cost, service frequencies, measures of connectivity to the larger transit network, regional and local demographics, and the relative costs of driving in terms of parking and congestion. The project team created two data sets. The project data set included 55 projects, primarily heavy rail transit (HRT) and light rail transit (LRT), with small numbers of commuter rail (CR) and BRT investments. The projects were either entirely new fixed-guideway systems (i.e., starter lines), expansions of a system through new corridors and services, or extensions of existing transit lines. The researchers also created a metropolitan statistical area (MSA) data set consisting of 244 MSAs across the United States where transit operates; 18 MSAs in this data set have some form of fixed-guideway transit. Using these data sets, the research team developed statistical models to predict two success metrics: the average weekday ridership on the project, and the change in annual passenger- miles traveled (PMT) for all transit in the metropolitan area including bus and rail. The researchers aimed to develop simple yet highly explanatory models and tested a large num- ber of variables before settling on the final set of factors that best explain ridership and PMT change. Project Ridership Model The project team tested how the average daily ridership on a project was affected by hun- dreds of measured factors. The purpose of this part of the analysis was to provide fur- ther information about which factors are consistently associated with higher ridership on new fixed-guideway transit investments. As shown in Figure S.1, the researchers found that employment and population near stations, the cost of parking in the central business dis- trict (CBD), and grade separation were highly influentialâmore so than many other mea- sures that might be thought to have strong influences, such as the walk score near stations, whether the project is located in the CBD, or even the size and accessibility of the existing transit network. The fit of the model was high, as shown in Figure S.2. Previous research 0.4 0.2 0.0 0.2 0.4 0.6 0.8 1.0 Percent At Grade CBD Parking Rate Popula onb Jobsb Interac on (JobÃPop.ÃParking rate) Beta Weighta aThe beta weight, or beta value, reflects the relative explanatory power of a variable in predicting ridership. bMeasured within 1/2 mile of project station. Figure S.1. Influence of variables for ridership.
3 had not compared the relative importance of these factors. The degree of grade separation is likely influential because it serves as a proxy for service variables such as speed, frequency, and reliability that may lead to greater transit ridership. By far the largest impact on project- level ridership came from the interaction of jobs and residents near stations, and parking cost in the CBD. In other words, the fixed-guideway transit investments with the greatest ridership were those that enabled good connections between workers and employers, and between customers and sellers, in cities where commuting by car was expensive. Metropolitan Area Model of Transit Passenger-Miles Traveled Next, the study team tested how metropolitan-wide transit passenger-miles traveled (PMT) was related to hundreds of possible indicators, using a data set of 244 MSAs over a 7-year period. Of this large set of metropolitan areas, 18 had a fixed-guideway transit invest- ment come online during the period, and an additional 10 had some form of fixed-guideway transit available throughout the period. The PMT measure, which included both rail and bus passenger-miles, was used to investigate the net benefit of fixed-guideway transit invest- ments to the transit system as a whole. Jobs, population, and other indicators were measured near all fixed-guideway transit sta- tions in the metropolitan area, not only near project stations. The researchers also tested indicators consisting of characteristics of the metropolitan area as a whole. To estimate the incremental PMT for each project (i.e., the contribution of that project to the overall sys- tem usage), the model was applied for every project in the database study set twiceâwith project-level contributions both included and then subtracted from the total for all stations in the metropolitan area. As shown in Figure S.3, the presence near stations of higher-wage workers, and also of jobs in leisure industries such as dining, retail, and entertainment, were both highly correlated with system-wide increases in PMT. This likely reflects the positive influence of fixed-guideway transit that serves choice riders, as well as mixed-use environments around stations. Also, the interaction between jobs, population, and freeway congestion has a positive influence. 50,000 0 50,000 100,000 150,000 200,000 250,000 300,000 0 50,000 100,000 150,000 200,000 250,000 300,000 Pr ed ic te d Ri de rs hi p Actual Ridership Figure S.2. Goodness of fit for ridership model.
4Unexpectedly, lower-wage jobs and population near stations both contribute negatively to system-wide PMT if not counterbalanced by high freeway congestion and a range of other job types. After exhaustive testing of the models to account for possible additional missing factors, the researchers concluded that the results are robust though somewhat counterintui- tive. As shown in Figure S.4, the fit of the model is excellent. In about half of all cases, the PMT model predicts negative changes in system-wide patron- age when a fixed-guideway transit investment is made. This prediction seems counterintuitive, but fixed-guideway investments may in some cases reduce ridership on existing bus services, more than offsetting the number of new riders. In particular, this could occur if pre-existing bus routes are converted to feeders with a transfer, and if the fixed-guideway investment is made in a place without high road congestion to provide a stronger market. aMeasured within 1/2 mile of all fixed-guideway transit stations in the metro area 0.4 0.2 0.0 0.2 0.4 0.6 0.8 1.0 Jobsa Popula ona Conges on Score Interac on (JobÃPopÃConges on) Leisure Jobsa High Earning Jobsa Beta Weight Figure S.3. Influence of variables in PMT model. 0.0 0.5 1.0 1.5 2.0 2.5 3.0 3.5 4.0 4.5 5.0 0.0 1.0 2.0 3.0 4.0 5.0 Pr ed ic te d Ri de rs hi p M ill io ns Actual Ridership Millions Figure S.4. Goodness of fit of final PMT model.
5 Case Studies The research team conducted case studies of diverse transit projects in six metropolitan areas to gain an understanding of how transit planning decisions had been made and the nature of any indicator-based evaluations that had occurred. The indicator-based method proposed in this study would be situated within an already-robust set of indicator-based approaches. Though the transit planning literature often focuses on predicting project suc- cess based on specific technical planning approaches and sophisticated planning tools, such as four-step transportation models, the researchers identified almost 20 different simple criteriaârules of thumbâused by planners to predict if a transit proposal would be successful. According to interviewees, during the planning of each fixed-guideway transit project, various indicator-based methods were used to propose transit alignments, compare and contrast project alternatives, or justify the selection of a particular proposal. The indicators addressed project-level goals related to ridership, environmental sustainability, real estate impacts, economic development, bus operations, automobile congestion, serving depen- dent riders, and overcoming common project delivery hurdles. The indicator methods were useful tools to address the interests of various groups, balance conflicting objectives, and work around the limitations of more robust technical analyses. When explaining their use of indicator-based methods, multiple interviewees stated that transit planning was an art and a political process, not a science. Though not always technically complex, the rule-of-thumb methods helped transit planners address the immense complexity of designing and build- ing transit projects. The indicator-based method proposed in TCRP Report 167 balances simplicity with technical accuracy, and could be used to augment these existing approaches in many cases. Tools for Practitioners The researchers developed a spreadsheet tool incorporating the project-level ridership model and the system-wide PMT model along with a simple capital cost calculator. The spreadsheet tool allows the user to input data about a proposed project and generate esti- mates of average weekday ridership, incremental PMT, capital cost per new rider, and capital cost per mile. The spreadsheet tool is available for download from the TCRP Report 167 web page, which can be accessed at www.trb.org by searching âTCRP Report 167â. A handbook also was written to accompany the final report of TCRP Project H-42. The handbook provides a user-friendly overview of the research project and gives instructions on using the spreadsheet tool to estimate region-wide and project-level ridership outcomes for different fixed-guideway project alternatives. The handbook is presented as Volume 1 of TCRP Report 167, and the TCRP Project H-42 Final Report, together with technical appen- dices A through J, constitutes Volume 2.
