1
Introduction
Calls to expand and improve the quality of the US technical workforce have been made in one form or another for decades. Over the past 10 years, and particularly since the 2008 economic downturn, the urgency of these concerns has grown (e.g., NAS, NAE, and NRC, 2010). A key worry, expressed by both policymakers and corporate leaders, is that the nation’s status as a world leader of innovation is slipping.
The ability of the United States to support innovation requires production and retention of individuals who are highly skilled in science, technology, engineering, and mathematics (STEM). These STEM professionals work in a widely disseminated global enterprise spanning government, industry, and academia. Engineers play an especially vital role as the designers of technological systems and processes that help drive economic growth, maintain and improve quality of life, and assure national security.
Policymakers, employers, researchers, and educators have focused considerable attention during the past decade on the adequacy of the US engineering education system to meet the demands of an increasingly “flat” world in which competencies that go beyond pure technical skills, including creativity, leadership, flexibility, and communication, are becoming more and more essential (NAE, 2004, 2005). Traditional engineering education is being challenged to respond to emerging fields that blur disciplinary boundaries, among them nanotechnology, synthetic biology, and biomimetics. And, although enrollments in US engineering colleges reached an all-time
high in 2012, with minor declines since then (NSF, 2016a), some still are concerned that the production of engineering graduates in this country lags behind that of some notable competitor nations, such as China, a shortfall not only in absolute numbers but also in the overall percentage of college graduates who have an engineering degree.1
Largely absent from most discussions of the future of the United States’ technical workforce, however, is the role that engineering technology (ET) education plays or should play in supporting the nation’s technical infrastructure and capacity for innovation. This omission is worrisome because the number of people with this type of education, while smaller than for engineering, is nevertheless substantial. Relatively little is known, for example, about the extent to which the supply of those with ET degrees does—or does not—meet the needs of employers; what type of work those with such degrees perform; how, if at all, changes in technology are affecting the preparation and employment of those with ET degrees; and the nature and significance of the differences between the knowledge, skills, and dispositions of those with ET degrees and those with engineering degrees.
ENGINEERING TECHNOLOGY
The formal emergence of ET as an academic discipline can be traced to recommendations in the1955 Grinter report, which set the stage for engineering’s swing toward “engineering science” (i.e., more focus on theory and less on hands-on practice; Harris et al., 1994). In part to meet an anticipated need for more technically trained people in industry (that would not be satisfied by the newly minted engineers coming out of science-based engineering programs) and spurred by the 1957 launch of Sputnik, some technical institutes and vocational schools created 2-year ET programs. These programs tended to emphasize development of hands-on, practical, and problem-solving skills relevant to the needs of industry.
___________________
1 In 2012, the latest year for which data are available, 4.6 percent of all “first university degrees” earned in the United States were in engineering. In European Union nations, the figure ranged between 3.6 percent in Denmark to 14.8 in Finland, in India it was 10 percent, and in China it was 31.7 percent. Source: NSF, 2016b. Importantly, as shown by Wadhwa et al. (2007), there are important differences in the training and employment of engineers in the United States and what occurs in China and India. These differences suggest the US-China/India “gap” in production of engineering talent may be much smaller than commonly thought.
Although there had been a handful of such institutions in the years following World War II, a dramatic growth occurred after Sputnik. By the mid-1960s, about 60 accredited programs were granting 2-year associate’s degrees in the field. And in 1967, the first 4-year ET program was accredited. These 4-year programs, most housed in colleges of technology, experienced a significant growth through the mid-1980s, but their numbers have gradually fallen since then. Additional details about the origins of ET are presented in Chapter 2.
In 2014 there were 17,915 graduates of 4-year (bachelor’s degree) ET programs and 34,638 graduates of 2-year (associate’s degree) ET programs, according to the Department of Education’s Integrated Postsecondary Education Data System (IPEDS). By comparison, in that same year 93,950 students graduated from 4-year engineering programs in the United States. Certificates in ET, which typically require fewer courses and take less time to obtain than does an associate’s degree, have been awarded for decades. Since 2000, the growth rate of these certificates has surpassed that of both associate’s and bachelor’s degrees in ET. And for the first time, in 2010, the absolute number of sub-associate’s certificates exceeded the number of associate’s degrees awarded in ET. In 2014, US institutions awarded 49,217 sub-associate’s ET certificates. The role of certificates in ET education is discussed in greater detail in Chapter 3.
Institutions, Programs, and Accreditation
IPEDS is the most comprehensive source of basic statistics on higher education in the United States. According to IPEDS, there were 414 public, private, or for-profit academic institutions awarding at least one 4-year ET degree in 2014. Within this group, 38 awarded 100 or more degrees that year (Table 1-1). A total of 1,192 institutions awarded at least one 2-year degree in the field in 2012. Fifty-two of these institutions awarded 100 or more degrees (Table 1-2).
In terms of the geographic distribution of ET degrees and certificates, three of the nation’s largest four states—California, New York, and Texas—award the largest shares of 4- and 2-year degrees (Table 1-3). California, Texas, and Florida, the nation’s third most populous state,2 are also responsible for large shares of certificate awards, but so, too, are a number of other
___________________
2 According to the US Census Bureau, in 2015, New York and Florida had nearly identical populations, about 20 million.
TABLE 1-1 Institutions Awarding 100 or More 4-Year Degrees in Engineering Technology, 2014
| Columbia Southern University | 620 |
| Purdue University Main Campus | 342 |
| Texas A & M University College Station | 273 |
| Southern Illinois University Carbondale | 261 |
| Rochester Institute of Technology | 250 |
| University of Houston | 247 |
| East Carolina University | 222 |
| Ferris State University | 214 |
| ECPI University | 209 |
| Wentworth Institute of Technology | 207 |
| Southern Polytechnic State University | 201 |
| Excelsior College | 198 |
| DeVry University Illinois (Chicago, IL) | 189 |
| Michigan State University | 183 |
| Farmingdale State College | 167 |
| Old Dominion University | 166 |
| Pennsylvania College of Technology | 166 |
| New Jersey Institute of Technology | 160 |
| Indiana University Purdue University Indianapolis | 150 |
| Pittsburg State University | 149 |
| University of North Carolina at Charlotte | 143 |
| Keene State College | 139 |
| University of Wisconsin Stout | 139 |
| University of Central Missouri | 133 |
| Oklahoma State University Main Campus | 128 |
| Central Connecticut State University | 119 |
| Purdue University Calumet Campus | 117 |
| Middle Tennessee State University | 113 |
| Southeast Missouri State University | 113 |
| Colorado State University Fort Collins | 112 |
| Millersville University of Pennsylvania | 112 |
| University of Toledo | 111 |
| California State Polytechnic University Pomona | 108 |
| Georgia Southern University | 107 |
| University of Wisconsin Platteville | 106 |
| Southeastern Oklahoma State University | 103 |
| Arizona State University Polytechnic | 100 |
| DeVry University California (Pomona, CA) | 100 |
states not among the top producers of 4- and 2-year degree-earners. Table 1-4 shows the percentage of ET-degree- and certificate-granting institutions according to institutional control.
Compared with the tally of degree-granting institutions, determining the number of ET programs overseen by these institutions is more challenging. For one thing, as discussed at greater length in Chapter 3, there is no standard nomenclature for describing these programs. Also, IPEDS does not collect data on numbers of programs, only degrees. For program information, we must turn to other sources, such as the Accreditation Board for Engineering and Technology (ABET), the primary organization involved in assuring the basic soundness of educational programs in engineering and technology.3 According to ABET, in 2014 there were 387 accredited 4-year ET programs at 153 institutions and 257 accredited 2-year ET programs at 98 institutions.4 The most common program at both the 2- and the 4-year degree levels was electrical and electronics engineering technology, followed by mechanical engineering technology (Table 1-5). Three of the most-common ET program types at the 2-year level—in architectural, surveying and geomatics, and drafting and design engineering technology—are not among the top 10 at the 4-year level.
These ABET data, of course, capture only programs accredited by that organization. By comparing the ABET list of programs with programs listed on the websites of IPEDS schools that award degrees in ET, the committee was able to estimate the number of programs that are not ABET accredited. At the 2-year level, there were 658 such programs; at the 4-year level, there
___________________
3 The Association of Technology, Management, and Applied Engineering and the American Council for Construction Education accredit a very small number of ET programs.
4 Twenty-eight institutions have both 2- and 4-year ABET-accredited programs.
TABLE 1-2 Institutions Awarding 100 or More 2-Year Degrees in Engineering Technology, 2014
| Ivy Tech Community College | 525 |
| Columbia Southern University | 402 |
| Texas State Technical College Waco | 351 |
| Olympic College | 261 |
| Pittsburgh Technical Institute | 254 |
| Technical Career Institutes | 254 |
| Bismarck State College | 250 |
| Ecotech Institute | 219 |
| Mississippi Gulf Coast Community College | 214 |
| Excelsior College | 203 |
| CUNY New York City College of Technology | 202 |
| Cincinnati State Technical and Community College | 186 |
| Sowela Technical Community College | 186 |
| ECPI University | 175 |
| Oklahoma State University Institute of Technology | 173 |
| Washtenaw Community College | 171 |
| Ferris State University | 168 |
| Chattanooga State Community College | 167 |
| Ranken Technical College | 164 |
| Columbus State Community College | 160 |
| Pennsylvania College of Technology | 157 |
| Southeast Community College Area | 157 |
| ITI Technical College | 150 |
| Lee College | 148 |
| Owens Community College | 143 |
| Northeast Wisconsin Technical College | 140 |
| Stark State College | 136 |
| ITT Technical Institute National City | 128 |
| Lamar Institute of Technology | 128 |
| Hudson Valley Community College | 126 |
| Kalamazoo Valley Community College | 126 |
| Spartan College of Aeronautics and Technology | 125 |
| Thomas Edison State College | 123 |
| Nicholls State University | 117 |
| Springfield Technical Community College | 117 |
| Austin Community College District | 116 |
| Valencia College | 115 |
| University of Alaska Anchorage | 114 |
| CUNY Queensborough Community College | 113 |
| Macomb Community College | 113 |
| Instituto Tecnologico De Puerto Rico Recinto De Ponce | 110 |
| Instituto Tecnologico De Puerto Rico Recinto De Guayama | 109 |
| South Central Louisiana Technical College Young Memorial Campus | 107 |
| Northeast State Community College | 106 |
| Portland Community College | 106 |
| Tidewater Community College | 106 |
| ITT Technical Institute Houston West | 104 |
| Texas State Technical College Harlingen | 103 |
| Hennepin Technical College | 102 |
| University of Akron Main Campus | 102 |
| ITT Technical Institute San Bernardino | 101 |
| San Jacinto Community College | 100 |
TABLE 1-3 States Awarding 5 Percent or More of ET Degrees and Certificates, 2014
| 4-Year Degrees (percent) | 2-Year Degrees (percent) | Less than 1-Year Certificates (percent) | 1- But Less than 2-Year Certificates (percent) |
|---|---|---|---|
| New York (7.6) | Texas (8.3) | California (11.7) | California (12.6) |
| Texas (7.1) | New York (6.6) | Washington (9.3) | Texas (12.6) |
| Indiana (6.1) | Ohio (6.0) | Texas (9.1) | Puerto Rico (9.3) |
| California (5.9) | California (5.6) | Florida (7.6) | Florida (8.3) |
| Michigan (5.3) | Illinois (7.0) | Louisiana (6.7) | |
| Louisiana (6.0) | |||
| Kentucky (5.9) | |||
| North Carolina (5.2) |
TABLE 1-4 Number of Institutions Awarding Engineering Technology Degrees and Certificates, by Institutional Control Type
| Award level | Private, For Profit | Private, Not For Profit | Public | Total |
|---|---|---|---|---|
| Bachelor’s Degrees | 111 | 71 | 232 | 414 |
| Associate’s Degrees | 275 | 57 | 860 | 1,192 |
| Certificates (at least 1 but less than 2 years) | 42 | 24 | 489 | 555 |
| Certificates (less than 1 year) | 21 | 11 | 521 | 553 |
| Total | 449 | 163 | 2,102 | 2,714 |
TABLE 1-5 Top 10 Most Common ABET-Accredited Engineering Technology Programs, 2- and 4-Year Degree Levels
| 2-Year Engineering Technology Programs | 4-Year Engineering Technology Programs | ||
|---|---|---|---|
| Name | Number | Name | Number |
| Electrical and Electronics Engineering Technology | 74 | Electrical and Electronics Engineering Technology | 111 |
| Mechanical Engineering Technology | 48 | Mechanical Engineering Technology | 66 |
| Civil Engineering Technology | 34 | Computer Engineering Technology | 54 |
| Computer Engineering Technology | 19 | Construction Engineering Technology | 26 |
| Architectural Engineering Technology | 12 | Civil Engineering Technology | 22 |
| Construction Engineering Technology | 10 | Manufacturing Engineering Technology | 20 |
| Surveying and Geomatics Engineering Technology | 8 | Bioengineering and Biomedical Engineering Technology | 13 |
| Drafting and Design Engineering Technology | 5 | Electromechanical Engineering Technology | 9 |
| Industrial Engineering Technology | 5 | Engineering Technology (General) | 8 |
| Manufacturing Engineering Technology | 5 | Industrial Engineering Technology | 8 |
were 141. The complete universe of ET programs in the United States is presented in Table 1-6.
TERMINOLOGY
The language used by researchers, statisticians, and practitioners themselves to describe ET education sometimes muddies efforts at understanding. Often, though not universally, postsecondary educators call those with 2-year degrees in ET “technicians,” while those with 4-year degrees are called “technologists.” Unless noted otherwise, this is the convention we follow in our report. However, it is important to note several limitations with this nomenclature. First, federal employment data collection efforts sometimes use the term “technician” and at other times “technician or technologist” to describe work that might be done by those with either a 2- or a 4-year degree. Second, we have learned through our research that many of those with 4-year ET degrees do not identify themselves as technologists. If asked in surveys, for instance, they may call themselves engineers or managers. Third, the term “technologist” also does not seem to have much currency within industry, where the focus tends to be on the function an employee fulfills rather than the degree earned (e.g., Land, 2012). Finally, within the ET education community there is a long-simmering debate about the potential value of adopting the “applied engineering” label for bachelor’s of science (BS) ET programs (Chandler et al., 2006; Rezak and McHenry, 1997). The Association of Technology, Management, and Applied Engineering (ATMAE), which accredits a small number of 2- and 4-year ET programs, also accredits BS and associate of applied science (AAS) degree programs in “applied engineering” and “applied engineering technology.” The possibility of accrediting some ET programs as “applied engineering” through ABET’s Engineering Accreditation Commission or its Engineering Technology
TABLE 1-6 Estimated Universe of Engineering Technology Programs in the United States
| 2-Year Programs | 4-Year Programs | |
|---|---|---|
| ABET Accredited | 257 | 387 |
| Non-ABET Accredited | 658 | 141 |
| Total | 915 | 528 |
Accreditation Commission is something that leadership at the organization has recently begun to consider (J. Ray, Western Carolina University, personal communication, Aug. 30, 2015).
A second area of potential confusion relates to the large number of distinct ET education programs at both the 2- and the 4-year levels. Although there is a relatively small set of such program types in engineering (e.g., civil, electrical, mechanical, environment, industrial, bioengineering), there are many more in ET (see Box 3-1 in Chapter 3), and there does not appear to be a consistent naming convention across academic institutions. This sometimes results in one-of-a-kind program titles. Finally, education data collection by the federal government also does not consistently use the term “engineering technology” in the descriptions of programs it counts as producing graduates in this field (see the discussion of CIP codes in Chapter 3’s section on “Degree Fields.”)
Overall, there is considerable variation in how different groups characterize ET, particularly in comparison to engineering (Box 1-1).
LICENSING, CERTIFICATION, AND EQUIVALENCY
In the United States, engineers must be licensed to perform certain tasks such as certifying the safety-related specifications of design drawings. Individuals who have earned a 4-year engineering degree from an ABET-accredited program who wish to be licensed must first pass the Fundamentals in Engineering (FE) exam, a test of broad knowledge in mathematics, science, and engineering. After gaining work experience (the amount of experience required varies by state), those with the FE designation and requisite experience can take the Principles and Practice in Engineering (PE) exam. Licensing is done by the states, and 30 states allow those with an ET degree from an ABET-accredited program to take the FE and PE exams. According to the National Council of Examiners for Engineering and Surveying, which administers the exams, 2,600 of 45,600 candidates taking the 2010 FE exam, or 5.7 percent, indicated they had a 4-year degree in ET. Of the 26,600 candidates taking the PE exam that year, 900, or 3.4 percent, had a 4-year ET degree.
The National Institute for Certification in Engineering Technologies, a semiautonomous division of the National Society of Professional Engineers, offers certification for 4-year ET degree holders. Since 1977, 1,775 people with 4-year ET degrees have opted to get this certification (M. Clark,
NICET, personal communication, Aug. 19, 2015). ATMAE offers a variety of certifications, one of which, Certified Technical Professional, is available to graduates of both 2- and 4-year ET programs.
The United States, through ABET, is a signatory to three international “equivalency” agreements: one for engineers (the “Washington Accord”), one for engineering technologists (the “Sydney Accord”), and one for engineering technicians (the “Dublin Accord”; IEA, 2014). Sixteen countries, including the United States, have signed the Washington Accord. Australia, Canada, Chinese Taipei, Hong Kong, China, Ireland, Korea, New Zealand, South Africa, the United Kingdom, and the United States have signed the Sydney Accord. And Australia, Canada, Ireland, Korea, New Zealand, South Africa, the United Kingdom, and the United States have signed the Dublin Accord.
A further illustration of the inconsistency surrounding terminology within and for ET may be seen in the variety of names used by the seven initial signatory countries5 to the Sydney Accord to identify those with similar educational backgrounds in ET (Table 1-7).
Engineering Technology and Engineering
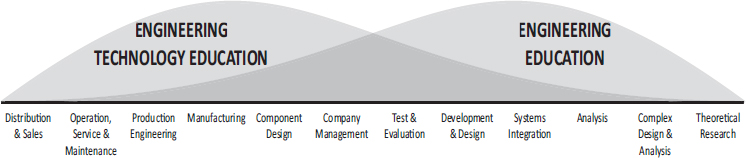
As noted, the work of engineering technologists is often described by drawing comparisons to engineering. One model (Figure 1-1), developed by the American Society of Mechanical Engineering (ASME), sees the jobs of engineering technologist and engineer as falling along a continuum. It is characterized at one end (engineering technology) by work involving distribution and sales; operation, service, and maintenance; and production engineering and at the other (engineering), by work emphasizes theory, analysis, and complex design. As shown in the area where the two jobs overlap, a number of work-related activities can be performed by both engineers and technologists, including component design, management, and testing and evaluation.
An earlier version of the ASME model included a similar spread of occupational functions but also suggested that jobs at the engineering end of the spectrum involve more mathematical work while those at the ET end involve less.
There is no widely accepted job description for an engineering technician. However, the International Engineering Alliance, which manages mutual accreditation recognition agreements among signatory countries for engineers, engineering technologists, and engineering technicians, offers this description:
The roles of Engineering Technicians involve them in the implementation of proven techniques and procedures to the solution of practical problems. They carry a measure of supervisory and technical responsibility and are competent to exercise creative aptitudes and skills within defined fields of technology, initially under the guidance of engineering practitioners with appropriate experience. Engineering Technicians contribute to the design, development, manufacture, commissioning, operation and maintenance of products, equipment, processes and services. (IEA, 2014, pp. 13-14)
___________________
5 The United States was not among the original signatories to the Sydney Accord, and the International Engineering Alliance, which oversees the accord process, does not provide terminology used by later signatories.
TABLE 1-7 Sydney Signatories’ Titles for “Engineering Technologist”
| Country | Title |
|---|---|
| Australia | Engineering Technologist |
| Canada | Certified Engineering or Applied Science Technologist |
| Hong Kong, China | Associate Member of HKIE |
| Ireland | Associate Engineer |
| New Zealand | Engineering Technologist |
| South Africa | Professional Technologist (Engineering) |
| United Kingdom | Incorporated Engineer |
Compared with engineering, the history of ET education (Chapter 2) suggests a greater emphasis on hands-on laboratory experiences and less emphasis on advanced mathematics. To get a sense of how valid this characterization is today, the committee examined required coursework for engineering and 4-year ET majors at three institutions housing both programs (Table 1-8). Though qualitative and involving a very small sample, the review nonetheless suggests that some of the historical differences between the two fields remain.
Another illustration of the differences between ET and engineering is reflected in the student outcomes criteria used by ABET for the two types of programs (Table 1-9). Overall, the criteria are very similar. However, ET’s historical roots in application can clearly be seen in ABET’s Engineering Technology Accreditation Commission’s criteria b and c. The greater hands-on emphasis of ET also can be seen in ABET’s curriculum criteria for the field, which call on these programs to “Develop student competency in the use of equipment and tools common to the discipline.” No such guidance is provided to engineering programs.
TABLE 1-8 Required Science, Mathematics, and Laboratory Courses in Engineering and Engineering Technology BS Programs at the University of Cincinnati, University of North Carolina, Charlotte, and Purdue University
| University of Cincinnatia Electrical Engineering and Electrical Engineering Technology | |
| SCIENCE | |
| Engineering | Engineering Technology |
| General Chemistry I | General Physics I (algebra based) |
| College Physics I (calculus based) | General Physics II (algebra based) |
| Semiconductor Physics for Engineers | |
| Science Elective | |
| MATHEMATICS | |
| Calculus I | Calculus I |
| Calculus II | Calculus II |
| Multivariate Calculus | Engineering Statistics |
| Linear Algebra | Mathematic Applications in Engineering Technology |
| Probability and Statistics I | |
| LABORATORIES | |
| General Chemistry Laboratory I | General Physics Laboratory I (algebra based) |
| College Physics Laboratory I (calculus based) | Digital Systems Laboratory |
| Electronics Laboratory I | Circuit Analysis II Laboratory |
| Electronics Laboratory II | General Physics Laboratory II (algebra based) |
| Electronics Laboratory | |
| Electronic Communication Laboratory | |
| Flexible Automation Laboratory | |
| Electric Machinery Laboratory | |
| Feedback Control Laboratory | |
| Computer Networks Laboratory | |
| University of North Carolina, Charlotteb Mechanical Engineering and Mechanical Engineering Technology | |
| SCIENCE | |
| Engineering | Engineering Technology |
| Chemistry I | Introductory Physics I |
| Physics I | Introductory Physics II |
| Physics II | Principles of Chemistry |
| Science Elective | |
| MATHEMATICS | |
| Calculus I | Pre-Calculus Math for Science & Engineering |
| Calculus II | ET Calculus or Engineering Analysis I |
| Differential Equations | Elements of Statistics |
| Calculus III | Engineering Analysis II |
| Computational Methods for Engineers | Engineering Analysis III or IV |
| Mathematics Elective | |
| LABORATORIES | |
| Chemistry I Laboratory | Introductory Physics I Laboratory |
| Physics I Laboratory | Engineering Technology Computer Applications Laboratory |
| Physics II Laboratory | Introductory Physics II Laboratory |
| Design Projects Laboratory I | Sophomore Design Practicum Laboratory |
| Instrumentation Laboratory | Stress Analysis Laboratory |
| Design Projects Laboratory II | Junior Design Practicum Laboratory |
| Mechanics and Materials Laboratory | Fluid Mechanics Laboratory |
| Thermal Fluids Laboratory | Thermodynamics and Heat Transfer Laboratory |
| Instrumentation Laboratory | |
| Purdue Universityc Electrical Engineering and Electrical Engineering Technology | |
| SCIENCE | |
| Engineering | Engineering Technology |
| General Chemistry | General Physics I |
| Modern Mechanics | General Physics II |
| Electric and Magnetic Interactions | |
| Electric and Magnetic Fields | |
| MATHEMATICS | |
| Analytic Geometry and Calculus I | Applied Calculus I |
| Analytic Geometry and Calculus II | Applied Calculus II with Differential Equations |
| Multivariate Calculus | Introduction to Probability Models (or Elementary Statistical Models) |
| Ordinary Differential Equations | Monetary Analysis for Industrial Decisions (or Production Cost Analysis) |
| Probabilistic Methods | |
| Linear Algebra | |
| LABORATORIES | |
| None listed by name | None listed by name |
a At the University of Cincinnati, both the electrical engineering and the electrical engineering technology programs are housed within the College of Engineering and Applied Science. Both programs are 5 years long. The “curriculum guide” for electrical engineering can be viewed here: https://webapps.uc.edu/DegreePrograms/CurriculumGuideView.aspx?Program=1232&Pasla=20BSEE-EE&CurriculumGuideID=1326. The curriculum guide for electrical engineering technology can be seen here: https://webapps.uc.edu/DegreePrograms/CurriculumGuideView.aspx?Program=1003&Pasla=20BSEET-ET&CurriculumGuideID=901.
b At UNC, Charlotte, both the mechanical engineering and the mechanical engineering technology programs are housed within the William States Lee College of Engineering. The September 2014 “suggested plan of study” for mechanical engineering can be viewed here: http://academics.uncc.edu/sites/academics.uncc.edu/files/media/Mechanical-Engineering-APS-Sept-2014.pdf. The April 2014 suggested plan of study for mechanical engineering technology can be seen here: http://academics.uncc.edu/sites/academics.uncc.edu/files/media/Mechanical-Engineering-Technology-APS-Apr-2014.pdf.
c At Purdue, the electrical engineering program is housed within the College of Engineering, and the electrical engineering technology program is housed within the School of Engineering Technology, part of the Purdue Polytechnic Institute. The 2015 “plan of study” for electrical engineering can be viewed here: https://polytechnic.purdue.edu/sites/default/files/EET-fall-2015.pdf. The 2015 plan of study for electrical engineering technology is here: https://engineering.purdue.edu/Engr/Academics/Undergraduate/PlansOfStudy/schools/ece/bsee/fall-2015/Electrical%20Engineering%20-%20Fall%202015.pdf.
TABLE 1-9 Comparison of ABET Student Outcomes Criteria A-K for Engineering and Engineering Technology
| Engineering Accreditation Commission | Engineering Technology Accreditation Commission |
|---|---|
| (a) an ability to apply knowledge of mathematics, science, and engineering; | (b) an ability to select and apply a knowledge of mathematics, science, engineering, and technology to engineering technology problems that require the application of principles and applied procedures or methodologies; |
| (b) an ability to design and conduct experiments, as well as to analyze and interpret data; | (c) an ability to conduct standard tests and measurements; to conduct, analyze, and interpret experiments; and to apply experimental results to improve processes; |
| (c) an ability to design a system, component, or process to meet desired needs within realistic constraints such as economic, environmental, social, political, ethical, health and safety, manufacturability, and sustainability; | (d) an ability to design systems, components, or processes for broadly-defined engineering technology problems appropriate to program educational objectives; |
| (d) an ability to function on multidisciplinary teams; | (e) an ability to function effectively as a member or leader on a technical team; |
| (e) an ability to identify, formulate, and solve engineering problems; | (f) an ability to identify, analyze, and solve broadly-defined engineering technology problems; |
| (f) an understanding of professional and ethical responsibility; | (i) an understanding of and a commitment to address professional and ethical responsibilities including a respect for diversity; |
| (g) an ability to communicate effectively; | (g) an ability to apply written, oral, and graphical communication in both technical and nontechnical environments; and an ability to identify and use appropriate technical literature; |
| (h) the broad education necessary to understand the impact of engineering solutions in a global, economic, environmental, and societal context; | (j) a knowledge of the impact of engineering technology solutions in a societal and global context; |
| Engineering Accreditation Commission | Engineering Technology Accreditation Commission |
|---|---|
| (i) a recognition of the need for, and an ability to engage in, life-long learning. | (h) an understanding of the need for and an ability to engage in self-directed continuing professional development; |
| (nothing comparable) | (k) a commitment to quality, timeliness, and continuous improvement. |
| (j) a knowledge of contemporary issues | (nothing comparable) |
| (k) an ability to use the techniques, skills, and modern engineering tools necessary for engineering practice | (a) an ability to select and apply the knowledge, techniques, skills, and modern tools of the discipline to broadly-defined engineering technology activities; |
SOURCE: EAC, 2015; ETAC, 2014.
The hiring practices of the federal government also reflect perceived differences between ET and engineering. The federal Office of Personnel Management (OPM) places ET under the same broad category, “All Professional Engineering Positions,” that includes those with 4-year engineering degrees (OPM, 2012). Technically, this means that some with 4-year ET degrees from institutions accredited by ABET can be hired by the federal government, but the OPM rules restrict hiring to entry-level jobs (GS-5, pay range $27k-$36k; those with “superior academic performance” may enter at GS-7). Some within the ET field believe that this OPM provision reflects a bias against the field and poses an unfair barrier to federal employment for engineering technologists. The National Engineering Technology Forum, an initiative of the Engineering Technology Council of the American Society for Engineering Education, has been lobbying for the creation of a separate federal job category, or the equivalent, for engineering technologists. In 2014 OPM drafted and circulated to other agencies for comment a proposal that would have reclassified engineering technologists. Subsequently, the agency decided not to move forward with the proposal.
Separately, the Department of Labor classifies engineering technologists and technicians among the occupations that are subject to minimum-wage and overtime-pay rules under the Fair Labor Standards Act (USDOL, 2008). In contrast, engineers are exempt from these rules, because they are considered part of a “learned profession.” By DOL definition, a learned profes-
sion involves “work requiring advanced knowledge,” which is “customarily acquired by a prolonged course of specialized intellectual instruction.”
Issues related to the employment of engineering technologists and technicians are considered in detail in Chapter 4. However, it is worth noting here the personal experiences of one of our workshop participants, Verna Fitzsimmons, CEO of Kansas State University at Salina. Her institution awards both 4-year engineering and 4-year ET degrees. Dr. Fitzsimmons reported that she has been working closely with employers in the Salina community to help them understand the value of students with a BS in ET. Although many local employers hire her graduates and wish the university could provide more of them, she said most thought the graduates they were hiring were all engineers. Our own survey of employers, also described in Chapter 4, found that roughly one-third had never heard of the academic field called “engineering technology education.”
Pathways
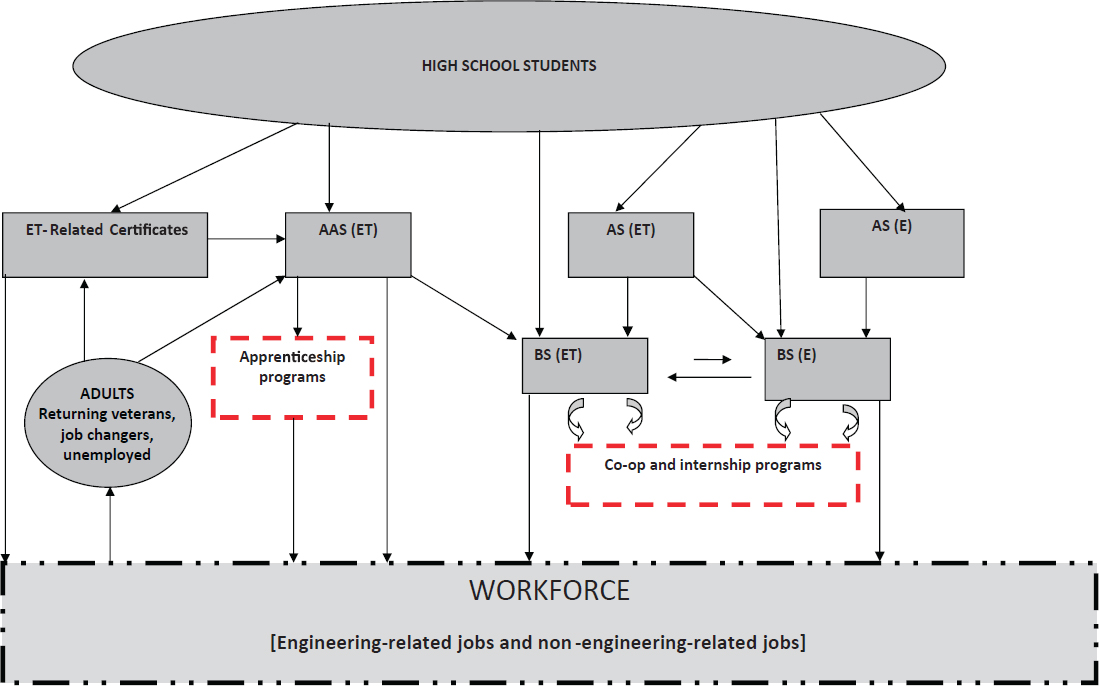
Although the committee’s statement of task, described below, does not specifically require us to examine educational and career pathways in ET, it was our hope that this project would provide insights into this issue. Figure 1-2 provides a notional view of some of the major connections between and among various parts of the ET education system and the workforce. We were not able in this project to characterize all of the pathways pictured, or to provide definitive information about many of the specific pathways, but we were able to elucidate patterns in certain of these flows as well as to identify potentially intriguing connections (and gaps) that suggest the need for more research. A number of facets of this pathways diagram are addressed in data presented in Chapters 3 and 4.
THE NAE PROJECT
This National Science Foundation (NSF)-funded project took place over a roughly 2-year period, culminating in publication of this report in summer 2016. To oversee the project, the NAE appointed a committee of 14 individuals with expertise across a range of areas relevant to the study topic, including engineering and engineering technology (ET) education; labor economics; STEM workforce policy and research; career and technical education; K-12 teaching; and industry. (Committee bios appear at Appendix A.)
The committee met four times and held a 1-day workshop in December 2014 in Washington, DC.
The project had the following statement of task:
An ad hoc committee will conduct a study and prepare a report to shed light on the status, role, and needs of engineering technology education in the United States. The project will address the following objectives and questions and include a public workshop as a primary data-gathering event.
Objective 1: Review the status and history of the production and employment of engineering technologists and technicians in the United States. Such a review should address not only the number and discipline-focus of graduates from engineering technology programs but also their demographic characteristics (race, gender, socio-economic status), academic preparation (e.g., participation in career and technical education programs, experience with K-12 engineering coursework), and distribution by sector, job role/category, and geographic region.
QUESTION: What are the significant trends and patterns in the production and employment of engineering technologists and technicians?
Objective 2: Gather available data and explore private- and public-sector employer perceptions regarding the adequacy of the supply of engineering technologists and technicians as well as the appropriateness of the knowledge and skills they bring to the workplace.
QUESTION: What aspects of engineering technologist/technician performance in the workplace are most valued by employers and where are such workers seen to fall short of expectations or needs?
QUESTION: Is there evidence for shortages or oversupply of engineering technologists/technicians regionally or within particular employment sectors or job categories?
QUESTION: How is increasing automation, and technological developments more generally, changing the nature of work for engineering technicians and technologists?
Objective 3: Describe the characteristics of US engineering technology education programs related to such things as curriculum and faculty professional development; outreach to/partnerships with K-12 schools, industry, and other organizations; and communication and collaboration with engineering education programs.
QUESTION: To what degree are curricula, professional development, and institutional policies supporting or hindering efforts to meet employer needs and expectations?
QUESTION: In what ways and to what effects are engineering technology programs connected to other parts of the K-16 education system, including engineering education?
QUESTION: How transferable (e.g., to different technology types, regions, or career paths) are the knowledge and skills learned in engineering technology programs?
QUESTION: What is the extent and nature of articulation between and among 2- and 4-year engineering technology programs and between these programs and engineering programs?
Data Gathering
Data gathering for the project consisted of (1) collection and analysis of the relevant published literature; (2) review of relevant federal education and employment datasets; (3) a survey of ET education programs and a survey of a sample of companies that hire graduates from these programs; and (4) a stakeholder workshop.
To conduct the review of federal datasets, the project hired a consultant, Daniel Kuehn, a research associate at the Urban Institute with considerable knowledge of the STEM workforce. Educational data assembled by Kuehn provided information on the rate of production and the demographic composition of new engineering technicians and technologists. Enrollment and graduation trends offer a great deal of insight into the supply of engineering technicians and technologists, although a full picture of their supply and demand requires analysis of labor market data. Movements in labor supply and demand have predictable impacts on earnings and employment reported in the large surveys of workers and firms conducted by the Census Bureau, the Department of Labor, and (in the case of the STEM labor market) the NSF. The educational datasets used in this study were IPEDS, the Baccalaureate and Beyond 2008/2009 (B&B), and the Career/Technical Education (CTE) Statistics. Each of these datasets is produced and distributed by the Department of Education’s National Center for Education Statistics.
The labor market datasets used in the study were the American Community Survey (ACS), the Current Population Survey (CPS), the Occupational Employment Statistics (OES) database, and the National Survey of College Graduates (NSCG). These data are made available by a variety of government agencies and present the STEM workforce generally and engineering technicians and technologists in particular in varying degrees of detail.
TABLE 1-10 Summary of Data Sources
| Education Data | Employment Data | |
|---|---|---|
| ACS | Yes for bachelor’s degree | Yes |
| B&B | Yes | Yes |
| CPS | Degree level, not field | Yes |
| CTE Statistics | Yes | No |
| IPEDS | Yes | No |
| NSCG | Yes for bachelor’s degree | Yes |
| OES | No | Yes |
These datasets are summarized in Table 1-10, and an additional description of each dataset is provided in Appendix B.
The survey of educational programs was conducted by the NAE. The survey of employers was conducted by the National Association of Colleges and Employers under contract to NAE.
Data Gaps
At various points in the project, we encountered gaps in the available data, which limited our ability to address aspects of the statement of task. One key gap relates to the availability of data regarding the work experiences of students with 2-year ET degrees. This gap and several others are discussed at greater length in other sections of the report, and in some cases, they are addressed in our recommendations.
THE REPORT
The committee’s report is organized into five chapters. Chapter 2 contains a brief history of ET education. Chapter 3 discusses the production of ET talent, and Chapter 4 considers the employment of ET talent. Chapter 5 contains the committee’s findings and recommendations.
REFERENCES
ASME (American Society of Manufacturing Engineers). 2012. Pathways to careers in mechanical engineering. Unpublished.
Chandler, E.W., R.A. Strangeway, and O.G. Petersen. 2006. Engineering technology attributes inherent to applied engineering programs. Proceedings of the 2006 Mid-Atlantic Section Conference of the American Society for Engineering Education.
EAC (Engineering Accreditation Commission). 2015. Criteria for Accrediting Engineering Programs. Effective for Reviews During the 2016-2017 Accreditation Cycle. ABET. Available online at www.abet.org/wp-content/uploads/2015/10/E001-16-17-EACCriteria-10-20-15.pdf (May 5, 2016).
ETAC (Engineering Technology Accreditation Commission). 2014. Criteria for Accrediting Engineering Technology Programs. Effective for Reviews During the 2015-2016 Accreditation Cycle. ABET. Available online at www.abet.org/wp-content/uploads/2015/05/T001-15-16-ETAC-Criteria-05-04-15.pdf (May 5, 2016).
Grinter, L.E. 1955. Report of the ASEE committee on evaluation of engineering education. Journal of Engineering Education 46:26-60.
Harris, J.G., E.M. DeLoatch, W.R. Grogan, I.C. Peden, J.R. Winnery. 1994. Journal of engineering education roundtable: Reflections on the Grinter report. Journal of Engineering Education 83(1): 69-94.
IEA (International Engineering Alliance). 2014. International Engineering Alliance: Educational Accords—Washington Accord 1989, Sydney Accord 2001, Dublin Accord 2002. Available online at www.ieagreements.org/Rules_and_Procedures.pdf?8138 (August 19, 2015).
Kelnhofer, R., R. Strangeway, E. Chandler, and O. Petersen. Future of engineering technology—A proposal. Paper presented at the 2010 ASEE Annual Conference & Exposition, Louisville, Kentucky, June 2010.
Land, R.E. 2012. Engineering technologists are engineers. Journal of Engineering Technology, pp. 32-29. Spring 2012.
NAE (National Academy of Engineering). 2004. The Engineer of 2020. Visions of Engineering in the New Century. Washington, DC: The National Academies Press.
NAE. 2005. Educating the Engineer of 2020: Adapting Engineering Education to the New Century. Washington, DC: The National Academies Press.
NAS, NAE, and NRC (National Academy of Sciences, National Academy of Engineering, and National Research Council). 2010. Rising Above the Gathering Storm, Revisited: Rapidly Approaching Category 5. Washington, DC: The National Academies Press.
NSF (National Science Foundation). 2016a. Science & Engineering Indicators 2016. Appendix Table 2-21. Undergraduate enrollment in engineering and engineering technology programs: 1997–2013. Available online at www.nsf.gov/statistics/2016/nsb20161/uploads/1/12/at02-21.pdf (May 3, 2016).
NSF. 2016b. Science & Engineering Indicators 2016. Appendix Table 2-35. First university degrees, by selected region/country/economy: 2012 or most recent year. Available online at www.nsf.gov/statistics/2016/nsb20161/uploads/1/12/at02-35.pdf (May 5, 2016).
OPM (Office of Personnel Management). 2012. Qualification Standards. All Professional Engineering Positions, 0800. Available online at www.opm.gov/policy-data-oversight/classification-qualifications/general-schedule-qualification-standards/0800/allprofessional-engineering-positions-0800/ (June 13, 2016).
Rezak, W.D., and A.L. McHenry. 1997. Should the bachelor of engineering technology become an applied engineering program? Journal of Engineering Technology 14(1): 8-9.
USDOL (US Department of Labor). 2008. Fact Sheet #17O: Technologists and Technicians and the Part 541 Exemptions Under the Fair Labor Standards Act (FLSA). Wage and Hour Division. Revised July 2008. Available online at www.dol.gov/whd/overtime/fs17o_technicians.pdf (May 27, 2016).
Wadhwa, V., G. Gereffi, B. Rissing, and R. Ong. 2007. Where the engineers are. Issues in Science and Technology 23(3), Spring 2007.