
3
The Production of Engineering Technology Talent
This chapter presents information about the size and composition of the cohort of students with degrees in engineering technology (ET) education at the 2- and 4-year levels and, to the extent possible, the academic pathways available to those who wish to pursue this type of education. Because the definition of the term “engineering technology” is difficult to establish, particularly as an occupational category, the committee compared basic information across multiple datasets to help ensure that subsequent analyses consider the same population. Table 3-1 provides such an overview, presenting the total stock and annual awards of ET bachelor’s degrees and the annual awards for associate’s degrees in 2013.
The committee used the Integrated Postsecondary Educational Data System (IPEDS) as its source of federal data on new bachelor’s and associate’s degrees in ET. IPEDS is effectively a census of postsecondary institutions that does not directly interview any students (Box 3-1). The IPEDS data indicate that more than 18,000 new bachelor’s degrees in ET were awarded in 2013. IPEDS reports the production of nearly 37,5000 associate’s degrees in 2013.
The American Community Survey (ACS) and the National Survey of College Graduates (NSCG), both surveys of individuals, can be used to estimate the total stock of those with 4-year degrees in ET. ACS and NSCG suggest that this stock of graduates stands at more than 480,000 and 435,000, respectively. These surveys revealed that there are roughly 10 times as many
TABLE 3-1 Comparison of Estimates of Stock of and New Awards in Engineering Technology and Engineering in 2013,a Various Sources
| Degree Holders | IPEDS | ACS | NSCG |
|---|---|---|---|
| Stock of bachelor’s degrees in engineering technology | — | 480,925 | 435,716 |
| Newly awarded bachelor’s degrees in engineering technology | 18,322 | — | — |
| Newly awarded associate’s degrees in engineering technologyb | 37,475 | — | — |
| Stock of bachelor’s degrees in engineering | — | 5,098,403 | 3,879,754 |
| Newly awarded bachelor’s degrees in engineering | 87,812 | — | — |
aAlthough the most recent IPEDS data are from 2014, Table 3-1 uses 2013 data for comparability with NSCG, which has data only through 2013.
bThe federal government does not collect data that allow estimates to be made of the stock of 2-year engineering technology degrees.
SOURCE: Calculations from noted datasets.
individuals with 4-year degrees in engineering as there are with 4-year degrees in ET. Because these data are self-reported and because of confusion about degree types within engineering-related fields, it is possible that some individuals with degrees in ET are reporting they have a degree in engineering (and are therefore being counted as engineering-degree recipients). In addition, although data on the number of degrees awarded in any one year include only those graduating from US institutions, estimates of stocks include those who have earned degrees outside the United States. Through the Accreditation Board on Engineering and Technology (ABET), the United States is signatory to two international “equivalency” agreements that provide recognition for 2-year (Dublin Accord) and 4-year (Sydney Accord) ET degrees earned in several other countries. (See “Licensing, Certification, and Equivalency” in Chapter 1.)
TRENDS IN DEGREE PRODUCTION
The principal dataset for analysis of the production of 2- and 4-year ET degrees is the IPEDS. Figure 3-1 presents the number of ET degrees awarded
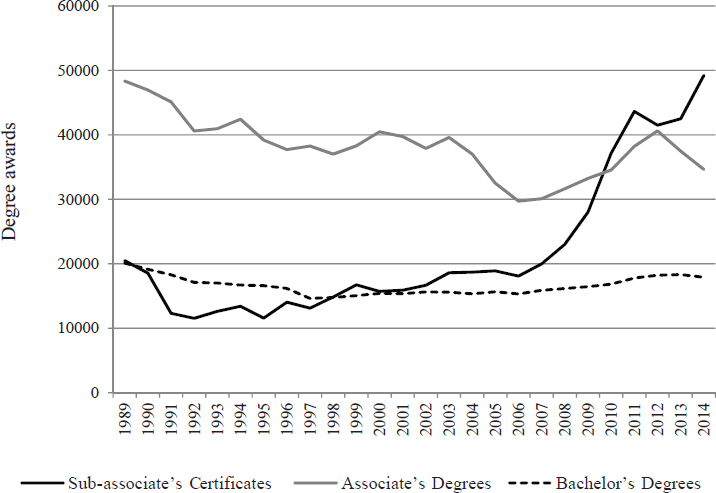
between 1989 and 2014, by degree level, with separate types of sub-associate’s degree certificates aggregated into a single “certificate” category and the (relatively rare) certificates that take between 2 and 4 years to earn and with master’s degrees omitted.
For the entire period, most ET degrees were associate’s degrees, although these declined from almost 50,000 a year in 1989 to approximately 30,000 in the mid-2000s, and then they rose to a peak of just over 40,000 in 2012 before declining again to just over 37,000 in 2014. Sub-associate’s degree certificates played the smallest role in ET education for most of this 23-year period, although growth in these certificates has been rapid for the past 5 years.1 By 2010, more certificates than associate’s degrees were awarded and have continued to exceed associate’s degrees since that time. Relative to the large declines in associate’s degree awards and increases in certificates, bachelor’s awards in ET held fairly steady over the period at between 15,000 and 20,000.
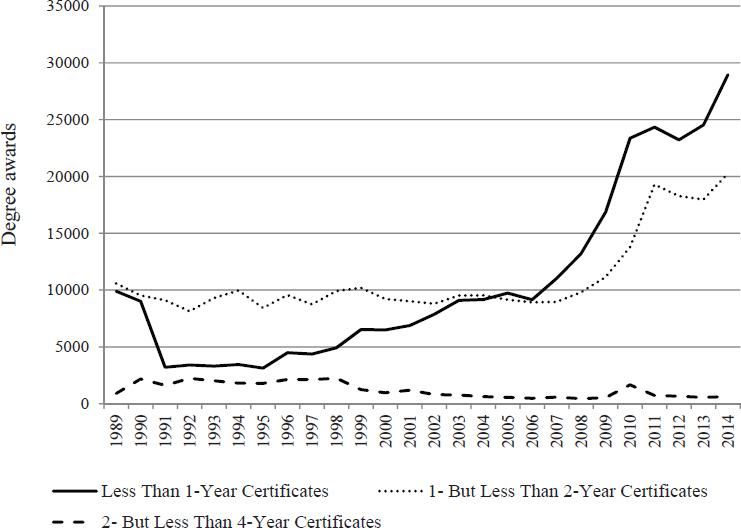
Figure 3-2 presents nondegree certificate awards in more detail, differentiating between certificates awarded within a year, certificates that take between 1 and 2 years to earn, and certificates that take between 2 and 4 years to earn. The latter category is relatively rare (these were not included in Figure 3-1), particularly in recent years. As recently as the early 1990s, however, 2- to 4-year certificates were almost as common as certificates that take less than 1 year to earn. Most of the engineering technician certificates are therefore sub-associate’s degree certificates. Between 1990 and 2002, most of these certificate awards required between 1 and 2 years to earn. After 2005, however, the number of engineering technician certificates that took less than a year to earn surpassed the number of 1- to 2-year certificates awarded. Much of the growth in sub-associate’s certificates over this period is therefore attributable to the strong growth in certificates that took less than a year to earn, although growth in 1- to 2-year certificates also was a contributor.
A clearer illustration of the rates of change of these degrees is presented in Figure 3-3, which charts indices for each of the degree categories in Figure 3-1 (with 1989 as the base year). Although the absolute number of bachelor’s degrees in ET did not decline by a substantial amount between 1989 and 2014, the bachelor’s index declined at a rate that is almost identical to the associate’s index between 1989 and 2004. By 2004, almost 25 percent fewer associate’s and bachelor’s degrees were awarded compared to 1989 levels.
___________________
1 Some of this growth may be related to the Trade Adjustment Assistance Community College and Career Training grant program (TAACCCT). TAACCT provided nearly $2 billion in grants from 2011 to 2014 to expand targeted training programs for unemployed workers, especially those impacted by foreign trade (USDOL, 2014).
After 2004, however, some of the losses in bachelor’s awards were recovered, while associate’s awards continued to decline until 2006. The large growth of sub-associate’s certificates is clear in Figure 3-3 as well. Hard economic times can be an impetus for retraining, which may explain some of the rapid growth in the 5 years spanning 2007-2014. However, neither the 1990-1991 nor the 2001 recession seems to have had this influence on certificate awards.
EDUCATIONAL COMPOSITION OF THE ET WORKFORCE
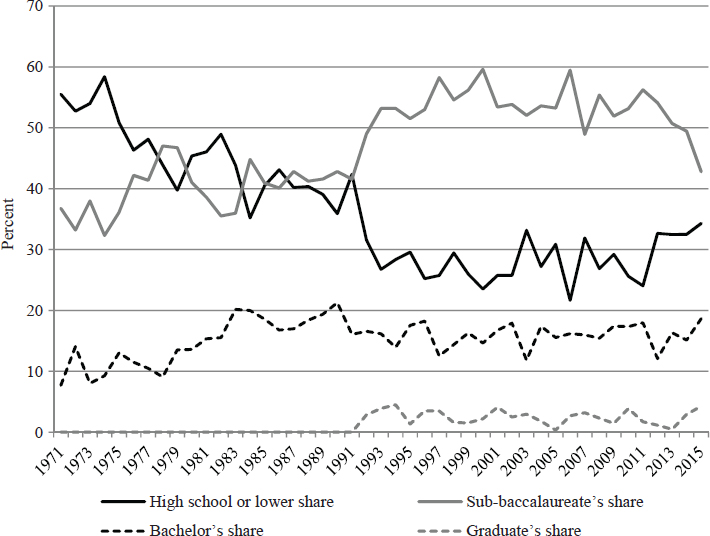
Chapter 4 provides an in-depth discussion of the employment of ET talent. Here, we touch briefly on the educational composition of those employed as engineering technologists and technicians. Over the past 40 years the educational background of those in the ET workforce has undergone substantial change (Figure 3-4). In the early 1970s, more than half held a high school degree or less, presumably gaining requisite skills through

high school vocational education, on-the-job training, and apprenticeships. This population steadily declined to less than 30 percent by the early 1990s, remaining at that level for the remainder of the period. Most of this decline consisted of an increase in the share of sub-baccalaureate’s degree holders, which grew from approximately one-third of the workforce in the early 1970s to greater than 50 percent in the 2000s. With only slight increases in the share of bachelor’s and graduate degree holders, most of the change in educational attainment comes from realignments in the sub-baccalaureate’s degree population (see also Figure 3-2).
Degree Fields
Table 3-2 provides greater detail on the distribution of awards across ET subfields using data from the 2014 IPEDS. The field names listed in Table 3-2
are taken from the Classification of Instructional Programs (CIP), the educational coding system developed by the National Center for Education Statistics (NCES), part of the US Department of Education. Unlike IPEDS, many federal datasets do not include this more detailed CIP breakdown but instead aggregate the data at a higher level. The result is that information about individual fields within ET often cannot be analyzed separately. Drafting/design engineering technology, for example, is often not categorized with ET in occupational codes used by the US Department of Labor, although it is nested within the broader ET category in standard educational field codes.
The astute reader may notice that the totals of 2- and 4-year ET degrees awarded in 2014 presented in Table 3-2 do not match those in Figure 3-1. The former shows that nearly 2,500 fewer 4-year and about 2,100 fewer 2-year degrees were handed out that year. This difference relates to the way NCES has standardized its coding of degrees across different years. Because CIP codes are revised occasionally, the standardization allows researchers and
TABLE 3-2 Postsecondary Awards by Engineering Technology Field and Degree Level, 2014
| Bachelor’s Degree | Associate’s Degree | 2-4 yr. Cert. | 1-2 yr. Cert. | < 1 yr. Cert. | |
|---|---|---|---|---|---|
| Electrical and electronic engineering technology | 2,661 | 8,182 | 9 | 1,411 | 1,445 |
| Industrial production technology | 2,563 | 3,469 | 12 | 1,987 | 2,523 |
| Mechanical engineering related technology | 2,104 | 2,009 | 208 | 572 | 729 |
| Engineering technology, other | 1,936 | 1,702 | 548 | 173 | 1,198 |
| Construction engineering technology | 1,680 | 576 | 0 | 148 | 173 |
| Quality control and safety technology | 1,445 | 846 | 149 | 113 | 522 |
| Computer engineering technology | 832 | 1,971 | 1 | 913 | 891 |
| Civil engineering technology | 532 | 825 | 5 | 28 | 75 |
| Architectural engineering technology | 386 | 686 | 0 | 62 | 208 |
| Environmental control technology | 321 | 2,709 | 0 | 3,288 | 2,437 |
| Electromechanical and instrumentation technology | 313 | 3,132 | 109 | 1,369 | 1,671 |
| Engineering related technology | 202 | 315 | 24 | 76 | 198 |
| Drafting/design engineering technology | 200 | 5,495 | 31 | 1,879 | 3,426 |
| Nuclear engineering technology | 169 | 137 | 0 | 49 | 0 |
| Mining and petroleum technology | 22 | 431 | 0 | 270 | 162 |
| Nanotechnology | 4 | 43 | 0 | 2 | 5 |
| Total | 15,370 | 32,528 | 548 | 12,340 | 15,663 |
SOURCE: Calculations from the 2014 IPEDS.
others to make consistent comparisons over time, and we present these time-series data for ET degrees graphically in Figures 3-1, 3-2, and 3-3. A downside of the standardized system, however, is that it includes several fields of degrees that the committee does not believe should be considered part of ET education (Box 3-2), and standardized coding is not available at the detailed level of Table 3-2. Thus, although the CIP codes are not as useful as the standardized ones for analyzing trends over time, they do have the advantage of enabling analysis that excludes certain portions of the underlying data. The data in Table 3-2 exclude the degree fields noted in Box 3-2.
The CIP System
Although a useful tool, the CIP system raises an important issue related to the definitional confusion surrounding ET. Specifically, some of the fields listed in Table 3-2 may not be recognized as ET by all stakeholders. Five of the field names, for example, do not include the term “engineering technology” and for this reason were not included in the committee’s survey of academic programs. As noted, CIP is organized hierarchically, with more detailed subfields aggregated into larger fields. Thus, to understand what kind of education is being counted as ET, it helps to look at the more detailed subfields. The field Environmental Control Technologies/Technicians, for example, which does not contain the term “engineering technology,” includes the following subfields, two of which do include the term “engineering technology” (NCES, 2010a):
- Energy Management and Systems Technology/Technician
- Environmental Control Technologies/Technicians, Other
- Environmental Engineering Technology/Environmental Technology
- Hazardous Materials Management and Waste Technology/Technician
- Heating, Ventilation, Air Conditioning and Refrigeration Engineering Technology/Technician
- Solar Energy Technology/Technician
- Water Quality and Wastewater Treatment Management and Recycling Technology/Technician
An additional complication is that not all field or subfield names correspond to the title of the degree awarded to students or to the program names recognized by accrediting bodies, such as ABET. NCES acknowledges this general limitation:
CIP codes, for the most part, are not intended to correspond exclusively to any specific degree or program level. In most cases, any given instructional program may be offered at various levels, and CIP codes are intended to capture all such data. (NCES, 2010b, p. 1)
In the case of the IPEDS survey, the job of reconciling specific degree and program names with the CIP coding system rests with the institution. IPEDS requires institutions to assign a single “keyholder,” the person ultimately responsible for all data submitted (NCES, 2014). The keyholder may invite as many as seven other individuals to help input data. In the end, whether a specific degree or program is included in the IPEDS tally—and which specific CIP code it is listed under—depends on decisions made by these institutional representatives.
As noted, the lack of a one-to-one correspondence between degree and program names and the CIP field and subfield descriptors had to be taken into account in the committee’s survey of ET programs. (The survey methodology is described in Appendix 3A, and a copy of the survey instrument appears in Appendix 3B.) To avoid confusion and to simplify the survey task, the committee decided to survey only those individuals associated with programs that included the words “engineering” and “technology” in the title. The resulting list of 55 programs (Box 3-3) was generated by combining the names of 2- and 4-year programs accredited by ABET with names of programs contained in the IPEDS database that do not have ABET accreditation.
Survey respondents were asked to select from the list the names of all of the ET programs offered at their institution. At the 2-year level (an associate of applied science or an associate of science degree), 86 respondents
were responsible for 37 program types.2 Of these, Electrical and Electronics Engineering Technology was the most prevalent, identified by 51 respondents, followed by Mechanical, Civil, Drafting and Design, Manufacturing, Architectural, Computer, Mechatronics, and Construction Engineering Technology, and Engineering Technology (General). At the 4-year level, 70 respondents identified 30 programs from the same list. Of these, Electrical and Electronics Engineering Technology was again the most prevalent, identified by 44 respondents, followed by Mechanical, Computer, Manufacturing, and Construction.
The NAE survey also found that the 4-year programs are much more likely to be accredited, particularly through ABET, than are the 2-year programs. About one-third of 2-year programs were ABET accredited; another one-third reported no accreditation; and about one-quarter indicated they
___________________
2 The survey item that asked about 2-year program names did not distinguish between associate of applied science (AAS) and associate of science (AS) degrees, so it is not possible to know the program names for the two degree types independently.
TABLE 3-3 Detailed Engineering Technology Degree Populations
| Survey and Field of Bachelor’s Degree | Population Estimate |
|---|---|
| 2013 NSCG | |
| “Electrical and electronic technologies” | 112,634 |
| “Industrial and production technologies” | 133,419 |
| “Mechanical engineering-related technologies” | 69,660 |
| “Other engineering-related technologies” | 120,003 |
| 2013 ACS | |
| “Engineering technologies” (general) | 49,375 |
| “Engineering and industrial management” | 67,120 |
| “Electrical engineering technology” | 132,332 |
| “Industrial production technologies” | 106,428 |
| “Mechanical engineering related technologies” | 37,426 |
| “Miscellaneous engineering technologies” | 88,244 |
SOURCE: Calculations from the 2013 NSCG and the 2013 ACS.
were accredited by another entity.3 Eighty-four percent of respondents representing 4-year programs indicated those programs were ABET accredited; 10 percent reported no accreditation; and about 6 percent indicated accreditation by another entity.
Beyond the aggregate total stock of degrees shown in Table 3-1, ACS and NSCG also can provide general information about degree fields. Table 3-3 presents the distribution of what Table 3-1 called the “stock” of bachelor’s degrees in ET. Electrical engineering technologies and industrial and production technologies are among the most popular fields in both datasets. Reflecting the issues of nomenclature and categorization described earlier, it is worth noting that “Industrial and Production Technologies,” per se, is not among the program names included in our survey of educational institutions. However, consistent with the federal data, our survey found that electrical and electronics engineering technology and mechanical engineering technology were the first and second most common program types, respectively, at both the 2- and the 4-year degree levels.
___________________
3 In addition to ABET, the survey asked about accreditation by two other organizations known to accredit some engineering technology programs: the Association of Technology, Management, and Applied Engineering and the American Council for Construction Education. However, only one 2-year program was accredited by each organization. The remaining 27 percent of respondents indicated accreditation by “Other.” The survey did not ask respondents to explain “Other,” but it may be in some cases that accreditation is conducted by the state in which the program resides.
Prevalence of Award Types
To get a sense of the prevalence of 2- and 4-year ET degree and ET certificate programs within institutions, the committee survey asked respondents to indicate the types of academic credit they grant (Table 3-4). Roughly equal numbers of respondents were responsible for 4-year and 2-year associate of applied science (AAS) degree programs. In our sample, certificate programs were much less common, and 2-year associate of science (AS) programs less common still. The relatively small number of AS programs in the survey sample may reflect the relative newness of these so-called transfer degrees (Box 3-4).
TABLE 3-4 Types of Academic Credit Granted by Engineering Technology Programs, Committee Survey
| Number of Programs | |
|---|---|
| Bachelor of Engineering Technology, 4-year degree | 70 |
| Associate of Applied Science (AAS) in engineering technology, 2-year degree | 72 |
| Associate of Science (AS) in engineering technology, 2-year degree | 22 |
| Certificates in engineering technology, less than a 2-year degree | 45 |
TABLE 3-5 Number and Types of Engineering Technology Programs Overseen by Respondents to Committee Survey
| Program Type | Number of Programs Overseen by Respondents | ||
|---|---|---|---|
| 1 (n=83) | 2 (n=42) | 3 (n=14) | |
| BS | 51 | 10 | 9 |
| AAS | 27 | 34 | 9 |
| AS | 4 | 8 | 12 |
| Certificate | 1 | 32 | 12 |
A number of people responding to the survey had responsibility for more than one type of degree program (Table 3-5).
DEMOGRAPHICS: DIVERSITY AND AGE
IPEDS data are ideal for generating a comprehensive understanding of engineering technician and technologist production, but other data can contribute to in-depth analysis of the characteristics of these graduates. In addition to the IPEDS, the ACS, the Baccalaureate and Beyond Longitudinal Study (B&B), and NSCG offer detailed cross-sectional information on student demographic, educational, and labor market characteristics.
IPEDS data on recent graduates (Table 3-6) show that racial and ethnic groups traditionally underrepresented in STEM fields are better represented in ET than in engineering. Most striking, ET degree earners are almost three times as likely to be black as those who receive a 4-year degree in engineering (almost 11 percent vs. almost 4 percent); the percentage of graduates who are Hispanic is equivalent between the two degree types, at about 10 percent. The share of sub-baccalaureate ET awards going to blacks and Hispanics in ET is even higher than is the share of 4-year ET degrees. And, compared to their representation in engineering, the proportion of ET graduates who are American Indian or Alaska Native is more than three times higher. However, degree earning by all groups remains significantly below their shares of the overall population. Compared with engineering, smaller shares of graduates with degrees in ET are Asian or Pacific Islander, a group not underrepresented in science, technology, engineering, and mathematics (STEM) fields.
In terms of gender, women were about 60 percent more likely to earn a 4-year degree in engineering than a 4-year degree in ET (almost 20 versus 12 percent). Both percentages are much lower than are the female share
TABLE 3-6 Gender and Race of Engineering Technology and Engineering Graduates, 2014 IPEDS
| Total Population | Engineering Technology | Engineering | |||
|---|---|---|---|---|---|
| Less Than 1-Year Certificates | Associate’s Degrees | Bachelor’s Degrees | Bachelor’s Degrees | ||
| Race and ethnicity | |||||
| White, Non-Hispanic | 62.1% | 62.5% | 63.1% | 63.6% | 61.5% |
| Black, Non-Hispanic | 12.4% | 14.8% | 11.4% | 10.7% | 3.8% |
| Hispanic | 17.4% | 12.3% | 13.0% | 10.0% | 9.6% |
| Asian or Pacific Islander | 5.4% | 2.7% | 3.1% | 3.9% | 10.9% |
| American Indian or Alaska Native | 0.7% | 1.1% | 1.0% | 0.8% | 0.3% |
| Other/Unknown Races & Ethnicitiesa | 2.0% | 5.8% | 7.4% | 7.2% | 5.8% |
| Student visa | — | 0.8% | 0.9% | 3.7% | 8.0% |
| All Females | 50.8% | 10.1% | 12.4% | 12.0% | 19.8% |
| Females, by race and ethnicity | |||||
| White, Non-Hispanic | 31.5% | 5.5% | 7.2% | 6.5% | 11.2% |
| Black, Non-Hispanic | 6.5% | 1.5% | 1.7% | 2.1% | 1.0% |
| Hispanic | 8.6% | 1.4% | 1.7% | 1.5% | 2.1% |
| Asian or Pacific Islander | 2.8% | 0.6% | 0.5% | 0.5% | 2.6% |
| American Indian or Alaska Native | 0.4% | 0.1% | 0.2% | 0.1% | 0.1% |
| Other/Unknown Races & Ethnicities | 1.0% | 0.8% | 0.9% | 0.9% | 1.2% |
| Student visa | — | 0.2% | 0.2% | 0.5% | 1.7% |
aThe committee is unaware of any federal data that estimate the stock of those with student visas, so the “Total Population” cell for men and women with visas is left blank in this table.
SOURCES: Calculations from the 2014 IPEDS; population of institutions from NCES. Total population shares are from the US Census Bureau, with population-level race and ethnicity shares used for the female race and ethnicity shares.
of bachelor’s degree earners overall (57.3 percent; IPEDS) and the share of women in the population (51 percent; US Census Bureau, 2016). The one female subgroup where ET fared better than engineering was African American females, where the (admittedly small) share graduating with 2- and 4-year awards was 70 percent and 100 percent greater, respectively, than was the share earning 4-year degrees in engineering.
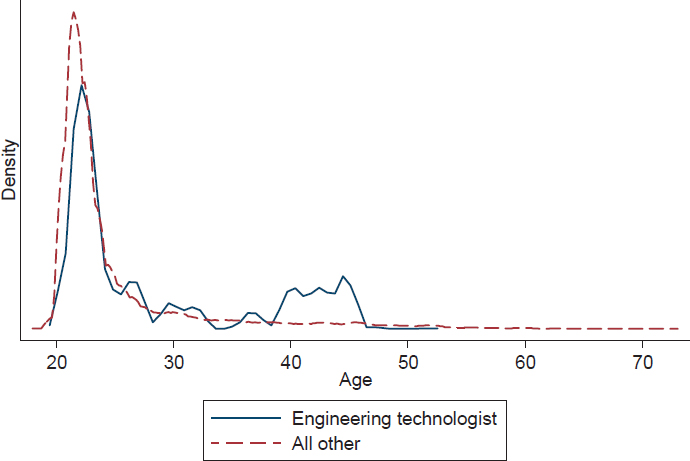
The age distribution of 4-year ET graduates and all other 4-year graduates at their interview date for the first wave of the B&B (2008/2009) survey4 (administered 1 to 2 years after graduation) is presented in Figure 3-5. Of course, the large majority of 4-year college graduates are in their early 20s, and ET graduates are no exception. What is more notable is the nontrivial share of ET graduates in their early 40s. In stark contrast to the general popu-
___________________
4 The unweighted sample of ET bachelor’s program graduates in the B&B is relatively small, about 220 respondents. Because the full B&B sample is not stratified by academic major, population sizes for ET graduates in the 2008-09 school year cannot be produced with certainty from these data (and other estimates should be interpreted with caution). Still, the unweighted sample size is large enough to generate basic descriptive statistics on 4-year ET graduates.
lation of bachelor’s degree holders, one-quarter of ET graduates were older than 35 at the time of their interview in their early postbaccalaureate careers.
WORK-BASED EDUCATION AND TRAINING
Work-based education and training plays an important role in the development of engineering technologists and technicians. In this section, we consider four types of such experiences: internships, cooperative education (co-ops), apprenticeships, and on-the-job training. Relative to what is known about classroom-based education, comprehensive data on work-based education and training are illusive and pose many empirical difficulties, particularly when examining a specific field such as ET.
Work-based education and training can have advantages over traditional classroom education. By design, trainees form strong connections to the labor market, either as employees (apprenticeship and on-the-job training) or as potential employees (internship and co-op). These connections help to ease the school-to-work transition, which can be especially difficult for individuals coming from disadvantaged backgrounds or for any worker in a depressed labor market. Work-based education and training also is valuable because the content of provided instruction is directly relevant to tasks performed on the job. Although classroom education can be highly practical and make close connections to work, it cannot replicate the specific collection of tasks on the job, need for problem solving, interactions with coworkers, or the pace of a standard workday. Finally, work-based education and training almost always come with financial compensation, so that trainees can “learn and earn.” This model can make education and training more affordable, accessible, and rewarding. In addition, there is some evidence (e.g., Schuurman et al., 2008) that work-based learning experience in engineering can raise starting salaries even after controlling for academic performance.
Internships and Co-Ops
Our survey of educators finds that compared with apprenticeships, either internships or co-op experiences are a fundamental component of many engineering and ET programs (Table 3-7).5 Both are work-based learning
___________________
5 This is in contrast to the situation with apprenticeships, which are much less prevalent. Apprenticeships are discussed later in this section.
TABLE 3-7 Estimated Prevalence of Work-Based Experiences for Students at 2- and 4-Year Engineering Technology Programs, Percent
| Apprenticeship | Internship | Co-op | Summer | Other | Don’t Know | |
|---|---|---|---|---|---|---|
| Two-Year Programs (N=84) | 20.2 | 66.7 | 32.1 | 46.4 | 6.0 | 8.3 |
| Four-Year Programs (N=70) | 5.7 | 71.4 | 51.4 | 68.6 | 12.9 | 4.3 |
NOTE: In the committee survey, apprenticeships were described as “paid vocational programs for certification” and may not be formally identified as an apprenticeship by the educational institution, the employer, or the Department of Labor; internships as “paid or unpaid, at an employer, coordinated with the academic curriculum”; cooperative work experience (Co-op) as “semester- or quarter-based work experience as an alternative to campus-based learning”; and summer industrial work experiences (Summer) as “paid or unpaid and independent of the college/university.”
experiences that occur while a student is enrolled in a degree program. Internships are shorter (often only a semester or during the summer) and less intensive than co-ops. They may or may not be paid or full-time. In contrast, co-ops are intensive, full-time, and paid experiences that typically require several alternating semesters with the employer. Training is often provided in both cases, although to varying degrees depending on the employer. Students are typically evaluated by the employer and report on their experiences to their academic department. This reporting process is often used to reinforce professional skills. For example, students in the computer ET program at Rochester Institute of Technology have to make a formal presentation on their co-op to their department in order to improve their presentation and communication skills (Eastman et al., 2005).
The primary values of the internship to the student (besides the pay) are the on-the-job experience and the potential for converting to an employee after graduation. Academic departments can benefit from internships and co-ops that provide stronger connections to local businesses. Vidalis and Cecere (2008) discuss the use of feedback from employers involved in internships to keep their construction ET curriculum up to date. The benefits of ties to local businesses can flow in both directions; the authors also discuss the recruitment of internship hosts through their industry advisory board.
Data from our survey of employers (Table 3-8) are consistent with what we learned from educational programs (Table 3-7): internships and co-ops
TABLE 3-8 Types of Experiential Education Provided to Students by Employers, Percent (N=225)
| Internship | 92.4 |
| Cooperative work experience | 65.3 |
| Summer technical work experiences | 36.4 |
| Apprenticeship | 8.4 |
| Don’t Know | 0.4 |
| Other | 1.8 |
are a very popular mechanism for providing ET students with work-based experiences, while apprenticeship opportunities are much less prevalent.
According to the National Association of Colleges and Employers (NACE), employers operating internships and co-ops primarily offer this training in order to recruit entry-level hires. In a 2014 NACE survey, three-quarters of employers reported this as a reason for operating internships, and better than 60 percent reported the same for co-ops.6 As noted, one measure of the value of co-ops and internships, for students, is the likelihood of converting their part-time experience into a full-time job. Table 3-9 presents the job offer, acceptance, and conversion rates for all (not just those enrolled in ET programs) intern and co-op students working for the employers surveyed by NACE. Interns and co-op students of all education levels consistently convert to employees at a rate of about 45 percent. Co-op students are more likely to accept an offer than are interns, so a lower offer rate is able to achieve the same conversion rate. This is not surprising, because students in co-ops have the opportunity to build deeper relationships with employers than do interns, with the result that their job skills may be more closely aligned with that employer. Interns have more generalizable job experience that may free them to reject job offers and pursue opportunities elsewhere.
To gain some insight into the nature of internship and co-op programs specific to ET, the committee used information compiled by U.S. News and World Report for its rankings of American colleges and universities. As part of its ranking process, the magazine asked chief academic officers, deans of
___________________
6 These data represent survey responses from 264 out of 1,116 NACE employer members. This is a relatively low response rate and may introduce bias into the reported results if respondents differ systematically from nonrespondents. Additionally, the NACE corporate membership is weighted toward large and midsize companies. As a result, the NACE data should be understood as coming from a “convenience sample,” providing useful but not necessarily nationally representative information.
TABLE 3-9 Job Offer, Acceptance, and Conversion Rates of Intern and Co-op Students, NACE Employer Members, 2014
| Offer Rate | Acceptance Rate | Conversion Rate | |
|---|---|---|---|
| Interns | |||
| Associate’s | 69.40% | 66.70% | 46.30% |
| Bachelor’s | 60.50% | 77.40% | 46.80% |
| Co-ops | |||
| Associate’s | — | — | — |
| Bachelor’s | 53.70% | 82.20% | 44.10% |
NOTES: Data are from the NACE 2014 Intern and Co-op Survey. Although the NACE survey reports co-op rates for associate’s degree holders, the sample is sufficiently small that these figures are not reported here.
students, and deans of admissions from more than 1,500 schools to nominate up to 10 institutions with stellar examples of internship and co-op programs. Of the 13 top schools, 5 had ET programs, and 3 of these (Rochester Institute of Technology [RIT], the University of Cincinnati, and Purdue University) reported salary data. RIT and Cincinnati report minimum, average, and maximum hourly wages for all co-ops (Table 3-10). Purdue reported average monthly earnings (Table 3-11). Because all three institutions also have engineering programs, co-op earnings also are presented for engineers in comparable fields (when a comparable field is available). As shown in Table 3-10, patterns of average hourly wages vary across fields and schools. Typically, engineering students earn more than do ET students, although this is not the case for all fields at the University of Cincinnati. Architectural and civil ET students earn lower average hourly wages, but students in all other fields have relatively comparable average wages.
In the case of Purdue7 (Table 3-11), engineering students typically earn more than do their ET counterparts in these co-ops, although this is not always the case (e.g., fifth period earnings for electrical and computer engineering technology co-ops).
Valentine and Richardson (2010) have studied the long-term performance of RIT ET students, all of whom are required to have at least 50 weeks of co-op experience before graduating. They find that RIT graduates’ earn-
___________________
7 Because Purdue presents data from one academic year, a different group of students will be represented in each period. These data do not report the wages of the same cohort of students as they move through their co-op.
TABLE 3-10 Hourly Wages of Engineering Technology and Engineering Co-op Students at Rochester Institute of Technology and the University of Cincinnati
| Engineering Technology | Engineering | |||||
|---|---|---|---|---|---|---|
| Min. | Avg. | Max. | Min. | Avg. | Max. | |
| Rochester Institute of Technology | ||||||
| Civil | $8.00 | $12.89 | $24.00 | — | — | — |
| Computer | $8.50 | $16.01 | $25.00 | $7.50 | $19.89 | $46.25 |
| Electrical | $10.00 | $15.98 | $22.00 | $14.00 | $17.00 | $28.00 |
| Manufacturing | $10.00 | $15.36 | $22.38 | — | — | — |
| Mechanical | $8.00 | $16.65 | $30.00 | $10.00 | $17.02 | $35.00 |
| Telecommunications | $10.00 | $17.54 | $31.25 | — | — | — |
| The University of Cincinnati | ||||||
| Architectural | $11.50 | $13.87 | $18.00 | $9.00 | $13.65 | $17.00 |
| Computer | $13.00 | $16.90 | $22.00 | $10.00 | $16.94 | $30.00 |
| Electrical | $11.50 | $15.99 | $22.00 | $10.00 | $17.51 | $33.00 |
| Mechanical | $10.00 | $16.12 | $22.72 | $7.25 | $17.49 | $40.96 |
NOTES: RIT data are from www.rit.edu/emcs/oce/employer/salary, downloaded October 2014. The University of Cincinnati data for the 2013-14 academic year are from www.uc.edu/propractice/salary-information.html. The salaries listed with RIT’s Electrical Engineering Technology program actually pertain to its “Electrical/Mechanical Engineering Technology” program. No such degree exists for engineering, so these are compared to Electrical Engineering wages.
ings grew during the 2000s at approximately the same rate as engineering technologists generally. Graduates tend to work in more “applied” engineering jobs, and among these ET graduates an increasing share have identified their occupation as “engineer” over time. Satisfaction with the education provided by RIT also has increased. Dave and Dong (2010) note that the University of Cincinnati’s work-based learning opportunities in ET extend beyond traditional co-ops to include service learning and study abroad programs.
Despite the shorter duration of associate’s programs in ET, many 2-year institutions also run internships, often during the summer between students’ first and second year of study. These programs are more difficult to assess, given their diversity and the tendency of 2-year degree programs to either feed local labor markets or provide transfers to 4-year degree programs. No data comparable to those provided by U.S. News and World Report are available for this cohort.
TABLE 3-11 Monthly Earnings of Engineering Technology and Engineering Co-op Students at Purdue University, by Period
| Five Period Co-ops | First | Second | Third | Fourth | Fifth |
|---|---|---|---|---|---|
| Elect. & Comp. Engineering Technology | $1,860 | $3,040 | $3,451 | $3,812 | — |
| Computer Engineering | $3,110 | $32293 | $3,406 | $3,553 | $3,683 |
| Electrical Engineering | $3,218 | $3,541 | $3,615 | $3,715 | $4,357 |
| Mechanical Engineering Technology | $2,800 | $2,880 | $3,025 | $3,360 | — |
| Mechanical Engineering | $3,036 | $3,160 | $3,410 | $3,533 | $3,857 |
| Three Period Co-ops | |||||
| Elect. & Comp. Engineering Technology | $2,700 | $3,200 | $3,360 | — | — |
| Computer Engineering | $3,402 | $3,692 | — | — | — |
| Electrical Engineering | $3,209 | $3,491 | — | — | — |
| Mechanical Engineering Technology | $3,040 | $3,280 | — | — | — |
| Mechanical Engineering | $2,934 | $3,404 | $3.702 | — | — |
NOTE: Data downloaded in October 2016 from https://opp.purdue.edu/files/AverageSalaries-Guidelines.pdf.
ET departments and employers have experimented with variations on the traditional internship and co-op experience to fit their needs. For example, the electronics and telecommunications ET program at Texas A&M University operates an “Engineering Entrepreneurship Educational Experience” (E4) program, where local employers work with students in the classroom to move their product ideas to the prototype stage. Because these employers are locally based, interested students also can work on further commercialization of the product if they wish to. Porter and Morgan (2006) argue that this strategy is better suited to teaching entrepreneurship to students than is either standard classroom instruction or an internship or co-op that the department has less control over. It can even help serve as a professional development opportunity for faculty involved in the project.
Montana State University’s (MSU’s) mechanical engineering technology program has designed an internship that addresses the unique challenges faced by rural universities. In a rural setting, it is often difficult to identify employers for internships and co-ops. At MSU, instead of pairing with external employers, mechanical engineering technology students have the opportunity to work at the Center for Biofilm Engineering, a National
Science Foundation–funded engineering research center. Interns are tasked with designing, building, and testing a biofilm test system for use at the center (Cook et al., 2010). Although the internship program at MSU looks to intramural employers as an alternative to a traditional internship, the manufacturing engineering technology program at Brigham Young University offers paid internships at small manufacturing enterprises in Cambodia as an option for its students. This internship gives students a global perspective and emphasizes the role that these enterprises play in developing economies (Hawks and Miles, 2006).
Apprenticeships
The principal components of the apprenticeship training model are paid, productive employment that occurs concurrently with both on-the-job and classroom training in order to gain mastery over a specified set of skills. Apprenticeships are often integrated into career ladders or certifications, but these are not necessarily elements of all apprenticeships. In this sense, the model inverts the internship or co-op model, insofar as the apprentices are first and foremost paid, productive employees rather than students enrolled at a college or university. In the United States, apprenticeship programs are heavily concentrated in the construction industry, and in many cases, they are administrated by unions. Union sponsorship is less common for ET apprenticeships, which primarily serve the manufacturing sector.
Apprenticeship in the United States has received new attention with President Obama’s pledge in the 2014 State of the Union address to reprogram $500 million in federal funds to promote “job-driven training.” As part of this effort, the administration announced the availability of $100 million from H-1B visa fees to fund grants to apprenticeship partnerships (White House, 2014).
Apprenticeship programs in the United States fall into three broad (and in some cases overlapping) categories: (1) registered apprenticeships, (2) unregistered apprenticeships, and (3) youth apprenticeships. Registered apprenticeships meet certain federal and state program requirements in order to register with the Employment and Training Administration (ETA) of the US Department of Labor (DOL) or a State Apprenticeship Agency (SAA). Registered apprenticeship programs can be time based (requiring a minimum of 2,000 training hours), competency based (requiring demonstration of proficiency in essential job skills), or a hybrid of time- and competency-based training.
Unregistered apprenticeships follow the same training model, but they do not have a formal relationship with the DOL-ETA or an SAA. As a result, training intensity and quality may vary more substantially across unregistered apprenticeship programs. Youth apprenticeships target high school students in order to smooth the transition from school to work. These programs are well developed in Wisconsin and Georgia but are less common in other states. Our analysis will focus on registered ET apprenticeship programs, with a brief discussion of two cases of unregistered programs.
Registered Apprenticeships
Information on registered apprentices comes from the DOL’s Registered Apprenticeship Partners Information Management Data System (RAPIDS). The system provides a complete record of individual registered apprentice experiences, but it critically covers only the states where programs register with DOL or register with SSAs but use the RAPIDS system.8 Therefore, the analyses presented below provide valuable information on many (ET registered apprenticeships but they may not be representative of all programs.
The available RAPIDS data cover all apprenticeship programs registered with DOL-ETA from 1999 to 2014. Over this period, almost 5,000 apprentices were identified as engineering technicians or technologists,9,10 less than half of 1 percent of the total of more than 1.2 million such apprenticeships. These ET apprentices were employed by 398 different sponsors (typically employers), although many reported sponsors represent different divisions of the same company. Several major manufacturers sponsor engineering technician and technologist apprenticeship programs covered in the RAPIDS data, including Alcoa, BP, Cummins, DuPont, ExxonMobil, Ford, John Deere, and Raytheon. Other large employers include local utilities. Federal agencies and labs do not
___________________
8 The states not included in the RAPIDS dataset are Connecticut, Delaware, Hawaii, Maine, Maryland, Massachusetts, Minnesota, Montana, Nebraska, New York, North Carolina, Oregon, Rhode Island, Vermont, Virginia, Washington, and Wisconsin.
9 Some of the job titles entered by sponsors in RAPIDS can be cryptic, so apprentices were counted as engineering technicians or technologists if they (1) had an O*NET-SOC occupational code associated with engineering technology or (2) the job title provided explicitly used the phrase “engineering technologist” or “engineering technician.”
10 States not part of RAPIDS provide yearly estimates to the DOL on the total number of active apprenticeships within the state, so it is possible to get a rough sense of the magnitude of the apprenticeship population not captured in RAPIDS. In 2014, roughly one-third of apprentices nationally were not in the RAPIDS database.
employ a large number of these apprentices, but they also are represented, including NASA and Sandia National Laboratory. Table 3-12 presents the distribution of apprentices across employer industries.
Most employers with registered apprenticeship programs involving engineering technologists and technicians are engaged in manufacturing or in the public sector, with a lower share in construction than is typical of the full population of apprentices. Just over 20 percent of ET apprentices receive job training as prison inmates (Table 3-13). Because this population may be quite different from the typical engineering technician or technologist population, the characteristics of apprentices provided in Table 3-13 are presented separately for inmates.
A little more than one-third of non-inmate engineering technician and technologist apprentices are unionized (36.7 percent). Unions often play an instrumental role in apprenticeship programs operating at union shops. Only 7.9 percent of these apprentices are female, a lower share than for female recipients of ET certificates, associate’s degrees, or bachelor’s degrees (Table 3-6). And compared with those in certificate- and degree-granting programs, a greater proportion of engineering technician and technologist inmate apprentices are black. This is not surprising, given well-known racial disparities in incarceration rates in the United States (e.g., NRC, 2014). Non-inmate apprentices also are older than apprentices overall, with an average
TABLE 3-12 Industrial Distribution of Engineering Technician and Technologist Apprentices, 1999–2014
| Industry | Percent |
|---|---|
| Manufacturing | 46.69 |
| Public Administration and National Security | 30.29 |
| Utilities | 9.84 |
| Construction | 3.24 |
| Unknown Industry | 3.16 |
| Professional and Technical Services | 2.11 |
| Information | 1.40 |
| Wholesale Trade | 1.28 |
| Mining, Quarrying, and Oil and Gas Extraction | 0.89 |
| Educational Services | 0.55 |
| Other Services (except Public Administration) | 0.43 |
| Administrative and Waste Services | 0.10 |
| Health Care and Social Assistance | 0.04 |
NOTE: Committee’s calculations are based on the RAPIDS database from 1999 to 2014.
TABLE 3-13 Characteristics of Engineering Technologist and Technician Registered Apprentices in the RAPIDS Database, 1999–2014
| Total Engineering Technologists and Technicians | Non-inmate Engineering Technologists and Technicians | Inmate Engineering Technologists and Technicians | All Apprentices | |
|---|---|---|---|---|
| Apprentices in the RAPIDS database | 4,939 | 3,872 | 1,067 | 1,222,046 |
| Unionized | ||||
| Union | 28.79% | 36.73% | 0.00% | 60.44% |
| Nonunion | 68.05% | 59.25% | 100.00% | 39.33% |
| Unknown | 3.16% | 4.03% | 0.00% | 0.24% |
| Gender | ||||
| Female | 7.85% | 7.85% | 3.84% | 6.80% |
| Male | 92.15% | 91.12% | 96.16% | 91.66% |
| Unknown | 0.00% | 1.03% | 0.00% | 1.54% |
| Race/ethnicity | ||||
| White | 71.39% | 78.23% | 46.58% | 64.77% |
| Black | 14.56% | 8.37% | 37.02% | 11.63% |
| Hispanic | 7.25% | 6.02% | 11.72% | 16.11% |
| Asian | 2.15% | 2.53% | 0.75% | 1.20% |
| Hawaiian/Pacific Islander | 1.19% | 1.42% | 0.37% | 0.76% |
| Native American | 1.58% | 1.39% | 2.25% | 1.44% |
| Unknown | 1.88% | 2.04% | 1.31% | 4.08% |
| Age at registration | ||||
| 16-20 | 4.66% | 5.81% | 0.47% | 14.46% |
| 21-25 | 11.93% | 14.10% | 4.03% | 27.26% |
| 26-30 | 16.00% | 17.20% | 11.62% | 20.28% |
| 31-35 | 16.70% | 16.14% | 18.75% | 13.40% |
| 36-40 | 15.75% | 14.82% | 19.12% | 9.08% |
| 41-45 | 14.09% | 13.69% | 15.56% | 6.19% |
| 46-50 | 11.30% | 10.38% | 14.62% | 3.78% |
| 51-55 | 5.73% | 5.04% | 8.25% | 1.94% |
| 55+ | 3.77% | 2.76% | 7.40% | 1.11% |
| Unknown | 0.07% | 0.06% | 0.18% | 2.50% |
| Mean age | 36.4 | 35.2 | 40.3 | 29.4 |
| Educational attainment | ||||
| ≤ 8th grade | 0.18% | 0.15% | 0.28% | 1.01% |
| 9th-12th grade | 4.13% | 4.36% | 3.28% | 10.35% |
| GED | 14.38% | 6.04% | 44.61% | 12.03% |
| Total Engineering Technologists and Technicians | Non-inmate Engineering Technologists and Technicians | Inmate Engineering Technologists and Technicians | All Apprentices | |
|---|---|---|---|---|
| ≥ High school | 66.75% | 74.04% | 40.30% | 68.57% |
| Postsecondary or technical training | 12.43% | 12.91% | 10.68% | 4.39% |
| Education unknown | 2.12% | 2.48% | 0.84% | 3.66% |
NOTES: Committee’s calculations are based on the RAPIDS database from 1999 to 2014. Apprentices in states that do not use the RAPIDS data system are not included.
age of 35.2, and more than 30 percent are over age 40. Although apprentices in the United States tend to be older than their counterparts in Europe and elsewhere (where apprenticeship primarily functions as a form of entry-level training for youth), the age differential is even starker for engineering technicians and technologists.
Almost three-quarters of non-inmate apprentices report attaining a high school diploma or higher, including nearly 13 percent who report having a postsecondary degree or some form of technical training. Unfortunately, the RAPIDS system does not provide consistent or detailed information about educational attainment above the high school level. It is clear, however, that ET apprenticeships are being filled by workers who are at least as well educated as the population of apprentices as a whole.
Unregistered Apprenticeships: Two Case Studies
Many apprenticeship programs are not covered in the RAPIDS database either because they are registered with an SSA that does not use RAPIDS or because they are unregistered. This includes several prominent ET apprenticeship programs. Two such programs are operated at BMW’s South Carolina plant and at the Apprentice School in Newport News, Virginia. The BMW program is unregistered, while the Apprentice School program is registered with the state of Virginia but does not appear in the federal database. BMW cites confidence and flexibility in its capacity to provide widely recognized, high-quality training without public assistance and unnecessary bureaucracy as a reason for being unregistered. It reproduces the same train-
ing regime in its South Carolina plant that the company implements with great success in Germany. The Apprentice School started operating its school long before the modern growth in registered apprenticeship programs, and its quality is highly regarded in the shipbuilding industry.
BMW is one of a number of German companies that have brought the apprenticeship training model to the United States.11 Others include Volkswagen (Chattanooga, Tennessee) and Siemens (Charlotte, North Carolina). BMW established its only American plant near Spartanburg and Greenville, South Carolina. Its apprenticeship program is called the “BMW Scholars Program,” and it accepts more than 50 students into the program each year for a 2-year period that combines education with on-the-job training. The more traditional educational components of the apprenticeship are provided by Spartanburg Community College, Tri-County Tech, and Greenville Technical College. As a requirement of the program, apprentices complete an AS or AAS degree in relevant fields, such as automotive technology, mechatronics, industrial maintenance, mechanical engineering, electrical engineering, or production technology. The on-the-job BMW-specific training is provided by BMW in its facility over the 2-year period. BMW also supports intern and co-op assignments for apprenticeship completers who choose to pursue a bachelor’s degree in engineering. The certifications earned by the BMW Scholars are internationally recognized in the BMW Group, and completers can work productively in any BMW plant and for other employers as well.
Apprentice pay in the BMW program is somewhat lower than in some ET intern and co-op programs (e.g., Tables 3-10 and 3-11, although these data reflect students pursuing bachelor’s degrees) and at the more comparable Apprentice School, discussed below. Aring’s (2014) study of German companies operating apprenticeship programs in the United States found that BMW Scholars are paid $10-12 an hour as apprentices and are offered jobs paying $20-25 an hour upon completion, a rate comparable to completion wages at the Apprentice School. According to BMW (Werner Eikenbusch, BMW Manufacturing Co., LLC, 10/21/2015),12 the pay for apprentices at BMW reflects the prevalent apprenticeship rate paid in the region and takes into consideration the cost of living in the region. In addition, BMW provides generous tuition assistance and benefits for its apprentices, which for most of the apprentices cover the full cost of tuition.
___________________
11 The following discussion of the BMW Scholars Program draws heavily on Monika Aring’s (2014) report on apprenticeships at BMW, Volkswagen, and Siemens plants in the United States.
12 Werner Eikenbusch was a member of the study committee for this project.
South Carolina is attractive to BMW in part because of its policy environment, which is characterized by heavy promotion of apprenticeship training through the Apprenticeship Carolina initiative (www.apprenticeshipcarolina.com), a robust technical college system, a work-ready labor pool, generally low taxes, and business-friendly regulations. BMW has avoided external regulation of its on-the-job training curriculum, while the AS/AAS college degree curricula are regulated by the state of South Carolina. BMW operates the BMW Scholars Program successfully without coordinating curriculum or training across other programs in the same occupation group, which is distinct from the functioning of federally registered apprenticeships, which have to have their training approved by either DOL-ETA or a federally recognized SSA. The approach of leveraging the existing AS/AAS technical degree infrastructure and keeping the on-the-job training content flexible to quickly address changes in business requirements has been satisfying for both BMW and its apprentices. BMW has worked successfully with Apprenticeship Carolina to establish certification of the BWM Scholars Program at the state level. BMW believes that this sort of apprenticeship training is conducive to scaling in the United States (for ET specifically or more generally).
The Apprentice School was established in 1919 and is operated by Huntington Ingalls Industries in Newport News, Virginia. It is not registered with DOL-ETA and does not appear in the RAPIDS database, but it is registered with the state. The school is a highly regarded apprenticeship program that produces engineering technicians in collaboration with Thomas Nelson Community College, where apprentices may matriculate if they elect to pursue an advanced curriculum after their introductory shipbuilding and trade-related curriculum.13 The school also partners with Tidewater Community College and Old Dominion University (Fain, 2015).
Apprentices first go through four academic terms of shipbuilding and trade courses, with trade options ranging from dimensional control technician and electrician to pipefitting and welding. Shipbuilding courses include a foundation in technical math, technical communication, physical science, and ship construction. Apprentices who elect to go on to pursue ET are first required to take “pre-advanced” college preparatory and higher math courses. These courses, along with the ET courses, together take an additional nine semesters. Apprentices have the option of pursuing an associate’s degree in either mechanical or electrical ET. Apprentice School apprentices are full-time paid employees as they advance through their coursework, and
___________________
13 The advanced curriculum also has business administration and engineering options provided by Tidewater Community College.
they receive on-the-job training and mentorship from a team of 70 craft instructors. These instructors monitor and evaluate the development of the apprentices’ job skills and provide training.
A wage progression is an important part of the Apprentice School program, as it is for many apprenticeship programs, and is contingent on progress through the curriculum. Table 3-14 presents the wage schedule effective in 2014. The beginning and ending wages for these apprentices match or exceed the co-op earnings for those enrolled in 4-year ET programs (Table 3-11).
The Apprentice School also recognizes differences in conditions across occupational labor markets by providing alternative wage schedules for dimensional control technicians, patternmakers, marine designers, and production planners. The wage schedule provides apprentices with steady pay increases from term to term. In total, apprentices that remain in the program will experience at least a 57 percent pay increase, according to this schedule.
On-the-Job Training
On-the-job training (OJT) is an essential source of human capital investment, particularly in fields that are rapidly changing due to technological development. However, OJT can be difficult to assess empirically. It lacks the standardized definitions of classroom training (or even internships, coops, and apprenticeships) and is often delivered in an informal way, so that
TABLE 3-14 Apprentice School Wage Progression, 2014
| Pay Rate Effective | Hourly Wage |
|---|---|
| Beginning of 1st Term | $15.95 |
| Mid-Term of 1st Term | $16.64 |
| Beginning of 2nd Term | $17.36 |
| Mid-Term of 2nd Term | $18.18 |
| Beginning of 3rd Term | $19.00 |
| Mid-Term of 3rd Term | $19.70 |
| Beginning of 4th Term | $20.68 |
| Beginning of 5th Term | $22.12 |
| Beginning of 6th Term | $22.77 |
| Beginning of 7th Term | $23.56 |
| Beginning of 8th Term | $24.18 |
| Completion | $25.12 |
NOTE: Data are from www.as.edu/wages.html.
reporting, if it even occurs, may be unreliable. Barron and colleagues (1997) find that although employers and workers report similar incidence of OJT, employers report 25 percent more hours of training than do workers. This measurement error is not inconsequential; it results in an underestimation of the effect of training on wages in studies that do not take this problem into account (Barron et al., 1997, pg. 525). Lerman and colleagues (2004) compile evidence from previous studies of OJT with more recent survey data in order to make broader claims about training despite the inherent measurement problems. They find that OJT has increased over time and that bachelor’s degree holders tend to receive more OJT than less-educated workers receive.
Prior studies of OJT have used datasets such as the National Household Education Survey or the Survey of Income and Program Participation. These are valuable data sources for studying training for the entire national workforce, but they are not as well suited to studying detailed subpopulations such as the engineering technician and technologist workforce, because too few technicians and technologists appear in these datasets. As an alternative, we use data from the 2010 NSCG, which oversamples STEM graduates and provides a sufficiently large sample of engineering technologists. NSCG is not a perfect data source because it only collects information about bachelor’s degree holders and is therefore not useful for understanding the OJT experiences of engineering technicians. In addition, the survey also seems to identify more engineering technologists than do other labor market surveys, suggesting that some engineers or related technician occupations may be classified mistakenly as engineering technologists. If this is the case, then the findings below may imperfectly reflect the actual OJT experience of engineering technologists.
Respondents to NSCG are asked whether they received training in the past 12 months, although they are not asked about the intensity, formality, or duration of the training. Table 3-15 presents the training rates for all engineering technologists and by age group. Training rates are higher for younger workers, although a substantial amount of training occurs for all
TABLE 3-15 Percentage of Engineering Technologists and Bachelor’s Degree Holders Receiving OJT in the Last 12 Months, 2013
| All engineering technologists | 48.8 |
| Early career (ages 25-35) | 65.6 |
| Mid- and late career (age 35+) | 47.0 |
| All bachelor’s degree holders | 51.5 |
SOURCE: Committee’s calculations based on the 2013 NSCG.
TABLE 3-16 Most Important Reason for OJT for Engineering Technologists, 2013
| Reason | All Engineering Technologists | Mid- And Late Career (Age 35+) | Early Career (Ages 25-35) |
|---|---|---|---|
|
1. To improve skills or knowledge in current occupation |
56.6% | 56.3% | 61.5% |
|
2. To increase opportunities for promotion or advancement in current occupation |
9.2% | 8.4% | 12.5% |
|
3. For licensure/certification in your current occupation |
9.1% | 8.6% | 4.1% |
|
4. To facilitate change to a different occupation |
0.5% | 0.6% | 0.3% |
|
5. Required or expected by employer |
22.2% | 23.6% | 18.9% |
|
6. For leisure or personal interest |
0.8% | 0.4% | 2.2% |
|
7. Other |
1.7% | 2.2% | 0.4% |
SOURCE: Committee’s calculations based on the 2013 NSCG.
engineering technologists. These training rates are much higher than are estimates of OJT for all Americans but are comparable to some estimates of the incidence of training for bachelor’s degree holders.14Lerman and colleagues (2004) note that higher levels of training for bachelor’s degree holders may indicate that a worker’s existing stock of human capital raises the benefits of subsequent training. This interpretation suggests that ET education not only imparts important technical skills and competencies, but also helps graduates become better learners and critical thinkers.
NSCG also asks respondents to identify the most important reason for their training (Table 3-16). Early career engineering technologists (ages 25 to 35) were more likely than were mid- and late career engineering technologists (35 years or older) to cite improving skills or knowledge as a driving motivation. They were less likely than were mid- and late career engineering technologists to report having taken training to please their employer. These data may not only reflect objective differences in reasons for training but also indicate changing attitudes toward and enthusiasm for training as workers age.
___________________
14 These estimates vary widely, typically depending on what the question asked on the survey implies about the intensity of training.
COMMUNITY COLLEGE EXPERIENCES
A substantial share of recent ET graduates has prior experience in the community college system (Table 3-17). In the B&B survey, graduates are asked if (1) they have ever enrolled at a community college and (2) they have ever taken a course at a community college. That a larger share of survey-takers responds affirmatively to the latter question than the former may reflect confusion about what it means to be enrolled in a program of study. Regardless of this possible confusion, these data indicate a high prevalence of community college attendance among ET graduates. Greater than 44 percent of graduates in the B&B sample claimed that they had enrolled in a community college before attending a 4-year degree program. This compares to 27 percent of all engineering graduates and almost 35 percent of all graduates. However, given the small size of the B&B sample of ET graduates, these comparisons must be interpreted cautiously.
Because of their accessibility and relatively low cost compared with 4-year institutions, community colleges are potentially important institutions not only for educating 2-year ET technicians but also for providing a jump start to students who intend to earn a 4-year ET degree. The role of community colleges in the ET education pathway is evident in some of the project’s survey results, discussed later in this chapter.
CONNECTIONS TO PreK-12 EDUCATION
The IPEDS data cover only the postsecondary education system and do not provide insight into pre-college educational experiences related to ET. Such experiences may provide an important introduction and inspiration for related postsecondary and OJT. Data on high school coursework in engineering-related subjects is not readily available in standard educational
TABLE 3-17 Community College Experience of Engineering Technologist Graduates
| Weighted Number | Weighted Percentage | |
|---|---|---|
| Ever enrolled at a community college | 6,714 | 44.34 |
| Ever took a course at a community college | 7,698 | 50.84 |
| Ever enrolled or took a course at a community college | 8,592 | 56.74 |
NOTE: Committee’s calculations are based on the B&B 2008/2009 survey.
TABLE 3-18 Percentage of Public High School Graduates Earning Various Numbers of Credits in CTE Fields, Year
| Engineering Technology | Any Occupational Education CTE Field | All CTE Fields | |
|---|---|---|---|
| Any credits | 11.1 | 84.9 | 94.16 |
| At least 1 credit | 8.3 | 76.1 | 88.46 |
| At least 2 credits | 2.2 | 53.2 | 70.86 |
| At least 3 credits | 0.9 | 36.2 | 54.56 |
| At least 4 credits | 0.4 | 23.8 | 40.26 |
| At least 5 credits | 0.2 | 15.5 | 28.6 |
SOURCE: Adapted from NCES, 2009a.
and workforce surveys, which tend to focus on postsecondary education. However, it is available in the NCES’ series of Career/Technical Education (CTE) tables.
Table 3-18 shows the share of public high school graduates earning various minimum numbers of credits in ET, in any occupational education CTE field, and in all CTE fields (occupational and nonoccupational training combined). About two-thirds of US high school students attend or have access to CTE schools (NCES, 2009a). Only 11 percent of graduating students take any credits in ET, with the majority of those (8 percent of all students) taking at least one credit.15 However, the incidence of ET education at the high school level declines quickly, with only 2.2 percent of all graduates earning at least two credits and even fewer earning three or more. This decline in credit taking is not as steep for broader measures of CTE course taking, suggesting that many students (including those enrolled in ET classes) have the opportunity to mix many different CTE courses.
Although more than a tenth of students get some exposure to ET in high school, the average number of credits earned by all students is quite low due to the already low number of credits earned by students taking any ET credits. In selected years between 1990 and 2009, no more than 0.2 ET credits were earned by high school graduates on average (Table 3-19). Moreover, the average number of credits declined over this period, in line with the number of any CTE credits earned. Average ET credits and CTE credits declined not only in absolute terms but also as a percentage of all credits earned by high school graduates. Thus, although in the realm of postsecondary education
___________________
15 A credit in this context is the equivalent of a 1-year (two-semester) course, also known as a Carnegie Unit.
TABLE 3-19 CTE Credits Earned by Public High School Graduates
| Engineering Technology | Any Occupational Education CTE Field | All CTE Fields | |
|---|---|---|---|
| Average number of credits earned | |||
| 1990 | 0.2 | 2.7 | 4.2 |
| 2000 | 0.2 | 2.9 | 4.2 |
| 2005 | 0.2 | 2.6 | 4 |
| 2009 | 0.1 | 2.5 | 3.6 |
| Percentage of total credits earned | |||
| 1990 | 0.7 | 11.5 | 18 |
| 2000 | 0.7 | 10.9 | 16.1 |
| 2005 | 0.6 | 9.8 | 14.9 |
| 2009 | 0.5 | 9 | 13.1 |
SOURCE: Adapted from NCES, 2009b.
the center of gravity of ET has shifted to lower institutional levels (certificates rather than 2- or 4-year degrees), this shift is not mirrored in high schools, which are graduating students with fewer ET credits over time.
Prior to 2007, NCES did not have a grouping of CTE coursework called ET. However, a revision that year in the taxonomy the agency uses to analyze CTE offerings established ET as a new category (NCES, 2008). (Data in Table 3-19 reflect the fact that NCES reanalyzed CTE data collected prior to 2007 using categories from the new taxonomy.) Thirty-three of the courses in the new category were moved from the “other technology” area within what had been called “Technology and Communications.” Nine courses were taken from the “drafting/graphics/printing” area within the former “Precision Production” category. Four courses were moved from “computer technology” and two from “other precision production.”
In crafting the taxonomy, NCES says it attempted to align the secondary school categorizations with codes used in the CIP, the coding scheme for postsecondary instructional programs. In the case of ET, NCES aligned the 48 CTE courses with CIP code 15, engineering technologies/technicians. It is worth noting that relatively few of the CTE courses in the ET category include the term “engineering technology” in their titles, hinting again at the confusion surrounding terminology in the field.
Engineering Education in Other Parts of the PreK-12 Curriculum
The CTE statistics do not tell the whole story with respect to the engineering-related experiences of precollege students in the United States. For one thing, the CTE taxonomy excludes programs in technology education/industrial arts. Although much smaller than the teaching force in PreK-12 mathematics and science, the approximately 30,000 teachers certified in technology education (Moye, 2009) have played an important role over the past 15 years in exposing students to engineering ideas and practices. Many of these teachers have been encouraged by the Standards for Technological Literacy: Content for the Study of Technology (ITEEA, 2007) and instructional materials based on the standards, which devote major attention to ideas in engineering and engineering design. The history of technology education/industrial arts echoes some of the same themes that underlie development of ET: that is, the desire of educators to assure students’ learning of theory is complemented with development of practical skills.
The advent of formal engineering education with its emphasis on theoretical mathematics and science was accompanied by a growing recognition that aspiring engineers also needed manual skills. As early as 1870, Calvin M. Woodward, dean of the engineering department at Washington University, instituted shop training for his engineering students after he found that they were unable to produce satisfactory wooden models to demonstrate mechanical principles. John D. Runkle, president of the Massachusetts Institute of Technology, introduced a similar program after seeing demonstrations of Russian manual arts training at the 1876 Centennial Exposition in Philadelphia. Both men believed that shop skills were essential for engineers (Sanders, 2008).
In the 1880s, under the leadership of Woodward and Runkle, Washington University and MIT established schools for intermediate and secondary students that provided a combined program of liberal arts and manual training. . . . By the early twentieth century, there had been a conceptual shift from “manual training” to “industrial arts.” Contrary to what many people assume, industrial arts represented a shift away from vocational training toward general education for all (Herschbach, 2009). Students studied how industry created value from raw materials in the context of the developing industrial society in America. The curriculum required the ability to use industrial tools, equipment, and materials in a laboratory setting, but the “shop experience” was a means to an end, not an end in itself. [Excerpted from NAE and NRC, 2009, pp. 31-32.]
Dozens of curricula at the elementary, middle, and high school levels include an emphasis on engineering (NAE and NRC, 2009). Several of these
have reached national scale, such as Project Lead the Way (www.pltw.org), Engineering is Elementary® (www.eie.org), and Engineering by Design™ (www.iteea.org/EbD/ebd.htm) (Box 3-5). Educators delivering these curricula include not only technology teachers but also science teachers, mathematics teachers, and elementary school generalists. PreK-12 students also are being exposed to engineering through a host of after- and out-of-school experiences, such as those organized by the Girl and Boy Scouts, provided
through robotics competitions such as US FIRST, and programs and exhibits hosted in museums and science and technology centers.
Beyond specific curricula, a number of factors recently have combined to increase the visibility and potential importance of engineering in PreK-12 education. Most notable is the Next Generation Science Standards (NGSS), developed by a consortium of 26 states and coordinated by Achieve, Inc. (NGSS Lead States, 2013). NGSS, which is based on A Framework for K-12 Science Education: Practices, Crosscutting Concepts, and Core Ideas (NRC, 2012), weaves engineering design and a few key engineering concepts into science content and practices, providing an important lever for connecting learning in engineering and science. So far, 16 states and the District of Columbia have adopted the new standards, and nearly twice that many are expected to eventually adopt them. The idea that engineering can provide application opportunities for concepts in science and mathematics is not new, and research suggests that under the right circumstances more integrated forms of education can improve student learning and interest in the STEM subjects (e.g., NAE and NRC, 2014).
In summer 2014, the College Board made public its plans to develop curriculum and associated exams for an AP engineering course. And in spring 2016, the National Assessment Governing Board (NAGB), which oversees the so-called Nation’s Report Card, released results of the first-ever assessment of engineering and technology literacy among a large sample of American 8th graders (NAGB, 2016). Overall, 43 percent of those taking the assessment were rated “proficient” in skills and knowledge related to engineering and technology. However, proficiency rates were much lower for black and Hispanic students than they were for white students. And students in the national school lunch program scored much lower than those receiving free-and-reduced-priced meals. Slightly more than one-half of students reported taking at least one class in school related to the topics covered in the assessment.
Precise, reliable data about the number of US PreK-12 students exposed to meaningful engineering education opportunities are hard to come by. However, the size and growth of the several engineering curriculum projects noted here; the likely need for new engineering-related instructional materials to meet the needs of states implementing NGSS; and the likely advent of an AP engineering course suggest that the trend line slopes upward. The committee is aware that the mere presence of opportunity does not mean PreK-12 students exposed to engineering—through CTE courses, other types of courses, or after-/out-of-school programs—will pursue college coursework or careers in ET. Nevertheless, these precollege experiences are a potentially important part of the pathway into ET.
EDUCATIONAL PATHWAYS
In an effort to better understand the educational choices made by those who pursue degrees in ET, the committee included questions probing this issue in its survey of educational institutions. We also learned something about this choice-making directly from several students and former students who participated in our December 2014 workshop (the agenda appears in Appendix 3C). Combined with the federal data on the prevalence of degree- and certificate-earning described earlier in the chapter, this information provides insights into ET educational pathways.
We asked respondents to our survey to reflect on their incoming student populations and to tell us, in rank order, the top three sources of students for their programs. The responses were weighted (with top rank having more weight than second, and second more than third). The weighted summaries indicate that 2-year programs (N=86) draw primarily from two populations—high school students and adults who are changing careers or adding to their skills—but returning veterans also are a significant source of students for these programs (Figure 3-6). Transfer students from other 2-year, 4-year, or certificate programs are much less prevalent sources. The 4-year programs
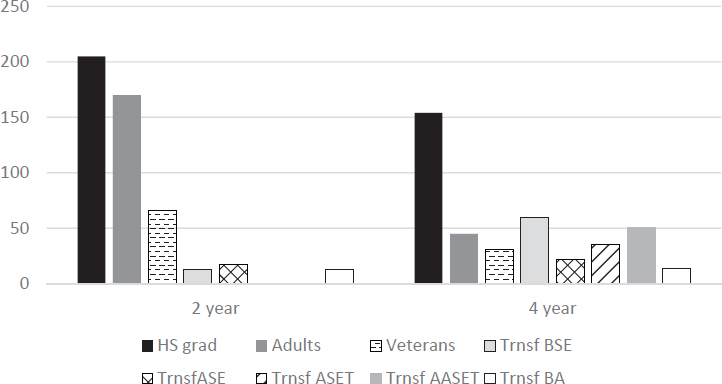
NOTES: Respondents’ first choices were given a score of 3, second choices a score of 2, and third choices a score of 1. Unselected choices received a score of 0. The final reported “score” is the sum of all of these weighted values.
(N=70) draw most heavily on recent high school graduates, with modest contributions from five other categories of students.
To get a sense of the flow of students within and between educational institutions, we also asked respondents for information about transfer options and their views on student mobility. A key enabler of inter-institutional student transfers is the articulation agreement, which establishes rules about such things as the equivalence of course credits. More than 60 percent of respondents indicated they had agreements that allow students to transfer with a 2-year AAS degree in ET to a 4-year BS ET program at another school (Table 3-20). Slightly greater than 40 percent said they had agreements allowing students to transfer to a 4-year ET program with a 2-year AS degree in ET. Smaller percentages of respondents, 28 and 21 percent, respectively, had agreements allowing 2-year AAS and 2-year AS degree recipients to transfer to 4-year engineering programs.
Between 32 and 56 percent of survey respondents indicated that less than 10 percent of their 2-year ET graduates (both AS and AAS) transfer to a 4-year ET or engineering degree program (Figure 3-7). Consistent with the number of programs that allow transfer (Table 3-20), the most prevalent transfer path appears to be between 2-year AAS degree programs and 4-year ET and engineering degree programs. However, the small number of respondents to this item reduces our confidence in the generalizability of the data.
In order to successfully transfer to a 4-year program, a student must have earned enough credits in certain required subjects in the 2-year program. Our survey attempted to ascertain whether and to what degree the earning
TABLE 3-20 Percentage of ET Programs with Articulation Agreements Allowing Students with 2-Year ET Degrees to Transfer to a 4-Year ET or Engineering Program at Another Institution
| Yes | No | N/A | |
|---|---|---|---|
| Transfer with an AAS in Engineering Technology to a BS program in Engineering (N=121) | 28.1 | 53.7 | 18.2 |
| Transfer with an AAS in Engineering Technology to BS program in Engineering Technology (N=134) | 61.9 | 31.3 | 6.7 |
| Transfer with an AS in Engineering Technology to a BS program in Engineering (N=111) | 21.6 | 47.7 | 30.6 |
| Transfer with an AS in Engineering Technology to a BS program in Engineering Technology (N=112) | 40.2 | 40.2 | 196 |
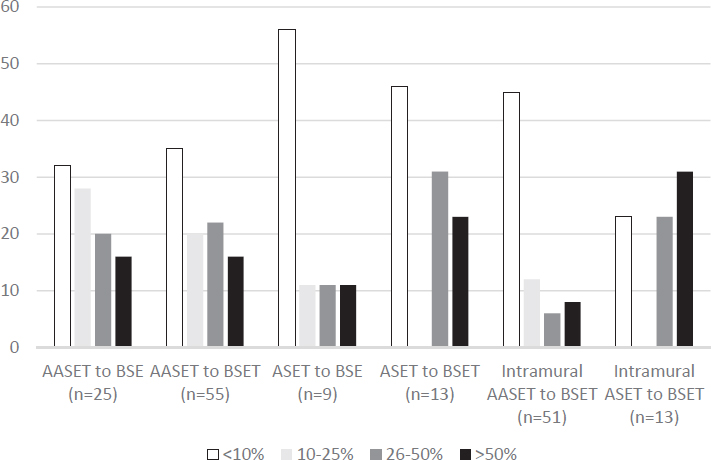
of credits at the 2-year level was hindering transfers. Based on input from committee members with direct experience in ET education, we expected that the credit readiness of AAS degree earners might be less than that of AS degree recipients, because coursework for the former is often not designed to prepare students to continue to a 4-year program.16 For this reason, the survey asked only about the credit readiness of AAS ET graduates. Overall, lack of credits was not a major concern (only 8 of the 50 respondents who answered this item believed credit readiness to be an issue for more than one-quarter of the students desiring to transfer). The primary areas where credits were likely to be insufficient were in mathematics (cited by 23 of 37 respondents) and science (cited by 5).
___________________
16 In hindsight, based on data from the survey (i.e., Figure 3-7), this assumption may not have been correct.
Student Impressions
The committee’s December 2014 workshop included a panel of one current and three former ET students. Two were women, and two were men. Two were white, and two were African American. The current student was completing a 2-year electrical engineering technology program at Camden County College. The two 4-year graduates both received their degrees from Southern Polytechnic State University, now Kennesaw State University (one in electrical engineering technology and the other in mechanical engineering technology), and were early in their work careers. The fourth panelist had a 2-year degree in computer integrated manufacturing engineering technology from Camden County College and had been in the workforce better than 10 years. Although what we heard from these young people can best be thought of as personal stories, not data, we believe their comments are helpful to understanding ET education.
Each of the students came to major in ET from different motivations and encountered different challenges along the way. Common across their stories were ideas of inclusion (being first-generation college or from an underprivileged background), flexibility (ability to work and support their families while going to school), a preference for hands-on learning and practical experiences, and the presence of mentors. The three graduates said that having a strong hands-on component in their college experience enabled them to contribute meaningfully in their jobs very soon after being hired, an idea echoed in some of the data from our survey of employers (discussed in Chapter 4). All agreed that the ET education community could do a better job of publicizing the field to PreK-12 students, to their parents, and to high school guidance counselors.
Connections to Employers
To meet the needs of employers, educational institutions need to have communication channels with them. Our survey respondents use a number of mechanisms, particularly industry advisory boards, to receive input from employers (Figure 3-8). Other popular ways institutions stay connected to employers include interactions resulting from student internships and the relationships between career services personnel on campus and employer representatives. These interactions have led to changes in curricula, in pedagogy, and, to a lesser extent, in institutional policy (Figure 3-9).
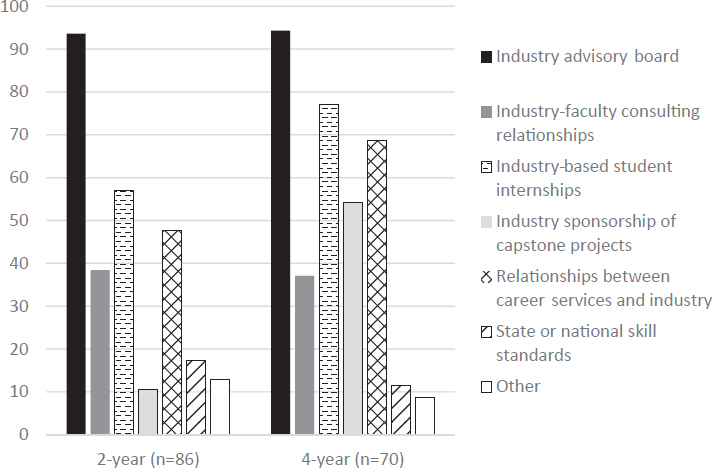
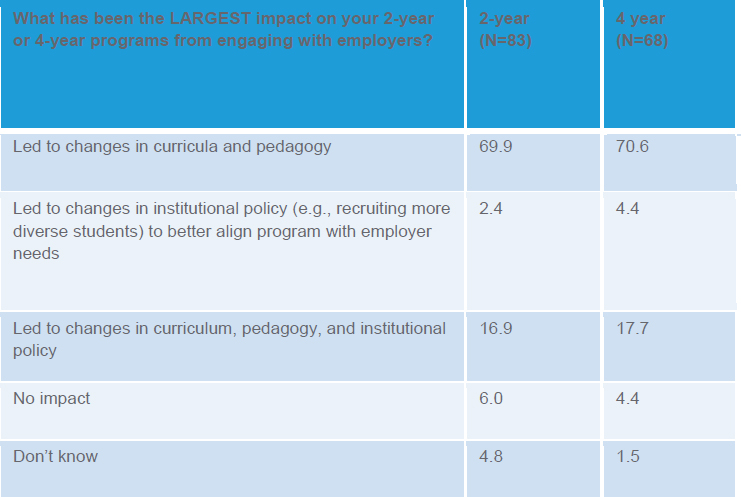
APPENDIX 3A
Methodology for Survey of Engineering Technology Education Programs
The project’s survey of educational programs was fielded in November 2014 by staff within the National Academies Information Technology Services unit using SurveyGizmo software. A link to the survey was sent via email to a list of roughly 650 people whom NAE identified as being in charge of one or more 2-year engineering technology (ET) programs, one or more 4-year programs, or some number of both types of programs. Two follow-up email reminders were sent to encourage participation by nonrespondents.
The list of emails was developed by an NAE college intern, Marthe Folivi, Rippon College, through a multistep process. Ms. Folivi first collected the names of institutions with ET programs accredited by the Accreditation Board for Engineering and Technology (ABET), available on the ABET website. She then compared this list to a longer list of institutions known to award ET degrees (through accredited and nonaccredited programs) derived from the 2012 federal Integrated Postsecondary Education Data System, and she eliminated duplicate institutions. She next went online to each school and attempted to find contact information for the institution’s ET program(s). Programs that had no Internet presence were dropped from the list. So, too, were programs, even if accredited, that did not include the words “engineering” and “technology” in the title. This last step eliminated from consideration nearly 530 institutions from the IPEDS dataset. Once she identified someone who appeared to be in charge of an ET program, Ms. Folivi attempted contact by email (or by phone if no email was available) to confirm involvement with the program (and to get an email contact if none was provided on the website). This step identified a number of programs that were no longer active as well as some for which no contact information could be identified.
In the end, the list of email contacts used in the survey included individuals responsible for 527 4-year and 909 2-year ET programs (Table 3A-1). Because of the committee’s decision to limit participation in the survey to people overseeing programs with the words “engineering” and “technology” in the title, the survey population cannot be considered inclusive of all programs in the United States that award ET degrees (as determined by the Department of Education’s CIP coding system), and so the results may not be generalizable to the entire population of ET programs.
TABLE 3A-1 Number of Schools and Programs Represented by Those Asked to Participate in NAE’s Survey of Engineering Technology Education
| 4-Year ABET | 4-Year Non-ABET | 4-Year Total | 2-Year ABET | 2-Year Non-ABET | 2-Year Total | |
|---|---|---|---|---|---|---|
| Schools | 153a | 82b | 235 | 98 | 372 | 470 |
| Programs | 387 | 140 | 527 | 255c | 654 | 909 |
aOf these ABET-accredited 4-year schools, 27 award both 4- and 2-year engineering technology degrees.
bOf these non-ABET-accredited 4-year schools, 28 award both 4- and 2-year engineering technology degrees.
cSome of these 2-year engineering technology programs are offered by 4-year institutions.
Respondent Demographics
Respondents to the survey on ET education came from institutions located in 38 states and Puerto Rico. The largest numbers of responses were received from people representing institutions in Pennsylvania (12), Michigan (9), and Indiana, New York, and North Carolina (8 each). Eighty-seven percent (121) of survey participants indicated they worked for public institutions, 9 percent (12) for private schools, and 4 percent (6) for for-profit education enterprises.
APPENDIX 3B
NAE Survey Instrument for Engineering Technology Educators
The National Academy of Engineering (NAE) is conducting an online survey of 2- and 4-year engineering technology programs to learn more about the education of workers with engineering-related skills.
The results from this survey will inform an ongoing NAE study funded by the National Science Foundation. Your participation is critically important to the success of the NAE project.
The survey will take approximately 15 minutes to complete, and your participation is entirely voluntary. Your specific responses will be completely confidential, and any information that could be used to identify you will not be shared with NAE staff or the committee that is involved in overseeing the study. In addition, any information that could be used to identify you will be destroyed within one year of the conclusion of the NAE study. Finally, you will not be personally identified in any public reports or presentations of survey results.
By clicking the “I AGREE” button below, you are declaring that you have read and understood the information above and agree to take part in this survey. If you so choose, you may end participation in the survey at any time.
- What is the name of your institution? [text field]
- In what state is your institution located? [drop-down menu]
- Which of the following best characterizes your institution?
- Public (state- or local-government supported)
- Private
- For profit
- Which of the following types of academic credit is granted by the engineering technology program(s) you are responsible for? Check all that apply. [respondents who oversee both 2-year and 4-year programs will hereafter answer some questions twice, once for the 2- and once for the 4-year programs]
- Bachelor of Engineering Technology, 4-year degree
- Associate of Applied Science (AAS) in engineering technology, 2-year degree
-
- Associate of Science (AS) in engineering technology, 2-year degree
- Certificates in engineering technology, less than a 2-year degree
- From the list below, please select the name(s) that best describes the [2-year and/or 4-year] engineering technology program(s) you are responsible for. Check all that apply. [list is at Appendix]
- What type of accreditation, if any, does/do the [2-year and/or 4-year] program(s) you are responsible for currently have?
- ABET (Accreditation Board of Engineering and Technology)
- ATMAE (Association of Technology, Management, and Applied Engineering)
- ACCE (American Council for Construction Education)
- Other
- Not accredited
- Don’t know
- From the list below, please indicate the FIRST, SECOND, AND THIRD LARGEST category of students entering your [2-year and/or 4-year] program
- Recent high school graduates
- Returning military/veterans
- Adults changing careers or “up skilling” to increase earnings
- [This choice only for those with 4-year programs]Recent graduates of a 2-year AAS engineering technology degree program
- [This choice only for those with 4-year programs]Recent graduates of a 2-year AS engineering technology degree program
- Recent recipients of one or more certificates in an engineering technology field
- students from 4-year (BS) engineering programs
- Transfer students from 2-year (AS) engineering programs
- Transfers students from non-engineering 4-year degree programs
- Other
- Does your school have arrangements (e.g., articulation agreements) with other academic institutions that allow students any of the following transfer options (check all that apply) [answer choices a-d have yes/no options]:
-
- Transfer with an AAS in Engineering Technology to a BS program in Engineering
- Transfer with an AAS in Engineering Technology to BS program in Engineering Technology
- Transfer with an AS in Engineering Technology to a BS program in Engineering
- Transfer with an AS in Engineering Technology to a BS program in Engineering Technology
- Other
- For students who graduate with a [degree type from item chosen in Q8], what percentage do you estimate transfer to another institution to obtain a [degree type from item chosen in Q8]? [NOTE: This question will need to be asked more than once for respondents who select more than one “yes” in Q8; someone who answers “no” to all choices in Q8 will skip Q9.]
- Less than 10%
- Between 10% and 25%
- Between 26% and 50%
- More than 50%
- Don’t know
- [only for survey respondents who check 4b or 4c] For students who graduate with an [AS or AAS] degree in engineering technology, what percentage do you estimate transfer within your institution to obtain a 4-year degree in engineering technology?
- Less than 10%
- Between 10% and 25%
- Between 26% and 50%
- More than 50%
- Transfer is not an option
- Don’t know
- [only for respondents who check 4b; goes to Q12 except if answers “Transfer is not an option” or “Don’t know,” then goes to Q13] For your students who graduate with an AAS degree in engineering technology, what percentage do you estimate would like to transfer within your institution or to another institution to obtain a 4-year
-
degree in engineering technology but lack course credits in one or more areas to do so?
- Less than 10%
- Between 10% and 25%
- Between 25% and 50%
- More than 50%
- Transfer is not an option
- Don’t know
- For students who graduate with an AAS degree in engineering technology but who lack course credits to transfer within your institution or to another institution to obtain a 4-year degree in engineering technology, which of the following is the most common academic area where credits are lacking?
- Mathematics
- Science
- Social Sciences
- Humanities
- English
- Other
- What do you estimate the rate of employment (full and part time combined) for graduates of your [2-year/4-year] program WITHIN 3 MONTHS OF EARNING A DEGREE? [open response field and “don’t know”]
- Understanding that this will probably be a “best guess,” in which of the following occupational areas do the MAJORITY of graduates from your [2-year and/or 4-year] program(s) work upon leaving your institution?
- Engineering technology or engineering
- Computer and information technology
- Management
- Sales
- Other
- No job (unemployed)
- Don’t know
- Thinking about the supply of those with [2-year and/or 4-year] engineering technology degrees in the areas served by your institution, which of the following characterizes your situation?
- There are more graduates with these degrees than the job market can support
- The number of those with these degrees matches the availability of jobs
- There are not enough graduates with these degrees to fill available jobs
- Don’t know
- To what degree do you believe the skills and knowledge of graduates of your [2-year and/or 4-year] engineering technology program(s) are meeting the needs of employers? 1-Extremely well, 2-Well, 3-OK but could be better, 4-Not so well, 5-Not at all
- Through which of the following mechanisms, if any, does your [2- and/or 4-year] program(s) learn about the needs of employers? Check all that apply.
- Industry advisory board
- Industry-faculty consulting partnerships
- Industry-based student internships
- Industry sponsorship of capstone projects
- Relationships between university career services personnel and industry representatives
- State or national skills standards
- Other
- We have no such mechanisms [goes to Q19]
- Don’t know [goes to Q19]
- What has been the LARGEST impact on your [2-year and/or 4-year] program(s) from engaging with employers?
- Led to changes in curricula and pedagogy
- Led to changes in institutional policy (e.g., recruiting more diverse students) to better align program with employer needs
- Led to changes in curriculum, pedagogy, and institutional policy
- No impact
- Other
- Don’t know
- Which, if any, of the following types of work-related experiences are available to students in your [2- and/or 4-year] program(s)? Check all that apply.
- Apprenticeship (paid vocational programs for certification )
- Internship (paid or unpaid, at an employer, coordinated with the academic curriculum)
- Cooperative work experience (semester- or quarter-based work experience as an alternative to campus-based learning)
- Summer industrial work experiences (paid or unpaid) independent of the college/university
- Other
- Don’t know
- How much, if at all, is the increasing integration of new technologies (e.g., additive manufacturing, advanced digital manufacturing, complex control systems) into the workplace changing the skills/knowledge your students need to acquire in your [2- and/or 4-year] program(s)?
- Substantially
- A fair amount
- Very little
- Not at all
- Don’t know
- In what ways, if at all, is the integration of new technologies in the workplace affecting the employability of graduates from your [2-year and/or 4-year] program(s)?
- Making it much harder for graduates to find work
- Making it much easier for graduates to find work
- No difference in employability
- Don’t know
- Does your institution offer 4-year degrees in engineering? [Y/N; if yes, to Q23; if no, to Q24]
- Do faculty in engineering technology and in engineering ever teach courses in the other program area (i.e., an engineering faculty member teaches a course to engineering technology students or an engi-
-
neering technology faculty member teaches a course to engineering students)? [Y/N]
- In your opinion, which of the following statements best characterizes the difference between the skills/knowledge of graduates with 4-year degrees in engineering technology and 4-year degrees in engineering?
- Engineering technology graduates are better prepared to do applied work, while engineering graduates have more preparation in higher-level science and mathematics.
- Engineering technology graduates are better prepared to do applied work, while engineering graduates are better prepared to do engineering design.
- Engineering technology and engineering graduates are essentially the same.
- There is too much variability among engineering technology and engineering programs to answer this question.
- Don’t know
- What challenges and opportunities does your institution face with respect to your [2-year/4-year] engineering technology program? (200 words maximum)
- What information, if any, would you like the committee overseeing this project to have that was not covered in the previous survey questions? (200 words maximum)
APPENDIX 3C
National Academy of Engineering Workshop on Engineering Technology Education
December 2, 2014
National Academy of Science Building
Washington, DC
| 8:00 a.m. | Registration and Continental Breakfast |
| 8:30 a.m. | Welcome and Comments from the Sponsor |
| Ron Latanision, Exponent, Inc., and Katharine Frase, IBM, NAE Committee on Engineering Technology Education | |
| Susan Singer, Division of Undergraduate Education, Directorate for Education and Human Resources, National Science Foundation | |
| 8:45 a.m. | Keynote Address: |
| Paul Tonko (D-NY), US House of Representatives | |
| 9:30 a.m. | Break |
| 9:45 a.m. | Employment and Education of Engineering Technology Students |
| Daniel Kuehn, American University | |
| 10:15 a.m. | Panel: Student Reflections on Engineering Technology Education |
| Chris Cutter, Novellis, Kennesaw, GA | |
| Raven Poux, Camden Community College | |
| Brandi Rearden, Georgia Power | |
| Jason Bauer, Brenner Aero | |
| 11:15 a.m. | Lunch |
| 12:00 p.m. | Guest Speaker: Matthew B. Crawford, author of Shop Class as Soulcraft: An Inquiry into the Value of Work, University of Virginia |
| 12:45 p.m. | The Value Proposition for ET Education: Highlights of an NAE Survey |
| Werner Eikenbusch, BMW (committee); Jeffrey Ray, Western Carolina University (committee) | |
| 1:30 p.m. | Panel: Opportunities and Challenges Facing Employers and Educators |
| George Parker, Associate Technical Fellow, Boeing | |
| Nick Wilson, President, Morrison Container Handling Solutions | |
| Verna Fitzsimmons, Kansas State University | |
| Douglas H. Handy, Coordinator, Office of Career & Technology Education, Baltimore County Public Schools | |
| 2:30 p.m. | Break |
| 2:45 p.m. | Table Discussions |
| 3:30 p.m. | Plenary Reporting |
| 4:15 p.m. | Final Remarks |
| Ron Latanision and Katharine Frase, Co-Chairs | |
| 4:30 p.m. | Adjourn |
REFERENCES
Aring, Monika. 2014. “Innovations in quality apprenticeships for high-skilled manufacturing jobs in the United States at BMW, Siemens, Volkswagen.” International Labour Office. Available online at https://www.bibb.de/dokumente/pdf/innovations_usa_ilo.pdf (December 6, 2016).
Barron, J., M. Berger, and D. Black. 1997. How well do we measure training? Journal of Labor Economics 15(3):507-527.
Cook, K., S. Adam, S. Anderson, D. Goeres, D. Walker, and A. Cunningham. 2010. “Implementing a Formal Collaborative Mechanical Engineering Technology Internship Program with Campus Research Activities.” ASEE 2010 Annual Conference Proceedings, June 22-25, Pittsburgh, PA.
Dave, J., and J. Dong. 2010. “Global Experiential Learning for Engineering Technology Students.” ASEE 2010 Annual Conference Proceedings, June 22-25, Pittsburgh, PA.
Eastman, M., A. Trippe, W. Bankes, J. Lillie, and G. Zion. 2005. “Students Sharing their Co-op Experiences.” ASEE 2005 Annual Conference Proceedings, June 12-15, Portland, OR.
Fain, P. 2015. Student and shipbuilder. Inside Higher Ed. Available online at www.insidehighered.com/news/2015/04/06/old-dominion-us-new-shipbuilding-apprenticeships-come-bachelors-degree (September 8, 2015).
Hawks, V., and M. Miles. 2006. “Technology, Culture, and the Manufacturing Engineer: How Studying SME’s in Cambodia Can Teach Manufacturing Students about Global Enterprise.” ASEE 2006 Annual Conference Proceedings, June 18-21, Chicago, IL.
Herschbach, D.R. 2009. Technology Education—Foundations and Perspectives. Homewood, IL: American Technical Publishers, Inc.
ITEEA (International Technology and Engineering Educators Association). 2007. Standards for Technological Literacy: Content for the Study of Technology. Third Edition. Available online at http://iteea.org/File.aspx?id=67767&v=b26b7852 (June 2, 2016).
Lerman, R., S.-M. McKernan, and S. Riegg. 2004. “The Scope of Employer-Provided Training in the United States” in Job Training Policy in the United States, C. O’Leary, R. Straits, and S. Wandner, eds. W.E. Upjohn Institute: Kalamazoo, MI.
Moye, J.J. 2009. The supply and demand of technology education teachers in the United States. The Technology Teacher 69(2):30-36.
NACE (National Association of Colleges and Employers). 2014. 2014 Internship and Co-op Survey. Bethlehem, PA: National Association of Colleges and Employers.
NAE and NRC (National Academy of Engineering and National Research Council). 2009. Engineering in K-12 Education: Understanding the Status and Improving the Prospects. Washington, DC: The National Academies Press.
NAE and NRC. 2014. STEM Integration in K-12 Education: Status, Prospects, and an Agenda for Research. Washington, DC: The National Academies Press.
NAGB (National Assessment Governing Board). 2016. 2014 Technology and Engineering Literacy (TEL). Available online at www.nationsreportcard.gov/tel_2014/# (May 27, 2016).
NCES (National Center for Education Statistics). 2008. The 2007 Revision of the Career/Technical Education Portion of the Secondary School Taxonomy—Technical/Methodological Report. US Department of Education. NCES 2008-030. Available online at http://nces.ed.gov/pubs2008/2008030.pdf (April 13, 2015).
NCES. 2009a. Career/Technical Education (CTE) Statistics. Table H150. Percentage of fall 2009 public school ninth-graders in 2012 whose school administrators report that students attend or have access to career and technical education (CTE) schools, by family socioeconomic status and school locale: 2012. Available online at http://nces.ed.gov/surveys/ctes/tables/h150.asp (October 13, 2016).
NCES. 2009b. Career/Technical Education (CTE) Statistics. Table H125. Average number of credits and percentage of total credits that public high school graduates earned during high school, by curricular area: 1990, 2000, 2005, and 2009. Available online at http://nces.ed.gov/surveys/ctes/tables/h125.asp (September 4, 2015).
NCES. 2010a. Classification of Instructional Programs (CIP), Engineering Technologies and Engineering-Related Fields. Available online at http://nces.ed.gov/ipeds/cipcode/cipdetail.aspx?y=55&cipid=88137 (June 2, 2016).
NCES. 2010b. Introduction to the Classification of Instructional Programs: 2010 Edition (CIP-2010). Available online at http://nces.ed.gov/ipeds/cipcode/Files/Introduction_CIP2010.pdf (April 2, 2015).
NCES. 2014. 2013-14 Integrated Postsecondary Education Data System (IPEDS) Methodology Report. NCES 2014-067. Available online at http://nces.ed.gov/pubs2014/2014067.pdf (April 2, 2015).
NGSS Lead States. 2013. Next Generation Science Standards: For States, By States. Washington, DC: The National Academies Press.
NRC (National Research Council). 2012. A Framework for K-12 Science Education: Practices, Crosscutting Concepts, and Core Ideas. Available online at www.nap.edu/catalog/13165/a-framework-for-k-12-science-education-practices-crosscutting-concepts (February 23, 2015).
NRC. 2014. The Growth of Incarceration in the United States: Exploring Causes and Consequences. Table 2-2. Washington, DC: The National Academies Press.
Porter, J., and J. Morgan. 2006. “Engineering Entrepreneurship Educational Experience (E4) Initiative: Bringing Entrepreneurship to the Undergraduate Classroom.” ASEE 2006 Annual Conference Proceedings, June 18-21, Chicago, IL.
Sanders, M. 2008. The Nature of Technology Education in the United States. Paper presented at the Annual Conference of the American Society of Engineering Education, Pittsburgh, PA, June 25, 2008.
Schuurman, M., R. Pangborn, and R. McClintic. 2008. Assessing the impact of engineering undergraduate work experience: Factoring in pre-work academic performance. Journal of Engineering Education 97(2):207-212.
US Census Bureau. 2016. Age and Sex Composition in the United States: 2013. Table 1. Population by Age and Sex: 2013. Available online at www.census.gov/population/age/data/2013comp.html (June 2, 2016).
USDOL (US Department of Labor). 2014. TAACCT. Trade Adjustment Assistance Community College and Career Training Grant Program. Grants Awarded. Available online at http://doleta.gov/taaccct/grantawards.cfm (May 27, 2016).
Valentine, M., and C. Richardson. 2010. “A Long-Term Look at the Success of Rochester Institute of Technology Engineering Technology Graduates.” ASEE 2010 Annual Conference Proceedings, June 20-23, Louisville, KY.
Vidalis, S., and J. Cecere. 2008. “A Model Partnership Between Penn State Harrisburg’s Construction Engineering Technology Program and the Construction Industry.” ASEE 2010 Annual Conference Proceedings, June 22-25, Pittsburgh, PA.
White House. 2014. Fact sheet—American job training investments: Skills and jobs to build a stronger middle class. Office of the Press Secretary. Available online at www.whitehouse.gov/the-press-office/2014/04/16/fact-sheet-american-job-training-investments-skills-and-jobs-build-stron (September 3, 2015).


