
5
Quantitative Outcomes
As was noted in Chapter 1 (Introduction), Congress mandated four goals for the Small Business Innovation Research (SBIR) program: (1) to stimulate technological innovation; (2) to use small business to meet Federal research and development needs; (3) to foster and encourage participation by minority and disadvantaged persons in technological innovation; and (4) to increase private-sector commercialization derived from federal research and development (R&D).1 The goals for the Small Business Technology Transfer (STTR) program are to (1) stimulate technological innovation, (2) foster technology transfer through cooperative R&D between small businesses and research institutions, and (3) increase private-sector commercialization of innovations derived from federal R&D.2 This chapter provides an analysis of program outcomes related to the goals of stimulating technological innovation, using small business to meet federal R&D needs, increasing private-sector commercialization of federally funded research,3 and fostering technology transfer through cooperative R&D between small businesses and research institutions. The approach analyzes outcomes as revealed primarily by the performance of Department of Energy (DoE) Phase II SBIR and STTR awards from fiscal year (FY) 2001 to FY 2010 based on data from the 2014 Survey carried out by the National Academies of Sciences, Engineering, and Medicine. The focus is on Phase II awards rather than Phase I awards because Phase II-funded projects are expected to have business plans and to have progressed toward commercialization. (See Box 5-1.)
___________________
1 Small Business Innovation Development Act of 1982, P.L. 97-219, July 22, 1982.
2 Small Business Administration, “About STTR,” https://www.sbir.gov/about/about-sttr, accessed July 9, 2015. Only the first two objectives are embedded in the authorizing legislation, although there is little controversy about the importance of the third, which appears to have been added by the Small Business Administration (SBA) in drafting its governing Policy Guidance for the program.
3 The second SBIR goal of using small businesses to meet federal research and development needs was also discussed to some extent in Chapter 2 (Program Management). The third SBIR goal of fostering the participation of women and minorities is the focus of Chapter 6.
Although DoE was an early proponent of survey-driven outcomes research (in that is started to gather outcomes data via survey some years ago), it has not led the way on tracking outcomes. According to the DoE SBIR/STTR Program Office, DoE has undertaken a twin-track approach to address this: It is building an electronic bridge between the new Small Business Administration (SBA) outcomes database (which is not yet online as of this writing); and it is investing in a new module for its own internal Performance Outcomes Data System (PODS) database, which will address outcomes. DoE currently tracks outcomes from SBIR/STTR awards using a survey administered annually. However, the agency declined to share these data on privacy grounds.
The analysis of outcomes in this report is therefore based primarily on the National Academies’ 2014 Survey. The survey methodology is described in detail in Appendix A, and a description of the survey response rate and non-respondent bias4 is provided in Box 5-1. The overall target population for the survey reported in this chapter is DoE Phase II SBIR and STTR awards made FY 2001-2010,5 and most response data6 is reported at the project level. Some survey questions, however, collect company-level information (such as number of employees). In cases where company information, as opposed to individual project information, was collected, multiple responses from the same company were averaged. Tables and figures with company-level data are marked as reporting the number and percentage of responding companies. Not all survey recipients completed every survey question; as a result, the number of respondents and the number of responding companies varies.7
The survey data have limitations that signal the need for caution. The number of responses—although sufficient to provide useful data—was lower than for some other agencies in part because the number of awards was lower. A higher number of responses may have permitted a more detailed breakdown and cross-tabulation of results. Improved DoE data collection and reporting, and access to those data, could make such analysis feasible. In addition, the 2014 Survey inevitably captured outcomes at a specific point in time: many projects had not yet generated maximum commercial returns—some were just entering their commercialization phase, while other more mature projects may not generate revenues for many years to come. These caveats are important to bear in mind while reviewing the data in this chapter. As a result, the study findings reported in Chapter 8 are based on not only the 2014 Survey data but also the case studies and interviews presented in Chapter 7 (Insights).8
___________________
4 Multiple sources of bias in survey response are discussed in Box A-1 of Appendix A.
5 See Box 5-1 and Appendix A for a description of filters applied to the starting population.
6 Averaged survey response data is reported to the nearest whole number.
7 Not all questions were applicable to all respondents, depending on their answers to particular questions. For example, questions 33-35, which address sales outcomes, were directed only to respondents reporting sales in response to question 32. In other cases, respondents did not answer particular questions. The reasons for these non-responses are unknown.
8 See Appendix A for a detailed description of the survey methodology. The 2014 Survey questionnaire is reproduced in Appendix C.
COUNTERFACTUALS
It is always difficult to tightly determine the impact of a given SBIR or STTR award. Many factors affect the success and failure of companies and projects, and it can be difficult to determine whether a specific factor was a necessary condition for success. Worse still, the large number of factors and the multiple paths to success and failure mean that it is unusual to be able to state with confidence that a particular intervention—in this case an SBIR or STTR award—constitutes a sufficient condition for a project’s success.
Still, it is worth considering what would have occurred absent SBIR or STTR funding from the perspective of those most likely to have detailed knowledge and understanding of their particular projects: the principal investigators (PIs). Accordingly, the 2014 Survey asked a series of questions focused on the likely effect of the absence of SBIR or STTR funding. Of course, asking recipients about the impact of funding raises possible conflicts of interest, so results should be interpreted with some caution. However, these surveyed awards were made no more recently than FY 2010, and many recipients no longer apply for SBIR/STTR funding for a variety of reasons.
The committee acknowledges that the study lacks an experimental or quasi-experiment study design that allows a randomly based comparison of the outcomes of companies that applied and did not apply and of those that received SBIR/STTR awards and those that did not—a design that would allow testing of the award’s impact and the effect of gender and ethnicity on applications, awards, and success rates. As is typically the case in studies of competitively based grant programs, study designs that allowed comparisons only of the application or grant effect was impossible because the populations of applications and non-applications and of award recipient and non-recipients differ in many more ways than whether or not they applied and in whether or not they received an award; also, the program has criteria for making awards that are not randomly based.
Project Go-Ahead Absent SBIR/STTR Funding
One approach has been to ask recipients for their own views on the impact of the program on their project or company. In particular, the survey asked Phase II recipients whether the project would have been undertaken absent SBIR/STTR funding and whether the scope and timing would have been affected. Responses are summarized below in Table 5-1. Ten percent of respondents indicated that the project probably or definitely would have proceeded without program funding. In contrast, 71 percent thought the project probably or definitely would not have proceeded absent SBIR/STTR funding. Eighteen percent were uncertain. These data have interesting wider implications for debates about early-stage funding: they suggest a weakness in the “crowding
TABLE 5-1 Impact of Phase II SBIR/STTR Funding on Project Initiation, Reported by 2014 Survey Respondents
| Question: In your opinion, in the absence of this SBIR/STTR award, would the company have undertaken this project? | Percentage of Respondents | ||
|---|---|---|---|
| Overall | SBIR Awardees | STTR Awardees | |
| Definitely yes | 1 | 1 | 0 |
| Probably yes | 9 | 10 | 3 |
| Uncertain | 18 | 20 | 7 |
| Probably not | 36 | 35 | 42 |
| Definitely not | 35 | 34 | 48 |
| N (Number of Respondents) | 257 | 226 | 31 |
SOURCE: 2014 Survey, Question 24.
out” hypothesis, because awardees—presumably those with the closest knowledge of funding prospects for the project—overwhelmingly believed it unlikely that alternative funding would be found.
The respondents who believed the project probably or definitely would have proceeded without SBIR/STTR funding were asked additional questions about the impact on project scope, duration, and timelines. They responded as follows:
- Project scope would have been narrower (74 percent).9
- Project would have been delayed by more than 6 months (85 percent).10
- Project would have taken longer (75 percent).
Overall, these views indicate that SBIR/STTR funding was important not only for the go/no-go decision but also for the eventual shape and indeed likely impact of the project. Delay in bringing projects to initiation—and hence to the point of potential market entry—can have a disastrous effect, because the window for market entry can be a narrow one.
CHAPTER OUTLINE
The remainder of this chapter is broken into two sections: (1) Quantitative Survey Evidence that DoE Increased Commercialization and (2) Quantitative Survey Evidence that DoE Stimulated Technological Innovation. Commercialization is discussed first. An annex to this chapter, contained in Appendix F of this report, offers an extended analysis of 2014 Survey data.
QUANTITATIVE EVIDENCE THAT DOE INCREASED COMMERCIALIZATION
The committee has adopted a broad view of commercialization, taking it to include additional investments in technology development from outside the SBIR/STTR programs, as well as sales/licensing revenues. In addition, given the long time to market required for many energy technologies, the committee was careful to include a range of benchmarks and metrics, having determined that no single metric can appropriately capture such a broad concept. This analysis focuses first on different ways of measuring sales and other types of commercial revenue as well as further investment. In line with previous studies by the National Academies and consistent practice at all agencies, further investment beyond Phase II is recognized as acknowledgement by third parties that the project has developed technologies of marketable value. For many projects, further investment is moreover required before commercial sales can begin. In the private sector, commercial success over the long term requires profitability.
___________________
9 2014 Survey, Question 25. N = 27.
10 2014 Survey, Question 26. N = 26.
However, in the short term, the path to successful commercialization can involve many different aspects of commercial activity, from product rollout to licensing to patenting to acquisition. Even during new product rollout, companies often do not generate immediate profits. As noted, the committee uses multiple metrics to measure commercial activity in this report. An extended discussion of approaches to measuring commercialization is contained in Appendix F.
Because the DoE SBIR/STTR programs are not primarily designed to generate technologies for use by DoE itself, markets have to be found outside the agency, which can be a challenge for small innovative firms. It is therefore especially important to capture commercial sales as well as milestones met on the way to these.
Sales
Perhaps the single most used metric for assessing SBIR-type programs is sales by the company and/or licensee of products, processes, or services or other sales incorporating the technology developed during the surveyed project. As discussed in the introduction to this report—and echoing cautions in the 2008 National Academies report on the DoE SBIR program11—overreliance of this particular metric may lead to incorrect conclusions. While sales is a legitimate indicator of progress toward commercialization, it is not a reliable measure that commercial success has occurred. Although this warning is reflected in the wide range of metrics adopted for use in the current assessment, sales remains an important consideration.
Reaching the Market
The first question in this section concerns reaching the market: Did the project generate any sales, and if not, are sales expected (a necessary question given the long cycle time of some projects)? Responses are summarized in Figure 5-1. Overall, 49 percent of respondents reported some sales, and a further 23 percent expected sales in the future. These data are reasonably similar to those generated by the previous survey of SBIR-only DoE awardees by the National Academies in 2005 that was reported in its 2009 report, where 47 percent reported no sales yet, and 16 percent expected sales in the future.12
___________________
11National Research Council, An Assessment of the SBIR Program at the Department of Energy, Washington, DC: The National Academies Press Press, 2008.
12National Research Council, An Assessment of the SBIR Program at the Department of Energy, p. 143.
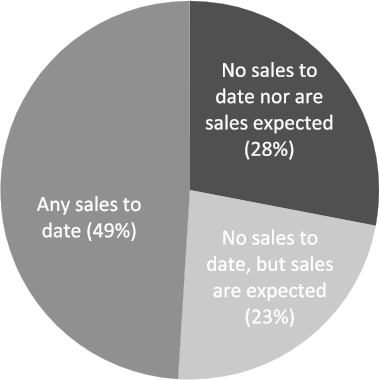
NOTES: N (Number of Respondents) = 251. See Table F-1 for details.
SOURCE: 2014 Survey, Question 32.
Amount of Sales
Simply identifying the percentage of projects reaching the market is an important metric to signal that commercial activity has begun, but, as was noted previously, it is not sufficient to indicate commercial success. It is also necessary to understand the volume and distribution of sales, and how sales revenue relates to the costs incurred in generating the revenue.
The 2014 Survey asked those who reported some sales of the technology developed for the project to also report the amount of sales, grouped into ranges. As shown in Figure 5-2, of the 49 percent of respondents reporting sales, most were at the lower end of the scale: 55 percent or respondents reported less than $500,000. Two percent reported sales of at least $20 million, while about 7 percent reported sales between $5 million and $20 million.
Markets by Sector
For those projects with sales, the 2014 survey also asked respondents about the market sectors in which sales were made. As shown in Figure 5-3, respondents reported an average of 39 percent of project sales to the domestic private sector, followed by export markets (24 percent). An average of six percent of reported project sales were to DoE (see Figure 5-3).
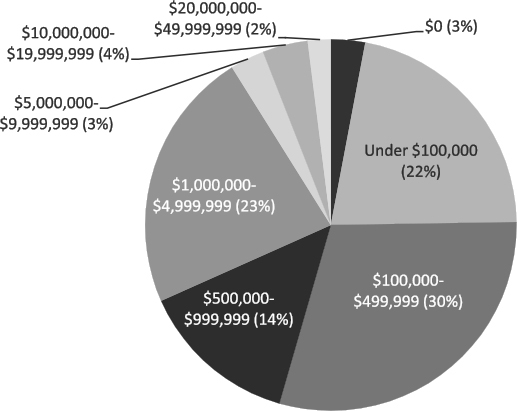
NOTES: N (Respondents Reporting Sales) = 118. See Table F-2 for details.
SOURCE: 2014 Survey, Question 34.
Further Investment
The ability of SBIR/STTR projects and companies to attract further investment has traditionally been a defining metric for SBIR/STTR commercialization potential.13 There has also been interest in the sources of additional funding for high-tech innovation. While the United States has historically been a leader in venture capital and angel investment,14 these are not the only or even the primary sources of additional investment funding for DoE SBIR/STTR projects.
Overall, 78 percent of survey respondents indicated that their project received additional investment in the technology related to the surveyed project (see Table 5-2). As shown in the previous National Academies survey, there is substantial skew in the amount of additional funding received. Table 5-2 shows the amount of funding received. About 59 percent of all projects reported receiving some but less than $1 million in additional investment, while 1 percent reported receiving $5 million or more.
___________________
13National Research Council, An Assessment of the SBIR/STTR Program, Washington, DC: The National Academies Press, 2008.
14 Ernst and Young, “Venture Capital Insights 4Q14,” p.5.
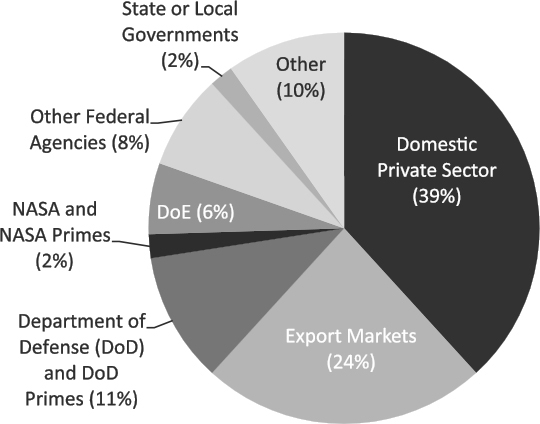
NOTES: N (Respondents reporting sales) = 120. See Table F-3 for details. For this question, each respondent reported a percentage distribution. The values above are calculated by deriving the mean value for all the responses for each category.
SOURCE: 2014 Survey, Question 36.
TABLE 5-2 Additional Investment by Amount to Surveyed Project, Reported by 2014 Survey Respondents
| Amount of Additional Investment (Dollars) | Percentage of Respondents | ||
|---|---|---|---|
| Overall | SBIR Awardees | STTR Awardees | |
| None (0) | 22 | 23 | 15 |
| 1-99,999 | 25 | 23 | 37 |
| 100,000-499,999 | 23 | 24 | 19 |
| 500,000-999,999 | 11 | 11 | 15 |
| 1,000,000-4,999,999 | 18 | 18 | 15 |
| 5,000,000-9,999,999 | 1 | 1 | 0 |
| 10,000,000-19,999,999 | 0 | 1 | 0 |
| 20,000,000-49,999,999 | 0 | 0 | 0 |
| 50,000,000 or more | 0 | 0 | 0 |
| Mean (Thousands of Dollars) | 814 | 836 | 630 |
| Median (Thousands of Dollars) | 300 | 300 | 50 |
| N (Number of Respondents) | 245 | 218 | 27 |
SOURCE: 2014 Survey, Question 30.
The 2014 Survey asked respondents to report all sources of additional project investment. Table 5-3 shows the breakout of reported sources. Of those projects that received additional investment from U.S. sources, 39 percent received private-sector funding, with 2 percent having received venture capital funding, and 5 percent having received angel or other private equity funding. Twenty percent received strategic investments from U.S. partners. Forty percent of respondents reported receiving further investment from non-SBIR/STTR federal sources, which would include additional sources of funding within DoE. Twenty percent of respondents reported receiving additional project investment from other external sources, including 12 percent from state and local governments and 9 percent from research institutions. Overall, the most utilized funding source was the company itself (reported by 75 percent of respondents).
QUANTITATIVE EVIDENCE THAT DOE STIMULATED TECHNOLOGICAL INNOVATION
One of the congressionally mandated objectives for the SBIR and STTR programs is to “stimulate technological innovation.” Evidence for this
TABLE 5-3 Sources of Further Project Investment, Reported by 2014 Survey Respondents
| Source | Percentage of Respondents | ||
|---|---|---|---|
| Overall | SBIR Awardees | STTR Awardees | |
| Non-SBIR/STTR Federal Funds | 40 | 40 | 39 |
| Private Investment: U.S. Sources | 39 | 41 | 23 |
|
Venture capital (VC) |
2 | 2 | 0 |
|
U.S. angel funding or other private equity investment (not VC) |
5 | 6 | 0 |
|
Friends and family |
3 | 3 | 0 |
|
Strategic investors/partners |
20 | 20 | 15 |
|
Other sources |
15 | 17 | 8 |
| Foreign Investment | 2 | 2 | 0 |
|
Financial investors |
1 | 1 | 0 |
|
Strategic investors/partners |
2 | 2 | 0 |
| Other External Sources | 20 | 17 | 39 |
|
State or local governments |
12 | 11 | 19 |
|
Research institutions (such as colleges, universities or medical centers) |
9 | 8 | 19 |
|
Foundations |
0 | 0 | 0 |
| Internal Sources | 75 | 75 | 73 |
|
Your own company (Including money you have borrowed) |
72 | 72 | 73 |
|
Personal funds |
8 | 9 | 4 |
| N (Number of Respondents Reporting Additional Investment Funding) | 195 | 169 | 26 |
NOTE: Respondents were asked to select applicable categories and subcategories of sources of further investment.
SOURCE: 2014 Survey, Question 31.
includes linkages to universities, publication of articles in peer-reviewed journals, patent filings, and evidence that SBIR and STTR foster innovative companies. A review of patents and peer-reviewed articles offers a useful starting point.
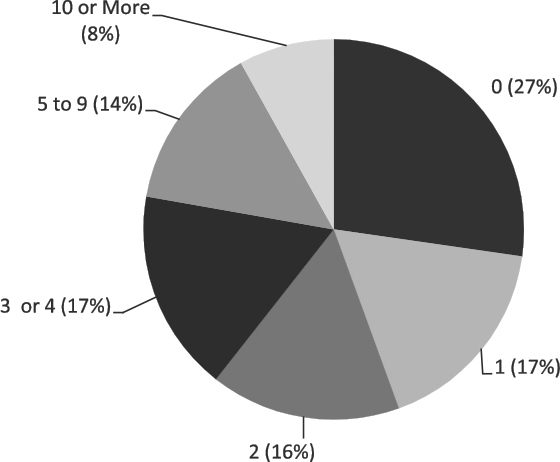
Figure 5-4 shows the number of patents reported by respondents to the 2014 Survey that were related to all SBIR/STTR awards (not just DoE SBIR or STTR awards) received by the responding company. Sixty-eight percent of responding companies received at least one such patent, and 17 percent of responding companies received 10 or more such patents. Thirty-two percent received none. With regard to patents related to the specific project being surveyed, 39 percent of respondents reported at least one patent related to the surveyed project, and 2 percent reported the receipt of five or more related patents (see Table 5-4).
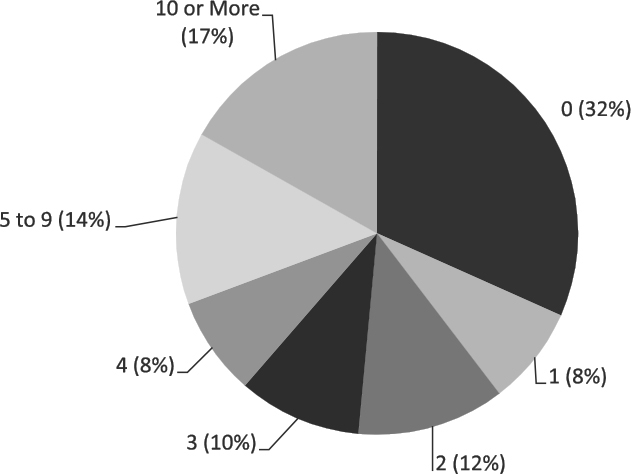
NOTE: In cases where company information, as opposed to individual project information, was collected, multiple responses from the same company were averaged.
SOURCE: 2014 Survey, Question 12.
TABLE 5-4 Number of Patents Received Related to Surveyed Project, Reported by 2014 Survey Respondents
| Percentage of Respondents | |||
|---|---|---|---|
| Overall | SBIR Awardees | STTR Awardees | |
| 0 | 61 | 62 | 55 |
| 1 | 22 | 21 | 36 |
| 2 | 8 | 9 | 0 |
| 3 or 4 | 7 | 7 | 9 |
| 5 to 9 | 1 | 1 | 0 |
| 10 or more | 1 | 1 | 0 |
| 1 or more | 39 | 38 | 45 |
| N (Number of Respondents) | 206 | 184 | 22 |
SOURCE: 2014 Survey, Question 38.
In addition to patents, the survey asked about articles in scientific publications. Interviews with company executives such as those of Calabazas Creek Research and Physical Sciences indicated that, for many companies, even though technical knowledge and trade secrets are very important, the company strongly supported peer-reviewed publishing (see Appendix E). In part, this was seen as a means of signaling and marketing among their peers, both for eventual products and as a means to attract talent. Seventy-three percent of all 2014 Survey respondents reported that at least one article had been published in a scientific publication for the technology developed as a result of the surveyed project. Thirty-nine percent reported at least three such articles. See Figure 5-5.
Links to Research Institutions
Another mechanism for knowledge transfer is the development of links between SBIR/STTR companies and their projects on the one hand and research institutions (RIs) on the other. Half of respondents reported some connection to an RI (as did nearly all STTR respondents). Thirty-five percent of all projects reported that an RI was a subcontractor on the project. Many respondents reported that RI faculty worked on the project (29 percent used faculty as consultants), while smaller percentages reported that the technology was originally developed at and/or licensed from the RI. The responses reflected substantial differences between STTR and SBIR projects as STTR projects on average worked much more closely with an RI on almost all the dimensions measured by the survey (see Table 5-5).
Respondents were also asked to identify the research institutions with which they worked in various capacities on the surveyed project. Overall, 149 different RIs were identified for 116 projects. See Appendix D for the complete list of RIs that were indicated by respondents.
NOTE: N = 210 Respondents.
SOURCE: 2014 Survey, Question 38.
TABLE 5-5 Connections to Research Institutions (RI), Reported by 2014 Survey Respondents
| Percentage of Respondents | |||
|---|---|---|---|
| Overall | SBIR Awardees | STTR Awardees | |
| The PI for this project was at the time of the project an RI faculty member | 1 | 0 | 10 |
| The PI for this project was at the time of the project an RI adjunct faculty member | 2 | 2 | 3 |
| Faculty member(s) or adjunct faculty member(s) worked on this project in a role other than PI | 29 | 26 | 47 |
| Graduate students worked on this project | 25 | 21 | 50 |
| The technology for this project was licensed from an RI | 5 | 4 | 13 |
| The technology for this project was originally developed at an RI by one of the participants in this project | 9 | 6 | 30 |
| An RI was a subcontractor on this project | 35 | 29 | 77 |
| None of the above | 50 | 57 | 7 |
| N (Number of Respondents) | 244 | 214 | 30 |
SOURCE: 2014 Survey, Question 71.
Finally, 68 percent of companies responding to the survey indicated that at least one founder had an academic background.15 Thirty-one percent of responding companies reported that at least one founder was most recently employed by a research institution.16
Box 5-2 describes a workshop that the committee convened to address a range of issues related to university-SBIR linkages. Linkages to university is an important component in examining evidence that DoE “stimulated technological innovation,” a goal of both the SBIR and STTR programs. University connections can also benefit SBCs by giving access to technical expertise.
Fostering Innovative Companies
Although the effect of SBIR/STTR funding on the company is not directly included in the congressional objectives for the program, helping small companies to become self-sufficient (and in some cases to grow rapidly) has implications for program impacts and is therefore included.
Small high-tech companies are often fluid in organization, and the 2014 Survey found that many participating companies had changed structurally in recent years. Thirty percent had established strategic partnerships with major players, 19 percent had spun-off at least one company, and 8 percent had been acquired by or merged with another firm.17
Ideally, companies that receive SBIR/STTR funding become more stable and develop non-SBIR/STTR-related contracts over time. This appears to be the case for DoE SBIR/STTR companies as dependence on SBIR/STTR is limited. The survey asked respondents to estimate how much of their company’s total R&D effort (defined as man-hours of work for scientists and engineers) was devoted to SBIR- or STTR-funded projects. Overall, 40 percent of respondents indicated that 10 percent or less of the compay’s total R&D effort was devoted to SBIR or STTR activities during the most recent fiscal year (at the time of the survey), and 23 percent indicated greater than one-half.18 This picture is reinforced by data on sources of company revenues. Twenty-seven percent of responding companies reported that zero percent of company revenue was was SBIR/STTR funding for the most recent fiscal year at the time of the survey, while 24 percent reported that more than one-half of the company’s revenues consisted of SBIR/STTR funding for the most recent fiscal year.19
The survey also asked about the overall impact of SBIR/STTR on the company. As Figure 5-6 shows, 61 percent saw a highly positive or transformative effect, and another 35 percent reported a positive impact. Only two respondents reported a negative impact.20
___________________
15 See Table F-15.
16 See Table F-16.
17 2014 Survey, Question 11. N = 131 (companies).
18 2014 Survey, Question 10. N = 128 (companies).
19 2014 Survey, Question 9. N = 129 (companies).
20 See Table F-22.
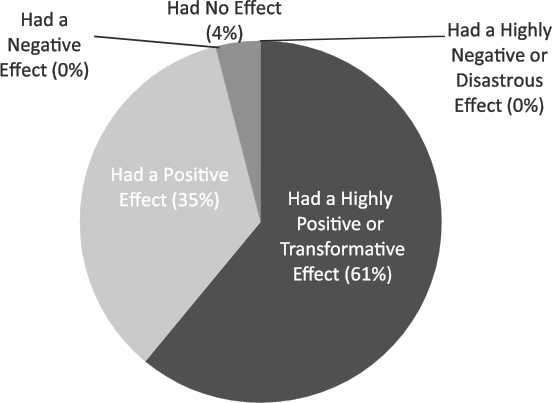
SOURCE: 2014 Survey, Question 57. N = 248.


