
6
Participation of Women and Minorities
One of the four primary Congressional objectives for the Small Business Innovation Research (SBIR) program is “to foster and encourage participation by minority and disadvantaged persons in technological innovation.”1 The 1992 reauthorization reaffirmed that the purpose of the SBIR program is “to improve the Federal Government’s dissemination of information concerning the Small Business Innovation Research Program, particularly with regard to program participation by woman-owned small business concerns and by socially and economically disadvantaged small business concerns.”2 Within the SBIR program, disadvantaged persons are defined as those who are either women or are members of a disadvantaged group as identified by the Small Business Administration (SBA).3
The committee concluded that these traditional interpretations are inadequate for two reasons. First, the SBA definition of minority includes Asian Americans, which has the effect of obscuring what are extremely low levels of participation by African Americans, Hispanic Americans, and Native Americans, and relatively high levels of participation by Asian Americans. In the committee’s related report on the Small Business Technology Transfer (STTR) program, it recommends that the SBA change its definitions to address congressional intent with regard to minorities (See Box 6-1).4 Second, company ownership is too narrow a metric to gauge overall participation. Although participation can encompass more than ownership, available agency data did not support detailed analysis of participation of disadvantaged persons beyond
___________________
1 P.L. 97–219, § 2, July 22, 1982, 96 Stat. 217.
2 P.L. 102-564, October 28, 1992, 106 STAT 4249.
3 For the SBA definition of disadvantaged persons, see https://www.sba.gov/category/navigationstructure/eligibility-requirements. Accessed August 4, 2015.
4 See Finding D-2 in National Academies of Sciences, Engineering, and Medicine, STTR: An Assessment of the Small Business Technology Transfer Program, Washington, DC: The National Academies Press, 2016.
company ownership. The National Academies of Sciences, Engineering, and Medicine5 2014 Survey of Department of Energy (DoE) SBIR and STTR
___________________
5 Effective July 1, 2015, the institution is called the National Academies of Sciences, Engineering, and Medicine. References in this report to the National Research Council or NRC are used in an historic context identifying programs prior to July 1, 2015.
awardees enabled a disaggregation of participants by minority status as well as information on participation of women and minorities as principal investigators in addition to company owners.
To analyze the role of women and minorities in DoE’s SBIR/STTR program, the committee relied primarily on three sources: (1) agency data, which is comprehensive; (2) 2014 Survey data, which probes awardee demographics and adds data about principal investigators; and (3) a workshop convened by this committee on the issue of diversity. The committee finds that current efforts have not been sufficient to meet the Congressional objective.
DEFINING THE ISSUE
The committee recognizes that small businesses often introduce the radical ideas that can transform industries and markets, and that mobilizing all skilled individuals, regardless of race/ethnicity or gender, strengthens the economy and the nation. To this end, the committee convened a workshop to draw attention to participation of women, minorities, and both older and younger scientists, engineers, and entrepreneurs in the SBIR and STTR programs and to identify mechanisms for improving their participation rates.6 The workshop also drew attention to the fact that improving the participation of women and minorities in the SBIR and STTR programs is a part of a broader national challenge of promoting the effective participation of women and minorities in science, technology, engineering, and mathematics (STEM) (see Box 6-2).
Participants in the workshop examined broad demographic trends in the science and engineering workforce and statistical measures from the SBIR program for women and minorities, and searched for pragmatic solutions to boost SBIR and STTR awards to women and minorities. The workshop highlighted the fact that women comprise 51 percent of the U.S. population and 27 percent of STEM graduates, but woman-owned companies have received only about 6 percent of SBIR awards. Hispanics, African Americans, Asian Americans, and Native Americans together comprise 36 percent of the U.S. population and 26 percent of STEM graduates, but less than 10 percent of all SBIR awards.
___________________
6National Academies of Sciences, Engineering, and Medicine, Innovation, Diversity, and the SBIR/STTR Programs. Summary of a Workshop,. Washington, DC: The National Academies Press, 2015, p. 5.
Women and Minority Participation Rates in SBIR/STTR in the Context of their National Participation Rates in Science and Engineering
The biennial report, Women, Minorities, and Persons with Disabilities in Science and Engineering 2015,7 highlights and provides on-going key statistics drawn from a variety of data sources on women, persons with disabilities, and racial and ethnic groups and their representation in science and engineering (S&E) education, employment, and federal contracting. A comparison is provided of their representation in S&E and in the U.S. population, showing that these groups constitute disproportionally smaller percentages of S&E degree recipients, employed scientists and engineers, and federal contract recipients than their representation in the U.S. population. The report concludes that differences in representation in these areas arise from differences in current and past representation in education in science and engineering. It also concludes that differences vary by field of study or by occupation, with women’s participation lowest in engineering (13 percent) and computer and mathematical sciences (26 percent), and much higher in biological and medical sciences (51 percent) and in social sciences (53 percent).8
Although the number of women with full-time, full professorships has more than doubled since 1993, women nevertheless still occupy only about one-fourth of the senior faculty positions at the nation’s colleges and universities. This may partially explain the relatively fewer women than men serving as Principal Investigators in STTR projects. The same explanation may apply to underrepresented minorities, whose share of full-time, full professorships is lower than, and has risen more slowly than the share held by women. When associate professorships in addition to full professorship are taken into consideration, underrepresented minorities occupied on average eight percent of these senior faculty positions at all 4-year colleges and universities.
A comparison of women in the overall workforce and women in the science and engineering (S&E) workforce is depicted in Table 6-1. It shows that women in 2012 comprised 47 percent of the overall workforce but only 27 percent of the S&E workforce.
Table 6-2 shows employed scientists and engineers by ethnicity and race and by sex. More than 70 percent of males and females employed as scientists and engineers in 2013 were white. Overall, Black or African-Americans comprised 0.3 percent, Native Americans, also 0.3 percent, while Hispanic or Latino made up 7.6 percent, and Asians 11.4 percent.
___________________
7 National Science Foundation, National Center for Science and Engineering Statistics, Women, Minorities, and Persons with Disabilities in Science and Engineering 2015, is a biennial report mandated by the Science and Engineering Equal Opportunities Act (Public Law 96-516).
8 National Science Board, Science and Engineering Indicators 2012, NSB 12-01, Arlington, VA: National Science Foundation, 2012.
TABLE 6-1 A Comparison of Women in the Science & Engineering (S&E) Workforce with Women in the Overall U.S. Workforce, 2012
| Composition of Women versus Men | Women | Men |
|---|---|---|
| Percentage of the S&E Workforce | 27 | 73 |
| Percentage of the Overall Workforce | 47 | 53 |
SOURCE: National Science Board, Science and Engineering Indicators 2012, (NSB 12-01), Arlington, VA: National Science Foundation, 2012.
TABLE 6-2 Employed Scientists and Engineers by Ethnicity and Race and Sex 2013
| Percentage of Employed Scientists and Engineers | |||
| Composition of by Ethnicity & Race | Women | Men | Both Sexes |
| Hispanic or Latino | 8.2 | 7.1 | 7.6 |
| Not Hispanic | |||
|
American Indian or Alaska Native |
0.4 | 0.2 | 0.3 |
|
Asian |
10.3 | 12.3 | 11.4 |
|
Black or African American |
7.7 | 5.0 | 6.2 |
|
Native Hawaiian or Other Pacific Islander |
0.3 | 0.3 | 0.3 |
|
White |
71.4 | 73.7 | 72.6 |
|
More than one race |
1.7 | 1.4 | 1.5 |
SOURCE: National Science Foundation, National Center for Science and Engineering Statistics, Scientists and Engineers Statistical Data System (SESTAT), 2013 (preliminary), taken from Table 9-38.
Table 6-3 shows full-time faculty in 4-year institutions who have science, engineering, and health doctorates and, in 2013, received federal support. The highest percent of faculty who received federal support was Asian men (52.5 percent), followed by white men and white women. It shows that underrepresented minorities were less likely than their white and Asian counterparts to have received federal support. Overall, women were less likely to have received federal support than men.
Thus, the problem goes deeper than the SBIR/STTR. Federal agencies operating SBIR/STTR programs face a long-term and pervasive challenge. But, on a positive note, the national participation rates of women and minorities in college and university STEM curricula have been improving and not all fields have low participation rates.
DOE SBIR/STTR APPLICATIONS AND AWARDS DATA
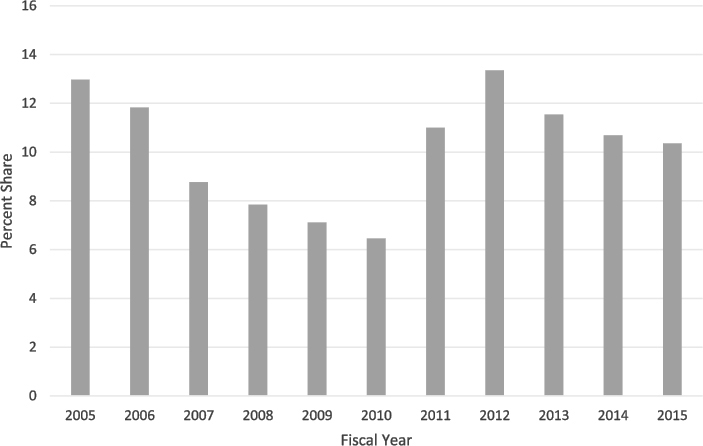
As discussed in Chapter 4, DoE provided data about SBIR and STTR Phase I applications The data show that, similar to other agencies there has been a significant decline in the overall number of applications at DoE. As shown in Figure 6-1, the data also show that the percentage of Phase I applications from woman-owned small businesses (WOSBs) declined quite sharply from FY 2005-2010, then rebounded before declining again from FY 2012-2015. On average, WOSBs accounted for 10 percent of Phase I applications annually.
TABLE 6-3 Full-Time Faculty in 4-Year Institutions Who Have Science, Engineering, and Health Doctorates and Receive Federal Support, 2013
| Race, Ethnicity, and Gender | Percentage that Received Federal Support |
|---|---|
| White women | 40.3 |
| White men | 46.4 |
| Asian women | 39.2 |
| Asian men | 52.5 |
| Underrepresented women | 36.5 |
| Underrepresented men | 36.8 |
SOURCE: National Science Foundation, National Center for Science and Engineering Statistics, Survey of Doctorate Recipients, 2013, Figure 7-D.
SOURCE: DoE SBIR/STTR Program Office.
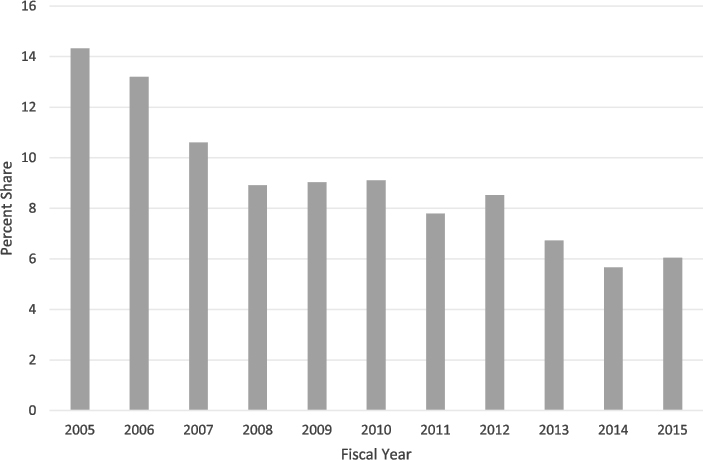
DoE also provided data on Phase I applications from minority-owned small businesses (MOSBs) (using the SBA definition which includes Asian-owned businesses). Figure 6-2 shows that the percentage of Phase I applications coming from MOSBs has declined steadily, from just over 14 percent in FY 2005 to 6 percent in FY 2015, despite the inclusion of Asian-owned businesses with their higher than average application rate.
SOURCE: DoE SBIR/STTR Program Office.
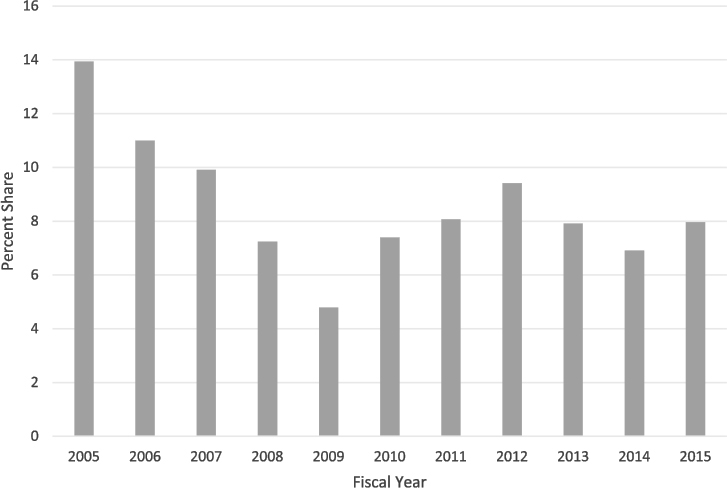
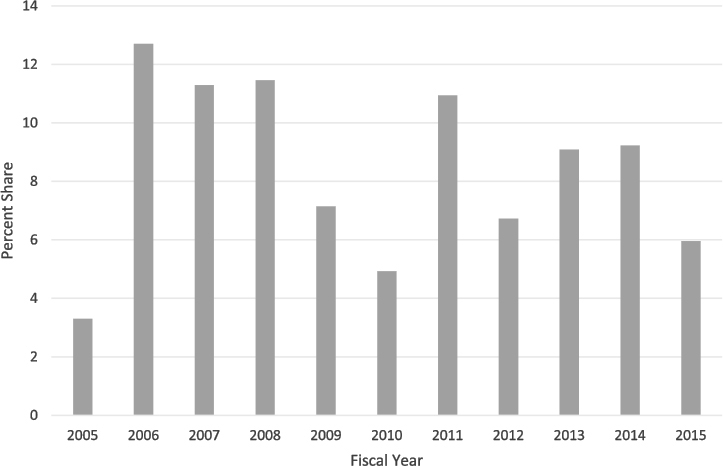
There were low numbers of applications and low numbers of awards. Figure 6-3 shows the percentage of Phase I awards for WOSBs. Their share of all Phase I awards fell from 14 percent in FY 2005 to a low of less than 5 percent in FY 2009 before rebounding somewhat. The WOSB share was 8 percent in FY 2015, and averaged 8.6 percent over the period.
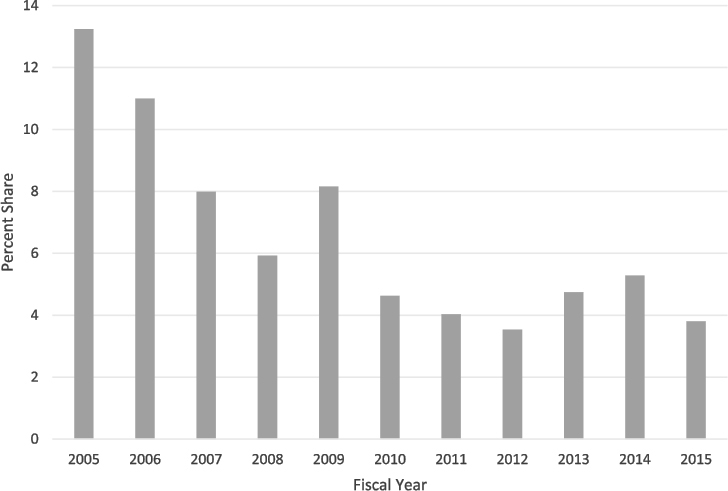
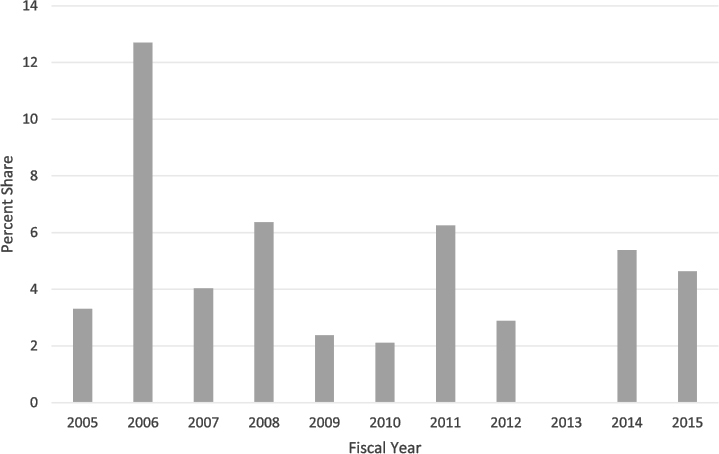
As shown in Figure 6-4, data on MOSB Phase I awards shows that their share has declined across the period, from just more than 13 percent in FY 2005 to a low of 3.5 percent in and 3.8 percent in FY 2015. MOSB averaged 6.6 percent of all Phase I awards during this period.
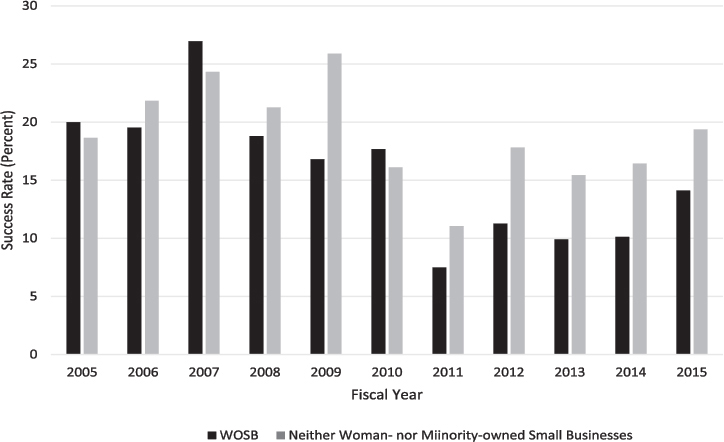
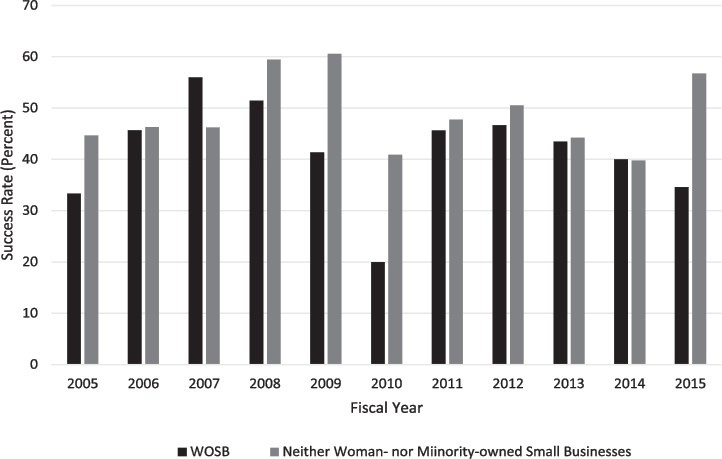
The share of awards is a function of the share of applications and the success rate. Figure 6-5 illustrates the success rate for WOSB Phase I applications at DoE, and shows that in every year except FY 2005, FY 2007, and FY 2010, WOSB success rates were lower than those for companies that were neither woman- nor minority-owned. The average Phase I success rate for WOSB was 15.7 percent, and the average Phase I success rate for firms that were neither woman- nor minority-owned was 18.9 percent.
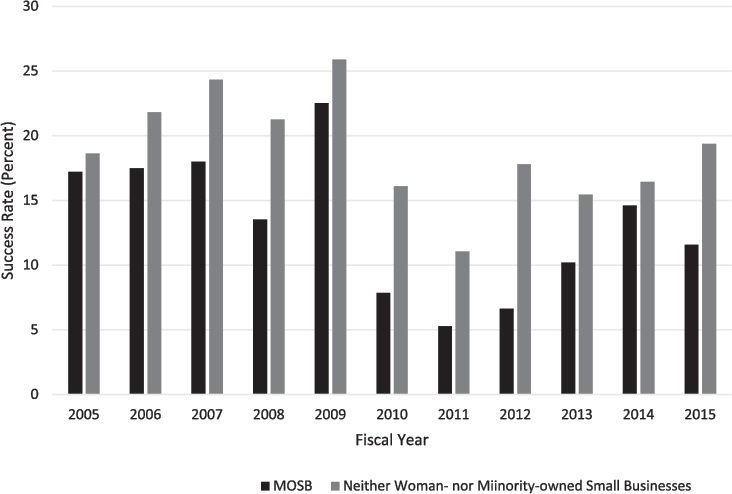
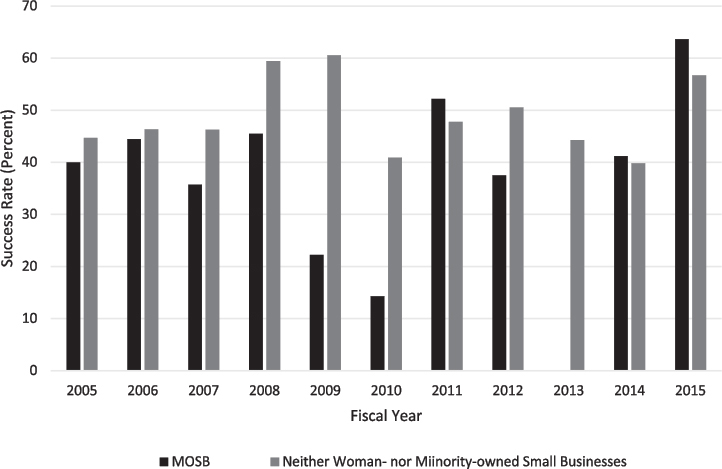
MOSB applicants had even lower Phase I success rates, as Figure 6-6 shows. In this case, MOSB had a lower Phase I success rate than applicants that were neither woman- nor minority-owned in every year across the period. MOSB had an average Phase I success rate of 13.2 percent, and firms that were neither woman- nor minority-owned had an average Phase I success rate of 18.9 percent.
SOURCE: DoE SBIR/STTR Program Office.
SOURCE: DoE SBIR/STTR Program Office.
NOTE: Phase I success rate equals the percentage of Phase I applications that resulted in Phase I awards.
SOURCE: DoE SBIR/STTR Program Office.
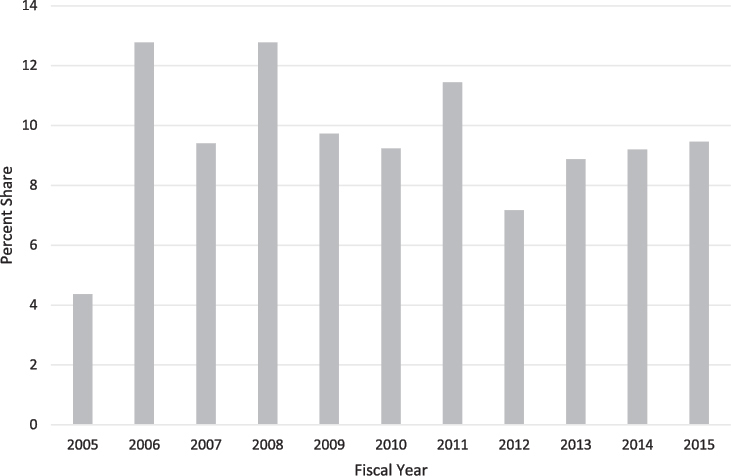
Turning to Phase II, the number of applications is to a considerable extent driven by the number of Phase I awards, as the latter is a prerequisite for a Phase II application. Figure 6-7 shows the WOSB share of Phase II applications. Overall, that share has been a flat 9.5 percent of all Phase II applications across the period. This is slightly higher than the WOSB share of Phase I awards (8.6 percent).
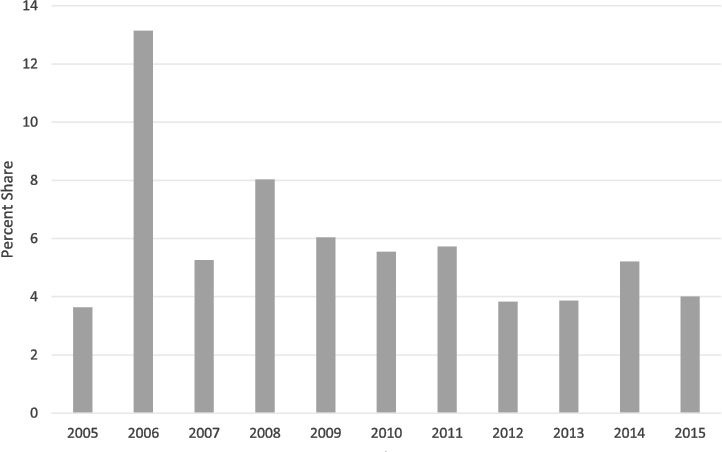
MOSB applicants accounted for a lower percentage of Phase II applications, 5.8 percent across the period, as shown in Figure 6-8. Ignoring the outliers in FY 2005 and FY 2006, that share has drifted down from a high of 8 percent in FY 2008 to a low of under 4 percent in FY 2012 and FY 2013. The share was 4 percent in FY 2015.
As shown in Figure 6-9, the WOSB share of Phase II awards has declined over the period (excluding what seems to be an anomalous year in FY 2005). The share peaked at 12.7 percent in FY 2006, and was 6 percent in FY 2015. WOSBs averaged 8.4 percent of all Phase II awards across the period, slightly lower than their share of Phase I awards (8.6 percent).
SOURCE: DoE SBIR/STTR Program Office.
SOURCE: DoE SBIR/STTR Program Office.
SOURCE: DoE SBIR/STTR Program Office.
SOURCE: DoE SBIR/STTR Program Office.
MOSB shares of Phase II awards at DoE are very low, as shown in Figure 6-10. Except for FY 2006, MOSB shares reached 6 percent on only two occasions, and there were zero MOSB phase II awards in FY 2013. On average, MOSB accounted for 4.6 percent of all Phase II awards across the period.
Declining shares of awards are in part a function of relatively low success rates. As with Phase I, WOSB success rates for phase II applications have been consistently lower than those from firms that are neither woman- nor minority-owned. Figure 6-11 shows that except for FY 2007 and FY 2014, success rates for WOSB were lower than they were for firms that were neither woman- nor minority-owned. On average, during the period FY 2005-2015, WOSB success rates were 41.7 percent, compared to 48.8 percent for firms that were neither woman- nor minority-owned.
Relative Phase II success rates for MOSB were even lower, as shown in Figure 6-12. Overall, MOSB phase II success rates averaged 36.1 percent, against 48.8 percent for firms that were neither woman- nor minority-owned. MOSB success rates were lower than those of other firms in 8 of the 11 years shown.
The data provided by DoE show that the share of applications from WOSB and MOSB in particular have been declining across the period FY 2005-2015. On the face of it, this indicates that efforts to attract more disadvantaged applicants have not been successful.
SOURCE: DoE SBIR/STTR Program Office.
SOURCE: DoE SBIR/STTR Program Office.
SOURCE: DoE SBIR/STTR Program Office.
The data also show that—across the 11 years of data, across both WOSB and MOSB, and across both Phase I and Phase II—success rates for disadvantaged applicants are persistently lower than those for other applicants.
As a result, the share of awards being made to disadvantaged applicants has on the whole declined over the period for both MOSB and WOSB for Phase I and Phase II.
NATIONAL ACADEMIES SURVEY DATA
Company Ownership
Company ownership, by ethnicity and gender, was reported by respondents to the 2014 Survey and is shown in Table 6-4. Eight percent of responding companies indicated that the surveyed company was mostly owned by a member of a minority community at the time of the award. Probing more deeply into the ethnic distribution of minority company ownership provides further details. Most minority-owned companies reported that their owners were Asian-Indian or Asian-Pacific, but no Black-owned or American Indian-owned companies were reported. Only 9 percent of responding companies were woman-owned at the time of the award. The actual numbers of firms reflected in these data are very small.
Minority and Female PIs
However, the resulting data revealed that few female PIs and even fewer WOSBs were involved with the DoE SBIR/STTR program.
The survey effort carried out by the committee in its analysis of the SBIR and STTR programs is the first to its knowledge to expand the standard definitions of “socially and economically disadvantaged.” Previous SBIR surveys from the National Research Council (NRC), and other organizations—and agency data itself—have sought to determine only whether the company is majority owned by members of socially and economically disadvantaged groups as defined by SBA. Because being a PI may be a stepping stone toward company ownership, the 2014 Survey gathered data on woman and minority participation in this role. As shown in Table 6-5, of the 255 respondents to the 2014 Survey, 14 percent indicated that the project’s PI was from a socially or economically disadvantaged group. The survey also asked respondents to provide details about the PI’s ethnic background. The ethnic groups were drawn from the SBA definitions, with the addition of an “other” category to ensure that all respondents who wished to claim minority status could do so. Among those respondents reporting a minority PI, 70 percent reported that the PI was Asian-Pacific or Asian-Indian, 19 percent reported that the PI was Hispanic, and zero percent indicated that the PI was Black or Native American. Women account for only 5 percent of SBIR PIs and 10 percent of STTR PIs.
As noted above, the actual numbers reflect in these data is very small.
TABLE 6-4 Company Ownership, by Ethnicity and Gender, of Firms Receiving DoE SBIR/STTR Awards, Reported by 2014 Survey Responding Companies
| Percentage of Responding Companies | |||
|---|---|---|---|
| Overall | SBIR Awardees | STTR Awardees | |
| Woman-owned | 9 | 9 | 13 |
| Minority-owned | 8 | 7 | 10 |
|
Asian Indian |
5 | 5 | 3 |
|
Asian Pacific |
1 | 1 | 0 |
|
Black |
0 | 0 | 0 |
|
Hispanic |
2 | 1 | 7 |
|
Native American |
0 | 0 | 0 |
| Neither woman- nor minority-owned | 84 | 85 | 77 |
| N (Number of Responding Companies) | 127 | 112 | 15 |
SOURCE: 2014 Survey, Question 15.
TABLE 6-5 Principal Investigators for DoE SBIR/STTR Awardees, by Ethnicity and Gender, Reported by 2014 Survey Respondents
| Percentage of Respondents | |||
|---|---|---|---|
| Overall | SBIR Awardees | STTR Awardees | |
| Woman | 6 | 5 | 10 |
| Minority | 11 | 11 | 10 |
|
Asian Indian |
5 | 5 | 3 |
|
Asian Pacific |
2 | 3 | 0 |
|
Black |
0 | 0 | 0 |
|
Hispanic |
2 | 1 | 7 |
|
Native American |
0 | 0 | 0 |
|
Other |
2 | 2 | 0 |
| Neither a woman nor a minority | 86 | 86 | 83 |
| N (Number of Respondents) | 255 | 22 | 30 |
SOURCE: 2014 Survey, Question 16.
DOE ACTIVITIES RELATED TO WOMEN AND MINORITIES
The DoE SBIR/STTR Program Office is well aware of the need to increase the participation of women and minorities and has taken some initial steps toward this goal. In 2013, it initiated an analysis of the potential pool of woman-owned businesses and minority-owned businesses that may be eligible to participate in the programs, utilizing several North American Industry Classification System (NAICS) codes to identify the population of firms undertaking science and engineering research. However, it became apparent that these codes captured too broad a population to serve as a benchmark for DoE
because it included companies working far beyond the boundaries of the energy sector. DoE is now undertaking an innovative extension of this work, using NAICS codes identified by applicants through their System for Award Management (SAM) registration to develop clusters around specific six-digit codes. The Program Office expects that this approach will result in a much better defined benchmark, which, using Census and other data, will enable estimation of the percentage of WOSBs and MOSBs that might be eligible to participate in the DoE SBIR/STTR programs. If the analysis is effective, then this could provide an important benchmark against which to assess the agency’s success in this area and would be a best practice for other agencies to use in setting similar benchmarks.
According to DoE staff, a major component of the agency’s work to address under-served populations is the pilot Phase 0 program (see description in Chapter 3), introduced in the first release of FY 2015. Sixty-nine potential applicants received Phase 0 assistance in this initial pilot, and of these, about two-thirds applied for funding.
Outcomes for this pilot are provided in Table 6-6. Of the 69 participants in the Phase 0 program, 54 submitted letters of intent (LOIs) that were deemed responsive, and among these, 41 applied and 7 received funding. In contrast, six companies with unresponsive LOIs applied but none received funding. Of the 41 applications with LOIs that were deemed responsive, 12 were from WOSBs and 18 were from MOSBs. Four of the companies that received awards were located in underrepresented areas, and three were Asian American-owned. No funded company was woman-owned or Black-, Hispanic-, or Native American–owned. DoE program staff noted that through the Phase 0 program, the agency is beginning to establish a nationwide network of partnerships with more than 25 states and 12 national professional societies.9
What Might Be Done to Increase the Participation of Women and Minorities in SBIR/STTR?
There is a growing literature on participation rates of women and minorities in STEM-related activities and an ongoing national discussion about how to increase their rates of participation. It may be possible to draw from the body of work ideas on how specifically to increase participation of women and minorities in the SBIR/STTR programs.
A recent journal article,10 for example, describes research results that show persistent gender bias in the field of geoscience. Men were found to have more mentoring, have better odds of being hired, be perceived as more
___________________
9 Chris O’Gwinn, “DoE Phase 0 Review,” presentation provided to National Academies, January 30, 2016.
10 Christopher Intagliata, “Gender Influences Recommendations for Science Jobs,” Scientific American, October 6, 2016.
TABLE 6-6 Phase 0 Participation, Release 2, FY 2015
| Phase 0 Participation Data for Pilot (FY 2015 Phase I Solicitation, Release 2) | ||||
|---|---|---|---|---|
| Number | Percent | |||
| Total Number of Phase 0 Participants | 69 | |||
| Responsive | 54 | 78% | (of Total Participants) | |
|
Number of participants submitting applications |
41 | 76% | (of Responsive) | |
|
No LOI Support |
21 | 39% | (of Responsive) | |
|
Other Phase 0 Support |
20 | 37% | (of Responsive) | |
|
Number that did not apply |
13 | 24% | (of Responsive) | |
|
No LOI Support |
2 | |||
|
Other Phase 0 Support |
12 | |||
| Unresponsive | 15 | 22% | (of Total Participants) | |
|
Applied |
6 | 40% | (of Unresponsive) | |
|
No LOI Support |
3 | 20% | (of Unresponsive) | |
|
Other Phase 0 Support |
3 | 20% | (of Unresponsive) | |
|
Did not apply |
9 | 60% | (of Unresponsive) | |
|
No LOI Support |
2 | |||
|
Other Phase 0 Support |
7 | |||
| Applied | 47 | 68% | (of Total Participants) | |
| Did not apply | 22 | 32% | (of Total Participants) | |
| Awards | 7 | 10% | (of Total Participants) | |
SOURCE: DoE SBIR/STTR Program Office.
competent, and be more likely to receive excellent letters of recommendation and to receive higher starting salaries than women. This suggests a possible value in experimenting with gender-blind reviews of proposals in selecting who receives SBIR/STTR awards.
The review of national statistics on women and minority participation in STEM fields reported that women’s participation was higher in some fields than in others (e.g., higher in psychology and biosciences than in engineering), and, within the field of engineering, higher in some areas of specialty than others (e.g., higher in systems engineering than in electrical engineering).11 These areas of higher participation may offer opportunities for targeted topics development and related outreach by SBIR/STTR programs, allowing them to
___________________
11 National Science Foundation, National Center for Science and Engineering Statistics, Women, Minorities, and Persons with Disabilities in Science and Engineering 2015, is a biennial report mandated by the Science and Engineering Equal Opportunities Act (Public Law 96-516).
convey opportunities to potential applicants who are more likely to include women.
Mentoring is seen as another way to promote greater diversity in STEM careers. For example, an initiative called the “Million Women Mentors” (MWM)12 was launched early in 2014 at the National Press Club in Washington. Its goal is to use mentorship to educate and empower women and girls to pursue careers in STEM. In addition to mentoring, the effort includes making face-to-face introductions of women and girls to those who can provide opportunities in the STEM sphere.
Similarly, experiments with mentoring may be tried in the SBIR/STTR environment. Perhaps incentives could be provided to SBIR/STTR grant winners to mentor women or minorities in the SBIR/STTR process in preparation for them to become future PIs or program applicants. Perhaps woman and minority owners of firms who have been successful in the past in being awarded SBIR/STTR grants could be mentor other woman and minority owners of technology-based firms to participate in the program.
The U.S. Library of Congress has compiled resources on the topic of women and minorities in science and technology. These include references to reports of the National Academies on the topic and provide many historical examples of women and minorities excelling in science and engineering, which may provide examples that can be used by agency planners of outreach activities.
Insights may also be gained from a new journal—Journal of Women and Minorities in Science and Engineering13—designed as a resource for educators, managers, and policymakers. The Journal publishes peer-reviewed papers that report innovative ideas, programs, concepts, and “reports from the field” related to increasing the participation of women and minorities in science and engineering, including engagement with federal and state agencies. For example, a recent article dealt with gender diversity from the perspective of developing a curriculum in engineering. Using a nationally representative survey of students from 121 engineering programs in 31 institutions, the analyses demonstrated differences in gender diversity across engineering disciplines—with programs in mechanical and electrical engineering being significantly less diverse by gender, and programs in biomedical/bioengineering, chemical, civil, and industrial engineering being more gender diverse. The research indicates that women are more drawn to disciplines that emphasize thinking from a broad, systems perspective that link across topics than disciplines with narrow perspectives. Again, this finding may be of value to planners of SBIR/STTR outreach in identifying university programs in which to pitch STTR outreach
___________________
12Katherine Beard, “Million Women Mentors Launched to Fill the Gap of Women in Stem Fields,” U.S. News, January 9, 2014.
13Journal of Women and Minorities in Science and Engineering, Begell House; e.g., Knight (Virginia Tech), Lattuca (U of MI), Yin (Penn State), Kremer (Penn State), York (Penn State), and Ro (Penn State), 2012.
activities. In addition, professors in woman- and minority-favored fields or authors of diversity studies may be helpful consultants in developing effective outreach for underserved populations.
An SBA study found that new firms in general and high-tech firms in particular have more difficulty getting financing from traditional sources than established, mature, non-high-tech firms.14 This creates a capital problem exacerbated in firms owned by women and African Americans and Hispanics, causing them on average to utilize a different mix of equity and debt capital than do firms owned by others. The result is that they tend to be undercapitalized. Racial and gender disparities in capital access may cause these firms to be particularly vulnerable to delays and gaps in funding; they may have difficulty funding proposal preparation. Thus, participation of these companies in the SBIR/STTR programs raises the stakes of funding delays and gaps. These companies may be prime subjects for Phase 0 and complementary assistance from state and federal programs to help overcome added stresses of inadequate financing.
Surveys and case studies of woman- and minority-owned companies—including non-applicants and applicants who were successful and those who were not—offer a way to learn more about these underserved populations in order to better understand causes for the low and even declining rates of participation in the SBIR/STTR programs. Table 6-7 suggests metrics that could be collected from woman- and minority-owned firms, as well as all other firms, both applicants and non-applicants. The questions—still in draft form—are aimed at identifying perceived positive and negative factors that likely influence application rates.
The SBA Office of Women’s Business Ownership (WBO),15 whose mission is to enable and empower women entrepreneurs, may provide insights into obstacles facing women business owners and suggestions for more effective outreach, as well as direct assistance to would-be applicants. There are WBO centers located around the country. In addition, there are other state and local programs that assist small business entrepreneurs to develop business plans, find financing, and link to other resources.16
___________________
14 Alicia Robb, Marin Consulting, LLC, Access to Capital among Young Firms, Minority-owned Firms, Women-owned Firms, and High-tech Firms, Small Business Administration Contract no. SBAHQ-11-M-0203, April 2013.
15 See http://www.sba.gov/offices/headquarters/wbo.
16 For an overview of the types of state services utilized, see Box 1-5. As noted in Chapter 1, a directory of state services is also maintained by SBA for applicants to use in finding local assistance with business planning, matching funds programs, and other startup activities—with contact information, web links, brief descriptions, and an interactive map—and is accessible via the home page of the SBIR-STTR website, http://sbir.gov/.
TABLE 6-7 Illustrative Metrics on Underserved Populations
| Metrics (Choose A or B) | WOSB (# / /%) | MOSB (# / /%) | Other (# / /%) |
|---|---|---|---|
|
|||
Reason: _______________________
Reason: __________________________
|
|||
|
|||
Location, founding date, size, other |
|||
SUMMARY
The National Academies’ 2014 Survey of SBIR/STTR awardees enabled for the first time a disaggregation of participants by minority status, in addition to the disaggregation by sex. In addition, it compiled data on PIs, as well as business ownership.
Data from the 2014 Survey show that participation by woman and minorities to the SBIR/STTR program is low and not expanding. The committee considered and rejected the idea of quotas as a way to increase the participation of women and minorities and encouraged DoE to look for alternative approaches.
Multiple opportunities are identified for DoE to expand its efforts to increase participation by women and minorities in the SBIR/STTR programs. DoE efforts to expand participation in the SBIR/STTR by women and minorities are seen as a small but important element of a broader national imperative.


