
4
SBIR and STTR Awards at DoE
The DoE SBIR/STTR programs are the fourth largest among the federal agencies offering those programs. In fiscal year (FY) 2014, they provided $184 million in funding, an increase of almost $20 million from FY 2012, after implementing changes made in the 2011 reauthorization of the SBIR/STTR programs (see Chapter 1).
Utilizing data provided by the Department of Energy, this chapter reviews applications and awards data for the DoE SBIR and STTR programs. These include data for Phase I, Phase II, as well as Fast Track and Phase IIA and Phase IIB supplemental awards. The chapter also includes data and analysis of the distribution of applications and awards among the states and data on new entrants to the program and multiple award winners.
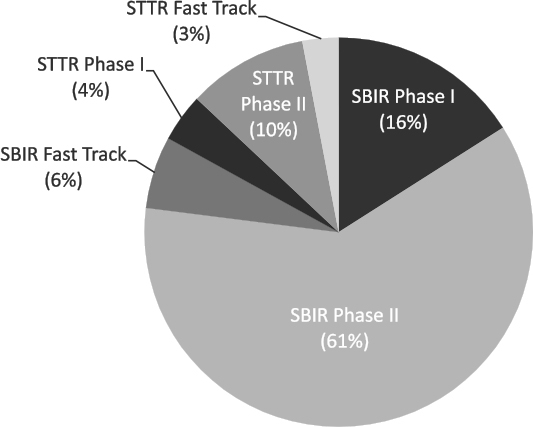
The FY2014 funding for the DoE SBIR/STTR programs can be broken down as follows (see Table 4-1):
- SBIR provided $153.9 million (83.7 percent of total funding)
- STTR provided $30.0 million (16.3 percent of total funding)
- SBIR and STTR Fast Track awards totaled $16.1 million or 8.8 percent of total funding (FY 2014 was the first year of Fast Track at DoE)
- SBIR and STTR Phase I awards (excluding Fast Track) totaled $36.8 million (20 percent of total funding)
- SBIR and STTR Phase II awards (excluding Fast Track) totaled $131 million (71.2 percent of total funding)
This summary provides an overview of applications and awards for the DoE SBIR/STTR programs, including a review of trends, distribution of awards by state, and participation by companies new to the program. A more extended analysis of the data follows the summary.
TABLE 4-1 SBIR/STTR Funding by Program, Phase, and Funding Mechanism, FY 2005-2014
| Fiscal Year | Funding (Millions of Dollars) | ||||||||
|---|---|---|---|---|---|---|---|---|---|
| SBIR | STTR | ||||||||
| Phase I | Phase II | Fast Track | SBIR Total | Phase I | Phase II | Fast Track | STTR Total | Total | |
| 2005 | 25.6 | 74.7 | 0.0 | 100.4 | 2.9 | 9.2 | 0.0 | 24.2 | 124.5 |
| 2006 | 25.9 | 88.3 | 0.0 | 114.1 | 2.9 | 11.25 | 0.0 | 28.3 | 142.4 |
| 2007 | 28.2 | 83.0 | 0.0 | 111.2 | 3.7 | 11.16 | 0.0 | 29.7 | 140.9 |
| 2008 | 27.9 | 101.8 | 0.0 | 129.7 | 3.8 | 14.4 | 0.0 | 36.4 | 166.1 |
| 2009 | 37.5 | 113.6 | 0.0 | 151.1 | 4.0 | 11.7 | 0.0 | 31.5 | 182.5 |
| 2010 | 43.1 | 172.6 | 0.0 | 215.7 | 6.0 | 13.5 | 0.0 | 39.0 | 254.7 |
| 2011 | 29.4 | 110.7 | 0.0 | 140.1 | 2.6 | 19.2 | 0.0 | 43.6 | 183.7 |
| 2012 | 44.2 | 88.6 | 0.0 | 132.8 | 6.25 | 9.6 | 0.0 | 31.8 | 164.6 |
| 2013 | 38.9 | 100.1 | 0.0 | 139.0 | 4.95 | 14.97 | 0.0 | 39.8 | 178.9 |
| 2014 | 30.1 | 112.9 | 10.9 | 153.9 | 6.7 | 18.1 | 5.2 | 30.0 | 183.9 |
| Total | 330.7 | 1,046.3 | 10.9 | 1,388.0 | 80.8 | 248.3 | 5.2 | 334.2 | 1,722.2 |
NOTE: The DoE SBIR/STTR Program Office provided data for all charts and tables in this chapter unless otherwise noted. Because DoE moved its historical data to a new data structure for FY 2014 and some data were not ported over, data in this chapter do not exactly match data provided to the Small Business Administration (SBA).
SOURCE: DoE SBIR/STTR Program Office.
CHAPTER SUMMARY
SBIR Phase I Awards
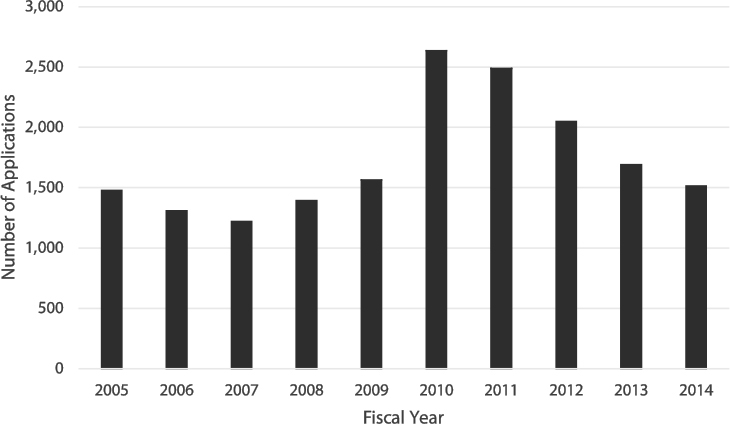
The number of SBIR Phase I applications has declined in recent years. Applications held steady at just less than 1,500 annually from FY 2005 to FY 2009 before increasing sharply to almost 2,700 in FY 2010 (apparently related to the availability of additional American Recovery and Reinvestment Act [ARRA] funding). After FY 2010, applications declined steadily to just less than 1,400 in FY 2014.
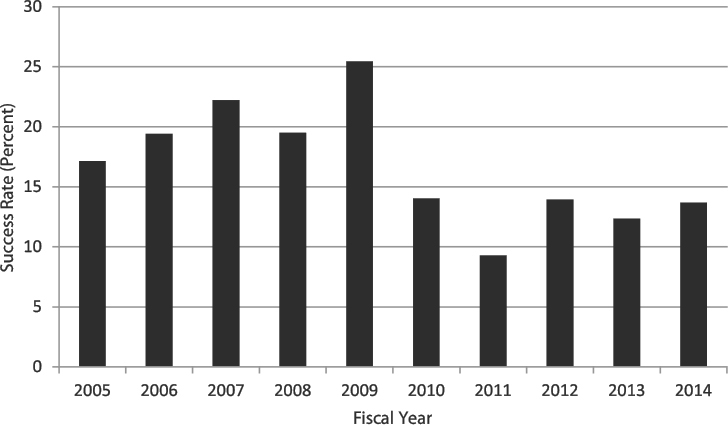
The average success rate for SBIR Phase I applications during the study period was 16 percent, varying from a low of 9.3 percent in FY 2011 to a high of 25.4 percent in FY 2009. After FY 2009, the success rate did not rise above 14 percent. Changes in the amount of funding allocated were not the primary driver of the changes in success rates.
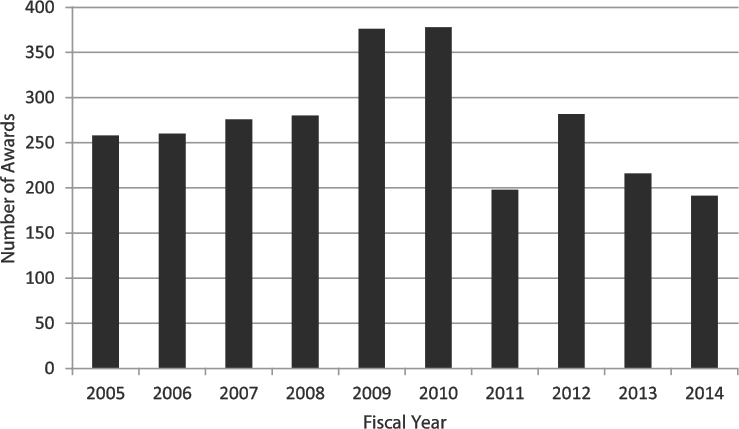
SBIR Phase I awards remain the primary gateway into the program. Until FY 2014, only Phase I winners could apply for Phase II funding. An average of about 272 Phase I awards were made each year during the study period, although the numbers have declined in recent years, reaching a low of 191 in FY 2014. Funding levels for Phase I SBIR awards varied in recent years, growing to a peak of $44.2 million in FY 2012 before falling back to a level more in line with historical trends at about $30 million in FY 2014.
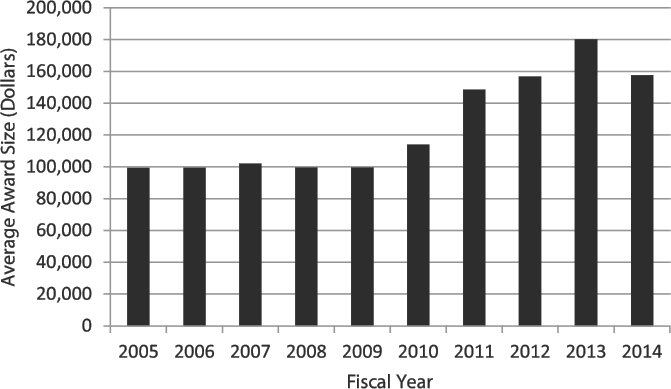
Although the number of awards declined, the average size of new Phase I awards increased, from about $100,000 in FY 2005-2009 to $180,000 in FY 2013 before declining to just less than $160,000 in FY 2014.
SBIR Phase II Awards
The number of SBIR Phase II awards has in part been driven by the number of Phase I awards, lagged by 1 year. Until FY 2015, all Phase II awards went to projects that had already received a Phase I award (except for Fast Track awards; see Fast Track section below).
Unlike Phase I, there was no sustained decline in applications for Phase II across the study period, even though the number of eligible applicants declined in recent years (because of the declining number of Phase I awards). Excluding FY 2010, which included ARRA, an average of 235 Phase II applications were submitted each year. Success rates for Phase II grant applications varied by year and declined slightly in recent years, averaging slightly less than 50 percent across the study period.
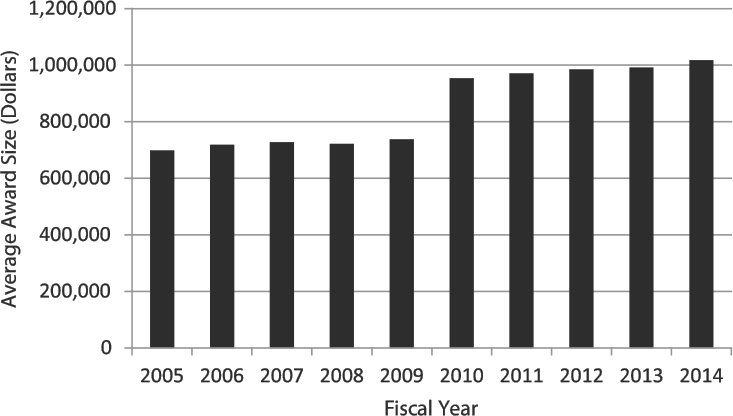
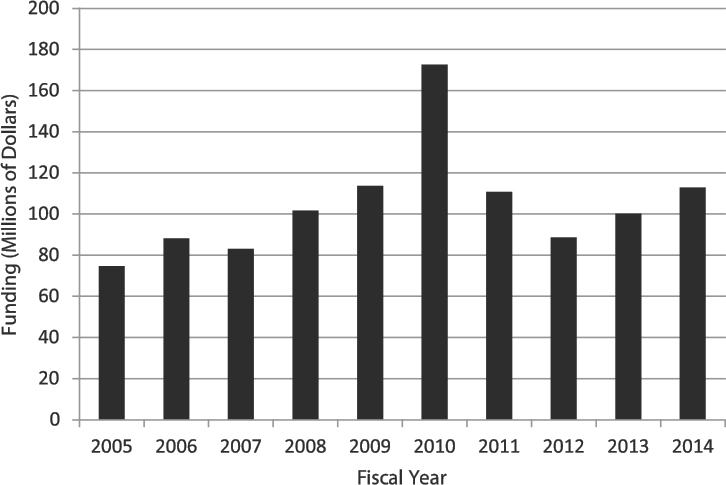
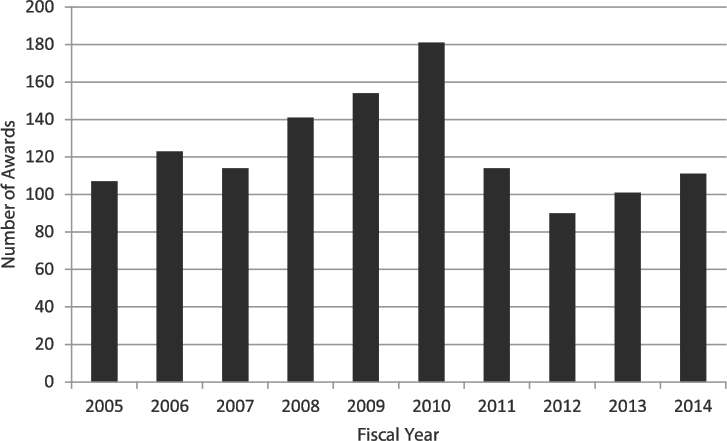
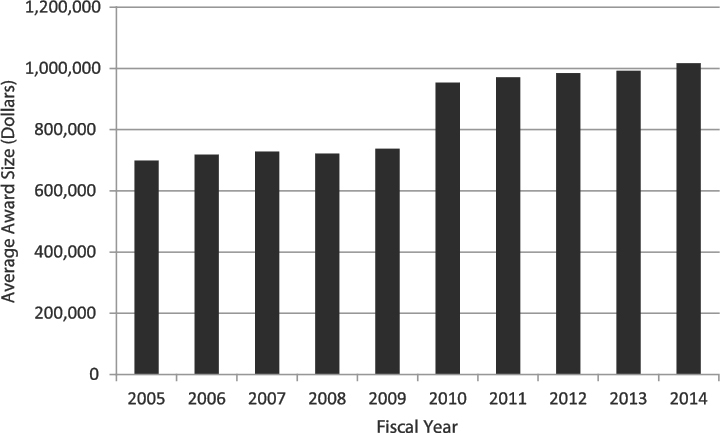
The number of Phase II SBIR awards also declined over the study period. The number of awards increased from FY 2005 to FY 2010 but dropped thereafter before increasing again in FY 2013-2014, averaging about 100 for FY 2011-2014. Excluding FY 2010, funding for Phase II awards increased slowly across the study period, from around $80 million annually in FY 2005-2007 to around $100 million annually in FY 2011-2014. The success rate dropped as the number of awards declined relative to the number of applications. With fewer awards came an increase in the average award size, which ticked up sharply in FY 2010 from less than $750,000 in the preceding period to about $950,000 and reached more than $1 million for the first time in FY 2014 (see Figure 4-1). Larger awards therefore resulted in fewer awards, even in an environment where funding was increasing.
STTR Awards
STTR is a relatively small program. Its funding grew from around $25 million in the early part of the study period to peak at more than $40 million. Funding decreased to $30 million in FY 2014, of which $6.7 million was for Phase I awards.
The numbers of Phase I STTR awards and Phase II STTR awards decreased in recent years, reaching lows of 41 and 19, respectively, in FY 2015. Funding levels per award in general tracked SBIR averages.
Fast Track
DoE initiated the Fast Track program in FY 2014, making six Phase I SBIR and seven Phase I STTR Fast Track awards.
SOURCE: DoE SBIR/STTR Program Office.
Phase IIA and Phase IIB Awards
In an effort to improve outcomes for Phase II and to help companies transition to the market, DoE has added two types of additional awards to its programs. Phase IIA provides a small amount of funding to companies completing a Phase II and requiring additional help. Phase IIB provides a larger amount to move companies into commercialization, much like the National Science Foundation (NSF) Phase IIB program. However, unlike NSF’s program, the DoE program does not require matching funds, that is, funds from an alternative source to the Phase IIB award recipient to assist with commercialization.
SBIR Awards and the States
The distribution of SBIR awards among the states continues to be a matter of concern for some members of Congress. Agencies are now required to report on their efforts to encourage awards from underserved states. This shows that the distribution of SBIR awards among the states reflects the distribution of resources and talent across the nation and the merit-based approach of the SBIR program.
At the most basic level, states with larger populations tend to have more SBIR-capable applicants and therefore generate more applications. After normalizing for population, substantial differences among the states remain. The number of Phase I SBIR applications per 1 million population varies sharply,
from more than 200 for Massachusetts, Colorado, and Delaware to fewer than 20 for 16 states, including fewer than 10 for 3 states. Therefore, factors other than population size substantially affect the number of applications.
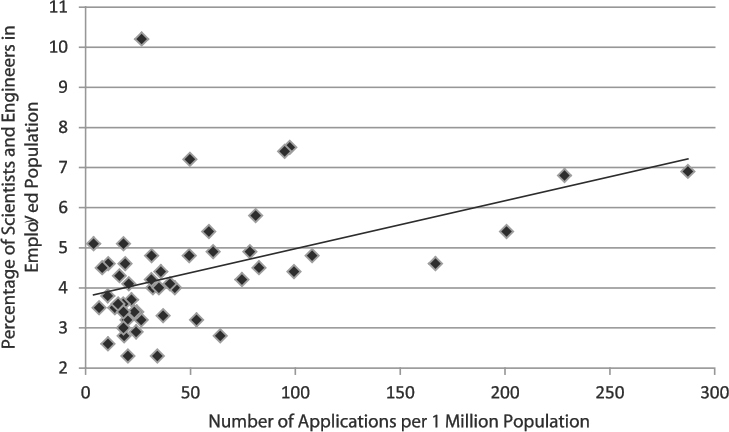
The number of applications per 1 million population is highly correlated with the share of scientists and engineers in the working population. Unsurprisingly, states with more scientists and engineers tend to generate more applicants. Scientists and engineers are often found clustered in high-tech areas anchored by universities and R&D parks.
Finally, success rates for applications vary as well. Nine states have rates above 20 percent, while 15 states have rates half that or lower. This suggests that the quality of applications varies substantially and that simply increasing the number of applications from a state will not necessarily translate to more awards to that state. (There is also the issue of small numbers, where approval of a single application from a state that has received only one results, at least temporarily, in a success rate of 100 percent.)
New Entrants and Multiple-Award Winners
DoE data indicate that the number of new applicants and first-time awardees has expanded in recent years. At the same time, the incidence of multiple award winners has increased. The top 20 winners accounted for slightly less than 23 percent of all Phase I SBIR/STTR awards and 27 percent of all Phase II awards. Companies varied in their capacity to convert Phase I into Phase II, with a DoE average conversion rate1 from Phase I to Phase II awards of about 45 percent across the study period.
DETAILED DATA: SBIR AND STTR AWARDS AT DOE
The remainder of the chapter provides more detailed information about SBIR and STTR applications and awards at DoE. The period of analysis is FY 2005-2014 inclusive to capture both recent and longer term trends. A 10-year period seems sufficient for trend analysis, particularly given the important changes to the program during that period.
This section covers Phase I, Phase II, and Fast Track awards, and SBIR and STTR separately. It considers awards from a range of perspectives, including distribution by state, the impact of multiple awards to individual companies, applications, and success rates. For the convenience of the reader, Table 4-2 reproduces Table 4-1 in the chapter summary, which shows funding by program and phase for FY 2005-2014. Figure 4-2 summaries the data for FY 2014 in chart format.
___________________
1 The conversion rate is the number of Phase II awards received by a company expressed as a percentage of the number of Phase I awards received by that company.
TABLE 4-2 SBIR/STTR Funding by Program, Phase, and Funding Mechanism, FY 2005-2014
| Fiscal Year | Funding (Millions of Dollars) | ||||||||
|---|---|---|---|---|---|---|---|---|---|
| SBIR | STTR | ||||||||
| Phase I | Phase II | Fast Track | SBIR Total | Phase I | Phase II | Fast Track | STTR Total | Total | |
| 2005 | 25.6 | 74.7 | 0.0 | 100.4 | 5.8 | 18.4 | 0.0 | 24.2 | 124.5 |
| 2006 | 25.9 | 88.3 | 0.0 | 114.1 | 5.8 | 22.5 | 0.0 | 28.3 | 142.4 |
| 2007 | 28.2 | 83.0 | 0.0 | 111.2 | 7.4 | 22.3 | 0.0 | 29.7 | 140.9 |
| 2008 | 27.9 | 101.8 | 0.0 | 129.7 | 7.6 | 28.9 | 0.0 | 36.4 | 166.1 |
| 2009 | 37.5 | 113.6 | 0.0 | 151.1 | 8.0 | 23.5 | 0.0 | 31.5 | 182.5 |
| 2010 | 43.1 | 172.6 | 0.0 | 215.7 | 12.0 | 27.0 | 0.0 | 39.0 | 254.7 |
| 2011 | 29.4 | 110.7 | 0.0 | 140.1 | 5.2 | 38.4 | 0.0 | 43.6 | 183.7 |
| 2012 | 44.2 | 88.6 | 0.0 | 132.8 | 12.5 | 19.3 | 0.0 | 31.8 | 164.6 |
| 2013 | 38.9 | 100.1 | 0.0 | 139.0 | 9.9 | 29.9 | 0.0 | 39.8 | 178.9 |
| 2014 | 30.1 | 112.9 | 10.9 | 153.9 | 6.7 | 18.1 | 5.2 | 30.0 | 183.9 |
| Total | 330.7 | 1,046.3 | 10.9 | 1,388.0 | 80.8 | 248.3 | 5.2 | 334.2 | 1,722.2 |
NOTE: The DoE SBIR/STTR Program Office provided data for all charts and tables in this chapter unless otherwise noted. Because DoE moved its historical data to a new data structure for FY 2014 and some data were not ported over, data in this chapter do not exactly match data provided to the Small Business Administration (SBA).
SOURCE: DoE SBIR/STTR Program Office.
SOURCE: DoE SBIR/STTR Program Office.
SBIR Awards
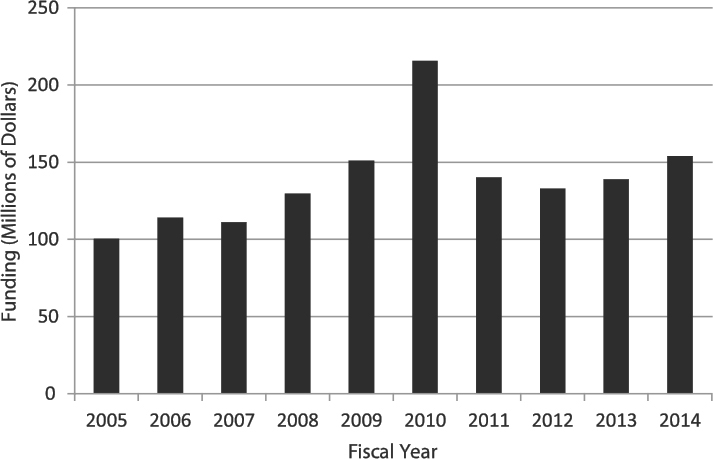
DoE funds both SBIR and STTR through grants rather than contracts. SBIR funding grew steadily during the study period, from $100 million in FY 2005 to $150 million in FY 2014, reflecting the expansion of the program under reauthorization (see Figure 4-3). The sharp increase in FY 2010 resulted from additional funding made available under the American Recovery and Reinvestment Act (ARRA).
Phase I SBIR Awards
Although funding for Phase I SBIR increased overall from FY 2005 to FY 2014, funding was erratic on a yearly basis (see Figure 4-4). To some degree, these data are reflected in the data for Phase I SBIR awards (see Figure 4-5), although the growth in the average award size after FY 2011 is also a factor. ARRA positively impacted the number of Phase I awards in FY 2010, but the increase in the award size (see Figure 4-6) has since reduced the number of awards possible (after reauthorization). The low number of awards in FY 2011 remains an anomaly.
SOURCE: DoE SBIR/STTR Program Office.
SOURCE: DoE SBIR/STTR Program Office.
SOURCE: DoE SBIR/STTR Program Office.
SOURCE: DoE SBIR/STTR Program Office.
Figure 4-7 shows the number of Phase I SBIR applications received by DoE in FY 2005-2014. Applications remained steady from FY 2005-2009 at just under 1,500 annually, increased sharply to almost 2,700 in FY 2010, then declined steadily to reach the historical level of about 1,500 in FY 2014. The increase in FY 2010 may reflect both the ripple effects from the financial crash in 2008 and expectations that DoE would be disbursing additional SBIR/STTR funding from the ARRA program.
During the study period, the average success rate2 for Phase I SBIR applications was 16 percent, ranging from a low of 9.3 percent in FY 2011 to a high of 25.4 percent in FY 2009 (see Figure 4-8). The average success rate for FY 2010-2014 was less than 15 percent (averaging 12.7 percent for that entire period).
Phase II SBIR Awards
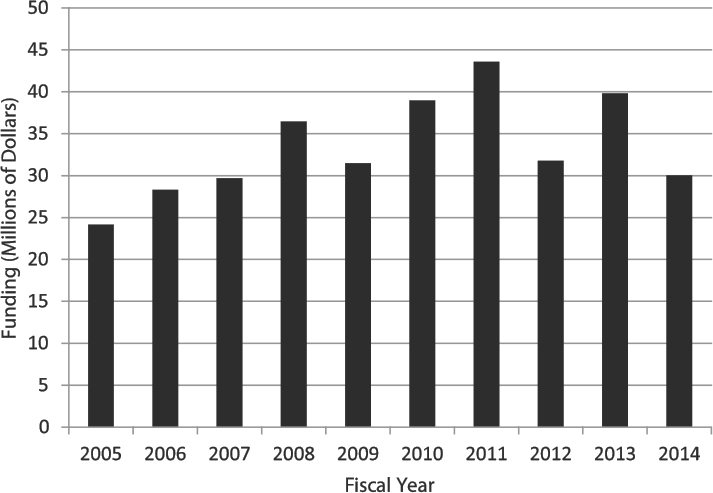
Aside from the one-time increase in FY 2010 due to ARRA, funding devoted to Phase II SBIR awards has trended slightly upwards and now appears likely to surpass $100 million annually (see Figure 4-9). Phase II has on average accounted for about 76 percent of all SBIR funding. The number of Phase II SBIR awards was also affected by ARRA and then by the increase in the average award size. Figure 4-10 shows the number of awards, and Figure 4-11 shows the average Phase II SBIR award size.
___________________
2 Phase I success rates reflect the share the Phase applications that result in Phase I awards.
NOTE: In 2014, 134 Phase I applications were for both SBIR and STTR simultaneously. For the purposes of this analysis, these have been allocated 83 percent to SBIR and 17 percent to STTR, in line with the historical allocation of awards between the programs.
SOURCE: DoE SBIR/STTR Program Office.
SOURCE: DoE SBIR/STTR Program Office.
SOURCE: DoE SBIR/STTR Program Office.
SOURCE: DoE SBIR/STTR Program Office.
SOURCE: DoE SBIR/STTR Program Office.
Figure 4-11 shows that funding levels per award increased first as a result of ARRA and then as a result of reauthorization. The tradeoff between increased award size and fewer awards is therefore clear.
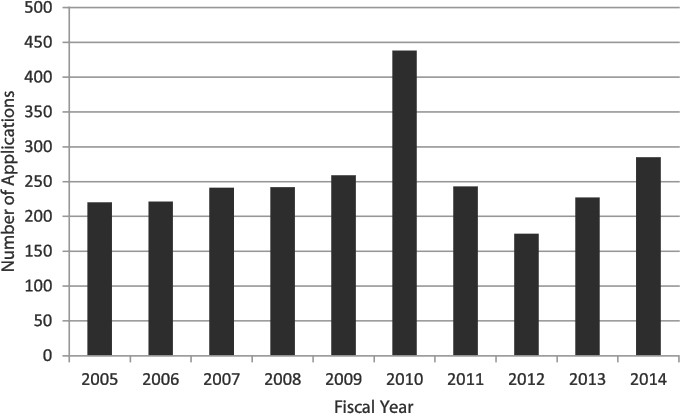
Overall, the number of Phase II SBIR applications received by DoE has been steady, except for the increase due to ARRA in FY 2010 and the anomalous decline in FY 2012. Unlike at some other agencies, the number of applications to DoE increased during the last 2 years of the study period (see Figure 4-12).
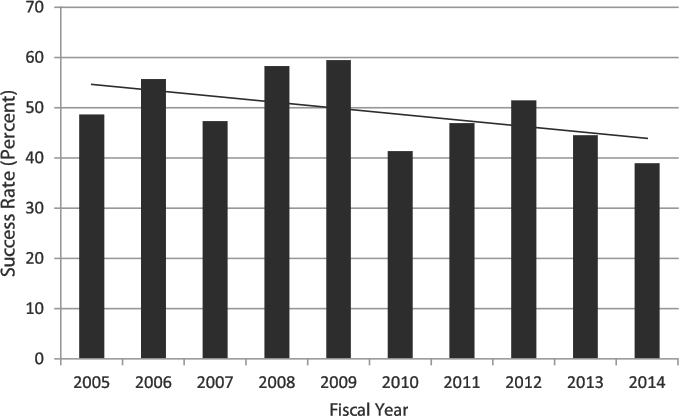
As expected, success rates3 for Phase II are much higher than those for Phase I. At DoE, these rates trended slightly downward during the study period, with a low point in FY 2014 of less than 40 percent (see Figure 4-13).
STTR Awards
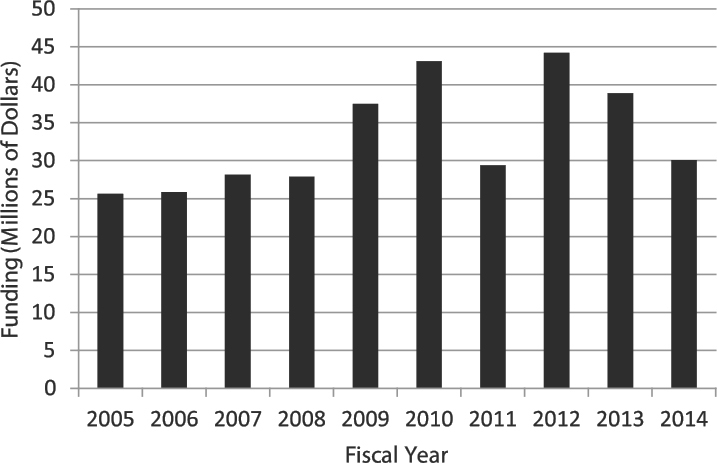
Data on STTR are more limited, because DoE did not port application data for STTR into the new database when it was established in 2014. Accordingly, this analysis focuses only on awards and funding. Overall, funding for STTR reflects shifts in the SBIR/STTR programs rather than specific decisions about STTR. Funding varied substantially year to year, but the overall trend revealed an increase over the study period (see Figure 4-14).
___________________
3 Phase II success rates reflect the share of Phase II applications that result in Phase II awards.
SOURCE: DoE SBIR/STTR Program Office.
SOURCE: DoE SBIR/STTR Program Office.
SOURCE: DoE SBIR/STTR Program Office.
Phase I STTR Awards
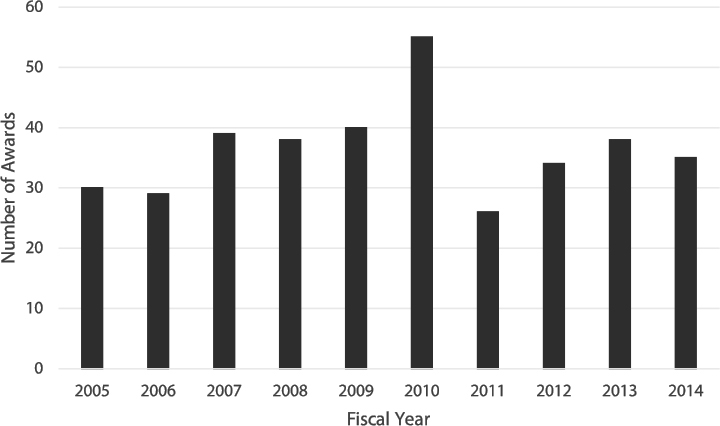
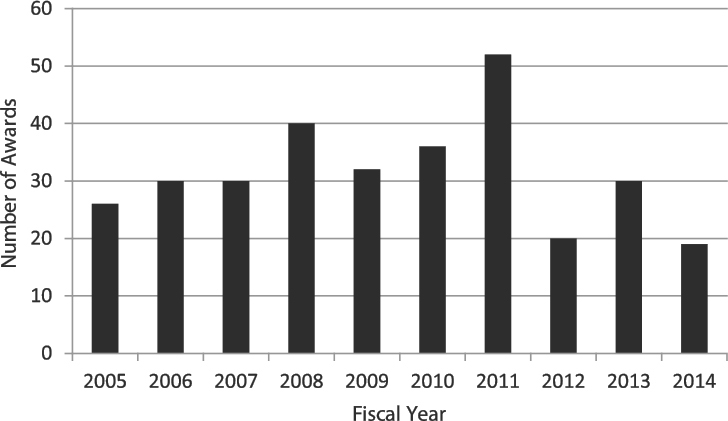
The number of STTR Phase I awards increased from FY 2006 to FY 2010 but declined after FY 2010 (which appears to be an anomaly) (see Figure 4-15). More recently DoE has averaged about 35 STTR Phase I awards annually.
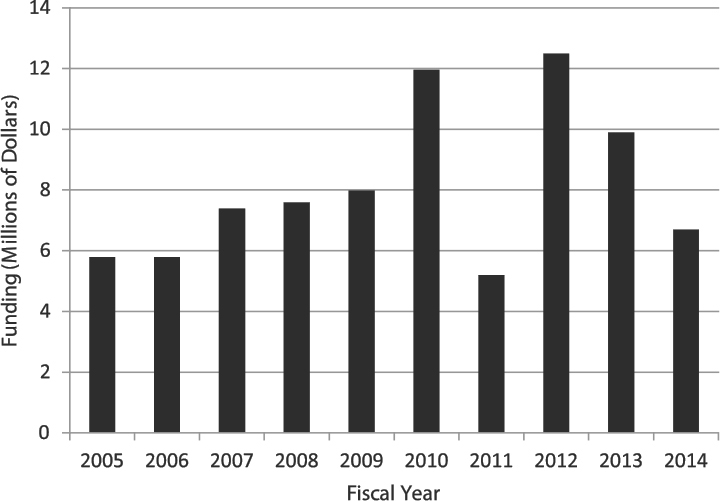
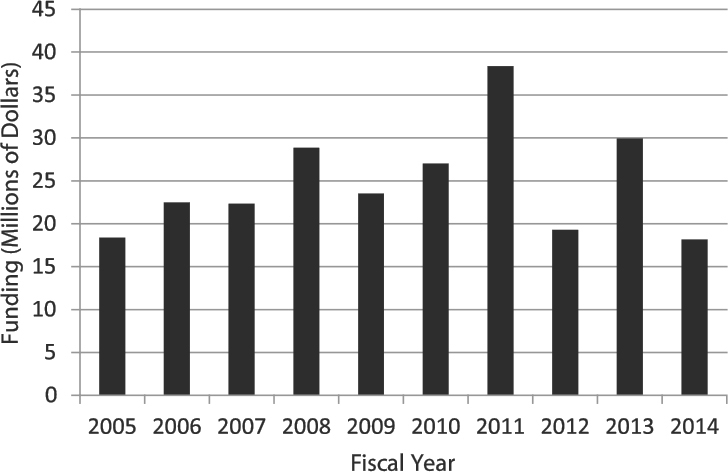
The amount of funding allocated for Phase I STTR awards peaked at about $12 million in FY 2012 and then declined by about one-half by FY 2014 (see Figure 4-16).
STTR Phase II
The numbers of awards for Phase II track fairly closely with those for Phase I, with a 1-year lag: a gradual increase from FY 2005-2010, a sharp jump in FY2011, and then a subsequent decline (see Figure 4-17). As with SBIR, Phase II STTR accounts for the lion’s share of program funding. In addition, as with Phase I, funding for Phase II STTR increased through FY 2010 before declining thereafter (again with the anomalous low funding in FY 2012) (see Figure 4-18).
SOURCE: DoE SBIR/STTR Program Office.
SOURCE: DoE SBIR/STTR Program Office.
SOURCE: DoE SBIR/STTR Program Office.
SOURCE: DoE SBIR/STTR Program Office.
Fast Track
DoE offered Fast Track awards for the first time in FY 2014 (the Fast Track process is described in Chapter 2) and received 25 applications across both programs and made 13 awards (see Table 4-3).
Phase IIA and Phase IIB
In an effort to improve outcomes for Phase II and to help companies transition to the market, DoE has added two types of additional awards. Phase IIA provides a small amount of funding to companies completing a Phase II and requiring additional help. Phase IIB provides a larger amount to move companies into commercialization, much like the National Science Foundation (NSF) Phase IIB program. However, unlike NSF program, the DoE program does not require matching funds. Applications for Phase IIA are more likely to be funded than those for Phase IIB (see Table 4-4). Phase IIA applications were funded at a rate of 61.5 percent, and Phase IIB applications were funded at a rate of 32.1 percent.
SBIR Awards and the States
SBIR awards are not distributed equally across the states, reflecting the number of applications from different regions of the country and the program’s merit-based selection. Reflecting Congressional interest in broader access to the program, agencies are now required to report on their effort to encourage awards from underserved states.
TABLE 4-3 Number of Fast Track Applications and Awards, FY 2005-2014
| SBIR | STTR | |
|---|---|---|
| Number of Applications | 12 | 13 |
| Number of Awards | 9 | 4 |
SOURCE: DoE SBIR/STTR Program Office.
TABLE 4-4 Applications Outcomes for Phase IIA and Phase IIB, FY 2014
| Phase IIA Applications | Phase IIB Applications | |
|---|---|---|
| Awarded | 61.5 | 32.1 |
| Recommended for Funding - Not Awarded | 23.1 | 13.2 |
| Not Recommended for Funding | 15.4 | 49.1 |
| Declined Without Review | 0.4 | 0.4 |
SOURCE: DoE SBIR/STTR Program Office.
Phase I SBIR and the States
The number of awards per state is a function of three factors:
- The size of the state
- The number of applications per unit of population
- The success rate for applications from the state
Table 4-5 shows that all of these factors differ substantially among the states. At the most basic level, states with larger population tend to have more SBIR-eligible firms and therefore generate more applications. However, as Table 4-5 shows, even after normalizing for population substantial differences between the states remain. The table shows the number of applications per 1 million population for each state. Results vary from more than 200 for Massachusetts, Colorado, and Delaware to fewer than 20 for 16 states, including fewer than 10 for 3 states. Thus, factors other than size of population substantially affect the number of applications.
Likewise, reviewing the number of awards alone is of little analytic use. Because that number is largely driven by state population, initial analysis must consider applications normalized for population. That rate is also provided in Table 4-5 and reveals very large disparities. At the top end, Massachusetts generated 57.5 Phase I SBIR awards per million population, while Colorado, New Mexico, and Delaware each generated more than 40. In contrast, 19 states generated fewer than 3 awards per 1 million population, and 4 states generated fewer than one.
The National Science Foundation has developed a measure of the science and engineering talent deployed in a state economy. Figure 4-19 shows the relationship between the number of applications per 1 million population and the percentage share of scientists and engineers in the workforce. The correlation is substantial, with a Pearson Rho of 46.0.
The award outcomes for states are also influenced by success rates for applications, which also display substantial variation. The average success rate for all applications is 16.1 percent: 9 states have rates of 20 percent or greater, while 15 states have rates of 10 percent or lower (see Table 4-5). The latter states therefore have success rates substantially lower than the average, and less than half of those of the most successful states. This suggests that the quality of applications varies substantially and that simply seeking to increase the number of applications from firms within a state will not necessarily result in more awards to firms in that state.
Phase II SBIR and the States
Table 4-6 provides Phase II SBIR applications and awards data for FY 2005-2014 by state, normalized for population, as well as data on the science
SOURCE: DoE SBIR/STTR Program Office (awards and applications); National Science Foundation, Science and Engineering Indicators, Table 8-31 (number of scientists and engineers employed) 2015; U.S. Census Bureau (state populations).
and engineering workforce. There are substantial variations between states, largely following the patterns found for Phase I.
Understanding Low-award States
Three factors appear to play a role, to differing degrees depending on the state, in why some states receive more SBIR awards than do others.
- Some states do not have a great deal of science and engineering talent. Nationally, scientists and engineers make up 4.7 percent of the workforce. For the 10 lowest award states (normalized for population, and excluding DC), that percentage is 3.7 percent.
- Less science and engineering talent leads in part to the second direct factor—fewer applications. The 10 lowest awarded states (normalized for population) generated an average of 12.3 applications per 1 million population over the study period. The average for all states (including low performers) was 48.5.
- The average success rate for all states was 16.1 percent. For the 10 lowest award states, it was 6.4 percent. Although the numbers are small, it is apparent that there is no correlation between application rates and success rates for the low-award states (Pearson Rho = -0.14).
TABLE 4-5 DoE Phase I SBIR Applications and Awards, by State, FY 2005-2014
| State | No. of Apps | No. of Awards | Population (Millions) | Percent Share of Scientists and Engineers in the Workforce | No. of Applications per One Million in Population | No. of Awards per One Million in Pop | Success Rate (Percent) (Normalized for Pop) 2 |
|---|---|---|---|---|---|---|---|
| (blank) | 1 | 0 | |||||
| AK | 8 | 0 | 0.74 | 4.6 | 10.83 | 0.0 | 0.0 |
| AL | 170 | 19 | 4.86 | 4.0 | 34.99 | 3.9 | 11.2 |
| AR | 54 | 9 | 2.98 | 5.1 | 18.13 | 3.0 | 16.7 |
| AZ | 439 | 44 | 6.83 | 2.8 | 64.29 | 6.4 | 10.0 |
| CA | 3,175 | 519 | 39.14 | 5.8 | 81.11 | 13.3 | 16.3 |
| CO | 1,246 | 265 | 5.46 | 6.8 | 228.35 | 48.6 | 21.3 |
| CT | 388 | 73 | 3.59 | 4.8 | 108.05 | 20.3 | 18.8 |
| DC | 18 | 1 | 0.67 | 10.2 | 26.78 | 1.5 | 5.6 |
| DE | 190 | 38 | 0.95 | 5.4 | 200.86 | 40.2 | 20.0 |
| FL | 472 | 47 | 20.27 | 3.4 | 23.28 | 2.3 | 10.0 |
| GA | 165 | 22 | 10.21 | 4.3 | 16.15 | 2.2 | 13.3 |
| HI | 35 | 5 | 1.43 | 3.4 | 24.45 | 3.5 | 14.3 |
| IA | 20 | 3 | 3.12 | 3.5 | 6.40 | 1.0 | 15.0 |
| ID | 52 | 6 | 1.65 | 4.2 | 31.42 | 3.6 | 11.5 |
| IL | 518 | 60 | 12.86 | 4.1 | 40.28 | 4.7 | 11.6 |
| IN | 119 | 10 | 6.62 | 3.6 | 17.98 | 1.5 | 8.4 |
| KS | 64 | 9 | 2.91 | 3.7 | 21.98 | 3.1 | 14.1 |
| KY | 80 | 5 | 4.43 | 3.0 | 18.08 | 1.1 | 6.3 |
| LA | 50 | 1 | 4.67 | 2.6 | 10.70 | 0.2 | 2.0 |
| MA | 1,952 | 391 | 6.79 | 6.9 | 287.29 | 57.5 | 20.0 |
| MD | 571 | 75 | 6.01 | 7.4 | 95.07 | 12.5 | 13.1 |
| ME | 32 | 4 | 1.33 | 2.9 | 24.07 | 3.0 | 12.5 |
| MI | 367 | 54 | 9.92 | 3.3 | 36.99 | 5.4 | 14.7 |
| MN | 176 | 23 | 2.99 | 5.4 | 58.82 | 7.7 | 13.1 |
| MO | 111 | 16 | 5.49 | 2.3 | 20.22 | 2.9 | 14.4 |
| MS | 23 | 2 | 6.08 | 5.1 | 3.78 | 0.3 | 8.7 |
| MT | 44 | 6 | 1.03 | 4.0 | 42.60 | 5.8 | 13.6 |
| NC | 140 | 14 | 10.04 | 3.5 | 13.94 | 1.4 | 10.0 |
| ND | 6 | 0 | 0.76 | 4.5 | 7.93 | 0.0 | 0.0 |
| NE | 20 | 4 | 1.90 | 3.8 | 10.55 | 2.1 | 20.0 |
| NH | 110 | 19 | 1.33 | 4.5 | 82.67 | 14.3 | 17.3 |
| NJ | 545 | 89 | 8.96 | 4.9 | 60.84 | 9.9 | 16.3 |
| NM | 348 | 89 | 2.09 | 4.6 | 166.90 | 42.7 | 25.6 |
| NV | 99 | 8 | 2.89 | 2.3 | 34.25 | 2.8 | 8.1 |
| NY | 635 | 102 | 19.80 | 4.0 | 32.08 | 5.2 | 16.1 |
| OH | 867 | 133 | 11.61 | 4.2 | 74.65 | 11.5 | 15.3 |
| OK | 71 | 4 | 3.91 | 3.4 | 18.15 | 1.0 | 5.6 |
| OR | 199 | 41 | 4.03 | 4.8 | 49.39 | 10.2 | 20.6 |
| PA | 459 | 57 | 12.80 | 4.4 | 35.85 | 4.5 | 12.4 |
| RI | 20 | 2 | 1.06 | 4.6 | 18.93 | 1.9 | 10.0 |
| SC | 76 | 6 | 4.90 | 3.6 | 15.52 | 1.2 | 7.9 |
| SD | 17 | 2 | 0.86 | 3.2 | 19.80 | 2.3 | 11.8 |
| TN | 175 | 51 | 6.60 | 3.2 | 26.51 | 7.7 | 29.1 |
| TX | 866 | 115 | 27.47 | 4.8 | 31.53 | 4.2 | 13.3 |
| UT | 235 | 32 | 3.00 | 4.9 | 78.44 | 10.7 | 13.6 |
| VA | 833 | 114 | 8.38 | 4.4 | 99.37 | 13.6 | 13.7 |
| VT | 61 | 17 | 0.63 | 7.5 | 97.44 | 27.2 | 27.9 |
| WA | 357 | 83 | 7.17 | 7.2 | 49.79 | 11.6 | 23.2 |
| WI | 119 | 18 | 5.77 | 4.1 | 20.62 | 3.1 | 15.1 |
| WV | 34 | 5 | 1.84 | 2.8 | 18.44 | 2.7 | 14.7 |
| WY | 31 | 3 | 0.59 | 3.2 | 52.89 | 5.1 | 9.7 |
| Overall | 16,863 | 2,715 | 320.83 | 4.7 | 52.56 | 8.5 | 16.1 |
SOURCE: DoE SBIR/STTR Program Office (awards and applications); National Science Foundation, Science and Engineering Indicators, Table 8-31 (number of scientists and engineers employed) 2015; U.S. Census Bureau (state populations). 103
TABLE 4-6 DoE Phase II SBIR Applications, Awards, Success Rates by State, FY 2005-2014
| State | No. of Apps | No. of Awards | Population (Millions) | Percent Share of Scientists and Engineers in the Workforce | No. of Applications per One Million in Pop | No. of Awards per One Million in Population | Success Rate (Percent) (Normalized for Pop) |
|---|---|---|---|---|---|---|---|
| AK | 0 | 0 | 0.74 | 4.6 | 0.0 | 0.0 | |
| AL | 16 | 7 | 4.86 | 4.0 | 3.3 | 1.4 | 43.8 |
| AR | 7 | 6 | 2.98 | 5.1 | 2.4 | 2.0 | 85.7 |
| AZ | 44 | 21 | 6.83 | 2.8 | 6.4 | 3.1 | 47.7 |
| CA | 469 | 233 | 39.14 | 5.8 | 12.0 | 6.0 | 49.7 |
| CO | 263 | 132 | 5.46 | 6.8 | 48.2 | 24.2 | 50.2 |
| CT | 70 | 42 | 3.59 | 4.8 | 19.5 | 11.7 | 60.0 |
| DC | 1 | 0 | 0.67 | 10.2 | 1.5 | 0.0 | 0.0 |
| DE | 35 | 16 | 0.95 | 5.4 | 37.0 | 16.9 | 45.7 |
| FL | 48 | 21 | 20.27 | 3.4 | 2.4 | 1.0 | 43.8 |
| GA | 24 | 7 | 10.21 | 4.3 | 2.3 | 0.7 | 29.2 |
| HI | 3 | 1 | 1.43 | 3.4 | 2.1 | 0.7 | 33.3 |
| IA | 1 | 0 | 3.12 | 3.5 | 0.3 | 0.0 | 0.0 |
| ID | 5 | 2 | 1.65 | 4.2 | 3.0 | 1.2 | 40.0 |
| IL | 54 | 23 | 12.86 | 4.1 | 4.2 | 1.8 | 42.6 |
| IN | 8 | 3 | 6.62 | 3.6 | 1.2 | 0.5 | 37.5 |
| KS | 9 | 5 | 2.91 | 3.7 | 3.1 | 1.7 | 55.6 |
| KY | 6 | 1 | 4.43 | 3.0 | 1.4 | 0.2 | 16.7 |
| LA | 0 | 0 | 4.67 | 2.6 | 0.0 | 0.0 | |
| MA | 377 | 192 | 6.79 | 6.9 | 55.5 | 28.3 | 50.9 |
| MD | 72 | 23 | 6.01 | 7.4 | 12.0 | 3.8 | 31.9 |
| ME | 3 | 3 | 1.33 | 2.9 | 2.3 | 2.3 | 100.0 |
| MI | 44 | 23 | 9.92 | 3.3 | 4.4 | 2.3 | 52.3 |
| MN | 22 | 11 | 2.99 | 5.4 | 7.4 | 3.7 | 50.0 |
| MO | 15 | 3 | 5.49 | 2.3 | 2.7 | 0.5 | 20.0 |
| MS | 2 | 0 | 6.08 | 5.1 | 0.3 | 0.0 | 0.0 |
| MT | 2 | 1 | 1.03 | 4.0 | 1.9 | 1.0 | 50.0 |
| NC | 15 | 7 | 10.04 | 3.5 | 1.5 | 0.7 | 46.7 |
| ND | 0 | 0 | 0.76 | 4.5 | 0.0 | 0.0 | |
| NE | 4 | 4 | 1.90 | 3.8 | 2.1 | 2.1 | 100.0 |
| NH | 18 | 7 | 1.33 | 4.5 | 13.5 | 5.3 | 38.9 |
| NJ | 84 | 43 | 8.96 | 4.9 | 9.4 | 4.8 | 51.2 |
| NM | 79 | 33 | 2.09 | 4.6 | 37.9 | 15.8 | 41.8 |
| NV | 9 | 5 | 2.89 | 2.3 | 3.1 | 1.7 | 55.6 |
| NY | 90 | 55 | 19.80 | 4.0 | 4.5 | 2.8 | 61.1 |
| OH | 127 | 61 | 11.61 | 4.2 | 10.9 | 5.3 | 48.0 |
| OK | 4 | 2 | 3.91 | 3.4 | 1.0 | 0.5 | 50.0 |
| OR | 40 | 20 | 4.03 | 4.8 | 9.9 | 5.0 | 50.0 |
| PA | 50 | 22 | 12.80 | 4.4 | 3.9 | 1.7 | 44.0 |
| RI | 2 | 1 | 1.06 | 4.6 | 1.9 | 0.9 | 50.0 |
| SC | 5 | 4 | 4.90 | 3.6 | 1.0 | 0.8 | 80.0 |
| SD | 1 | 0 | 0.86 | 3.2 | 1.2 | 0.0 | 0.0 |
| TN | 46 | 29 | 6.60 | 3.2 | 7.0 | 4.4 | 63.0 |
| TX | 115 | 50 | 27.47 | 4.8 | 4.2 | 1.8 | 43.5 |
| UT | 29 | 12 | 3.00 | 4.9 | 9.7 | 4.0 | 41.4 |
| VA | 112 | 49 | 8.38 | 4.4 | 13.4 | 5.8 | 43.8 |
| VT | 14 | 8 | 0.63 | 7.5 | 22.4 | 12.8 | 57.1 |
| WA | 81 | 40 | 7.17 | 7.2 | 11.3 | 5.6 | 49.4 |
| WI | 17 | 5 | 5.77 | 4.1 | 2.9 | 0.9 | 29.4 |
| WV | 5 | 1 | 1.84 | 2.8 | 2.7 | 0.5 | 20.0 |
| WY | 4 | 2 | 0.59 | 3.2 | 6.8 | 3.4 | 50.0 |
| Overall | 2,551 | 1,236 | 320.83 | 4.7 | 8.0 | 3.9 | 48.5 |
SOURCE: DoE SBIR/STTR Program Office (awards and applications); NSF Science and Engineering Indicators, Table 8-31 (number of scientists and engineers employed); U.S. Census Bureau (state populations). 105
The evidence overall suggests that low application rates do tend to generate low numbers of awards, but that low application rates themselves result partly from demographics (population) and partly from the distribution of science and engineering talent in the workforce. Given the merit-based selection of the program, however, it does not appear that efforts to generate more applications will necessarily lead to many more awards for low-award states.
New Entrants into the SBIR/STTR Programs and Multiple-Award Winners
New Entrants
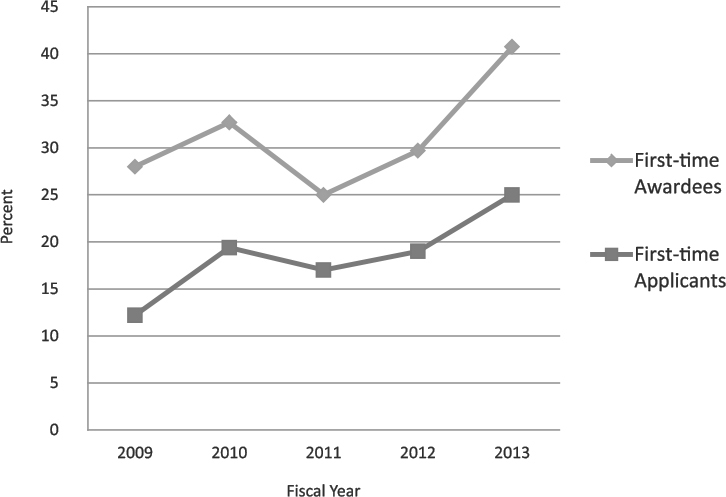
DoE data shown in Figure 4-20 indicate that the number of new applicants and first-time winners has expanded in recent years. In FY 2013, new awardees (companies that have not previously received an SBIR/STTR award from DoE) accounted for greater than 40 percent of all winners, while new applicants (companies that have not previously applied for DoE SBIR or STTR funding) accounted for 25 percent of all Phase I applicants.
SOURCE: DoE SBIR/STTR Program Office.
Multiple-Award Winners
Phase I SBIR/STTR awards at DoE are somewhat concentrated. The top 20 winners accounted for a total of 777 awards in FY 2005-2014, which is slightly less than 23 percent of all awards. (See Table 4-7.) In comparison, the top 20 winners at DoD accounted for 14.3 percent of Phase I SBIR awards.4
As to be expected, many of the same companies were also among the top 20 Phase II SBIR award winners. However, their ability to convert Phase I wins into Phase II awards varied substantially, with the Analysis and Measurement Services Corporation converting 80 percent of its Phase I projects into Phase II awards, while Physical Optics converted only about 40 percent. The top 20 winners’ share of all Phase II awards was slightly higher than that for Phase I, at 26.8 percent of all awards (see Table 4-8).
TABLE 4-7 Top 20 Companies Winning DoE Phase I SBIR/STTR Awards, FY 2005-2014.
| Company Name | Number of Phase I SBIR Awards | Number of Phase I STTR Awards | Total |
|---|---|---|---|
| Radiation Monitoring Devices | 89 | 2 | 91 |
| Tech-X Corporation | 88 | 88 | |
| Muons | 10 | 50 | 60 |
| TDA Research | 46 | 4 | 50 |
| Radiabeam Technologies | 33 | 6 | 39 |
| Calabazas Creek Research | 24 | 14 | 38 |
| Physical Sciences | 28 | 8 | 36 |
| Physical Optics Corporation | 36 | 36 | |
| Aerodyne Research | 28 | 8 | 36 |
| Euclid Techlabs | 32 | 2 | 34 |
| FAR-TECH | 31 | 2 | 33 |
| Compact Membrane Systems | 24 | 8 | 32 |
| Omega-P | 26 | 4 | 30 |
| Lynntech | 28 | 28 | |
| Niowave | 19 | 8 | 27 |
| Voxtel | 23 | 2 | 25 |
| Luna Innovations | 19 | 6 | 25 |
| Eltron Research & Development | 25 | 25 | |
| Ultramet | 22 | 22 | |
| Southwest Sciences | 20 | 2 | 22 |
| Total | 651 | 126 | 777 |
| Percentage of all DoE Phase I SBIR and STTR Awards | 22.8 |
SOURCE: DoE SBIR/STTR Program Office.
___________________
4National Research Council, SBIR at the Department of Defense, Washington, DC: The National Academies Press, 2014, Table 2-3.
TABLE 4-8 Top 20 DoE Phase II SBIR/STTR Award Winners, FY 2005-2014
| Company Name | Number of Phase II SBIR Awards | Number of Phase II STTR Awards | Total |
|---|---|---|---|
| Radiation Monitoring Devices | 52 | 52 | |
| Tech-X Corporation | 47 | 47 | |
| Muons | 7 | 28 | 35 |
| TDA Research | 26 | 2 | 28 |
| Aerodyne Research | 24 | 4 | 28 |
| Radiabeam Technologies | 20 | 3 | 23 |
| Euclid Techlabs | 18 | 2 | 20 |
| Compact Membrane Systems | 11 | 9 | 20 |
| Omega-P | 15 | 4 | 19 |
| Physical Sciences | 10 | 6 | 16 |
| FAR-TECH | 16 | 16 | |
| Calabazas Creek Research | 10 | 5 | 15 |
| Physical Optics Corporation | 14 | 14 | |
| Niowave | 10 | 4 | 14 |
| Voxtel | 13 | 13 | |
| Analysis and Measurement Services Corporation | 10 | 2 | 12 |
| Luna Innovations | 9 | 2 | 11 |
| Eltron Research & Development | 11 | 11 | |
| Composite Technology Development | 9 | 2 | 11 |
| XIA | 7 | 3 | 10 |
| Total | 339 | 76 | 415 |
| Percentage of all DoE Phase II SBIR and STTR Awards | 26.8 |
SOURCE: DoE SBIR/STTR Program Office.
Implications of Multiple-Award Winners
Multiple-award winners are sometimes pejoratively referred to as SBIR/STTR trolls, and some observers have raised questions about whether the government should provide awards to many of the same firms over an extended period, the opportunity cost of backing a single company many times being that a new company goes unfunded.
Having a sizable percentage of awards going to a relatively small subset of awardees, which include mature companies as well as startups, is not per se evidence of a problem, but it is worth probing. There are several reasons why a given company might seek and receive multiple SBIR or STTR awards:
- The company is meeting agency mission needs by providing innovative solutions.
- More resources are required to develop the technology and move it to commercial readiness than is provided by a single award and reasonable progress is being made.
- The company has developed a platform technology suitable for deployment in multiple application areas, each with unique challenges and expected business opportunities.
- The company specializes in research with a business model that focuses on licensing or selling its intellectual property rather than in-house product development.
If the application is consistent with the agency’s published topic list, if reviewers find the proposed technology development promising without major shortcomings and the business plan reasonable, and if the agency’s program managers find that the proposal competitively aligns with DoE interests relative to other applications, an application may be approved despite previous awards to the same applicant. There is no selection criterion that requires that a company be a first-time applicant or that imposes a limit on how many previous times it may have applied or on how many awards it has received.
Some argue that startups or young companies have a greater job creation impact than mature companies.5 Others argue that since young firms have fewer internal resources and the market has less information about them, asymmetries in capital market are more likely to affect their R&D investments.6 Alternatively, it can be argued that the specific idea that is proposed, rather than the age of the company, is what matters most. The latter position allows for the fact that mature small companies may seek to renew their technology base by pursuing innovative proposals. In that case, an existing knowledge of markets, an experienced workforce, and internal funding may well position an innovating mature company’s renewal project. In any case, DoE’s SBIR/STTR programs have not elected to impose a constraint on the age of the company or on its principal investigator; rather their focus is on assessment of the proposed project.
To ensure that the current approach is serving DoE’s program interest, it is essential that the selection criteria and process are functioning as intended. Poorly designed and repetitive topic lists might lead to incremental or irrelevant project proposals. Reviewers who are not experts in the field may not adequately distinguish significant advances from small incremental improvements. Program Managers who do not give adequate attention to the SBIR/STTR selection process may approve yet more awards to companies who have failed to
___________________
5 J. Haltiwanger, R.S. Jarmin, and J. Miranda, “Who Creates Jobs? Small versus Large versus Young,” Review of Economics and Statistics 95: 347-361, 2013. Also see Evans, D. S. 1987. The relationship between firm growth, size, and age: Estimates for 100 manufacturing industries. The Journal of Industrial Economics, 567-581; and Calvo, J. L. 2006. Testing Gibrat’s law for small, young and innovating firms. Small Business Economics, 26(2), 117-123.
6 Hall, B. H. 2008. The financing of innovation. In S. Shane (ed.), Handbook of Technology and Innovation.
demonstrate results in the past. However, such an undesirable outcome would result from a failure of implementing the process rather than to a weakness in its inherent design. Therefore, there appears no compelling reason at this time to recommend that the number of awards per company or the age of company applicants or principal Investigators be constrained. At the same time, it is prudent that DoE monitor the percentage of multiple awards and the composite age of company applicants (e.g., ratio of startups to mature companies) who are applying for and receiving awards. Careful monitoring and study should inform the question of whether “small” or “young” companies are more effective in generating state-of-the-art technology and innovation in the context of SBIR. This evidence can be used by Congress to determine if encouraging participation by younger firms furthers the missions of the SBIR program.


