
1
Introduction
BACKGROUND
Since 1969, the National Assessment of Educational Progress (NAEP) has been providing policy makers, educators, and the public with reports on the academic performance and progress of the nation’s students. The assessment is given periodically in a variety of subjects: mathematics, reading, writing, science, the arts, civics, economics, geography, U.S. history, and technology and engineering literacy. NAEP is often referred to as The Nation’s Report Card because it reports on the educational progress of the nation as a whole. The assessment is not given to all students in the country, and scores are not reported for individual students. Instead, the assessment is given to representative samples of students across the country, and scores are reported only for groups of students. During the first decade of NAEP, results were reported for the nation as a whole and for students grouped by social and demographic characteristics, including gender, race and ethnicity, and socioeconomic status.
Over time, there was a growing desire to compare educational progress across the states. At the same time, there was an increasing desire to report the results in ways that policy makers and the public could better understand and to examine students’ achievement in relation to world-class standards. By 1988, there was considerable support for these changes.
The Elementary and Secondary Education Act of 1988 authorized the formation of the National Assessment Governing Board (NAGB) and gave it responsibility for setting policy for NAEP and “identifying appro-
priate achievement goals” (P.L. 100-297, Part C, Sec. 3403(6)(A)). In part in response to this legislation, NAGB decided to report NAEP results in terms of achievement levels, and that reporting began with the 1992 assessments.
Three achievement levels are used: “Basic,” “Proficient,” and “Advanced.” Results are reported according to the percentage of test takers whose scores are at each achievement level, and brief descriptions of the levels are provided with the results.1 The percentage of test takers who score below the Basic level is also reported: Figures 1-1a through 1-6a in the Annex to this chapter show an example of this type of reporting.
The purpose for setting achievement levels was explicitly stated (National Assessment Governing Board, 1993, p. 1) for NAEP:
[to make it] unmistakably clear to all readers and users of NAEP data that these are expectations which stipulate what students should know and should be able to do at each grade level and in each content area measured by NAEP. The achievement levels make the NAEP data more understandable to general users, parents, policymakers and educators alike. They are an effort to make NAEP part of the vocabulary of the general public.
In the ensuing 25 years, the use of achievement levels has become a fixture of the reporting of test results, not only for NAEP, but also for a number of other testing programs. Notably, the No Child Left Behind Act of 2001 required that all states set achievement levels for their state tests, and many used the same names for achievement levels as those used by NAEP.
Given the potential value to the nation of setting achievement levels for NAEP and the importance of “getting it right,” the procedures and results have received considerable scrutiny. Before achievement-level results were reported for the 1992 mathematics and reading, numerous evaluations were conducted, including Stufflebeam et al. (1991), and Linn et al. (1992a), which focused on the 1990 mathematics results; the U.S. General Accounting Office (1993), which focused on the 1992 mathematics results; and Shepard et al. (1993), which covered the 1992 mathematics and reading results.
These reviews raised numerous concerns about the ways that NAEP’s achievement levels were developed and the extent to which they would support the intended interpretations. The reviews generally concluded that (1) the achievement levels were not necessarily valid indicators of educators’ judgments of what students should know and be able to do
__________________
1 We use the words “description” and “descriptor” interchangeably in discussing achievement levels, as is done in the field.
and (2) the achievement-level descriptors were not accurate representations of the NAEP assessments and frameworks.
When NAEP was up for reauthorization in 1994, Congress stipulated that the achievement levels be used only on a “trial basis until the Commissioner [of the National Center for Education Statistics] determines, as a result of an evaluation, that such levels are reasonable, valid, and informative to the public” (P.L. 107-110 (2002), Sec. 602(e)). Since that time, achievement-level reports have carried a footnote indicating that they are trial—a provisional status that has remained for 25 years.
In 2014, the U.S. Department of Education sought to reexamine the need for the provisional status of the NAEP achievement levels, and it requested a study under the auspices of the National Research Council to conduct this examination. The work was carried out under the auspices of two standing activities in the Division of Behavioral and Social Sciences and Education: the Board on Testing and Assessment and the Committee on National Statistics. Together, the two boards established the Committee on the Evaluation of NAEP Achievement Levels for Mathematics and Reading. The 15 committee members, who served as volunteers, had a broad range of expertise related to assessment, education policy, mathematics and reading, program evaluation, social science, and statistics.
The following statement of task guided the committee’s work:
An ad hoc committee will conduct an evaluation of the student achievement levels that are used in reporting results of the National Assessment of Educational Progress (NAEP) assessments in reading and mathematics in grades 4, 8, and 12 to determine whether the achievement levels are reasonable, reliable, valid, and informative to the public. The committee will review the achievement level-setting procedures used by the National Assessment Governing Board and the National Center for Education Statistics, the ways that the achievement levels are used in NAEP reporting, the interpretations made of them and the validity of those interpretations, and the research literatures related to setting achievement levels and reporting test results to the public. The committee will write a final report that describes its findings about the achievement levels and how the levels are used in NAEP reporting. If warranted, the committee’s report will also provide recommendations about ways that the setting and use of achievement levels for NAEP can be improved.
To address its charge, the committee held three in-person meetings and four half-day virtual meetings during 2015. Before discussing our approach to the study, we provide some background on the process for developing achievement levels, or, more generally, standard setting and on the key features of NAEP.
STANDARD SETTING
Translating NAEP scale scores into achievement levels involves a process referred to as standard setting, in which different levels of performance are identified and described, and the test scores that distinguish between the levels are determined. Box 1-1 defines the terms often used with standard setting.
Standard setting involves determining “how good is good enough” in relation to one or more achievement or performance measures. For instance, educators use it regularly to assign grades (e.g., how good is good enough for an A or a B). In employment settings, it has long been used to determine the minimum test score needed to become certified or licensed to practice in a given field: examples include medical board tests for doctors, licensing tests for nurses, bar examinations for lawyers, and certification examinations for accountants. In these education and
employment examples, a concrete criterion can be stated: What material should a student know and be able to do to receive an A in a course? What should a prospective practitioner know and be able to do to practice safely and effectively in a given field?
All standard setting is based on judgment. For a course grade, it is the judgment of the classroom teacher. For a licensure or certification test, it is the judgment of professionals who work in the field. For NAEP, it is more complicated. As a measure of achievement for a cross-section of U.S. students, NAEP’s achievement levels need to reflect common goals for student learning—despite the fact that students are taught according to curricula that vary across states and districts. To accommodate this variation, NAEP’s standards needed to reflect a wide spectrum of judgments about what achievement was intended by those who chose the curricula.
For large-scale tests such as NAEP, standard setting is a formal pro-
cess, with guidelines for how it should be done. Generally, the process involves identifying a set of individuals with expertise in the relevant areas, recruiting them to serve as standard setting panelists, training them to perform the standard setting tasks, and implementing the procedures to obtain their judgments. There are two outcomes of the process: (1) a detailed description of what students at each achievement level should know and can do and (2) the cut score that marks the minimum score needed to be placed at a given achievement level.
There are many methods for conducting standard settings. They differ in the nature of the tasks that panelists are asked to do and the types of judgments they are asked to make. There is no single “right” method; the choice of method is based on the kinds of question formats (e.g., multiple choice, short answer, extended response), various characteristics of the assessment and its uses, and often the experiential base of those conducting the standard setting. Regardless of the method chosen, the most critical issue is that the process is carried out carefully and systematically, following accepted procedures.
The ALDs and corresponding cut scores are intended to reflect performance as defined through a subject-area framework (see below). Each assessment is built around an organizing framework, which is the blueprint that guides the development of the assessment instrument and determines the content to be assessed.
For NAEP, the frameworks capture a range of subject-specific content and thinking skills needed by students to deal with what they encounter, both inside and outside their classrooms. The NAEP frameworks are determined through a development process designed to ensure that they are appropriate for current educational requirements. Because the assessments must remain flexible to mirror changes in educational objectives and curricula, the frameworks are designed to be forward-looking and responsive, balancing current teaching practices with research findings.2
There is an assumed relationship between a subject-area framework and other elements of the assessment. First, given that the stated purpose of a framework is to guide the development of items for the assessment, there must be a close correspondence between a framework and the assessment items.3
__________________
2 For NAEP’s description of the frameworks, see http://nces.ed.gov/nationsreportcard/frameworks.aspx [January 2016]. Item specifications for reading can be found at https://www.nagb.org/publications/frameworks/reading/2009-reading-specification.html [August 2016]. Item specifications for mathematics can be found at https://www.nagb.org/publications/frameworks/mathematics/2009-mathematics-specification.html [August 2016].
3 For each assessment, the framework is supplemented with a set of Assessment Specifications that provided additional details about developing and assembling a form of the test.
Second, given that NAGB intends the achievement levels and the frameworks to remain stable over several test administrations (while actual items will change with each administration), the frameworks must serve as the pivotal link between the assessments and the achievement levels—both as they are described narratively and as they are operationalized into item-level judgments and, ultimately, cut scores. Ideally, this would mean that ALDs are crafted concurrently with the framework (see Shepard et al., 1993, p. 47; also see Bejar et al., 2008).
In principle, then, the ALDs should guide test development so that the tests are well aligned to the intended constructs (concepts or characteristics) of interest. The ALDs guide standard setting so that panelists can operationalize them in terms of cut scores with the same conceptualization used by item writers. To the extent that tests are well aligned to the ALDs, the latter reflect the knowledge and skills possessed by the students at or above each cut score. Therefore, the descriptors used in score reporting actually represent the observed skills of students in a particular achievement-level category (Egan et al., 2012; Reckase, 2001). Figure 1-1 shows the assumed relationships.
KEY FEATURES OF NAEP
NAEP consists of two different programs: main NAEP and long-term trend NAEP. Main NAEP is adjusted as needed so that it reflects current thinking about content areas, assessment strategies, and policy priorities, but efforts are made to incorporate these changes in ways that do not disrupt the trend line. Main NAEP is the subject of this report. Long-term trend NAEP, in contrast, provides a way to examine achievement trends with a measure that does not change; these assessments do not incorporate advances in content areas or assessment strategies. Both main and long-term trend NAEP differ fundamentally from other testing programs in that its objective is to obtain accurate measures of academic achievement for groups of students rather than for individuals. This goal is achieved using innovative sampling, scaling, and analytic procedures.
The rest of this section and, indeed, the entire report is about main NAEP.
Sampling of Students4
Because NAEP uses probability sampling methods that yield a representative sample of students so that results can be generalized to the
__________________
4 This section describes the sampling design for the mathematics and reading assessments only.
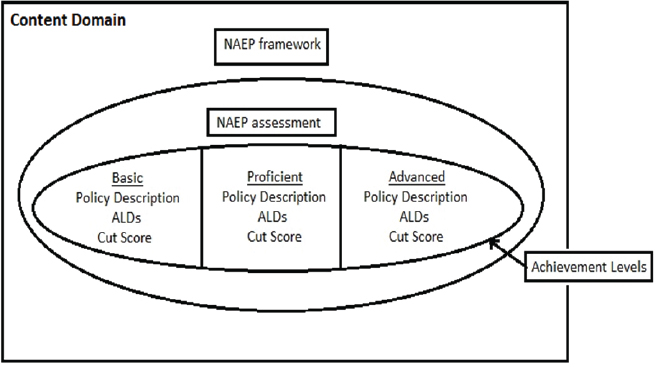
NOTE: ALDs = achievement-level descriptors.
SOURCE: Adapted from Reckase (2001, p. 239).
larger population, NAEP assesses a relatively small proportion of the U.S. student population. Historically, there have been two samples: one for the national assessment and one for the state assessments, initially referred to as the Trial State Assessment Program. This approach was changed with the implementation of the No Child Left Behind Act of 2001, which mandated state participation. To comply with that mandate, a sampling plan was created for each state, and the national sample became an aggregation of the state samples. With the introduction of the Trial Urban District Assessment (TUDA), a sampling plan was created for each participating urban district. At that point, for the states with TUDAs, the state sample was augmented by the TUDA sample. However, the two could be separated for analysis purposes. The national samples for NAEP are selected using stratified multistage sampling designs with three stages of selection: districts, schools, and students. The result is a sample of about 150,000 students sampled from 2,000 schools. The sampling design for state NAEP has only two stages of selection: schools and students within schools. The results are samples of approximately 3,000 students in 100 schools per state (roughly 100,000 students in 4,000 schools nationwide).
For the national assessment in 1992, approximately 26,000 4th-, 8th-, and 12th-grade students in 1,500 public and private schools across the country participated in the national assessment. For jurisdictions that participated in the separate state program, approximately 2,500 students
were sampled from approximately 100 public schools for each grade and curriculum area. Thus, a total of approximately 220,000 4th- and 8th-grade students who were attending nearly 9,000 public schools participated in the 1992 trial state assessments. In 1996, between 3,500 and 5,500 students were tested in mathematics and science and between 4,500 and 5,500 were tested in reading and writing (Campbell et al., 1997).
Sampling of Items
NAEP assesses a cross-section of the content within a subject-matter area. Because of the large number of content areas and subareas within them, NAEP uses a matrix sampling design to assess student achievement in each subject. Using this design, different blocks of items drawn from the overall content domain are administered to different groups of students: this approach makes it possible to administer a large number and range of items while keeping individual testing time to 1 hour for all subjects. Students receive different but overlapping sets of NAEP items using a form of matrix subsampling known as balanced incomplete block spiraling. This design requires highly complicated analyses and does not permit the performance of a particular student to be accurately measured. Therefore, NAEP reports only group-level results; individual results are not reported.
Analytic Procedures
Although individual results are not reported, it is possible to compute estimates of individuals’ performance on the overall assessment using complex statistical procedures. The observed data reflect student performance over the particular NAEP blocks each student actually took. Because no individual takes all NAEP blocks, statistical estimation procedures are used to derive estimates of individuals’ proficiency on the full complement of skills and content covered by the assessment, on the basis of the test blocks that an individual took.
The procedure involves combining samples of values drawn from distributions of possible proficiency estimates for each student. These individual student distributions are estimated from their responses to the test items and from background variables. The use of background variables in estimating proficiency is called conditioning. For each student, five values, called plausible values, are randomly drawn from the student’s distribution of possible proficiency estimates.5 The plausible values are intended to reflect the uncertainty in each student’s proficiency estimate,
__________________
5 Beginning with the 2013 analysis, the number of plausible values was increased to 20.
given the limited set of test questions taken by each student. The sampling from the student’s distribution is an application of Rubin’s (1987) multiple imputation method for handling missing data (the responses to items not presented to the student are considered missing). In the NAEP context, this process is called plausible values methodology (National Research Council, 1999).
Statistics Reported
NAEP currently reports student performance on the assessments using a scale that ranges from 0 to 500 for 4th- and 8th-grade mathematics and for all grades in reading. Originally, 12th-grade mathematics results were also reported on this scale; the scale was changed to a range of 0 to 300 when the framework was revised in 2004-2005 (see Chapter 5). Scale scores summarize performance in a given subject area for the nation as a whole, for individual states, and for subsets of the population defined by demographic and background characteristics. Results are tabulated over time to provide trend information. As described above, NAEP also reports performance using achievement levels.
NAEP collects a variety of demographic, background, and contextual information from students, teachers, and administrators. Student demographic and academic information includes characteristics, such as race and ethnicity, gender, highest level of parental education, and status as a student with disabilities or an English-language learner. Contextual and environmental data provide information about students’ course selection, homework habits, use of textbooks and computers, and communication with parents about schoolwork. Information obtained from teachers includes the training they received, the number of years they have taught, and the instructional practices they use. Information obtained from administrators covers their schools, including the location and type of school, school enrollment numbers, and levels of parental involvement. NAEP summarizes achievement results by these various characteristics.6
COMMITTEE APPROACH
The committee held three in-person meetings and four half-day virtual meetings during 2015. The first two meetings included public sessions at which the committee gathered a great deal of information. At the first meeting, officials from NAGB and the National Center for Education Statistics (NCES) described their goals for the project and discuss the
__________________
6 Results from the most recent tests can be found at http://nces.ed.gov/nationsreportcard/about/current.aspx [February 2016].
types of information available to the committee. At the second meeting, a half-day public forum provided an opportunity for people to talk about how they interpret and use the reported achievement levels. This public forum was organized as five panel discussions, each focused on a type of audience for NAEP results: journalists and education writers, state policy users, developers of the assessments designed to be aligned with the Common Core State Standards, research and advocacy groups, and a synthesis panel with two experts in standard setting. See Appendix A for the forum agenda.
Evaluation Questions
As noted above, the committee’s charge was to develop a set of criteria with which to evaluate NAEP achievement levels. Our charge asked us to respond to a question for which a “yes” or “no” response would suffice. We interpreted that question as follows: to what extent are the NAEP achievement levels reasonable, reliable, valid, and informative to the public?
We designed our evaluation accordingly. It is important to point out that the four factors—reasonable, reliable, valid, and informative—are interrelated and cannot be evaluated in isolation of each other. In addition, they are connected by the underlying purpose(s) of achievement-level reporting: that is, what are the intended uses of achievement levels? For example, in making judgments about reliability, one needs to consider what types of inferences will be made and the decisions and consequences that will result from those inferences. The same is true for validity: valid for what inferences, what interpretations, and what uses?
Thus, the committee chose not to organize its work and this report around each factor separately. Instead, we organized our review around three types of evidence to support the validity and use of achievement-level reporting: the process of setting standards, the outcomes of the standard setting, the cut scores, and the ALDs, and the interpretations and uses of achievement levels. We identified a set of questions to guide our data collection for each factor. We also considered this information in relation to the Standards for Educational and Psychological Testing (American Educational Research Association et al.; hereafter referred to as Standards), both the most current version (2014) and the version in use at the time the achievement levels were developed (1985). Box 1-2 lists the questions we posed for our work.
- general (publicly available) background information about NAEP, such as its purpose and intended uses, reading and mathematics frameworks, item pools and test specifications, item types, reporting mechanisms;
- reports of results of NAEP assessments of reading and mathematics and the corresponding interpretation guidance;
- interactive reporting tools available on the NAEP Websites;
- historical documentation of the policy steps involved in creating the achievement levels for reading and mathematics;
- technical documentation of standard setting procedures (setting the cut scores, developing detailed ALDs), and associated analyses;
- reports from prior external evaluations of the extent to which the achievement levels are reliable, valid, reasonable, and informative to the public;
- reports from internal evaluations (generally by or for NAGB) of the extent to which the achievement levels are reliable, valid, reasonable, and informative to the public, along with responses (and actions taken) to the criticisms made in the external evaluations;
- empirical studies of the reliability, validity, usefulness, and “informativeness” of the achievement levels and achievement-level reporting, including studies of the effects of using various procedures for establishing the cut scores;
- professional standards with regard to standard setting (e.g., those of the American Educational Research Association, the American Psychological Association, and the National Council on Measurement in Education);
- edited volumes and other scholarly literature from well-known experts in the field of standard setting, summarizing research and empirical studies and offering insights and advice on best practice;
- subjective accounts about achievement-level reporting, including opinion pieces, commentaries, newspaper columns and articles, blogs, tweets, conference and workshop presentations, and public forums; and
- other reports prepared by research and policy organizations about specific aspects of achievement-level reporting for NAEP.
Our use of these data sources varied. When drawing conclusions from the empirical evidence, we gave precedence to results from analyses published in peer-reviewed journals. However, as is often the case with evaluations, these types of reports were scarce. To compensate for this
limitation, the committee placed the greatest weight on evidence that could be corroborated through multiple sources.
There have been numerous literature reviews summarizing the results of these studies and offering advice on best practices. In order to be able to address our charge within the allotted time period, we reviewed several compendia and edited volumes by well-respected experts in the field of standard setting. These documents are well known in the measurement field, and the various chapters cover an array of views. Specifically, we relied on the following documents, listed in chronological order:
- a special issue of the Journal of Educational Measurement (National Council on Measurement in Education, 1978)
- Jaeger (1989)
- a special issue of Educational Measurement: Issues and Practice (Nitko, 1991)
- Crocker and Zieky (1995a, 1995b)
- Bourque (1998, 2009) and Bourque and Byrd (2000)
- Cizek (2001)
- Hambleton and Pitoniak (2006)
- Cizek (2012)
The committee received a great deal of information from the sponsor, the U.S. Department of Education. However, after we sent a prepublication copy of the report to the department (but before its public release, following institutional practice), the department informed the committee that there were three other reports that had not been provided to us. The reports document studies of the extent to which the item pool and the ALDs are aligned and the resulting changes made to improve alignment. One study was conducted in 2003 (Braswell and Haberstroh, 2004); two others were conducted in 2009, when changes were made to the mathematics framework for grade 12 and the reading framework for all grades (4, 8, and 12) (Pitoniak et al., 2010; Donahue et al., 2010).7 Because of this new information, the committee needed additional time to analyze the reports and incorporate conclusions from them in our report. We indicate in Chapters 5, 7, and 8 where the text was changed after the original transmittal to reflect the new information.
The Department of Education also noted several places in the report at which there were small factual errors. Several recommendations were reworded because they misstated the agency responsible for a proposed action. These changes were reviewed in accordance with institutional
__________________
7 Copies of these studies can be obtained by the Public Access Records Office by phone (202-334-3543) or email (paro@nas.edu).
policy and are noted in the Summary and Chapter 8. We added a brief description of the item-rating process during the standard setting, which is noted in Chapter 3. And, as a result of some of these other changes, we added a new Conclusion (7-1), which is noted in the Summary and Chapters 7 and 8.
The late information received from the Department of Education has added to the richness of the information in this report. However, it has not in any way changed the committee’s fundamental conclusions and recommendations.
Guide to the Report
The report is organized around our evaluation questions. Chapter 2 provides additional context about the origin of achievement levels for NAEP, the process for determining them, and the evaluations of them. It also discusses changes in the field of standard setting over the past 25 years. Chapter 3 discusses the evidence we collected on the process for setting achievement levels.
Chapters 4 and 5, respectively, consider the evidence of the reliability and validity of the achievement levels. Chapter 6 discusses the intended uses of the achievement levels and the evidence that supports those uses, along with the actual uses of the levels and common misinterpretations.
In Chapter 7, we explore the issues to consider in deciding whether a new standard setting is needed, and we present our recommendations in Chapter 8.
ANNEX: EXAMPLE OF ACHIEVEMENT-LEVEL REPORTING FOR NAEP
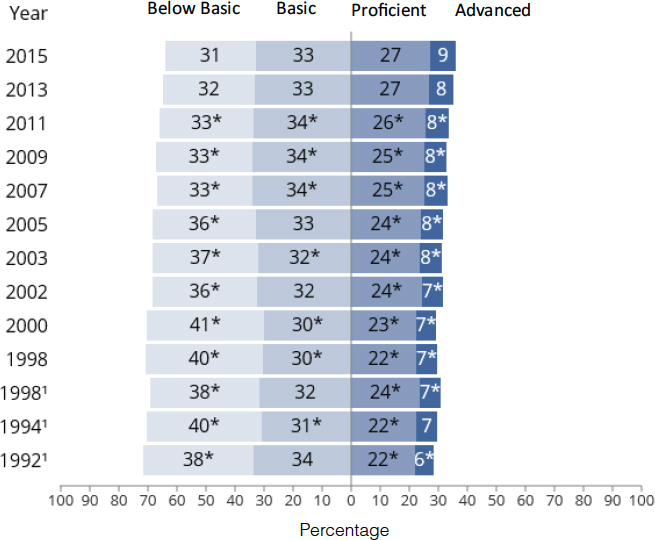
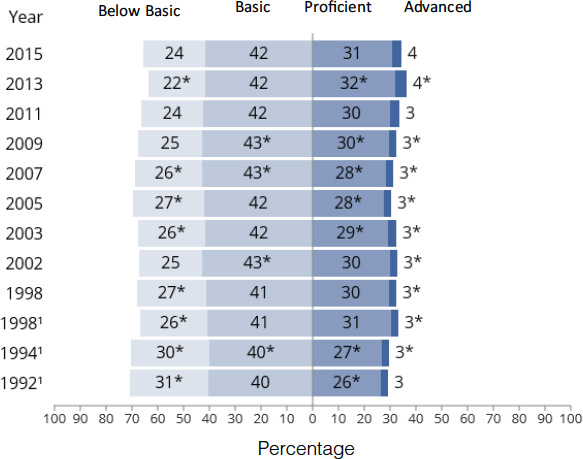
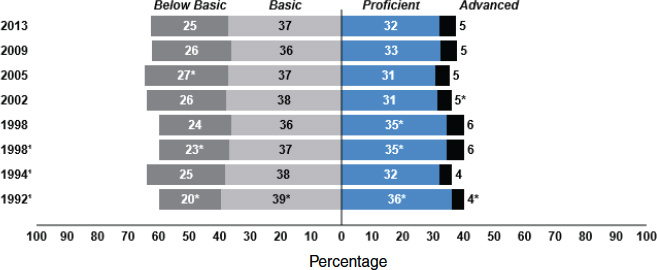
The six bar charts in this Annex show the percentage of test takers who scored at each achievement level—Basic, Proficient, and Advanced—for mathematics and reading for grades 4, 8, and 12. The percentage scoring below the basic level also is reported.
The bar charts display trend information for each subject area and grade and allow the user to see changes in achievement over time. The figures show the percentages of test takers at each level for the year in which achievement-level reporting first began (1990 for mathematics, 1992 for reading) through the most recent year available at the time this report was prepared (2015 for grades 4 and 8, 2013 for grade 12). For grade-12 mathematics, only 3 years of results are shown because the standard setting was redone in 2005.
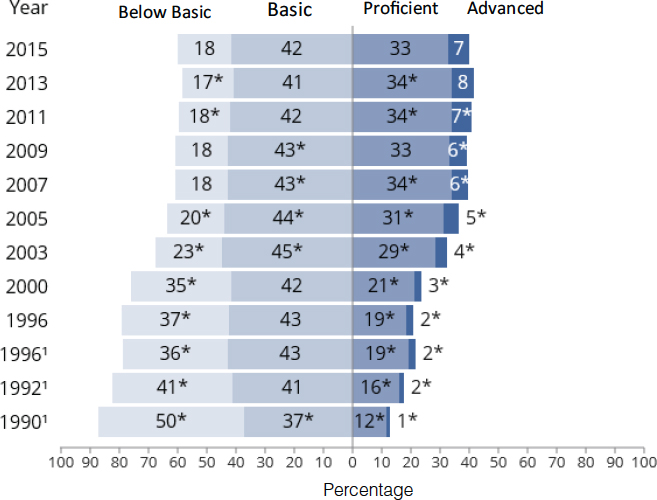
NOTES: Percentage-point differences are calculated based on the differences between unrounded percentages. *Significantly different (p < .05) from 2013. 1Accommodations not permitted.
SOURCE: The Nation’s Report Card (2015b).
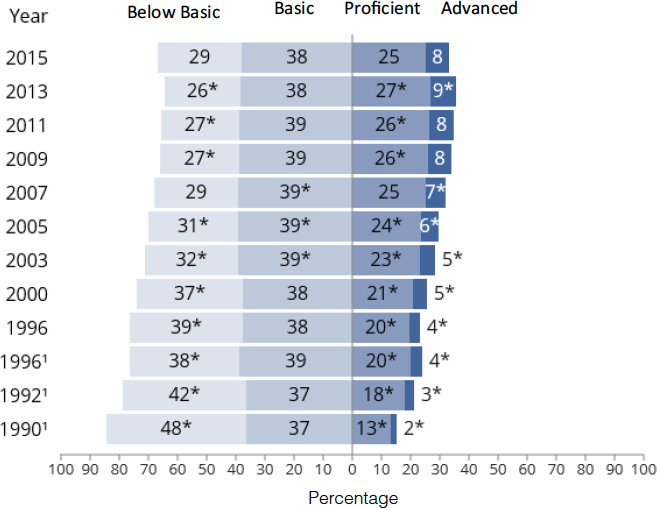
NOTES: Percentage-point differences are calculated based on the differences between unrounded percentages. *Significantly different (p < .05) from 2015. 1Accommodations not permitted.
SOURCE: The Nation’s Report Card (2015d).
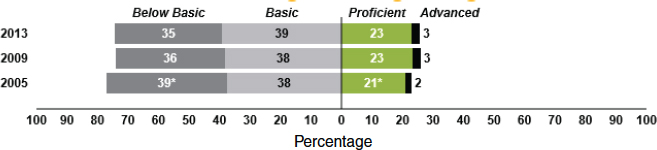
SOURCE: The Nation’s Report Card (2013a).
NOTES: Percentage-point differences are calculated based on the differences between unrounded percentages. *Significantly different (p < .05) from 2015. 1Accommodations not permitted.
SOURCE: The Nation’s Report Card (2015c).
NOTES: Percentage-point differences are calculated based on the differences between unrounded percentages. *Significantly different (p < .05) from 2015. 1Accommodations not permitted.
SOURCE: The Nation’s Report Card (2015e).
SOURCE: The Nation’s Report Card (2013a).


