
6
Interpretations and Uses of NAEP Achievement Levels
Chapters 3 through 5 discuss the available evidence on the reliability and validity of the NAEP achievement levels in reading and mathematics and the procedures for determining them. In this chapter, we turn to the interpretations and uses of the achievement levels. We consider the findings and conclusions presented in Chapters 3-5 in light of the inferences that are based on achievement levels. We discuss interpretations and uses in terms of those intended by the developers of the achievement levels—the National Assessment Governing Board (NAGB)—and those actually made by the various stakeholders and audiences for NAEP. We also consider the kinds of guidance and instructions that accompany NAEP achievement-level reports and the extent to which they promote appropriate interpretations and uses.
RELEVANT STANDARDS AND COMMITTEE SOURCES
The current Standards for Educational and Psychological Testing (American Educational Research Association et al., 2014) (hereafter, Standards) include the following guidance on use and interpretation. With regard to collecting validity evidence to support specific uses and interpretations:
- Testing programs should set forth clearly how test scores are intended to be interpreted and used, to delineate the populations(s) for which a test is intended, and to clearly describe the construct(s) the test is intended to assess (Sec. 1.1).
- A rationale should be presented for each intended interpretation of test scores for a given use, together with a summary of the evidence and theory bearing on the intended interpretation (Sec. 1.2).
- If validity for some common or likely interpretation for a given use has not been evaluated, or if such an interpretation is inconsistent with available evidence, that fact should be made clear and potential users should be strongly cautioned about making unsupported interpretations (Sec. 1.3).
With regard to reporting and interpretive guidance, three standards are relevant:
- When test score information is released, those responsible for testing programs should provide interpretations appropriate to the audience. The interpretations should describe in simple language what the test covers, what scores represent, the precision/ reliability of the scores, and how scores are intended to be used (Sec. 6.10).
- When test results are released to the public or to policy makers, those responsible for the release should provide and explain any supplemental information that will minimize possible misinterpretations of the data (Sec. 9.8).
- Those responsible for the development and use of tests for evaluation or accountability purposes should take steps to promote accurate interpretations and appropriate uses for all groups for which results will be applied (Sec. 13.5).
The committee examined the following materials to gather information about interpretations and uses:
- NAEP policy statements (National Assessment Governing Board, 1990, 1993, 1995, 2006);
- guidance in reports of results, such as in the First Look reports;
- materials collected directly by NAGB and the National Center for Education Statistics (NCES) and through their contractor, Hager Sharp (summaries of media reports on NAEP results);
- material from the Council of Great City Schools (Casserly et al., 2011) on use of district-level data;
- review of NAEP’s online data tool and other online features of the NAEP Website;1 and
__________________
1 See http://www.nationsreportcard.gov [March 2016].
- formal studies of NAEP users and their uses (e.g., Hambleton and Slater, 1995; Jaeger, 2003; Simmons and Mwalimu, 2000; Zenisky et al., 2009; Bourque and Boyd, 2000; National Research Council, 2001; Buckendahl et al., 2009).
To supplement the information above, we also conducted our own online search for reports and discussions of achievement-level results, such as in newspaper articles, blogs, and opinion pieces; press releases by states; state report cards; and reports that use results to argue for certain policy actions (see the Annex at the end of this chapter). To further explore interpretations and uses, we convened a half-day public forum on May 27, 2015, to hear stakeholders present their views and experiences about achievement-level results (see the agenda in Appendix A).
INTENDED USERS, INTERPRETATIONS, AND USES
Users
NAEP materials provide some guidance on intended users and uses. NAGB’s initial policy statement for achievement-level reporting identified parents and policy makers as the primary users (National Assessment Governing Board, 1990, p. 1). This policy was revised 3 years later and included a somewhat expanded list of users: the general public, parents, policy makers, and educators (National Assessment Governing Board, 1993, p. 1). The policy statement was revised again in 1995, primarily to offer guidance for implementing standard settings, and did not change the statement about primary users.
A more recent policy statement addresses NAEP data broadly, that is, all reports rather than just achievement-level reporting: “The Nation’s Report Card shall seek to encourage wide public attention to NAEP results and clear understanding of their meaning and significance” (p. 5).2 It names certain officials—governors, chief state school officers, and superintendents of the Trial Urban District Assessment (TUDA) districts—as the NAEP primary audiences. Specifically, it states: “The Nation’s Report Card shall be distributed promptly to” these groups at the time of release” (p. 6). The dissemination statement identifies another set of users as the “key audience” for dissemination materials: “[T]he interested general public, policymakers, teachers, administrators, and parents” (p. 7).
__________________
2 See 2006 NAEP Policy Statement on the Reporting, Release, and Dissemination of NAEP Results at https://www.nagb.org/content/nagb/assets/documents/policies/Reporting,%20Release,%20and%20Dissemination%20of%20NAEP%20Results.pdf [February 2016].
Other similar lists of users appear in academic research specifically focused on users and uses. For example, Jaeger (2003) identified seven potential audiences for NAEP results:
- federal level (executive branch, Congress),
- state level (executive branch and legislatures,
- district level (administrators, professional staff, and school board members),
- school level,
- general public,
- press, and
- education researchers.
Similar lists of potential audiences appear in Hambleton and Slater (1995); Jaeger (1989); Zenisky et al. (2009); Bourque and Boyd (2000); National Research Council (2001); Buckendahl et al. (2009).
Box 6-1 shows the information we gathered: the various types of users, common inferences and interpretations they make, and actions that are commonly taken on the basis of the results. In the next section, we explore each in more depth.
Uses
NAEP materials are not entirely explicit about the intended uses of achievement-level results. The initial policy statement (National Assessment Governing Board, 1990, p. 1) stated:
[Achievement levels] will make the Assessment far more useful to parents and policy makers as a measure of performance in American schools and perhaps as an inducement to higher achievement. The achievement levels will be used for reporting NAEP results in a way that greatly increases their value to the American public.
Embedded in this policy statement, however, are implicit references to the kinds of uses NAGB intended:
- [Along with the frameworks] define a common core of learning important for all U.S. students.
- Establish benchmarks for attaining competency in challenging subject matter.
- Measure the extent to which students have met these benchmarks (at different levels of the system and across different subgroups).
- Increase the significance of NAEP results.
- Through reporting, create incentives for actions that will improve the learning of all students (e.g., setting higher standards at the state level, reviewing/revising curriculum, etc.).
This policy was revised 3 years later, shortly after the first set of achievement-level results were released. This version included an introductory paragraph about purpose (National Assessment Governing Board, 1993, p. 1):
The purpose for setting achievement levels on the NAEP is to make it unmistakably clear to all readers and users of NAEP data that these are expectations which stipulate what students should know and should be able to do [emphasis in original] at each grade level and in each content area measured by NAEP. The achievement levels make the NAEP data more understandable to general users, parents, policymakers and educators alike. They are an effort to make NAEP part of the vocabulary of the general public. For example, they can assist in interpreting the meaning of the National Education Goals, particularly goal 3 which states that by the year 2000, American students “will leave grades four, eight, and twelve having demonstrated competency over challenging subject matter including English, mathematics, science, history, and geography” and goal 4, which states “U.S. students will be first in the world in science and mathematics achievement by the year 2000.”
NAGB revised the policy statement again only 2 years later, and this version is still in place (Jon Jacobson, NAGB, personal communication). This still-current version primarily provides guidance about ways to set achievement standards, and the introductory paragraph that appeared in 1993 was removed. The policy statement begins (National Assessment Government Board, 1995, p. 1):
Foreword
A policy on setting achievement levels on the National Assessment of Educational Progress (NAEP) was first adopted in 1990 and amended several times thereafter. The present policy, adopted in 1995, contained introductory and explanatory text, principles, and guidelines. Since 1995,
there have been several changes to the NAEP authorizing legislation (currently, the NAEP Authorization Act: P.L. 110-279). In addition, related legislation has been enacted, including the No Child Left Behind Act of 2001. Consequently, introductory and other explanatory text in the original version of this policy, no longer germane, has been deleted or revised to conform to current legislation. The Principles and Guidelines remain in their original form except for Principle 4, from which the reference to the now decommissioned Advisory Council on Education Statistics has been deleted. (Foreword added August 2007.)
To supplement the information available through NAGB policy documents, the committee also examined NAEP’s reports, press releases, and Web-based analysis tools for ways that achievement levels are interpreted and used. These materials enable users to:
- track trends in and compare the performance of successive cohorts;
- make point-in-time comparisons across states, and through TUDA, the subset of large urban school districts;
- compare the performance of population groups within and across states (performance gaps);
- rank order the performance of states and compare state to national performance;
- compare performance across tested subject areas;
- examine relationships among student performance and selected student/school/family variables; and
- compare states’ standards for proficient performance in reading and mathematics by placing them on a common scale defined by NAEP scores (“mapping studies”).
As with the lack of clarity regarding the intended users of NAEP data, the uses of NAEP data are neither consistently conceptualized nor communicated. It is difficult to discern a theory of use from the many NAEP documents that attempt to describe and designate appropriate uses of NAEP achievement-level descriptors (ALDs). This may be the result of lack of clarity about appropriate uses in early NAEP documents and the ongoing revisions that have addressed the question of appropriate uses only in a piecemeal manner.
Evidence to Support These Uses
The Standards (American Educational Research Association et al., 2014, p. 11) describes validity as “[t]he degree to which evidence and theory support the interpretations of test scores for proposed uses of tests.”
Because validation is considered a process of gathering evidence to support specific claims and decisions, the intended uses of test scores should play a central role in any validity investigation. For NAEP, NAGB’s policy statement, the various NAGB and NCES reports, and the tools provided on the NAEP Website communicate a variety of intended uses of NAEP data to users. They should therefore provide evidence related to the validity of NAEP scores for these intended uses to the extent feasible. Our review of the available evidence found that information about validity is available for some, but not all, of the varied interpretations and uses communicated by NAGB and NCES. As discussed in Chapter 5, a variety of evidence related to the validity of the achievement levels has been gathered as part of the standard settings and through subsequent research. The evidence collected by ACT as part of the 1992 standard setting was intended to support the primary inference about NAEP: the achievement levels represent what educators believe U.S. students should know and be able to do.
To support this inference, NAGB documented that those selected to set the standards represented the views of educators across the country, that they received appropriate training, and that they generally agreed (achieved some level of consensus) about what students at each achievement level and grade should know and be able to do. Validity studies were designed to document the congruence between the framework, test questions, ALDs, and cut scores. The results provide evidence to support, for example, the inference that students who score at the proficient level have demonstrated competency over challenging subject matter, as defined by educators across the country.
Additional validity evidence was obtained through studies that were designed to document that the concept of proficient or advanced on NAEP is comparable to that on other assessments of the same kind and, thus, reasonable (Shepard et al., 1993). More recently, NAGB collected evidence to support predictive inferences, such as the probability that students at a given score level are sufficiently prepared for college.
However, we were not able to locate any studies specifically designed to support the interpretations and uses discussed above, for example, that achievement levels make the NAEP data more understandable to general users, parents, policy makers, and educators. What is lacking is a comprehensive validity investigation that connects specific evidence to each of the intended interpretations and uses discussed above.
Furthermore, there is little evidence that users understand the concept of Proficient—or Basic or Advanced. Proficient is an abstract term, and the definitions offered in the policy guidance are only minimally helpful in promoting users’ understanding. The term “challenging subject matter” is difficult for many users to interpret. The lack of precision in the term
leaves it open for users to guess what it means and to define it in ways that are meaningful to them.
The addition of a benchmark for “academically prepared” does help users, but the scores were determined separately from the achievement levels: for reading, the academically preparedness score is the same as the proficient cut score; for mathematics, it is lower. These scores do not help users understand “proficient” or “challenging subject matter.”
NAEP GUIDANCE FOR USERS
Our review of NAEP materials revealed that the guidance offered to users varies widely and is often delivered piecemeal, with important details spread across different Web pages and reports. Users can obtain NAEP information at three separate Websites: NAGB’s (http://www.nagb.org); NCES’s (http://nces.ed.gov/nationsreportcard/); and a third called “The Nation’s Report Card” (http://www.nationsreportcard.gov). There is some overlap across the three sites in the information available about NAEP, and all have links that take the user from one site to another. But interpretative guidance is uneven across the three, and it can be quite challenging to locate information about the achievement levels.
NCES devotes considerable effort to ensuring that state and TUDA officials are familiar with NAEP’s intended uses and score interpretations. Prior to the release of NAEP results, NCES convenes representatives from each state: states are encouraged to send assessment, communication, and subject-area specialists. These state teams work with national assessment specialists to review their state’s data, and they often draft preliminary press releases, which are then reviewed by a nationally recognized communications firm. Each state also has an NAEP coordinator, with the primary responsibility of supporting key state stakeholders as they interpret and use NAEP results. A similar process is undertaken with the release of TUDA results, and similar efforts are made to brief members of the press before results are released.
Other materials tend to be descriptive, and they provide, at best, general interpretations of the results for users. There are no “do’s and don’ts” or other kinds of guidance that would help users determine appropriate use. For example, the 2013 First Look report (National Center for Education Statistics, 2013b) for mathematics and reading is a nine-page document that gives an overview of results in a nontechnical style. It includes a few sentences about what NAEP is and does. It presents numerous results with colorful graphs and text. It interprets the results in terms of increases and decreases in performance. But nowhere in the document is there any information or guidance beyond the descriptive information provided. For example, the report states the following with regard to achievement-
level results, along with a bar graph that shows results for 1990, 2011, and 2013 (National Center for Education Statistics, 2013b, p. 7):
The percentages of students at or above Proficient increased from 2011 to 2013 in mathematics at grade 4, and in reading at grades 4 and 8, and were higher than in the early 1990s in both subjects and grades
There is nothing more in the report to help the user know what to think about whether these results are meaningful or not. There is no interpretive guidance as to the size or significance of these changes. It describes materials and tools that are available on line, however, and includes the links to access them. Most direct the user to the main Nation’s Report Card site. To further explore this, we examined the information available on this site and reproduce some of the screens below.
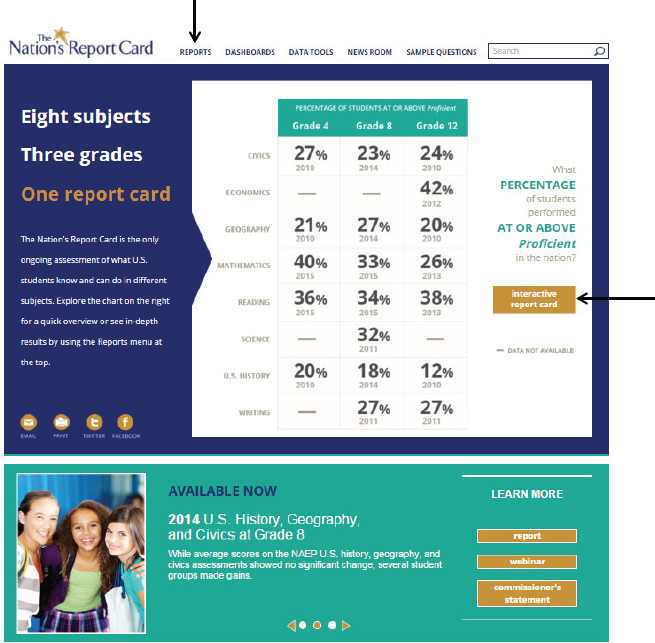
When users go to the main page (http://www.nationsreportcard.gov), they see an overview of the most recent results, reported in terms of percentage Proficient or above (see Figure 6-1). The instructions suggest that users either click on the gold rectangle or go to the Reports tab at the top (both marked with arrows in Figure 6-1). Clicking on the gold rectangle takes a user to an Interactive Report Card dashboard, where the user can customize the information provided. Clicking on the Reports tab takes a user to a menu of subject-matter areas.
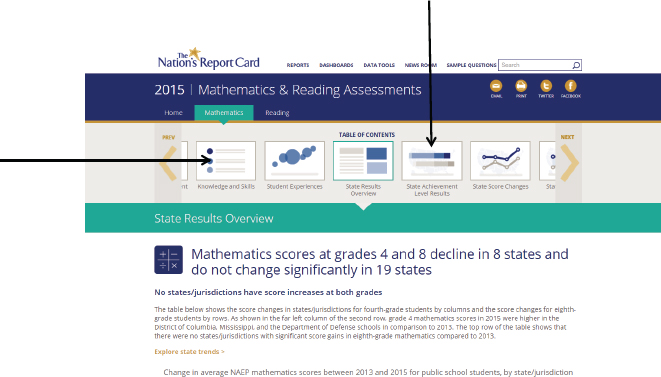
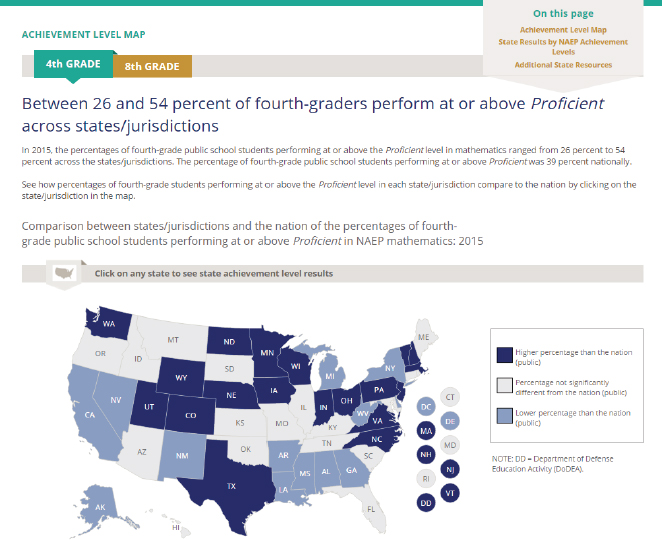
To continue its exploration of the issue, the committee selected mathematics for grades 4 and 8. This takes the user to a page with many options, shown in Figure 6-2. We selected the State Achievement-Level Results option (see arrow at the top of the figure), which takes a user to a map of the United States with states highlighted to indicate whether the percentage of Proficient students was higher, lower, or the same as those of the country as a whole, shown in Figure 6-3.
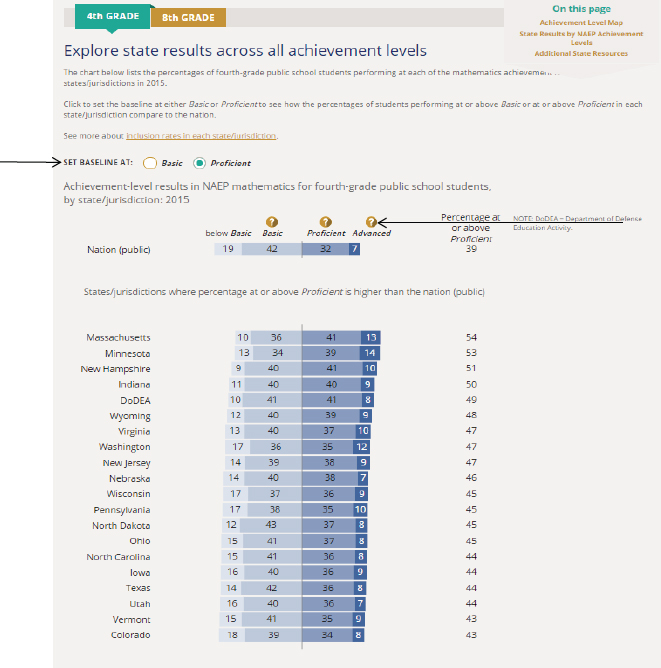
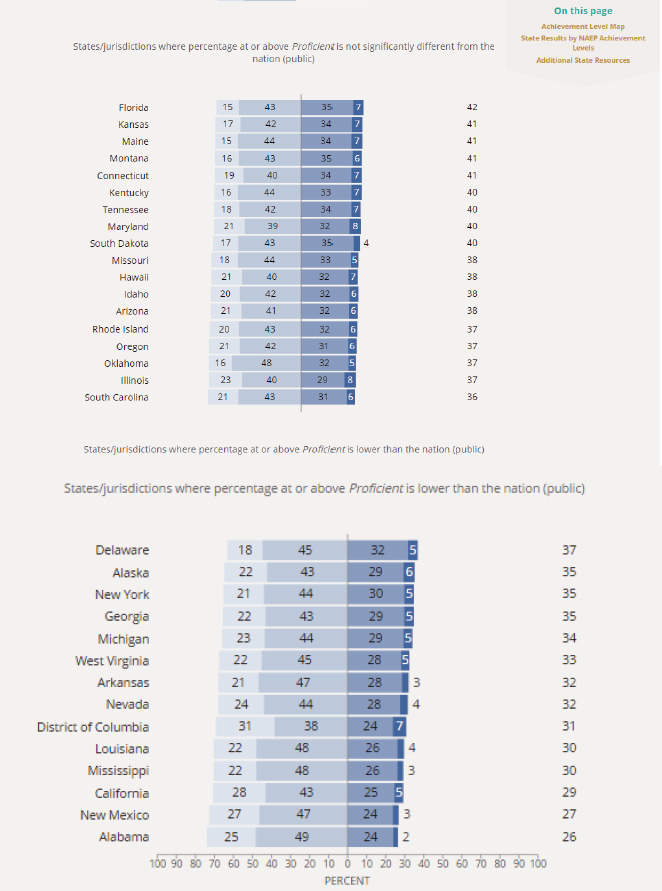
Further down this Web page, a set of horizontal bar graphs show the percentage of students at each achievement level and the total at or above proficient, or a user can select at or above Basic (see arrow on left of figure). There is one bar per state, and they are arranged in sequence by the percentage of students at or above Proficient. Figure 6-4 shows the page for grade-4 mathematics. Although there is guidance on the page to help a user maneuver through the page and select options, there is no interpretive guidance. A user can obtain information about the achievement levels by clicking on the “?” symbol, but there are no instructions to a user to do so (see arrow on the right of Figure 6-4). Clicking on the “?” symbol takes the user to the policy ALDs for the level, with a link to another site that has the more detailed ALDs. A user will need to have enough curiosity, persistence, and savvy to go through these steps to get this information about the ALDs. One result of the way the information is presented is that
SOURCE: The Nation’s Report Card (2016).
users can make state-to-state comparisons of students’ performance on NAEP without a full understanding of what is being compared.
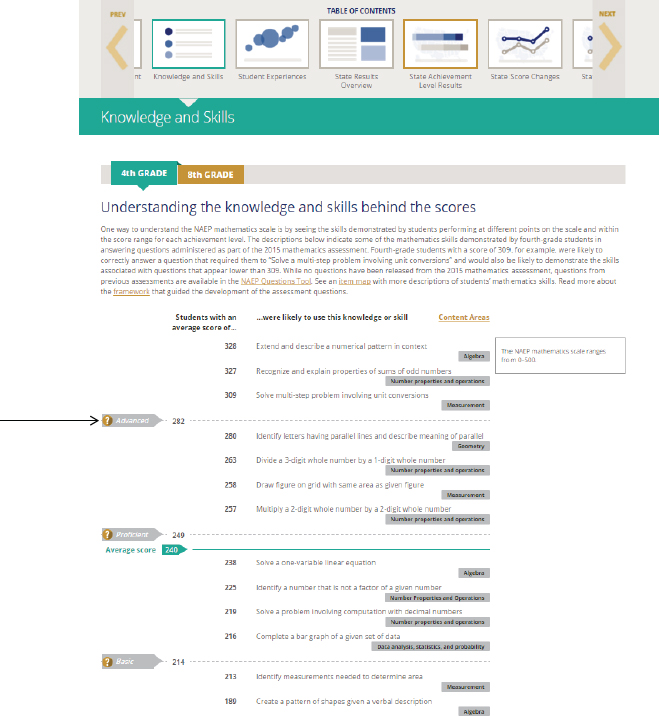
Returning to the main menu shown in Figure 6-2 and selecting “Knowledge and Skills” (see arrow on the left side of the page) brings up a page that shows examples of what students are “likely” to be able to do at various score levels, shown in Figure 6-5.
Clicking on the achievement-level label on the left-hand side of the graph (see arrow on the left side) brings up the ALDs, both the policy versions and, through another link, the more detailed versions. As with the page discussed above, important information is accessible to users, but it takes too many clicks to get to it, and there are no instructions telling the user to keep clicking.
This lack of explanation or guidance about interpretation is problem-
SOURCE: The Nation’s Report Card (2015g).
atic. When interpretive guidance is not provided and widely different interpretations are possible, users may create both anticipated and unanticipated understandings of information. Research and theory from the field of communication could inform how guidance on the use of NAEP results would be best presented. According to a classic model of communication (Jakobsen, 1960), a communication includes a sender, a message with an intended meaning, and an audience (or audiences). In effective communication, the receiver understands the sender’s message as it is intended. In ineffective communication, the receiver may misinterpret the message.
The possible uses and users of NAEP data are described in a myriad of NAEP documents, both in print and online. Given the ease (or difficulty) of access to these different documents, the redundancy or exclusivity of information contained in the group of documents, and the fact that different documents contain inconsistent or even contradictory information, it is not surprising that there is confusion as to what NAEP ALDs “mean,” who might use them, and how they should be used or interpreted.
In addition, the many users of NAEP vary in both their knowledge of NAEP and their reasons for seeking NAEP information. Users with limited knowledge of NAEP, including interested parents, face a wide array of NAEP information, which includes undefined technical terms, such as ALDs, trend lines, sample items, and state-by-state comparisons. This
SOURCE: The Nation’s Report Card (2015f).
information can be a challenging to interpret, and the resulting interpretation may or may not reflect the meaning intended by NAEP.
ACTUAL USES OF ACHIEVEMENT LEVELS
To learn more about the actual uses of achievement levels, the committee gathered information from several sources. We conducted a broad Web-based search on reports and discussion of achievement-level results. Our search was not intended to be a random or representative sampling of the universe of uses and users: instead, it was a targeted search for examples illustrating a variety of NAEP uses and users. We selected examples of press and journal coverage of achievement-level results, state and local press releases and “state report cards” that are required by the No Child Left Behind Act (NCLB), discussions in education blogs, empirical studies of the ways users interpret and understand achievement-level
SOURCE: The Nation’s Report Card (2015f).
results, and empirical studies that used achievement-level results (see the Annex at the end of this chapter). We used this information as a way to understand, more concretely, what users say and do with achievement-level results. The information provided insight into the kinds of inferences users make—both appropriate and inappropriate.
Using this information we gathered from this search, we identified issues about which we had questions and organized a public forum to further explore those questions. For this activity, the committee selected panelists to represent a diverse set of perspectives, organizing the panelists into four groups: state and local policy makers, education writers, education policy researchers and advocacy groups, and the designers
SOURCE: The Nation’s Report Card (2015a).
of the common core state standards—the Partnership for Assessment of Readiness for College and Careers (PARCC)3 and the Smarter Balanced Assessment Consortium.4 We also sent invitations to stakeholder groups to attend the forum and participate in the discussions, as well as to
__________________
3 See http://www.parcconline.org/ [February 2016].
4 See http://www.smarterbalanced.org/ [February 2016].
researchers and technical experts who work directly or peripherally on NAEP. We distributed our set of questions to all participants in advance and shared the illustrative examples we had gathered. In all, approximately 60 people participated in the forum, 17 of whom served on the four panels. Staff from NAGB, NCES, and the Institute of Education Sciences also attended. See Appendix A for the agenda, our list of questions to the panelists, and the panel members.
The committee’s goal for the forum was to hear first-hand accounts about the value and utility of the achievement levels and to create an opportunity for panelists, audience members, and Department of Education staff to react to each other’s ideas. We combined the information from the forum with that in the materials we had collected and identified some key points. These are shown in Box 6-1 (above) and further discussed below.
State and Local Policy Makers
In prior studies (DeVito, 1997, as cited in Jaeger, 2003; Simmons and Mwalimu, 2000; Zenisky et al., 2009) and at the committee’s public forum, state-level education personnel reported that they focus primarily on their own state’s NAEP results, making comparisons to other states and to the nation. Internally, they make within-state subgroup comparisons (e.g., among students groups by race and ethnicity and socioeconomic status), analyze their state’s scale score trends, interpret results in light of their own state curriculum, and use item formats to suggest changes to state assessments and to aid in defining levels of student performance. State policy makers also use NAEP data to validate state standards and to build the case for educational reform and drive change in their states (DeVito, 1997, as cited in Jaeger, 2003; Simmons and Mwalimu, 2000; Zenisky et al., 2009). They fold NAEP data into arguments for new or amended legislation and for requesting funding related to education.
Because NAEP is not designed to provide district-level results, its use to make inferences about district or local school performance is limited to participants in TUDA areas. TUDAs use the data to compare participating large cities to each other, to the nation and the large city statistics, to their respective states, and to track trends over time.5
__________________
5 See Simmons and Mwalimaer (2000) and Zenisky et al. (2009) for earlier discussions of limited communication about and use of NAEP data by local educators.
Education Writers
The panel of education writers at the committee’s public forum reported using NAEP achievement levels to construct accounts of student performance in reading and mathematics and disseminate those accounts to the interested public. The details and focus of their articles tend to vary in relation to the audience and the medium. For example, a daily newspaper such as The Washington Post or The New York Times has a vast and diverse audience, including many people who do not work in education or have school-age children. In contrast, smaller and more local newspapers tend to have a less diverse audience, with readers primarily interested in local issues. Association newsletters tend to have specialized audiences that focus on one or several issues in education. Blogs are increasingly being used to disseminate and discuss NAEP results, and the information discussed tends to be tailored to the participants in each blog.
The education writers at the committee’s forum described their role as intermediaries between NAEP results and the general public. They commented that they strive to make appropriate and accurate inferences of achievement-level results and convey them in a way they judge to be understandable to the specific audience of a particular article. They try to anticipate the ways that audiences will interpret and use the information and present it accordingly. They noted that they often see examples of misinterpretation, misuse, and misconstruing of results they report and try to prevent its reoccurrence in future writings by providing appropriate guidance. These panelists commented that the achievement levels are very useful in communicating results and they would not want to see them eliminated. But they also noted that the terminology (e.g., proficient) can be difficult to explain and is often misunderstood. Several expressed their desire to have a more concise yet descriptive way of identifying what students know and are able to do.
Education Policy and Advocacy Groups
Education organizations and interest groups at the committee’s public forum reported using NAEP data as evidence to support their advocacy of specific needs of students, teachers, and schools. Although NAEP does not provide student-level data, one panelist reported that the groups use NAEP achievement levels to set aspirational goals for student learning and better communicate success targets to parents.
To focus discussion on children of color and low-income families, several organizations emphasized analysis of subgroup performance and achievement gaps nationally and across states, in both point-in-time and over-time comparisons. “We use NAEP across states,” one panelist said, “to look at comparisons not only in achievement between groups, but to
ask questions: for example, why is a state like Massachusetts seeing different results for African American 4th graders in mathematics as compared [to other states]?”
Organizations also use NAEP to compare U.S. student performance with that of other countries in order to make inferences about national achievement, particularly among high-achieving students (those in the 90th percentile) and to relate achievement trends to policy interventions.
Common Core Assessment Consortia
For the two national assessment consortia, Smarter Balanced Assessment Consortium6 and the Partnership for Assessment of Readiness for College and Careers, NAEP items are one of several components they use in their own standard setting methods to aid in defining proficiency levels for their assessments.
PARCC uses NAEP as an external source of validity evidence. The organization recently commissioned two empirical studies to inform its standard setting process: a postsecondary educators’ judgment study and a benchmarking study. In the latter, PARCC asked what percentage of students in PARCC states may be or are college and career ready at the end of high school according to external indicators, such as SAT, ACT, and NAEP.
POTENTIAL MISINTERPRETATIONS AND MISUSES OF ACHIEVEMENT LEVELS
As is clear from the discussion above, stakeholders interpret achievement-level results in numerous ways and to support a variety of arguments. Some of these interpretations are inappropriate, given the design of NAEP and its fundamental purposes. Other interpretations are actually misleading and result in erroneous conclusions about students’ educational progress. The section discusses some examples of each.
Unwarranted Interpretations
Box 6-1 lists interpretations, including some that are inappropriate but quite common, including the following:
- Interpreting cross-tabulations, correlations among between test results and other factors as causal. For instance, there may be a relationship between NAEP results and such out-of-school factors
__________________
6 The representative from this consortium was unable to attend the forum.
-
as the number of books in the home, time spent doing homework, and time spent watching television. It may be that students with more books in the home have higher scores, but the connection cannot be interpreted causally: accumulating more books in the home (without any other actions) will not cause scores to go up.
- Attributing changes in performance from one NAEP administration to the next as due to an event or policy that occurred between the two administrations, such as concluding that an increase in reading achievement for a given state is explained by a specific approach to instruction or concluding that a recent decline in mathematics scores is due to policy measures embodied in the No Child Left Behind Act or the Race to the Top initiative.
- Interpreting “proficient” as equivalent to grade-level performance, such as relating a scale score increase of X to a Y’s (months, year) worth of learning or interpreting NAEP achievement levels as grade-level work.
One of the most common and unwarranted inferences involves assessing the amount of progress students have made over time, particularly by population groups. For instance, news reports often focus not only on how students are doing at a particular time, but the extent to which the percentage of students scoring Proficient or above has (or has not) improved over successive NAEP years. When these comparisons are based on the scale scores, they provide useful information. When they are based on the “percentage Proficient or above” metric and used to compare progress across groups, they can be misleading. A report by Holland (2002) on this issue focused on misinterpretations associated with using the “percent above a cut score” metric. Although this metric is widely used (for NAEP and many other achievement tests), there are serious limitations to the inferences that it can support, particularly when evaluating trends over time, gaps among groups, or trends in gaps.
The misinterpretation occurs because differences across groups or over time in the percentage of students above (or below) a cut score is sensitive to the location of the cut score. In general, if the cut score is set close to the middle of the scale score distribution, a small change in the average scale score will translate to a relatively large difference in the percentage of students above (or below). In contrast, a small change in the average scale score will not translate to a large difference in the percentage of students above (or below) a cut score if the cut score is set in one of the tails of the distribution. This difference occurs because in most test score distributions, a higher percentage of examinees perform near the middle of the distribution than in the tails, so a rightward shift in all test scores
results in a higher percentage of students moving across a threshold set near the 50th percentile than one set at a much higher or lower percentile.
Similarly, in comparing subgroups of students by the percentage of students above (or below) a cut score, the outcome will be different for a group in which roughly 50 percent of examinees are proficient and a group in which a much lower or a much higher percentage are proficient. The result in such a comparison may conflict with one based on relative scale score changes in those two groups. Thus, efforts to compare differences or changes in percentage of students above (or below) cut scores can lead to incorrect inferences about the magnitude of the overall difference or change in performance.
Figure 6-6 provides an example of this problem. This figure compares the performance over time between two groups of students in one school district: African Americans (top graph) and students from other racial and ethnic backgrounds (bottom graph). These data come from a school
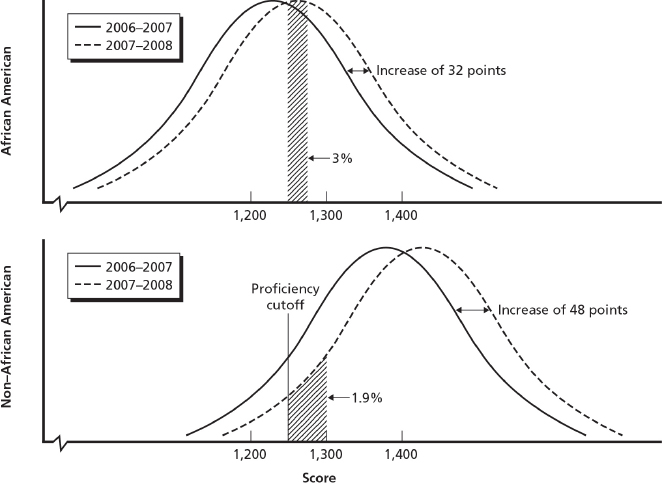
SOURCE: Hamilton et al. (2012, Fig. 7.2, p. 98). Reprinted with permission from RAND.
district whose leaders were interested in reducing the achievement gap between African American students and their peers (Hamilton et al., 2012). Each graph shows the distribution of scores for two successive years, 2006-2007 and 2007-2008, plotted on the scale score metric. The top figure shows that the average scale score for African Americans increased by 32 points over the time period; for other students (bottom graph), the increase was 48 points.
On each graph, the vertical line demarks the proficiency cut score, roughly 1,250. The change in the percentage of students who were proficient (or advanced) from the first year to the next is represented by the shaded area (diagonal lines) to the right of the cut score. The top graph shows that for African American students, the percentage at or above proficient increased by 3.0 points between the 2 years; the bottom graph shows that for other students, the percentage of students that are proficient or above increased by only 1.9 points.
These graphs show contradictory information. The percentage of students who scored Proficient or above increased more for African American students than for other students. At the same time, the average scale score increased more for other students than African Americans. Thus, relying exclusively on a percentage above the cut score to understand whether achievement gaps are closing would be misleading.
In this example, the problem stems from differences in the score distributions for the two groups, particularly around the cut score for proficiency. The distributions show that more African American students were performing just below the proficient threshold in 2006-2007 than were the other students. In the next year, the fact that a higher percentage of African American students than other students crossed the threshold for proficient is an artifact of the actual numbers of students that scored in this range. A similar phenomenon could affect inferences about other comparisons, such as performance gains across different states or across different demographic groups.
In our review of online reports from NAEP,7 we found several that compare performance gaps using the percent-above-cut metric. They can be confusing and may be misleading. Figure 6-7 shows an example for grade-4 mathematics. Note on this page that the headline focuses on the percentage of students who are at or above Proficient, with no guidance or definition of proficient.
More accurate and comprehensive inferences about changes in performance over time among different groups can be obtained using metrics that include information about changes throughout the full score
__________________
7 Available: http://www.naep.gov [January 2016].
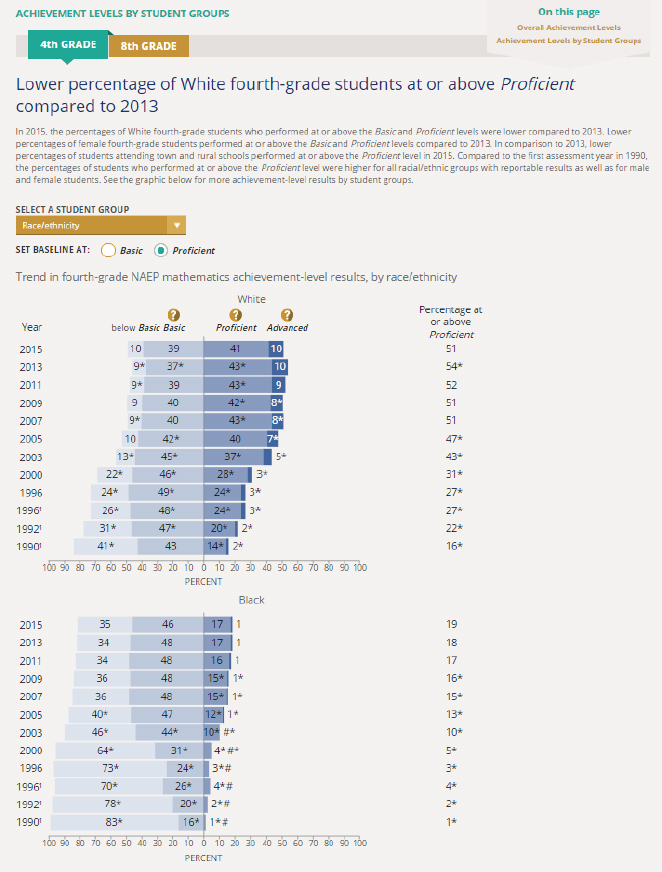
SOURCE: The Nation’s Report Card (2015b).
distribution, such as mean scale scores, rather than relying solely on the percent-above-cut metric.
Problematic Interpretations for Special Groups
We note two other interpretation issues. The first is for interpreting results for students with disabilities. NAEP has long reported disaggregated results for students with disabilities and English-language learners. For students with disabilities, it is important to recognize that there is as much or more variation within the group (e.g., learning disability, hearing impairment, mental retardation) than between them and students without disabilities. Reporting group results with no other information makes it difficult to interpret the results accurately.
The second interpretation issue relates to reporting results on a single dimension at a time, such as by state. A sample is shown in Figure 6-4: in the right-most column it displays the percentage of students that are at or above Proficient for mathematics by state. A common inference is that the state with the lower percentage of proficient students has the poorer educational system, but comparing states with populations of different demographic characteristics on only the overall percentage of students who are proficient can be misleading. For example the lower performing state could be doing better than the higher performing state in every demographic subgroup, but show as poorer overall because the percentage of lower scoring groups is higher in that state. The problem is exacerbated by NAEP’s failure to report the percentage of students who are proficient in a way that allows for control of more than one characteristic at a time, such as poverty and ethnicity.
CONCLUSIONS
There are a variety of audiences for achievement-level reports, and these audiences use the information in a variety of ways. Achievement levels were initially developed to inform public discourse and policy decisions, and they are being used in this way. Yet the committee was unable to find documents that specifically lay out appropriate uses and the associated research to support these uses.
There is a disjuncture between the kind of validity evidence that has been collected (see Chapters 3-5) and the kinds of interpretations and uses that are made of NAEP achievement-level reports. The validity evidence documents the integrity and accuracy of the procedures used to set the achievement levels, the extent to which the ALDs are consistent with the assessment framework, and the relationships between the achievement levels and external criteria. But the evidence does not extend to the actual
uses—the way that NAEP audiences use the results and the decisions they base on them.
We note that this concern is not new. In an overall audit report of NAEP known as the Buros Evaluation, Buckendahl and colleagues (2009, p. 1-95) recommended the following:
[The NAEP program should] develop a transparent, organized validity framework beginning with a clear definition of the intended and unintended uses of NAEP assessment scores. . . . [and] a rationale and supporting research and documentation should be provided to justify the intended uses(s).
The authors hold NAGB, NCES, and stakeholders as jointly responsible for this work and further state (Buckendahl et al., 2009, p. 1-96):
Given the importance of a highly visible national assessment program, it is essential that a validity framework be created to coordinate a program of validity research on NAEP, aimed at informing the validity of score interpretation and use. This should be a highlighted component of NAEP.
We endorse this recommendation because the evidence the committee found clearly supports it, and we did not find evidence that it had been implemented.
Improvements are needed in the guidance provided to users in interpreting NAEP achievement-level reports. There is much information, some quite explicit but some that requires a user to make small or even large inferences. This information is spread over many documents and Web pages: it is not available in any centralized location. Some information is presented on the main NAEP Web page (nationsreportcard.gov), but the explanations and interpretation guidance are on other Web pages, such as those of NCES or NAGB. Links are provided, but a user must put considerable effort into locating the information. Furthermore, NAEP reports of achievement-level results include examples of inappropriate uses, such as tracking the percentage of students at or above a cut score to evaluate progress by population groups. Considerable information is provided to state and district education personnel and media representatives in preparation for a release of NAEP results, and NAGB provided us with examples of these materials. But this type of information is not easy to find on the NAEP Websites. Without appropriate guidance, misuses of the NAEP data are likely.
Prior evaluations have suggested ways to more clearly present displays of achievement-level results and enhance users’ understanding of the reports (e.g., National Research Council, 1999, 2001; Zenisky et al. 2009). Others have suggested supplementing achievement-level results, which are inherently judgment based, with normative results, which are empirically based results (see, e.g., Beaton et al., 2012; Shepard et al.,
1993). This approach, referred to as “baseline normative” by Beaton and colleagues, would establish a set of percentile scores to follow over time and would proceed as follows (Beaton et al., 2012, p. 8):
In keeping with current practice, three cut scores could be established to correspond to selected percentile ranks (e.g., 95th, 50th, and 25th percentiles) in the baseline year. Labels could be given to the four score regions defined by the three cut scores (e.g., advanced, proficient, basic, and below basic), or, to avoid confusion with the achievement levels, the four score regions could be labeled exceeds standard, meets standard, meets minimal expectations, and unsatisfactory, or simply levels 4, 3, 2, and 1.
A relatively new strategy for interpreting performance on assessments of reading makes use of item response theory procedures. This approach estimates a difficulty level for a passage of text and a reading ability level for the reader. One example is the Lexile® approach, but other approaches are available. Such an approach would be useful for communicating the difficulty levels of reading passages presented to test takers.
CONCLUSION 6-1 The National Assessment of Educational Progress achievement levels are widely disseminated to and used by many audiences, but the interpretive guidance about the meaning and appropriate uses of those levels provided to users is inconsistent and piecemeal. Without appropriate guidance, misuses are likely.
CONCLUSION 6-2 Insufficient information is available about the intended interpretations and uses of the achievement levels and the validity evidence that support these interpretations and uses. There is also insufficient information on the actual interpretations and uses commonly made by the National Assessment of Educational Progress’s various audiences and little evidence to evaluate the validity of any of them.
CONCLUSION 6-3 The current achievement-level descriptors may not provide users with enough information about what students at a given level know and can do. The descriptors do not clearly provide accurate and specific information about the things that students at the cut score for each level know and can do.
ANNEX: BIBLIOGRAPHY
This annex lists an array of supplemental information the committee drew on for this chapter.
Journal Articles and Blogs
Di Carlo, M. (2011). What we can expect from new NAEP scores. The Washington Post, October 31. Available: https://www.washingtonpost.com/blogs/answer-sheet/post/what-we-can-expect-from-new-naep-scores/2011/10/31/gIQAlOEpZM_blog.html [January 2016].
Maffucci, H. (2012). NAEP. . . It’s Becoming a Big, Misused Thing. . . Reprising . . . What You Need to Know about NAEP. Web blog post, April 13. Available: http://commonsenseny.blogspot.com/2012/01/naep-misunderstood-assessment-what-you.html [January 2016].
Merrefield, C. (2011). States with the Smartest Kids. Web blog post, January 23. Available: http://www.thedailybeast.com/articles/2011/01/23/states-with-smartest-kids-frommassachusetts-to-mississippi.html [April 2016].
Sawchuk, S. (2013). When bad things happen to good NAEP data. Education Week. Web blog post. July 24. Available: http://www.edweek.org/ew/articles/2013/07/24/37naep.h32.html [January 2016].
Thomas, P.L. (2013). Radical Scholarship: The New York Times in an Era of Kool-Aid Journalism. Web blog post, November 21. Available: http://nepc.colorado.edu/blog/new-york-times-era-kool-aid-journalism [January 2016].
Interpretation Guides
National Assessment of Educational Progress. (2015). Facts for Principles. Washington, DC: U.S. Department of Education, National Center for Education Statistics.
Yeager, M. (2007). Understanding NAEP: Inside the Nation’s Education Report Card. Washington, DC: Education Sector.
State Report Cards and Press Releases
Fazan, S. (2013). Drastic differences in nation’s report card versus state report card. ABC Action News, December 18. Available: http://www.abcactionnews.com/news/localnews/drastic-differences-in-nations-report-card-versus-state-report-card [January 2016].
Garrison, J. (2014). Tennessee Lags in High School Math, Reading on “Nation’s Report Card.” Web blog post, May 8. Available: http://www.tennessean.com/story/news/education/2014/05/07/tennessee-lags-high-school-math-reading-nations-reportcard/8793217/ [January 2016].
Hanover Research. (2012). Issues of State and School District Transitions to NAEP Proficiencies. Washington, DC: Author.
JerseyCAN. (2013). 2013 National Assessment of Educational Progress (NAEP): New Jersey Results. Cranford, NJ: Author.
Klein, M. (2009). Council Rock School District: District Report Card. Newtown, PA: Council Rock School District.
Oregon Department of Education. (2013). Statewide Report Card: An Annual Report to the Legislature on Oregon Public Schools. Salem, OR: Author.
Stoneberg, B.D. (2007). The Valid Use of NAEP Achievement Level Scores to Confirm State Testing Results in the No Child Left Behind Act. Paper presented at the NAEP State Service Center Spring Assessment Workshop, Bethesda, Maryland. Available: http://eric.ed.gov/?id=ED495967 [April 2016].
Virginia Department of Education. (2013). Governor McDonnell Announces Virginia Students Rank High in First-Ever International Mathematics & Science Comparison. Available: http://www.doe.virginia.gov/news/news_releases/2013/oct24_gov.shtml [January 2016].
Discussions of Achievement-Level Results
Beaton, A.E., Linn, R.L., and Bohrnstedt, G.W. (2012). Alternative Approaches to Setting Performance Standards for the National Assessment of Educational Progress (NAEP). Washington, DC: American Institutes for Research.
Bourque, M.L., and Byrd, S. (2000). Student Performance Standards on the National Assessment of Educational Progress: Affirmations and Improvements. Washington, DC: National Assessment Governing Board.
Hanushek, E.A., Peterson, P.E., and Woessmann, L. (2010). U.S. Math Performance in Global Perspective: How Well Does Each State Do at Producing High-Achieving Students? Harvard’s Program on Education Policy & Governance, Kennedy School of Government. Cambridge, MA: Harvard University.
Ladner, M., and Myslinski, D.J. (2014). Report Card on American Education: Ranking State K-12 Performance, Progress and Reform. Arlington, VA: American Legislative Exchange Council.
National Center for Education Statistics. (2013a). Are the Nation’s 12th Graders Making Progress in Mathematics and Readings? Institute of Education Sciences. Washington, DC: U.S. Department of Education.
National Center for Education Statistics. (2013b). The Nation’s Report Card: A First Look: 2013 Mathematics and Reading (NCES 2014-451). Institute of Education Sciences. Washington, DC: U.S. Department of Education.
Reports by Advocacy Groups
Peterson, P.E., Woessman, L., Hanushek, E.A., and Lastra-Anadón, C.X. (2011). Globally Challenged: Are U.S. Students Ready to Compete? The Latest on Each State’s International Standing in Math and Reading. Harvard’s Program on Education Policy and Governance, Kennedy School of Government. Cambridge, MA: Harvard University.
Plucker, J.A. (2015). Common Core and America’s High-Achieving Students. Washington, DC: The Thomas B. Fordham Institute.
Performance Gaps
Ladner, M., and Myslinski, D.J. (2013). Report Card on American Education: Ranking State K-12 Performance, Progress and Reform, 18th Edition. Arlington, VA: American Legislative Exchange Council.
Understanding Achievement Levels
Grissmer, D., Flanagan, A., Kawata, J., and Williamson, S. (2000). Improving Student Achievement: What State NAEP Test Scores Tell Us. Santa Monica, CA: RAND.
Hambleton, R.K., and Slater, S.C. (1995). Are NAEP Executive Summary Reports Understandable to Policy Makers and Educators? Los Angeles: CRESST, University of California.
Jaeger, R.M. (2003). NAEP Validity Studies: Reporting the Results of the National Assessment of Educational Progress. Working Paper 2003-11, Institute of Education Sciences. Washington, DC: U.S. Department of Education.
National Research Council. (2001). NAEP Reporting Practices: Investigating District-Level and Market-Basket Reporting. Committee on NAEP Reporting Practices, P.J. DeVito and J.A. Koenig, Eds. Board on Testing and Assessment, Center for Education. Washington, DC: National Academy Press.
Zenisky, A., Hambleton, R.K., and Sireci, S.G. (2009). At or Above Proficient: The Reporting of NAEP Results in the Internet Age. Report No. 710. Center for Educational Assessment. Amherst: University of Massachusetts.


