
Part I:
The Context of the Enlistment Standards Project
The Joint-Service Job Performance Measurement/Enlistment Standards (JPM) Project is one of the largest coordinated studies of job performance on record. Initiated by the Department of Defense (DoD) in 1980 and scheduled for completion in 1994, the JPM Project represents an investment of many millions of dollars and involved the participation of thousands of people. Phase I of the project, which concentrated on developing a variety of measures of job performance so that enlistment standards could be related to something close to actual performance on the job, included measurement specialists who designed the performance tests, local base personnel who provided logistical support for the data collection, and the more than 15,000 troops who supplied the performance data. In Phase II, econometricians worked with measurement specialists to develop a cost/performance trade-off model that incorporated the relationship between job performance and recruit quality on one side and the relationship between recruit quality and the cost of recruiting, training, and attrition on the other. This model provides a useful aid to accession policy planners who are responsible for deciding such questions as: How much quality do we need? or How much quality can we afford?
For the past 10 years, two committees of the National Research Council-National Academy of Sciences have served in an advisory capacity to the Department of Defense on the JPM Project. The Committee on the Performance of Military Personnel was formed in 1983 to provide an independent technical review of the research and measurement issues involved
in (1) the development of hands-on job performance tests for jobs of first-term enlisted personnel, (2) the collection and analysis of data from test administrations, and (3) the linking of resulting performance scores to military enlistment standards as defined by scores on the Armed Forces Qualification Test (AFQT). In 1989, the Committee on Military Enlistment Standards was established to oversee the technical issues concerning the development of a cost/performance trade-off model for use in setting enlistment standards.
The sheer size of the JPM effort over that past 13 years ensures that the project will provide a wealth of raw material and guidance for the next generation of researchers in the field of human resource management, quite aside from its more immediate goal of improving the selection and classification of military enlisted personnel. The project's many achievements add in important ways to the understanding of personnel selection systems. Even its shortcomings are informative, for they point up the need for additional methodology and highlight the dilemma resulting from conflicting purposes that are inevitable in a project of this magnitude.
ORIGINS OF THE JPM PROJECT
In 1973, Congress abolished military conscription, and the military establishment was faced with the prospect of maintaining a competent active-duty military force on the basis of voluntary enlistment. Intense public debate accompanied the move to the All-Volunteer Force. Many feared that able volunteers would not sign up in sufficient numbers. Opponents warned that the national security would be weakened. Others were concerned on social and philosophical grounds that the burden of national defense would fall largely to those who would have most difficulty finding work in the civilian economy—minorities, the poor, and the undereducated (Fullinwider, 1983). With the matter of exemptions from the draft made moot by the shift to a volunteer force, military manpower policy came to revolve around issues of recruit quality and the high cost of attracting qualified personnel in the marketplace (Bowman et al., 1986).
Concern about the quality of the All-Volunteer Force reached a climax in 1980, when DoD informed Congress of an error in scoring the Armed Services Vocational Aptitude Battery (ASVAB), the test used throughout the military since 1976 to determine eligibility for enlistment. A mistake had been made in the formula for scaling scores to established norms, with the result that applicants in the lower ranges of the ability distribution were given inflated ASVAB scores.
The ASVAB includes 10 paper-and-pencil ability tests covering factors of verbal ability, mathematical ability, clerical speed, and technical knowledge. For enlistment purposes, the general aptitude of service applicants is
assessed by a composite of the four ASVAB tests that make up the AFQT. For policy purposes the AFQT score scale is divided into five categories (Category III is frequently divided into IIIA (50–64) and IIIB (31–49)):
|
CATEGORY |
AFQT SCORE RANGE |
|
I |
93 – 99 |
|
II |
65 – 92 |
|
III |
31 – 64 |
|
IV |
10 – 30 |
|
V |
1 – 9 |
The current enlistment standards and quality goals imposed by Congress for the entire armed forces are as follows. The legislated minimum standard for high school graduates is 10; in other words, those with scores in Category V are not eligible for military service. Since some military occupational specialties are more difficult than others, and the more difficult jobs go beyond the capabilities of lower-scoring recruits, it is necessary to enlist people in the upper score ranges. Legislation requires than no more than 20 percent of the enlistees be drawn from Category IV (score range 10–30). The misnorming of the ASVAB in 1976 led to enlistment of approximately 250,000 applicants between 1976 and 1980 who would not normally have been accepted (Office of the Assistant Secretary of Defense—Manpower, Reserve Affairs, and Logistics, 1980a, 1980b).
In response to the misnorming and to allay its own broader concerns about building an effective enlisted force solely with volunteers, DoD launched two major research projects to investigate the overall question of recruit quality. The first project, conducted in cooperation with the U.S. Department of Labor, administered the ASVAB to a nationally representative sample of young people between the ages of 18 and 23. This Profile of American Youth (Office of Assistant Secretary of Defense—Manpower, Reserve Affairs, and Logistics, 1982) permits comparisons between the vocational aptitude scores of military recruits and the test performance of a representative sample of their peers in the general population as of 1980. No longer do the test scores of today's recruits have to be interpreted with test data from the World War II era.
The profile provided important evidence to quell the worst fears about the quality of the All-Volunteer Force. The scores of enlistees for fiscal 1981 on the four subtests of the ASVAB that make up the AFQT were higher than those of the 1980 sample of American youth. In particular, the proportion of enlistees in the average range was considerably larger, and the proportion of enlisted personnel in the below-average range smaller, than in the general population. Although the results were reassuring, the weakness
in the evidence was that quality was defined in terms of the aptitudes of recruits, not realized job performance—that is, in terms of inputs, not outputs. The relation between test scores and performance on the job was not established empirically, and thus DoD still could not satisfactorily answer the more difficult questions about the quality of the voluntary military service: How much quality is enough to ensure a competent military force? Given the need to compete in the marketplace for able recruits—using the lures of enlistment bonuses, high entry-level pay scales, and educational benefits—how much quality can the country afford?
In 1980, the assistant secretary of defense in charge of manpower and personnel affairs called on the Services to investigate the feasibility of measuring on-the-job performance and, using the measures, to link military enlistment standards to job performance. With the endorsement of the House and the Senate Committee on Armed Services, the Joint-Service Job Performance Measurement/Enlistment Standards Project, DoD's second major research project, got under way. The progress of this massive research effort is charted in an ongoing series of annual reports to Congress from the Office of the Assistant Secretary of Defense and the two-volume report of the Committee on the Performance of Military Personnel published in 1991.
Now, after more than a decade of research, empirical evidence has replaced assumptions about the efficacy of the ASVAB. The JPM Project has successfully measured the job proficiency of incumbents in a sample of military entry-level jobs. In the process, it has compared several types of measures and different approaches to test development. The performance measures provide a credible criterion against which to validate the ASVAB, and the ASVAB has been demonstrated to be a reasonably valid predictor of performance in entry-level military jobs.
Generalizations from the JPM results will take their place in the literature and lore of industrial and organizational psychology. Because of the superior measures of performance, constructed with a care normally reserved for standardized tests used as predictors, these results provide a solid base for general conclusions formerly based on less satisfactory criteria.
PROVIDING COST/PERFORMANCE TRADE-OFFS IN LINKING ENLISTMENT STANDARDS TO JOB PERFORMANCE
Phase I of the JPM Project demonstrated that reasonably high-quality measures of job performance can be developed, and that the relationships between these measures and the ASVAB are strong enough to justify its use in setting enlistment standards. But the human resource management problem is not solved by showing that recruits who score well on the ASVAB tend to score well on hands-on performance measures. High-quality per-
sonnel cost more to recruit, and the public purse is not bottomless. In order to make reasonable budgetary decisions, Congress needs to be able to balance performance gains attributable to selecting those with better-than-average scores on the ASVAB against the costs of recruiting, training, and retaining high-quality personnel. And to improve their control over performance in the enlisted ranks, DoD and the Services need to be able to make more empirically grounded projections of their personnel quality requirements.
The second phase of the JPM Project concentrated on the development of a cost/performance trade-off model to illuminate for policy makers the effects of alternative enlistment standards on performance and costs. The development of this model for setting enlistment standards has great potential relevance for accession policy. Until now, the standards-setting process has been largely based on an informal process of individual judgments and negotiations among the stakeholders. The manpower management models used by military planners for other purposes have simply assumed an appropriate enlistment standard or have used surrogates at quite some remove from job performance. With the JPM performance data incorporated into trade-off models, the models offer policy officials useful tools for estimating the probable effects on performance and/or costs of various scenarios—say a 10-percent reduction in recruiting budgets, a 20-percent reduction in force, or a downturn in the economy. The solutions provided by such models are not intended to and will not supplant the overarching judgment that policy officials must bring to bear, but they can challenge conventional assumptions and inject a solid core of empirical evidence into the decision process.
The full implications of the job performance measurement research for military policy makers—and for civilian sector employers—remain to be worked out in coming years. The JPM Project has produced a rich body of data and a wealth of methodological insights and advances. And, as important research efforts so frequently do, it has defined the challenges for the next generation of research on performance assessment.
WORKSHOP PRESENTATIONS
The workshop papers presented in this volume represent the culmination of the committee's activities and the JPM Project efforts. The purpose of the workshop and these papers was to provide military manpower planners and analysts with a description of the cost/performance trade-off model and concrete examples of its use for policy decision making. The workshop presentations and background papers address the following issues:
-
Trends in military manpower quality: past present and future.
-
Setting performance goals based on data from the JPM Project in comparison with alternative approaches to setting performance goals.
-
Extending the performance equation from jobs for which hands-on performance data exist to jobs for which no performance data were collected.
-
Understanding the underlying assumptions and variables comprising the cost/performance trade-off model.
-
Showing how the cost/performance trade-off model can be used to examine the implications for recruit quality mix of budget reductions or changes in performance goals.
REFERENCES
Bowman, W., Little, R., and Sicilia, G., eds. 1986 The All-Volunteer Force After a Decade: Retrospect and Prospect. Washington, D.C.: Pergamon-Brassey's.
Fullinwider, R., ed. 1983 Conscripts and Volunteers: Military Requirements, Social Justice, and the All-Volunteer Force. Totowa, N.J.: Rowman and Allanheld.
Office of the Assistant Secretary of Defense (Manpower, Reserve Affairs, and Logistics) 1980a Aptitude Testing of Recruits. Report to the House Committee on Armed Services. Washington, D.C.: U.S. Department of Defense.
1980b Implementation of New Armed Services Vocational Aptitude Battery and Actions to Improve the Enlistment Standards Process. Report to the House and Senate Committee on Armed Services. Washington, D.C.: U.S. Department of Defense.
1982 Profile of American Youth: 1980 Nationwide Administration of the Armed Services Vocational Aptitude Battery. Washington, D.C.: U.S. Department of Defense.
Military Manpower Quality: Past, Present, and Future
David J. Armor and Charles R. Roll, Jr.
U.S. military leaders have always believed that manpower quality—traditionally defined in terms of educational attainment and aptitude as measured by standardized tests—is just as important as quantity in determining force capability and readiness. The problem as we approached the 1980s was that the combination of a voluntary force, shrinking personnel budgets, and a youth population declining in size had raised serious doubts about whether sufficient quality could be maintained in the enlisted forces given the manpower requirements at that time.
Furthermore, the only way to maintain or raise enlisted recruit quality at that time was to increase personnel and recruiting budgets (i.e., salary, bonuses, education benefits, advertising), always a challenging proposition in Congress. The selling job was made all the more difficult because the military lacked credible models to show how much manpower quality was necessary and at what cost. Although each Service argued that quality requirements were based on empirical analysis, the fact is that there was no formal relationship between recruit quality and force capability or readiness, and no strong link between capability and costs. The unofficial justification for high-quality recruits, it seemed, was ''the more quality the better."
The Joint-Service Job Performance Measurement/Enlistment Standards (JPM) Project aimed to remedy this problem by developing a formal manpower model that could help determine enlistment and quality standards by first linking quality to actual job performance and then linking performance
to manpower costs. By trading off performance and costs, the model would seek optimal quality standards given a variety of manpower constraints and conditions such as force size, compensation levels, and various external considerations such as unemployment rates.
By the time the JPM Project had produced an enlistment standards model, however, U.S. defense policies had changed drastically in response to world events. The end of the cold war reduced the national security threat, and the reduced threat led to reductions in force structure and manpower requirements, with corresponding decreases in numbers of recruits at all levels of quality. Moreover, the size of the youth population reached its nadir in 1993 and will begin rising modestly for at least the next 10 years.
With these changes in forces and demographics, the questions about quality in 1993 are vastly different from those in 1980. The problem today might be rephrased: Not how much quality is enough, but how much quality is too much? In 1980 quality was at all-time lows, while in 1993 quality is at all-time highs. Just as recruiting costs had to rise when the demand for high-quality recruits exceeded supply, the question today might be: Do recruiting costs fall when the supply of high quality exceeds demand? If the JPM enlistment standards model justifies higher recruiting costs during the 1980s when high quality was in shorter supply, will it show reduced recruiting costs during the 1990s if supply exceeds demand? What does the JPM model say, if anything, about future trends in quality, and in particular the relationship between quality requirements in the active and the reserve forces?
THE HISTORY OF THE QUALITY ISSUE
Manpower quality was not a major issue after World War II, when enlisted manpower requirements could be satisfied through a peacetime draft. The draft led to induction of a reasonable cross-section of young American men, although it did underrepresent certain categories of aptitude. Aptitude is defined here in terms of categories on the Armed Forces Qualification Test (AFQT), which is a subtest of the Armed Services Vocational Aptitude Battery (ASVAB). The highest levels of aptitude, AFQT Categories I and II (the 65th to the 100th percentiles), were often underrepresented because of college deferment policies in effect at various times during the draft era. The lowest level of aptitude, AFQT Category V (below the 10th percentile), was underrepresented because of longstanding policies that barred enlistment for this group.1
Quality and the All-Volunteer Force
With one exception, quality did not become a major issue until the end of the draft and conversion to the All-Volunteer Force in 1973. The exception occurred in the mid-1960s, during the Johnson administration's war on poverty. At that time, more blacks volunteered for military service than were then enlisted—many of them with lower AFQT scores. The President ordered Project 100,000, the purpose of which was to improve job opportunities for youth with low socioeconomic status and minority youth by enlisting 100,000 Category IV applicants (10th to 30th percentile on the AFQT). As we shall see, this project played an important role in some of the early research on enlistment standards.
Manpower quantity and quality became an issue of great concern during the debate over the draft versus the All-Volunteer Force. Supporters of the draft argued that quality standards could not be maintained if enlisted recruiting was voluntary, because higher-quality youth would not volunteer in the face of more attractive college or job options, at least without making compensation so high as to make military budgets unaffordable. Supporters of the All-Volunteer Force argued that (1) adequate numbers of higher-quality personnel could be recruited with moderate increases in compensation and (2) no harm would come to the military even if the quality mix shifted downward somewhat, because many military jobs could be performed competently by Category IV enlistees. This latter view was adopted by the 1970 report of the influential Gates Commission, which had been appointed by the President to evaluate the viability of the All-Volunteer Force, and which recommended that the draft be replaced by the All-Volunteer Force.
During the early years of the All-Volunteer Force, the Gates Commission conclusions appeared to be vindicated. By all measures of quantity and quality, including AFQT scores, each of the Services was meeting staffing requirements and maintaining a quality mix comparable to that of the draft era. In fact, a comprehensive review by the Rand Corporation in 1977 concluded that the aptitude of recruits had actually increased, although there was some decrease in education levels (Cooper, 1977). The proportion of total Department of Defense (DoD) Category IV recruits fell from 19 percent in the latter draft years to about 6 percent in the early years of the All-Volunteer Force and from 24 to 11 percent in the Army. The percentage of non-high school graduates increased from 30 to 35 percent in DoD and from 33 to 44 percent in the Army.
This optimistic picture was shattered in 1980, when the assistant secretary of defense for manpower reported to Congress that the ASVAB in use since at least 1976 had been misnormed. The norming error caused AFQT percentile scores to be inflated, thereby causing recruit quality levels to be overstated. When the ASVAB norms were corrected and AFQT scores
were recalculated, true quality levels changed dramatically. Instead of increasing quality, aptitude levels had deteriorated to their lowest levels since aptitude tests were adopted before World War II. As of 1980, when the norming errors were reported, Category IV personnel had risen to 35 percent for DoD as a whole, and to fully 50 percent for the Army.
Needless to say, there was a great deal of controversy and debate about this surprising turn of events, including calls for a return to the draft and claims that the All-Volunteer Force had failed. Those policy makers still committed to the concept of a volunteer force had a range of responses to the new quality crisis. At one extreme, the secretary of the Army attacked the validity of the ASVAB, arguing that quality standards were unnecessary in the first place and discriminated against minority citizens in the second. Others acknowledged the importance of quality standards and immediately called for increases in military pay and benefits in order to remedy the quality problem. It so happened that military pay had been falling behind civilian pay during the late 1970s, due to a combination of complacency and antimilitary sentiments left by the Vietnam War. The approach selected was to increase military pay and benefits.
The Search for Quality Standards
The response by Congress and both the Carter and Reagan administrations was to preserve the volunteer force but to embark on an extensive program to raise military pay and benefits sufficiently to remedy the quality shortfall. This outcome, while favored by most defense policy makers, was not without significant repercussions. Since defense spending is always problematic in Congress, the question now became: How much quality is needed and for what price? While almost everybody agreed that the quality levels in 1980 were too low, what constituted the "right" levels? Was the draft-era quality mix the right level? Could it be lower without sacrificing military capability? Should it be higher, given the increasing technological sophistication of weapons systems? Were draft-era quality levels affordable, or might we have to settle for lower manpower quality because of budget constraints?
As of 1980 there were no ready answers to these questions. There were serious data deficiencies and, more important, a lack of satisfactory tools for developing more rigorous validation methodologies. First, although each Service had enlistment quality standards at the time, those standards were based on the relationship between quality and several surrogate measures of military performance and capability, some of which had unestablished relationships with true military performance. Initially, most Services set enlistment quality standards by validating aptitude scores against training school outcomes, which at one time had relatively good relationships with
ASVAB scores. By 1980, the relationships between ASVAB scores and training results had weakened considerably, especially in the Army, where staffing requirements practically forced schools to graduate all trainees regardless of performance. Moreover, in the Army there was little relationship between ASVAB scores and such performance measures as time to promotion, supervisor ratings, and attrition rates and no data at all on the relationship between ASVAB and on-the-job performance.2 In other words, in the Service with the most serious quality problem, there was little empirical basis to defend the argument that higher-quality increased military capability by improving either training success or job performance.
Second, reliable data was just beginning to emerge concerning the cost of recruiting higher- (versus lower-) quality personnel, since the All-Volunteer Force—and free market competition between the military and civilian jobs—had been in existence for only six or seven years. Finally, no methodologies had been developed for validating enlistment standards by linking quality, job or training performance, and the cost of recruiting higher-quality personnel. Such validation methodologies were necessary for answering the critical question: How much quality is enough and for what cost?
The quality crisis led to several early experimental efforts to validate enlistment standards against job performance and costs. Most of this early work was carried out at the Rand Corporation, beginning with Rand's 1976 evaluation of the All-Volunteer Force. Analysis was carried out on data from an evaluation of Project 100,000, which had developed comprehensive and detailed hands-on performance tests for four Army jobs—armor crewman, vehicle repair, supply specialist, and cook (Vineberg and Taylor, 1972). These Project 100,000 job performance tests were unique in several respects, including: (1) use of job analysis to determine both critical and commonly performed tasks; (2) design of a performance test instrument for each task, in which each step of a task could be scored as performed correctly or incorrectly; and (3) a field testing situation in which job incumbents actually performed each task (with real equipment) and were scored by a former noncommissioned officer experienced in those jobs.
During 1980–1981 Rand carried out additional analyses on a second source of data, the Army Skill Qualification Test (SQT). The SQT, developed as an operational version of the job performance tests developed for Project 100,000, included three components: a hands-on performance test; a
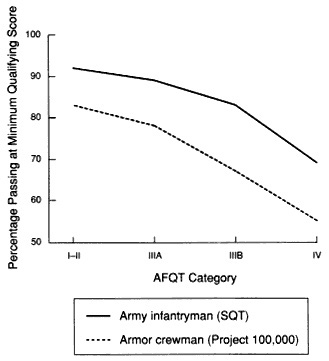
Figure 1 Job performance and AFQT (from the Rand Project 100,000 and SQT studies).
job knowledge test, and a certification component (e.g., firing range qualifications). Reasonably reliable SQT tests had been developed for several Army jobs, the first of which was infantryman. The Army began using the SQT as a basis for promotion to the higher grade levels, requiring a score of 60 percent (correct) to establish a minimum level of job proficiency.
The early Rand studies led to two preliminary conclusions. First, there was a substantial relationship between ASVAB scores and on-the-job performance tests for first-term enlistees, including the largest combat specialties. Figure 1 shows the relationship between AFQT and the percentage passing on-the-job performance tests for the two largest Army combat jobs. The on-the-job performance tests shown are the SQT for infantryman and the Project 100,000 test for armor crewman.3 The relationship between
percentage passing and AFQT categories is quite strong. For armor crewmen, over 80 percent of Category I and II first-termers could pass the Project 100,000 performance test, compared with only about 55 percent of the Category IV personnel. Category IIIA also had high qualifying scores, but less than 70 percent of Category IIIB first-termers passed. For infantryman, only 70 percent of Category IV passed the SQT, compared with over 90 percent of Category I and II first-termers.4
The second conclusion was that optimal quality standards could be determined using a cost/performance trade-off model. Using a criterion of qualified man-months—the number of months of service by first-termers who remained in the military and who could pass the SQT—it was found that the cost per qualified man-month (including recruiting, training, and compensation costs) was much higher for the 1980 quality mix (which included 50 percent Category IV) than fro alternative mixes with higher levels of quality. The model for infantryman showed an optimal cost-performance mix: about 18 percent Category IV, 30 percent nongraduates, and 35 percent Category I–IIIA high school graduates, the latter being considered by the Services to be high quality (Armor et al., 1982). An improved model was applied to four Army jobs in a later study (Fernandez and Garfinkle, 1985).
The quality crisis also generated a response by Congress. Although the analytic work was still under way, it was clear that the very low quality levels of the 1979 and 1980 recruits were going to be unacceptable by any standard or model. On the basis of discussions with the Services and with some input from those conducting formal analyses of quality requirements, in 1981 Congress passed legislation setting maximum limits of 20 percent Category IV and 35 percent nongraduates for new recruits. It also responded positively to calls for higher military pay, benefits, and recruiting budgets. Military pay was increased to be more competitive with civilian jobs, education benefits and enlistment bonuses were approved, and recruiting budgets expanded considerably to pay for more recruiters and national advertising campaigns.
Finally, the quality crisis inspired the JPM Project, which was initiated by the assistant secretary of defense for manpower in 1980 but formally mandated by the Defense Appropriations bill for fiscal 1983. The JPM Project was the first DoD effort to attempt to formally validate enlistment
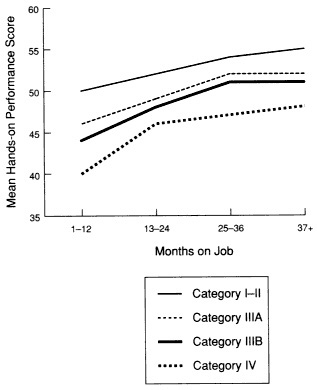
Figure 2 Job performance and AFQT (from the JPM Project, by AFQT and job experience).
quality standards against on-the-job performance criteria in all the Services. A Joint-Service working group was established, comprised of both policy and technical representatives from each of the Services. The working group established technical standards for hands-on performance tests and ASVAB validation requirements, and for the next 10 years the working group monitored the development and administration on hands-on job performance tests as the first step in the validation process.
Figure 2 presents a summary of the basic relationship between AFQT, job experience, and hands-on performance tests developed by the JPM Project for 25 jobs in all four Services (first-term enlistees only). 5 The relationship between AFQT and hands-on performance is not as strong as that found in
the original Project 100,000 study, but it is consistent across all levels of experience for first-termers. The most important difference, that between Category I–II and Category IV personnel, amounts to about one-half of a standard deviation. Note that there is also a fairly small difference between Category IIIA and IIIB first-termers, who score about halfway between the highest and lowest categories. The experience relationship is also weaker than many analysts might have expected, but it is strongest for Category IV personnel. A Category IV first-termer with three years of service scores about the same as a Category IIIA personnel with one year of service. At the end of the first term, however, higher-aptitude personnel still score higher than persons with lower aptitudes, but the relationship is not as pronounced as at the beginning.
The fact that ASVAB scores are correlated with on-the-job performance measures provides considerable relationale for DoD policies that base eligibility for service on ASVAB test scores. Yet this relationship by itself does not provide a specific set of quality standards or a quality mix that answers the question: How much quality is enough, and for what cost? The answer to that question requires a cost/performance trade-off model, which was finally developed between 1990 and 1993 and is described in detail elsewhere in this volume.
QUALITY REQUIREMENTS AND TRENDS
Although there was no fully developed analytic methodology for validating enlistment standards against cost and performance criteria until the early 1990s, the Services nonetheless ahd to set and apply enlistment standards throughout the 1980s. The Services did have some empirical data to justify quality requirements, but for the most part they relied on the positive correlation between aptitudes and performance coupled with the traditional assumption that "more is better." Indeed, as will become clear from the quality trends described later, "more is better" can be inferred as the only consistent standard for enlisted quality between 1980 and 1993.
Quality Requirements, 1985–1989
In the 1985 Defense Authorization Act, the Services and DoD were required to review trends in enlisted quality and to establish quality requirements for 1985 to 1989. The study was motivated by congressional concerns that the high levels of quality recruited in 1984 might not be sustainable or affordable due to a number of factors, including economic recovery, falling unemployment, and the shrinking supply of youth.
Figure 3 presents the enlisted quality requirements established by each of the Services in this study. The figure shows three indicators that summa-
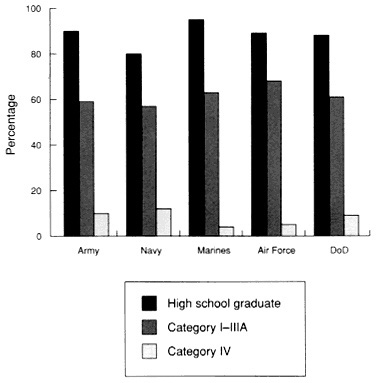
Figure 3 Quality requirements (for active enlisted accessions without prior service, fiscal 1985–1989). Source: DoD report to Congress on defense manpower quality, May 1985.
rize enlisted quality standards for a Service as a whole: percentage high school diploma graduate; percentage AFQT Category I–IIIA (over the 50th percentile); and percentage AFQT Category IV (10th to 30th percentile).
The stated requirements for high school graduates range from 80 to 95 percent, with an average of 88 percent for DoD as a whole. The requirements for Category IV are very low by historical standards, ranging from 4 percent in the Marine Corps to 12 percent in the Navy and averaging 9 percent for DoD as a whole. The requirements for Category I–IIIA average 61 percent for DoD as a whole—very high by historical standards. This quality indicator runs about 5 points higher than the DoD definition for high quality, Category I–IIIA high school graduates, which was not defined in the DoD report. Interestingly and not surprisingly, these five-year requirements are very close to what each of the Services had recruited in 1984. In
other words, the Services told Congress that the actual enlistment quality levels as of 1984 could suffice as requirements over the next five years.
As we shall see, actual enlistment quality did resemble these requirements between 1985 and 1989 but not after 1989. To our knowledge, neither the Services nor DoD conducted a formal quality requirements study or revised quality standards for later years, even though conditions changed dramatically with the force structure reductions beginning in 1990. Now that appropriate technical tools have been made available by the JPM Project, it would be quite easy to remedy this situation and establish new quality requirements for the new, smaller force structure of the 1990s.
Trends in Enlisted Accessions and Quality
One of the principal factors that determines the supply and the cost of higher-quality recruits is total staffing requirements as dictated by the force structure. Holding the quality mix and other external factors constant, a larger force means more high-quality enlistees, which in turn increases the marginal cost of recruiting additional high-quality people. Likewise, as the force shrinks, recruiting costs for a constant quality mix should also decline. This relationship is modified by the size of the youth population, with the cost of high quality increasing as the youth population declines.
Figure 4 plots the total number of active enlisted accessions without prior service between fiscal 1981 and 1992, with projections for fiscal 1993 to 2000 based on a 1.4 million active force as proposed by President Clinton. To indicate changes in the youth population, the figure also shows enlisted accessions as a percentage of men ages 18 to 21 in the general population, which accounts for about 70 percent of all new recruits.
The active force size of about 2.1 million during most of the 1980s led to a relatively constant number of about 300,000 nonprior-service enlisted accessions. Enlisted accessions declined to about 275,000 after Defense budget reductions in 1988, and then to about 200,000 when President Bush's 25 percent force cut took effect in fiscal 1991. Assuming that the active force size falls to 1.4 million as proposed by President Clinton, the enlisted accession requirement will fall to about 180,000 starting in 1993.
The reduction in active force size has had a dramatic impact on the fraction of the youth population needed to meet the corresponding accession requirements. The greatest pressure on supply occurred during the mid-1980s, when accessions were stable and the youth population was declining, during which time the fraction of youth needed for accessions rose to about 4 percent. After 1989, however, the fraction of youth needed for requirements began falling sharply, and by the time the size of the youth population reached its lowest point in 1993, the drop in accession requirements
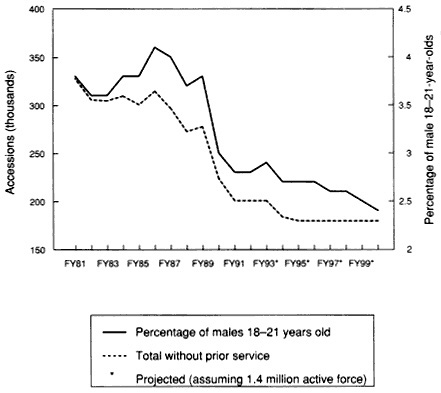
Figure 4 Active enlisted accessions.
lowered the fraction to less than 3 percent. Moreover, the youth population begins growing after 1993 (due to a mini baby boom during the late 1970s), which means the fraction of youth needed for recruiting by fiscal 2000 should reach a modern-day low of less than 2.5 percent.
Given the reduced demand for enlisted accessions, both supply and cost considerations become more favorable for higher-quality recruits. The Services could to this more favorable recruiting climate in one of two ways: they could keep the quality mix constant and reduce recruiting costs, or they could keep recruiting costs relatively high and increase the number of higher-quality recruits. It appears that the second scenario is the one actually adopted, in spite of the stated quality requirements shown in Figure 3.
Actual trends in enlisted quality between 1980 and 19 92 are shown in Figure 5. The combination of increased military pay, education benefits, enlistment bonuses, advertising, and other recruiting improvements led to
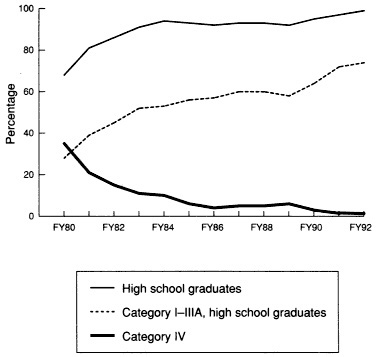
Figure 5 Trends in quality: education and aptitude indicators for active enlisted accessions.
dramatic increases in quality levels between 1980 (the low point in quality for the All-Volunteer Force) and 1985. For DoD as a whole, the percentage of high school graduates climbed from 65 to 90 percent, the percent Category IV declined from 35 to 5 percent, and the percentage of high-quality recruits—Category I–IIIA high school graduates—increased from 28 to 56 percent during this five-year period. These figures are unmatched not only in the years of the All-Volunteer Force, but also during the peacetime draft years after World War II.
The quality mix was relatively stable between 1985 and 1989, with few notable changes in either education or aptitude levels. In fact, the actual quality mix is quite close to the quality requirements shown in Figure 3, with the exception that the actual percentage of Category IV is about one-half of the stated requirements. Starting in 1990, however, and coinciding with the large force reductions after 1989, the quality levels again increased sharply. By fiscal 1992, remarkably, there wre 1 percent non-high school graduates and only 1 percent Category IV personnel. Even more signifi-
cant, the percentage of high-quality recruits grew to an unprecedented 75 percent.
There is very little basis in either military research or military policies since World War II to suggest that a capable military force requires three-fourths of its enlistees to be from the upper half of the national distribution of vocational and mental aptitudes, or that there should be virtually no one from the lowest one-third of the distribution. Although no official quality requirements were announced after 1985, the fact that the most recent quality mix is so much higher than the 1985–1989 official requirements—which were already at historic highs—suggests very strongly that the fundamental quality standard is ''more is better" (if not "all is best")!
Quality Supply and Demand
The increasing quality levels after 1989 can be explained in several ways. Common to any explanation is the fact that total accession requirements have declined significantly. We would expect that the demand for military service would also decline, not only because of reduced recruiting emphasis but also because of the Persian Gulf War. One scenario that would explain increased quality levels is that the supply of military service has decreased more among lower-quality youth than among higher-quality youth, to the point that there are not enough lower-quality youth to meet the 1985 requirements. Another scenario is that there is excess supply at all levels, and the military services are simply choosing to maximize whatever quality is available.
We can evaluate the supply situation in part by examining trends in applicants for the active enlisted force and comparing accessions with the applicant pool. The trends for applicants and accessions without prior service are shown in Figure 6 by AFQT for the years 1988 to 1992. While there are significant declines in applicants after 1990 for all AFQT levels, nevertheless the supply of potential recruits exceeds the stated 1985–1989 quality requirements (Figure 3) at all levels of quality. For example, the total number of male accessions for the active force was approximately 172,000 in 1992. If the 1985–1989 quality requirements were applied to this number, they would generate a need for approximately 105,000 male recruits in Category I–IIIA, 52,000 in Category IIIB, and 15,000 in Category IV that year.
The actual male accessions shown in Figure 6 are quite different from the 1985–1989 stated requirements, being 128,000 for Category I–IIIA, 43,000 for Category IIIB, and only about 300 or so for Category IV. Clearly, the Services are recruiting more high-quality men than called for by these earlier requirements. Moreover, the accession trend lines for fiscal 1990 to 1992 show a striking contrast between high-quality recruits and the other
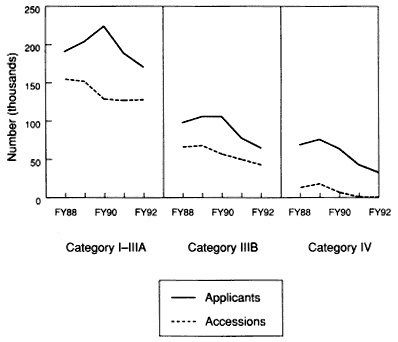
Figure 6 Applicants and accessions by AFQT (males, active enlisted force without prior service).
two groups. The number of Category I–IIIA male recruits remained virtually constant at about 128,000 during this period, while the number of Category IIIB fell from 57,000 to 43,000 and the number of Category IV fell from 7,000 to about 300. In other words, virtually all of the reduced accessions were absorbed by Category IIIB and IV recruits.
It would appear from these data that there is indeed an excess of supply at all levels, at least up through fiscal 1992, including that for high-quality categories. The Services have apparently made decisions to take virtually all of the reduction in force from the lower recruit quality levels, particularly Category IV.
There is nothing intrinsically wrong with these recruiting decisions, and indeed the new JPM cost/performance trade-off model may well justify this high-quality mix. When the supply of high-quality recruits exceeds demand, then the marginal cost of recruiting additional high-quality personnel should decline, which makes a high-quality mix more cost-effective (or at least no more costly than one with a lower-quality mix). If this scenario is correct, of course, we would expect to see a corresponding reduction in relative recruiting costs.
To the extent that anyone (such as Congress) questions the very high quality levels between 1990 and 1992, DoD and the Services could offer a more credible defense if the JPM model justified this quality mix. Otherwise, it be would reasonable to assume that the Services are simply following the traditional "more is better" rule for setting manpower quality requirements.
FUTURE TRENDS AND ACTIVE-RESERVE ISSUES
The previous sections have focused primarily on quality requirements for the active forces. This section looks to the future with a focus on the relationship between quality requirements and the active-reserve mix.6
The framework we use for this discussion is one of total force demands for enlisted military personnel for both active-duty and reserve forces. Figure 7 displays a simple schematic for total force supply and demand. It highlights the flows into and out of various personnel states without delving into the complexity of cohort timing, which, although important from a personnel management point of view, is not important from our macro perspective. Starting from the left of the chart, we depict the demands for nonprior-service accessions into the active and reserve enlisted ranks from the available pool of male and female youth. Current projections estimate the demands to be about 180,000 for the active force and about 70,000 for the reserve forces.
Active force accessions are enlisted in the active force to serve what is usually called a first term of enlistment. After beginning service, one of several paths may be taken. Attrition during the first term may occur for disciplinary or other performance-related reasons. The two most common paths, however, are either to complete the first term of service and return to civilian life or to reenlist and enter the career force. In the latter stages of this process, successive options to reenlist or return to civilian life occur until mandatory retirement is enforced. The important point about these flows is that those who leave active-duty military service under honorable circumstances are potentially eligible to enter the reserve forces. This is a critically important link between active-duty personnel policy and reserve force structure.
The total force composition of reserve force accessions is also shown in Figure 7. About 70,000 young men and women with no prior military experience are currently planned to be recruited from the available youth population to serve in the reserve forces. A much larger number, about
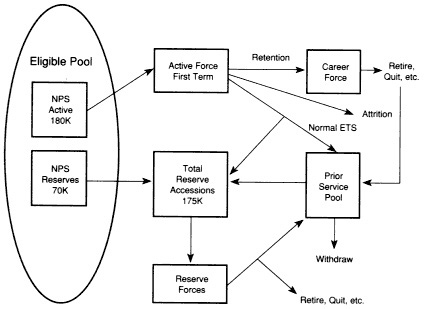
Figure 7 Total force supply and demand. (ETS = expiration of term of service)
105,000, are to be recruited from the pool of those who have prior service. We show this in the figure as the flow from the prior service pool into the total accessions pool of 175,000. What we referred to above as a "critically important link" between active and reserve forces personnel policies is clearly delineated in this framework. The reserves rely heavily on the flow out of active-duty status. This is only natural. Since reserve personnel serve so little time, the experience they gain on active duty means that less time must be devoted to training while still maintaining an adequately trained force. Indeed, it is questionable whether, for many technical occupational specialties, it would be possible to use personnel without prior service at all. Using prior-service personnel may not only be cost-effective, but may also be the only way to have certain skills and occupations in the reserve forces at a reasonable cost.
With this framework of flows in mind, let us turn to examine what the future may hold. Figure 8 displays data similar to Figure 4 above, and, not surprisingly, portrays the same conclusions. The figure displays two trends. The first is the historical and projected trend of the number of 18-year-old men. The projection is shown only to the year 2000, but subsequent years immediately past 2000 also show a continued upward trend from the trough experienced in fiscal 1993. The second data series depicts the historical
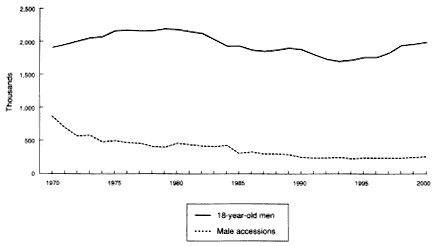
Figure 8 Trends in male accessions and available male youth.
and projected trend in male accessions to the active-duty enlisted force. Obviously, the projected trend is speculative. It assumes that accessions will be maintained at a level of about 180,000 persons per year, consistent with the small active-duty force that is currently planned. Despite the conjectural nature of this forecast, it is clear that raising the number by 40,000 would not alter the fundamental conclusion that we restate here. Given the increasing youth cohort eligible for military service, it is an inescapable fact that the gross number of persons projected to be available for service implies that there should be no shortage of accessions. Furthermore, it also implies that DoD will be able to continue recruiting the numbers of high-quality recruits that it achieves today because of the increasing pool.
This conclusion holds for both active and reserve forces. We have shown the high quality of the active force in previous sections, but the same high quality is also found in reserve force nonprior-service accessions. Figures 9 and 10 show nonprior-service high school diploma graduate accessions and Category I–III accessions as a percentage of total accessions. Each component is very high on the two measures of quality and is similar to the active-duty force. Therefore, there does not appear to be any reason to think that the available supply of quality and quantity will be deficient in the near term. This conclusion, that both numbers and quality will not be a problem in the near future, is buttressed by the fact that the role of women in the military is increasing significantly. This greatly increases the pool of high-quality persons available for military service. The availability of more
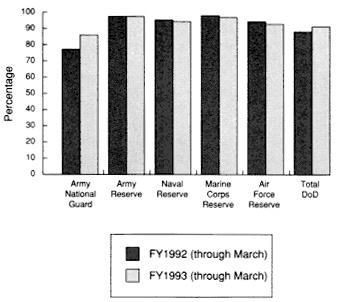
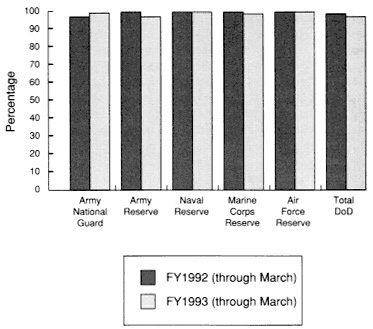
women for noncombat specialties will increase the number of high-quality men available for combat jobs.
In summary, examining the supply-demand balance until the year 2000 suggests that there appear to be no aggregate shortages of the quantity or quality of nonprior-service accessions. But what about the availability of prior-service personnel for the reserves? The same conclusion pertains, but for a different reason. Because the active-duty force is shrinking, thus increasing the numbers of voluntary and involuntary separations, the available supply of prior-service personnel will be increased for the next several years. Therefore, there will be more than an adequate supply of prior-service personnel available to the reserves over this period. That is not to say that one might not find regional shortages and skill imbalances, but these problems can be managed. So, in general, both the active-duty and the reserve forces should be able to draw from pools that are sufficiently large to ensure adequate numbers of high-quality accessions until the year 2000 or so. Indeed, because the supply of high quality would appear to remain large and thus inexpensive to maintain, there might be room to pursue other goals (e.g., social representation) with the enlisted force.
But lest we appear complacent about the ease with which the future can be managed, let us turn to thinking beyond the turn of the century. Despite the fact that the prior-service eligible pool will remain large for some time, there are some significant management challenges ahead of us.
Consider the maintenance of a cost-effective, all-volunteer, active-duty enlisted force. Because of the issue of costs and productivity, this force tends to be a very experience-intensive force. That is, it is a force with a large proportion of members concentrated in the career force. Consequently, relatively few accessions are needed to support first-term demands, and a very large share of the first-term force transitions into the career force, leaving little left over for the prior-service pool eligible for reserve duty. These force parameters are generally those associated with a "low flow" volunteer force and would be expected of the active-duty force once our military forces stabilize at low levels. If reserve forces do not decline with the active force, then reserve accession demands may become large relative to the size of the prior-service pool. This would inevitably lead to shortages unless significant actions were taken.
There are two very different policy options available to cope with the situation outlined above. One could increase reliance on nonprior-service accessions for the reserves, or one could increase active-duty accessions considerably, making the active-duty force rely much more heavily on first-term personnel and creating much higher flows out to the prior-service enlisted pool available to the reserves.
Both of these options require increased knowledge of, and emphasis on, "quality" accessions. For example, if the reserves rely on more nonprior-
service personnel, perhaps quality would have a higher payoff in the reserves than in the active force. Quicker training times would be even more important in the reserves, and better skill retention might also result. The productivity of quality, therefore, might be even higher relative to its cost than in the active force. In a junior force mix, therefore, quality might be the key to a cost-effective mix of personnel. If, however, one adopts a "high flow" volunteer force model to produce more prior-service personnel available for reserve duty, then the cost of quality may rise considerably, seemingly making the All-Volunteer Force more expensive. However, since these associated costs were incurred to pursue reserve strengths, the costs of this policy should be allocated to the reserves, not to the active forces.
As we have discussed, there are no particular near-term concerns regarding quality. Barring serious mismanagement, the active and reserve force structures should be sustainable. However, in thinking about the situation beyond the turn of the century, it is apparent that future active-reserve mix policies will probably conspire to make quality an issue again. Compared with the knowledge we have gained about active-duty enlisted personnel, we know surprisingly little about the relationships between quality and job performance in the reserves. It is not too early to start the research we need to understand these relationships so we can be ready to provide well-informed policy advice when it is certain to be needed.
CONCLUSION
In the preceding pages we have sketched out the changes in forces, force mixes, and demographic trends that have given rise to the various issues surrounding quality. As we said at the outset, the questions today are much different than those that existed in 1980. In the early period, quality was at the very heart of the viability of the All-Volunteer Force. It appeared doubtful that quality standards could even be maintained at low levels in the face of the declining youth cohort and expected compensation levels.
Today the question seems to be one of how much quality is enough. Indeed, some people would say the All-Volunteer Force has too much quality, that the supply of quality exceeds the demands. There is no doubt that this position is overly simplistic, but at the very least we should raise the same type of question that was raised during the quality crisis 15 years ago. At that time, there was consensus that military personnel and recruiting expenditures had to be raised to meet quality requirements. Should we not also ask today, with our unprecedented levels of high quality, whether we are spending more on personnel and recruiting costs than is necessary to maintain a reasonable level of quality?
Finally, despite the fact that we expect the next several years to pro-
duce adequate supplies of both quality and quantity to both active and reserve forces, we also raise questions about management of the total force after the current reduction in force has been fully implemented. Beyond the year 2000 we may face significant trade-offs of quality for quantity in the active or reserve forces depending on what management strategies of force mix are pursued. We have argued that we need to increase our knowledge of cost/performance trade-offs in the reserves so as to better position DoD to make sound management choices over the next several years.
Of even higher priority, we have suggested that it is important to use the cost/performance methods developed in the JPM Project to evaluate the current high-quality force mix that is emerging today. If a cost/performance trade-off model could defend the increases in manpower quality and costs that took place after 1980, will the JPM model justify the high levels of manpower quality and recruiting costs today? Application of the JPM model to these questions would put the methodology in the policy mainstream and solidify its value to manpower policy managers in coming years.
REFERENCES
Armor, David J., Fernandez, Richard L., Bers, Kathy, and Schwarzbach, Donna 1982 Recruit Aptitudes and Army Job Performance. R-2874-MRAL. Santa Monica, Calif.: The Rand Corporation.
Cooper, Richard V.L. 1977 Military Manpower and the All-Volunteer Force. R-1450-ARPA. Santa Monica, Calif.: The Rand Corporation.
Fernandez, Richard L., and Garfinkle, Jeffrey B. 1985 Setting Enlistment Standards and Matching Recruits to Jobs Using Job Performance Criteria. R-3067-MIL. Santa Monica, Calif.: The Rand Corporation.
Vineberg, Robert, and Taylor, Elaine N. 1972 Performance in Four Army Jobs by Men at Different Aptitude (AFT) Levels: 3. The Relationship of AFQT and Job Experience to Job Performance. Technical Report 72–22. Alexandria, Va.: Human Resources Research Organization.


