
Part II:
Job Performance Measurement Issues
The JPM Project was an ambitious effort to measure on-the-job performance of enlisted military personnel. The project offered researchers the opportunity to test hypotheses about differences between hands-on measures of job performance and paper-and-pencil surrogates of performance, about ethnic group differences in performance, and about gender difference in performance. Among the many concerns of the JPM Project and the committee, three were of primary interest. The first concern centered on the adequacy of test administration activities, such as scheduling, test security, and administration consistency from one individual to the next. A second concern was that the scaling of hands-on performance scores should go beyond rank ordering. That is, there was a need for a score scale that could be interpreted in terms of, at a minimum, acceptable and unacceptable performance, and preferably at finer gradations. A third concern centered on how job tasks should be selected. The committee recommended that stratified, random sampling of tasks be used rather than purposive sampling. They argued that purposive selection might capture only a certain type of task amenable to testing and might not be representative of the job, whereas stratified random sampling provided an unbiased selection of representative tasks and could more easily be defended.
Part II of this volume contains two papers dealing with various aspect of job performance measurement. In the first paper, Lauress Wise addresses the three concerns listed above in a thorough analysis of issues surrounding the validity of the JPM data and data from other sources such
as the Synthetic Validity (SYNVAL) project. He also examines the appropriateness of using these data for setting performance goals in the cost/performance trade-off model.
In the second paper in this section, Rodney McCloy pursues further the critical issue of generalizing performance results from jobs on which performance has been measured to jobs for which no data are available. This issue has been of particular importance because only a few jobs were selected for detailed study in the JPM Project and there was a need to generalize the findings to the several hundred jobs performed by first-term enlisted personnel. For the current model, the multilevel regression analysis method was recommended because of its contributions to performance prediction at the job level. The SYNVAL approach was considered but was deemed too time-consuming for the present project. McCloy discusses the application of the multilevel regression analysis in detail.
Setting Performance Goals for the DOD Linkage Model
Lauress L. Wise
The times certainly are changing, particularly for the Department of Defense (DoD). The types of threats to which we must be ready to respond are changing; the size of the forces available to respond to these threats has decreased significantly and is likely to decrease further yet; and the resources available for recruiting, training, and equipping our forces have also declined dramatically. The debate continues as to how much we can afford to spend on defense in the post-cold war era and how much we can afford to cut. Efforts to keep missions, forces, and resources in some kind of balance are now focused on an emerging concept of readiness.
The DoD cost/performance trade-off model can play a central role in balancing readiness and resources. Those who sponsored the development of this model could not possibly have anticipated the importance of their efforts, but now that the model is nearing completion, the need for this type of linkage is all too obvious.
The model actually contains two separate linkages. Recruiting resources are linked to the levels of recruit quality, defined in terms of aptitude scores and educational attainment, obtained through application of the recruiting resources. In this first linkage, the model also suggests optimal mixtures of expenditures for recruiters, advertising, and incentives that will yield a given recruit quality mix with the smallest possible total cost. The second linkage is between recruit quality and performance in specific occupational specialties. The full cost/performance trade-off model takes specifications for required performance levels for each different job or family of jobs, deter-
mines a recruit quality mix that will yield the desired performance levels, and predicts the recruiting costs required to obtain this mix of recruit quality.
One more linkage is needed. The final step is to tie the emerging concept of readiness to levels of performance in different military specialties. This is, of course, a rather large step. Readiness is not yet a well-defined notion, but it is doubtlessly related to the number and effectiveness of different types of units, with unit effectiveness further related to individual performance levels. The focus of this paper is not, however, on how this last linkage might be achieved, but rather on how we might best set goals for performance levels today, while we are waiting for this final linkage to be created.
The DoD model has allowed us to replace the question of ''What level of recruit quality do we need?" with the question "What level of performance do we need?" The goal of this paper is to discuss issues and methods of trying to answer the latter question with information that is currently available to DoD personnel planners and policy makers.
The remainder of this paper is organized into four sections. The first section discusses issues related to the performance metric used in the DoD model. What is the meaning of the performance scale and what is a reasonable answer to the question "What level of performance do we need? The second section describes a normative approach to setting performance level goals. The general idea is to look at predicted performance levels for new recruits at different times and see how these levels varied across time and by job. At the very least, this normative approach will provide plausible ranges for performance level goals. The third section describes criterion-referenced approaches to setting performance level goals. In such an approach, judgments about the acceptability of different levels of performance are analyzed, and then additional judgments about minimum rates of acceptable performance are also collected. The final section lays out suggestions for additional research to further strengthen the support for specific performance level goals.
THE PERFORMANCE METRIC: DESCRIPTION OF THE SCALE FOR HANDS-ON PERFORMANCE QUALIFICATION
Performance in the DoD model is defined as percent-GO. The percent-GO scale is derived from the hands-on performance tests developed in the Joint-Service Job Performance Measurement/Enlistment Standards (JPM) Project. A general description of their development is provided by Wigdor and Green (1991:Chapter 4). More detailed descriptions of the development of these measures are provided by the researchers from each Service who worked on their development. Campbell et al. (1990) describe the
Army measures; the Air Force procedures are documented in Lipscomb and Hedge (1988). The description by Carey and Mayberry (1992) of the development and scoring of tests for Marine Corps mechanics specialties is a particularly good source, since this was one of the last efforts undertaken and it built on lessons learned in earlier efforts.
As described by Green and Wigdor (1991), the hands-on performance test scale is an attempt to create a domain-referenced metric in which scores reflect the percentage of relevant tasks that a job incumbent can perform successfully. They were developed as criteria for evaluating the success of selection and classification decisions. An estimate of the proportion of the job that the selected recruit could perform (after training and some specified amount of on-the-job experience and when sufficiently motivated) was judged the most valid measure of success on the job.
In general terms, hands-on test scores do provide at least relative information about success on the job that is reliable and valid. As such they are quite satisfactory for the purposes for which they are intended. There are several issues, however, that affect the level and linearity of the scores derived from them. Among others, these include the sampling of tasks, the scoring of tasks, and the way in which scores were combined across tasks.
Task Sampling
In the JPM Project, a limited number of tasks was selected for measuring performance in each job. If these tasks were selected randomly from an exhaustive list of job tasks, generalization from scores on the hands-on tests to the entire domain of tasks would be simple and easy to defend. This was not, however, the case. Task sampling procedures varied somewhat across the Services. In nearly all cases, there was some attempt to cluster similar tasks and then sample separately from each cluster. In the Army, for example, a universe of up to 700 tasks (or task fragments) was consolidated into a list of 150 to 200 tasks; these tasks were then grouped into 6 to 9 task clusters. One, two, or possibly three tasks were then sampled from each of these clusters. This stratified sampling approach actually leads to a more carefully representative sample of tasks in comparison to simple random sampling. Technically, however, this approach also meant that tasks in different clusters were sampled with different probabilities. Statistical purists might require differential weighting of task results, inversely proportional to sampling probabilities, in order to create precise estimates of scores for the entire domain.
A second and more serious concern with the task sampling procedures is that many types of tasks were either excluded altogether or were selected with very low frequency. There was an attempt to collect judgments about the importance of each task as well as the frequency with which it was
pertormed. Few, if any, low importance or infrequent tasks were selected. In addition, some tasks were ruled out because it would be difficult or dangerous to collect work samples. Tasks for which poor performance by unsupervised recruits could result in damage to individuals or equipment were generally excluded. Tasks that were too easy (did not discriminate among incumbents) and, in a very few cases, too difficult were often excluded from consideration. A consequence of these exclusions is that performance on the sampled tasks generalized more precisely to performance on all job tasks that were judged moderately to highly important, were frequently performed, were not too dangerous, and were challenging enough to be at least a little difficult. This generalization is not necessarily bad, but the relevant domain should be kept in mind when it comes to setting performance standards. Higher performance levels would almost surely be expected for important and frequent tasks than for less important and less frequent tasks, but lower performance levels might be required for less dangerous tasks in comparison to more dangerous tasks; lower performance levels would also be expected for more difficult tasks in comparison to trivially easy tasks. In theory, these differences might offset each other, but to an unknown extent, so that performance on the sampled tasks might not be much different from performance across the entire job domain as called for by the Committee on the Performance of Military Personnel.
Task Scoring
In their "idealized" description of a competency interpretation of the hands-on performance test scores, Green and Wigdor (1991:57) talk about the percentage of tasks in the job that an individual can do. Task performance is not, of course, dichotomous in most cases. For the most part, tasks were divided into a number (from 3 or 4 to as many as 20 or 30) of discrete steps, and criteria were established for successful performance of each of these steps. Naturally there were exceptions: the "type straight copy" task for Army clerks was scored in terms of words-per-minute adjusted for errors, one of the gunnery tasks for Marine Corps infantrymen was scored in terms of number of hits on target. For the most part, however, dichotomous scores were awarded for each of a discrete number of observable steps. In many or most cases, the criterion for successfully performing a step was clear and unambiguous. A mechanic changing a tire either did or did not tighten the lug nuts before replacing the cover, for example. In other cases, the criterion was somewhat arbitrary, as in "the grenade landed within some fixed (but mostly arbitrary) distance of the target'' or "the rifle was disassembled within an arbitrarily fixed amount of time." (These standards may have had some strong rationale, but they were not always obvious to the test developers.)
The discrete performance steps varied in terms of their criticality. If a job incumbent had to perform every step successfully in order to be considered successful on the task as a whole, than task success rates would be very low. The scoring generally focused on the process followed more than the overall output. In many cases, it was possible to achieve a satisfactory output even if some of the less critical steps were skipped or poorly performed. Weighting each of the individual steps according to their importance would have required an enormous amount of judgment by subject matter experts and would, in most cases, have led to less reliable overall scores. For purposes of differentiating high and low performers, the percentage of steps performed correctly, without regard to the importance of each step, proved quite satisfactory. When it comes to interpreting the resulting scores, however, it is in most cases impossible to say how many tasks an individual performed correctly because task standards were not generally established. Thus, the real interpretation of the hands-on test scores should be the percentage of task steps that an individual can perform correctly, not the percentage of tasks.
Combining Scores from Different Tasks
For the most part, the scores for each task were put onto a common metric—the percentage rather than number of steps performed successfully—and then averaged to create an overall score. Since the individual task scores were not dichotomous, there was some room for compensation with very high performance on one task (e.g., all steps completed successfully on a difficult task) compensating for somewhat lower performance on another task (e.g., several steps missed on a relatively easier task). As noted above, the tasks were not a simple random sample from a larger domain, and some form of task weighting—either by importance and frequency or by sampling probabilities—would have been possible. The fact that weights were not used should not create problems in interpretation so long as there were not highly significant interactions between task difficulty and importance or frequency. Some bias in the overall scale would also have resulted from the conversion from number to percentage of steps if there were a strong interaction between the number and difficulty of the steps within each task.
Several of the Services also examined different ways of grouping tasks or task steps into clusters in order to create meaningful subscores. The Army analyzed scores from six general task clusters: communications, vehicle operation and maintenance, basic soldiering, identifying targets or threats, technical or job-specific, and safety. Groupings of individual task steps into four knowledge and two skill categories were also analyzed. The Marine Corps created a matrix that mapped task steps onto different "behavioral elements." Although interesting, these subscores did not lead to
significant findings and have little bearing on the issue of setting overall performance standards.
In summary, the hands-on test scores derived from the JPM work do lend themselves to an interpretation of job competency. They are scaled in terms of the percentage of steps for important tasks that an individual will perform successfully. It is not unreasonable to interpret these scores in a general sense as the percentage of the central or important parts of the job that the individual can perform successfully. Since a great deal of aggregation is involved in setting performance requirements for the DoD model, a general sense interpretation is probably quite sufficient. Many of the issues raised above could be of significant concern if scores on individuals were being interpreted. Given the imprecision of the prediction of the performance scores from enlistment tests and high school credentials and the highly aggregated nature of the predictions, it seems reasonable to proceed with a general "percentage of job" interpretation.
A NORMATIVE APPROACH
One approach to setting performance level requirements is to ask what levels we have experienced in the past. This is essentially a normarive approach in which requirements for future years are tied to norms developed from prior years. If an important objective of the DoD model is to determine whether current quality levels are sufficient or perhaps excessive, then this normative approach is entirely circular, since performance level requirements will be tied back to current quality levels. Furthermore, we would be better off simply using aptitude scores to define quality requirements, since very little new information would be generated in linking performance requirements back to current or past quality levels.
At a more detailed level, however, several interesting questions can be addressed through analyses of normarive data. First is the question of the degree of variability in predicted performance levels across jobs. It may well be, for example, that observed differences in recruit quality are evened if high-quality recruits are more likely to be assigned to difficult jobs. A high-quality recruit assigned to a difficult job may end up being able to successfully perform the same percentage of job tasks as a lower-quality recruit in an easier job. If this were the case, then performance level requirements might generalize to new jobs more easily than quality requirements would.
Another question is how much predicted performance levels have varied over time, overall and by job. If performance levels have varied considerably, then using past performance levels to set future requirements would be questionable. If, however, performance levels (and performance level differences among jobs) are relatively stable across time, using past perfor-
mance levels as a benchmark would be more defensible, although, with dramatic changes in force levels, job requirements may not be as stable in the future as they have been in the past.
Samples
To examine these questions, the fiscal 1982 and 1989 accession cohorts were selected for analysis. The 1982 cohort was the earliest cohort for which the current form of the Armed Services Vocational Aptitude Battery (ASVAB, beginning with forms 8/9/10), was used exclusively in selection. This is important because the performance prediction equations in the linkage model are based on the subtests in the current ASVAB. Earlier ASVAB forms had different subtests and a number of assumptions would be required in generating AFQT and technical composite scores from these prior forms for use in the prediction equation. The 1989 cohort was the most recent for which data on job incumbents with at least two years of service are available. In addition, recruits from this cohort participated extensively in Operation Desert Storm and so some global assessment of their readiness is possible.
For each cohort, the active-duty roster as of 21 months after the end of the enlistment year was examined to identify incumbents in the 24 JPM specialties. The primary military occupational specialty (MOS) at time of enlistment was considered as the basis for sorting recruits into jobs, but it was discovered that many recruits are not enlisted directly into several of the JPM specialties. Consequently, it was decided to select for the JPM specialties on the basis of MOS codes at about 24 months of service. This decision meant that recruits who left service prior to 24 months were not included, and we were thus not modeling the exact enlistment policies. However, examining score distributions among job incumbents considered successful had many advantages and was deemed entirely appropriate.
The JPM samples included 24 different specialties. One of these specialties, Air Force avionics communications specialist, was deleted from the current study. The specialty code was changed prior to the 1989 accession year, and it was not possible to determine whether there was an appropriately comparable specialty.
Variables
ASVAB scores of record were obtained. A small number of cases in the 1982 cohort had enlisted using ASVAB forms 5, 6, or 7. These cases were deleted from the analyses since the ASVAB tests included in the AFQT and technical composites were not all available in these forms. Educational credential status was also obtained and coded as either high school
graduate or nongraduate. In these analyses, recruits with alternative high school diplomas were counted among the nongraduates.
Job performance prediction equations for the JPM specialties that were developed in the Linkage Project (McCloy et al., 1992) were used. These equations use AFQT and technical composite scores (expressed as sums of standardized subtest scores), educational level, time in service, and the interaction (product) of time in service and the technical composite in a prediction equation. The weights for each predictor are determined from job analysis information from the Dictionary of Occupational Titles. A constant value of 24 months was used for time in service so that predictions would reflect "average" first tour performance for a 3- to 4-year enlistment. Since predicted performance is a linear function of time in service, the average across the first tour will be equal to the value predicted for the midpoint. Ignoring the first six months as mostly training time, the midpoint would occur at month 21 for a 3-year tour and at month 27 for a 4-year tour.
Analyses
The primary results were summarized in an analysis of variance with MOS (23 levels) and accession year (2 levels) treated as independent factors and predicted performance and the AFQT and technical composites each analyzed as dependent variables. One hypothesis tested with these analyses was that predicted performance might show smaller differences among jobs in comparison with the AFQT or technical composites. Separate intercepts (determined from job characteristics) were estimated for each job. It was plausible to believe that required performance score levels might be reasonably constant across jobs, even if input quality was not.
A second hypothesis tested was that predicted performance would show relatively smaller differences across recruiting years in comparison to the AFQT and technical composites, since predicted performance combines both AFQT and technical composite scores and the latter might be less affected by differences in recruiting conditions than the AFQT.
Findings
Across all jobs and both recruiting years, the mean test level was 68.4. Table 1 shows the sample sizes, and the mean and standard deviation of predicted performance scores for each job and entry cohort. Mean predicted performance scores by job and year are also plotted in the table. Table 2 shows the means for the AFQT and technical composites and predicted performance by year. These means are adjusted for differences in the MOS distributions for the two years. Table 3 shows F-ratios testing the
TABLE 1 Mean Predicted Performance by Job and Entry Cohort
|
|
|
1982 |
|
|
1989 |
|
|
Mean |
|
Service |
MOS |
N |
Mean |
S.D. |
N |
Mean |
S.D. |
89–82 |
|
Army |
11B |
10657 |
62.49 |
3.42 |
10341 |
62.71 |
3.15 |
0.22 |
|
|
13B |
5178 |
60.33 |
3.74 |
4065 |
59.69 |
3.55 |
-0.64 |
|
|
19E |
2585 |
64.98 |
3.27 |
2892 |
64.83 |
3.34 |
-0.15 |
|
|
31C |
1497 |
71.35 |
2.94 |
1615 |
73.04 |
1.88 |
1.69 |
|
|
63B |
1915 |
74.17 |
3.00 |
3123 |
73.84 |
2.91 |
-0.33 |
|
|
64C |
3079 |
59.76 |
2.85 |
3902 |
59.45 |
3.06 |
-0.31 |
|
|
71L |
3455 |
63.98 |
3.45 |
1490 |
64.72 |
2.26 |
0.74 |
|
|
91A |
2863 |
66.10 |
2.71 |
4013 |
65.69 |
2.83 |
-0.41 |
|
|
95B |
3397 |
69.56 |
2.12 |
3725 |
68.85 |
2.23 |
-0.71 |
|
USAF |
122 |
205 |
67.14 |
2.95 |
235 |
67.97 |
2.15 |
0.83 |
|
|
272 |
587 |
69.11 |
2.27 |
623 |
69.77 |
1.83 |
0.66 |
|
|
324 |
355 |
76.17 |
1.89 |
152 |
75.52 |
2.09 |
-0.65 |
|
|
328 |
432 |
78.04 |
1.73 |
0 |
|
|
|
|
|
423 |
1111 |
68.32 |
2.48 |
711 |
69.52 |
2.03 |
1.20 |
|
|
426 |
867 |
78.60 |
2.53 |
744 |
78.87 |
2.12 |
0.27 |
|
|
492 |
210 |
71.73 |
3.00 |
146 |
71.86 |
1.94 |
0.13 |
|
|
732 |
816 |
62.08 |
2.87 |
765 |
63.05 |
2.07 |
0.97 |
|
Navy |
ET |
1990 |
74.85 |
2.04 |
1547 |
74.43 |
2.17 |
-0.42 |
|
|
MM |
3133 |
75.78 |
3.08 |
3805 |
75.30 |
3.07 |
-0.48 |
|
|
RM |
2202 |
70.09 |
3.07 |
2075 |
69.54 |
2.54 |
-0.55 |
|
USMC |
031 |
4392 |
61.39 |
3.21 |
3871 |
61.23 |
3.04 |
-0.16 |
|
|
033 |
947 |
61.98 |
3.01 |
1026 |
61.07 |
2.74 |
-0.91 |
|
|
034 |
960 |
78.56 |
4.87 |
1084 |
77.29 |
4.68 |
-1.27 |
|
|
035 |
1001 |
65.15 |
2.92 |
1421 |
65.71 |
2.58 |
0.56 |
|
|
Average |
53834 |
66.13 |
|
53371 |
66.26 |
|
0.12 |
significance of differences across years, MOS, and the year-by-MOS interaction for these same three variables.
The first significant finding from these analyses was that there was virtually no change in mean predicted performance between the 1982 and the 1989 cohorts, overall or for any of the jobs analyzed. A statistically significant mean gain in AFQT was offset by a significant mean drop in technical scores between the 1982 and 1989 cohorts, resulting in no significant difference in predicted performance. Second, there was some consistent variation among jobs in predicted performance levels, with lows of around 60 for Army field artillery (13B) and truck driver (64C), Air Force 732 and two of the Marine Corps infantry jobs and highs above 75 for Air Force 328 and 426 jobs and Marine Corps 034. This variation is consistent with the assumption that higher competency levels might be required in more critical or complex jobs. The variation across jobs in predicted performance was much more significant (much greater F-ratio) than the varia-
TABLE 2 Overall Mean Aptitude and Predicted Performance Scores for Fiscal 1982 and Fiscal 1989 (Adjusting for MOS Differences)
|
Fiscal Year |
AFQT (Sum of SS) |
Technical Composite |
Predicted Performance |
|
1982 |
207.52 |
162.08 |
68.42 |
|
1989 |
213.50 |
158.30 |
68.43 |
|
Average |
209.51 |
160.19 |
68.43 |
|
Note: The means were estimated main effect means from an analysis of variance and are adjusted for differences in the numbers of individuals in each MOS across the two years. In these analyses, unweighted averages of the MOS means are used resulting in slightly different values than the results in Table 1 where each MOS average was weighted by the number of accessions in the indicated year. SS = standardized subtest scores. |
|||
TABLE 3 F-Ratios Testing Components of Variance for Aptitude and Predicted Performance Scores (Based on 106,663 observations)
|
Component |
AFQT (Sum of SS) |
Technical Composite |
Predicted Performance |
|
Year (df = 1) |
723.0 |
341.2 |
0.2 |
|
MOS (df = 22) |
1074.4 |
905.4 |
15,628.1 |
|
Year* MOS (df = 22) |
58.4 |
38.01 |
43.0 |
|
SS = standardized subtest scores. df = degrees of freedom. |
|||
tion in AFQT and technical scores. One reason for this is that the within job variance of predicted performance is small in comparison to the within job variance of the predictor composites. Predicted performance is critical for all jobs, and so is restricted in range. The predictor composites, particularly the technical composite, are not as critical for all jobs. Each composite is less restricted in range for those jobs for which it is less critical, leading to greater average within job variation. A conclusion that follows from this finding is that it is probably not sufficient to use a single average performance level for all jobs. Consequently, some judgmental procedure is needed to capture essential differences in performance level requirements for different jobs.
CRITERION-REFERENCED APPROACHES
The Army investigated alternative approaches for setting job performance standards as part of the Synthetic Validity (SYNVAL) Project (Wise et al., 1991; Peterson et al., 1990). This project had two major objectives: (1) to investigate ways of generalizing performance prediction equations from a sample of jobs for which criterion data were available to the entire population of jobs and (2) to investigate ways of setting performance level standards for different jobs. To the extent that performance level standards could be linked to the test scales, the second objective relates directly to the topic of this chapter.
The SYNVAL project was conducted in three phases. The first phase involved pilot tests of job description and standard setting instruments for three jobs. The second phase involved a larger data collection with revised instruments and procedures on a larger sample of 7 jobs. In the final phase, further revisions to instruments and procedures were administered for a sample of 12 jobs to test additional issues, including generalization to one job for which no criterion data were available. The most directly relevant results with respect to standard setting come from Phases II and III.
Most work on standard setting has involved identification of a minimal passing score on a certification or criterion-referenced examination. This might seem to be exactly what is needed in setting performance standards for use with the DoD model. A common concern in education with minimum competency examinations is that they provide little motivation for students to achieve at levels well above the minimum. In setting enlistment standards, it is reasonable to ask whether it is acceptable to have all enlistees at the same minimum level or whether it would not be better to have a mix of skill levels within each occupational specialty. Particularly in situations involving teamwork, a mix of skill levels may be more optimal than inordinate homogeneity of skill levels. In the SYNVAL project, four different skill levels were defined for each job. These skill levels were tied to operational decisions that supervisors would make about job incumbents in an effort to derive cost implications for the different performance levels:
Unacceptable: the recruit cannot perform the job, is not likely to become an acceptable performer with additional training, and should be discharged;
Marginal: the recruit is not performing acceptably and should be given additional training to bring performance up to standard;
Acceptable: the recruit is performing at an acceptable level and making a positive contribution to force readiness; and
Outstanding: the recruit is performing well above minimal standards and should be given a promotion or other recognition for superior performance.
In setting performance level goals for the DoD model, standards for minimum performance should not be confused with performance level goals. Performance goals for the model should reflect a desired mix of abilities above the minimum. Ideally, economic analyses would be used to identify the mix of marginal, acceptable, and outstanding performers that is most cost-efficient for each job. Overall performance goals would then reflect an average of scores from these three performance levels, with each level weighted according to this optimal mix. As indicated below, the SYNVAL project results speak primarily to the first step of defining the different performance levels. Examples of the distributions across performance levels for incumbents in different jobs are provided, but economic analyses to identify more optimal mixes remain to be done.
Phase II Design
Five different standard-setting instruments were administered to subject matter experts in the Phase II sample of jobs as described in Peterson et al. (1990). Standards obtained from the different protocols were compared with each other. The level of agreement among judges on the standards they provided was also examined for each approach. It was important that there be adequate agreement among judges on the standards before the standards can be used to determine selection criteria.
The overall objective of this project was to generalize to jobs for which no performance data were available. For this purpose, neither standards for individual tasks nor standards for the job as a whole were judged useful, although, in retrospect, the data on overall job standards were quite informative. The primary focus was on performance dimensions defined in terms of families of related job tasks. The job performance dimensions used for the standard-setting exercises came from a preliminary version of the hybrid taxonomy (used in the job analysis; see Peterson et al., 1990). A preliminary set of 24 dimensions were identified based on job components contained in the task categories and job activities taxonomy. Not all 24 dimensions were applicable for the Phase II jobs and thus the summary tables show only those dimensions relevant to Phase II jobs.
Three different proficiency categories based on the three minimum performance levels (cutoffs) that defined the performance levels described were examined. The three proficiency categories were unacceptable (less than marginal), unacceptable and marginal combined (less than acceptable), and outstanding (greater than acceptable). The last category was described as outstanding rather than less than outstanding to enhance interpretability.
Three different standard-setting protocols are referred to here:
-
Soldier-Based Protocol (Soldier Method). Under this protocol, judges
-
were asked to estimate the percentage of current job incumbents who are performing at each of the four levels of acceptability (e.g., what percentage is unacceptable) on a given performance dimension. This approach assumes that empirical data on soldier performance are available (in the form of hands-on tests scored GO/NO-GO) on a representative sample of the soldiers in question so that these "percentage-performing" estimates can be related to actual performance scores.
-
Critical Incident Protocol (Incident Method). Under this protocol, judges were presented with incidents that reflected varying levels of effectiveness on a particular performance dimension and asked to judge, for each incident, the acceptability level of soldiers whose typical performance was described by the incident.
-
Task-Based Protocols (Task-Hypothetical Soldier, Task-Detailed Percent-GO, and Task-Abbreviated Percent-GO Methods). Under these protocols, judges were presented with a list of specific tasks within each performance dimension (possibly from different MOS) and asked to make judgments about minimum percent-GO scores that a soldier should achieve to qualify as marginal, acceptable, and outstanding performers. Three types of judgments were collected. In the first condition, the hypothetic soldier (HS) approach, judges were presented detailed sets of hands-on test score sheets and corresponding summary percent-GO scores for 10 hypothetical soldiers and asked to rate the acceptability of each of these hypothetical soldiers (Task-HS Method). In the second condition, the detailed percent-GO (DPG) approach, judges were asked to rate the minimum percent-GO score for each level of acceptability on each specific task used to illustrate the dimension (Task-DPG Method). In the third condition, the abbreviated percent-GO approach, judges were given a list of tasks without detailed percent-GO scores or actual score sheet examples and asked to rate minimum percent-GO scores for tests on these types of tasks (Task-APG Method).
The five different standard-setting methods involved judgments that used very different metrics. The soldier-based method asked about the percentage of soldiers performing at each acceptability level; the critical incident method used a series of discrete behavioral items; and the task-based methods used judgments about acceptable levels of percent-GO scores.
A critical question in this research was the extent to which the different methods led to similar or distinct ability requirements. To answer this question, it was necessary to convert the standards derived from each approach to a common metric, making it possible to determine whether one of the methods led to significantly stricter or more lenient standards than the others and also to compare the level of agreement among judges using this same metric.
The soldier-based metric (percentage of soldiers performing at each
level) was used as the basis for comparison. If standards set with the other methods led to very different assessments of the percentage of soldiers performing at each level (in comparison to the judges' direct assessment), then the validity of these other methods would be questionable. Data from the Army's Project A on samples of incumbents in each MOS were used to estimate the percentage of soldiers performing above or below each of the standards set. The specific methods used to estimate the percentages of soldiers performing at or below specific critical incident or Percent-GO score levels are detailed in Whetzel and Wise (1990).
Phase II Results
Table 4 shows the means and standard deviations of the judges' ratings of the percentage of soldiers performing at each acceptability level for each combination of performance dimension and MOS. There are some distinct differences in the judges' estimates of soldiers' ability across different MOS and dimensions. For example, for MANPADS crew members (MOS 16S), soldiers had high acceptability ratings for performance dimension 7 (detect targets), but relatively lower acceptability ratings on dimension 15 (operate vehicles). These differences reflect, in part, the appropriateness or importance of the dimension for the MOS (e.g., all crew members detect targets, but not all have to operate vehicles).
The standard deviations in the table are a measure of the degree of agreement among judges. These numbers also give an indication of the potential appropriateness of the dimension for the MOS. When there is more significant disagreement among judges, it may be because the dimension is poorly described or is not clearly appropriate for the MOS in question. To a certain extent, the standard deviations are related to the means—when there is more disagreement, the means tend to be closer to 50 percent of soldiers performing at a particular proficiency level. (Only very high or low scores are possible if nearly all of the judges consistently give high or low ratings.) In some cases, however, the standard deviations are greater than the means (e.g., the percentage of 16S soldiers rated unacceptable on the task operate vehicles or the percentage of motor transport drivers, MOS 88M, rated unacceptable on the task navigate). This can happen only when the distribution of ratings is highly skewed, with most judges giving low ratings (hence a low mean) and a few judges giving very high ratings (leading to a large standard deviation).
Similarly detailed analyses of results from each of the other methods are reported in Whetzel and Wise (1990). Table 5 shows comparisons of the overall results from each of the five methods. The methods varied considerably in terms of ''leniency": the soldier method suggested only 15 percentage of current job incumbents performed unacceptably and 25 per-
TABLE 4 Mean and Standard Deviation of the Percentage of Soldiers at Each Level, by Dimension and MOS: Soldier Method
|
Level |
16S |
19K |
67N |
76Y |
88M |
91A |
94B |
Avg. |
|
|
Performance Dimension |
Mn/SD |
Mn/SD |
Mn/SD |
Mn/SD |
Mn/SD |
Mn/SD |
Mn/SD |
Mn/SD |
|
|
Percentage Unacceptable |
|
|
|
|
|
|
|
|
|
|
2. |
Crew Served Wpns. |
14/18 |
08/07 |
|
|
|
|
|
11/13 |
|
3. |
Tactical Mvmnts. |
12/12 |
10/09 |
|
|
|
|
|
11/11 |
|
4. |
Navigate |
|
|
|
|
21/22 |
|
|
21/22 |
|
5. |
First Aid |
|
|
|
|
|
16/18 |
|
16/18 |
|
7. |
Detect Targets |
8/07 |
10/09 |
10/14 |
|
|
|
|
09/10 |
|
8. |
Repair Mech. Sys |
16/14 |
10/08 |
12/10 |
|
15/12 |
|
|
13/11 |
|
10. |
Use Tech Refs. |
|
|
|
20/19 |
|
|
|
20/19 |
|
11. |
Pack and Load |
17/19 |
07/10 |
|
19/19 |
14/14 |
|
14/10 |
14/14 |
|
13. |
Operate/Install |
|
|
11/13 |
|
|
|
15/15 |
13/14 |
|
15. |
Operate Vehicles |
21/26 |
05/07 |
|
|
8/06 |
|
|
11/13 |
|
16. |
Type |
|
|
|
25/24 |
|
|
|
25/24 |
|
17. |
Record Keeping |
|
|
17/15 |
16/17 |
20/19 |
19/19 |
|
14/18 |
|
18. |
Oral Comm. |
16/14 |
12/12 |
|
|
|
13/12 |
|
14/13 |
|
19. |
Written Comm. |
|
|
|
27/25 |
|
15/12 |
|
21/19 |
|
22. |
Medical Treatment |
|
|
|
|
|
11/11 |
|
11/11 |
|
23. |
Food Preparation |
|
|
|
|
|
|
13/12 |
13/12 |
|
24. |
Leadership |
|
|
|
|
|
16/15 |
|
16/15 |
|
|
Average |
15/16 |
09/09 |
13/13 |
21/21 |
16/15 |
15/15 |
14/12 |
15/12 |
|
|
Sample Size |
563 |
378 |
162 |
235 |
250 |
342 |
129 |
1,807 |
|
Level |
16S |
19K |
67N |
76Y |
88M |
91A |
94B |
Avg. |
|
|
Performance Dimension |
Mn/SD |
Mn/SD |
Mn/SD |
Mn/SD |
Mn/SD |
Mn/SD |
Mn/SD |
Mn/SD |
|
|
Percentage Unacceptable |
|
|
|
|
|
|
|
|
|
|
Percentage Less Than Acceptable |
|
|
|
|
|
|
|
|
|
|
2. |
Crew Served Wpns. |
32/20 |
|
23/16 |
|
|
|
|
28/18 |
|
3. |
Tactical Mvmnts. |
33/16 |
|
27/21 |
|
|
|
|
30/19 |
|
4. |
Navigate |
|
|
|
|
40/23 |
|
|
40/23 |
|
5. |
First Aid |
|
|
|
|
|
37/26 |
|
37/26 |
|
7. |
Detect Targets |
24/15 |
28/21 |
26/18 |
|
|
|
|
26/18 |
|
8. |
Repair Mech. Sys. |
42/21 |
30/19 |
26/13 |
|
37/20 |
|
|
34/18 |
|
10. |
Use Tech Refs. |
|
|
|
40/22 |
|
|
|
40/22 |
|
11. |
Pack and Load |
38/25 |
25/23 |
|
42/23 |
33/21 |
|
11/07 |
30/20 |
|
13. |
Operate/Install |
|
|
27/20 |
|
|
|
10/07 |
18/14 |
|
15. |
Operate Vehicles |
36/23 |
18/16 |
|
|
24/15 |
|
|
26/15 |
|
16. |
Type |
|
|
|
47/27 |
|
|
|
47/27 |
|
17. |
Record Keeping |
|
|
37/22 |
39/24 |
42/23 |
26/11 |
|
36/20 |
|
18. |
Oral Comm. |
36/20 |
31/24 |
|
|
|
36/23 |
|
34/22 |
|
19. |
Written Comm. |
|
|
|
52/26 |
|
40/21 |
|
46/24 |
|
22. |
Medical Treatment. |
|
|
|
|
|
30/21 |
|
30/21 |
|
23. |
Food Preparation |
|
|
|
|
|
|
13/17 |
13/17 |
|
24. |
Leadership |
|
|
|
|
|
43/23 |
|
43/23 |
|
|
Average |
34/20 |
26/20 |
29/18 |
44/24 |
35/20 |
35/21 |
11/10 |
25/19 |
|
|
Sample Size |
563 |
378 |
162 |
235 |
250 |
342 |
129 |
1,807 |
TABLE 5 Summary of Phase II Rating Results by Judgment Method
|
Level/Method |
Mean |
SD |
Reliabilitya |
|
Percentage Unacceptable |
|||
|
Soldier Method |
15 |
12 |
.07 |
|
Incident Method |
22 |
17 |
.18 |
|
Task-HS Method |
34 |
24 |
.15 |
|
Task-DPG Method |
39 |
21 |
.29 |
|
Task-APG Method |
43 |
22 |
.42 |
|
Percentage Unacceptable or Marginal |
|||
|
Soldier Method |
25 |
19 |
.09 |
|
Incident Method |
29 |
20 |
.20 |
|
Task-HS Method |
58 |
25 |
.12 |
|
Task-DPG Method |
63 |
21 |
.28 |
|
Task-APG Method |
63 |
22 |
.40 |
|
Percentage Outstanding |
|||
|
Soldier Method |
15 |
17 |
.12 |
|
Incident Method |
18 |
18 |
.11 |
|
Task-HS Method |
9 |
11 |
.13 |
|
Task-DPG Method |
10 |
12 |
.18 |
|
Task-APG Method |
11 |
13 |
.23 |
|
a The reliability for each performance level is estimated as the ratio of true variation in the percentage of soldiers across MOS and performance dimensions to the total variation, including differences among judges. These reliabilities apply to individual judgments; the reliabilities of means across several judges can be estimated using the Spearman-Brown formula: rn = n *r1 / (1 + (n-1) *r1, where r1 is the single rater reliability and n is the number of judges. |
|||
centage were less than fully acceptable, while the task-APG method implied that 43 percent were at unacceptable and 63 percent were at less than fully acceptable levels.
There were also notable differences in the reliabilities associated with the different methods. The task-based methods, particularly those based on percent-GO score ratings, had significantly higher single-rater reliabilities than the other methods. This appears to be a result of stereotypical beliefs that 60 or 70 percent correct should be the minimum "passing" score.
Comparison of Task-DPG and Task-APG Results
The task-DPG and task-APG methods are of particular interest because they use the same Percent-GO scale used in the DoD model. The only
TABLE 6 Comparison of Minimum Percent-GO Scores by Acceptability Level, for the Task-Based Detailed and Abbreviated Percent-GO Methods
|
|
Detailed Percent-GO |
Abbreviated Percent-GO |
||
|
Category |
Mean |
SD |
Mean |
SD |
|
Marginal |
66 |
12 |
69 |
10 |
|
Acceptable |
78 |
09 |
80 |
08 |
|
Outstanding |
92 |
06 |
93 |
06 |
difference between these two approaches is that, for the task-DPG method, a great deal of information is provided about the particular steps (items) that are considered in computing the percent-GO scores. It is reasonable to ask whether this additional information led to different standards or different levels of agreement among judges. In other words, did the extra information help judges to reach a common understanding or just confuse them?
Table 6 shows the means and standard deviations of the percent-GO scores that resulted from each method, rater group, and acceptability level. As can be seen from this table, the APG method usually led to slightly harsher ratings, but also very slightly smaller standard deviations than the DPG method. The differences were minimal at most.
Additional Results from Phase III
In Phase III of the Army Synthetic Validity Project, standard-setting instruments were revised and used to collect data on 12 additional jobs. The task dimensions for which standards were set were also revised to make the dimensions parallel to the major categories in the revised job description instrument.
The task-based standard-setting instrument is most relevant to the issues in this paper. The Phase III version was simplified by eliminating detailed information about the task tests and eliminating the requirements for setting standards for individual tasks. For each performance dimension, three illustrative tasks were listed and then the number of soldiers at or below each percent-GO score level (in increments of 5 from 10 to 100) was provided. Raters were asked to draw lines between the score levels to indicate divisions between different performance levels (unacceptable versus marginal, marginal versus acceptable, and acceptable versus outstanding).
Table 7 shows the mean and standard deviation of the percent-GO cutoffs for each Phase III job, performance dimension, and performance level. As shown in this table, there was reasonable consistency across jobs, with
TABLE 7 Percent-GO Cutoffs for Phase III Jobs Using Revised Task-Based Standard-Setting Instruments
minimum scores of about 65 percent, 80 percent, and 95 percent for marginal, acceptable, and outstanding levels, respectively. It is difficult to tell the extent to which the small differences among jobs in the cutoff scores are reliable. Different task dimensions and different groups of judges were used with the different jobs, and the variation in results may well be associated with random and systematic factors associated with these differences. In any event, given all of the limitations on the accuracy of domain-referenced interpretations of the percent-GO scales, these differences in cutoffs would not appear to be of practical significance.
Table 8 shows the estimated percentage of current job incumbents at the lower and higher performance levels. The Phase III approach attempted to combine the task-based and soldier-based approaches by providing both criterion information (about the tasks) and normative information (about the proportion of soldiers at each level). As shown in the table, the results reflected this compromise with the proportion of soldiers judged unacceptable (28 percent) or less than fully acceptable (48 percent) falling midway between the Phase II results for the separate soldier and task-based methods (15 to 43 percent and 25 to 63 percent, respectively). The percentage of soldiers at the outstanding level (20 percent) also fell between the extremes of the Phase II methods (12 to 23 percent). Variation in the performance distributions across jobs was somewhat greater in comparison to the variation in score cutoffs, particularly at the high end of the scale. The percent-
TABLE 8 Percentage of Soldiers at Each Performance Level, Using Revised Task-Based Standard Setting Instruments
|
|
Percentage of Job Incumbents Who Are: |
|
|
|
MOS |
Less Than Unacceptable |
Acceptable |
Outstanding |
|
12B |
27.6 |
50.4 |
16.5 |
|
13B |
32.2 |
49.9 |
20.1 |
|
27E |
22.9 |
42.4 |
22.7 |
|
29E |
26.3 |
44.6 |
33.3 |
|
31C |
31.1 |
49.1 |
16.7 |
|
31D |
24.6 |
41.1 |
27.3 |
|
51B |
27.4 |
50.5 |
17.2 |
|
54B |
25.1 |
48.6 |
15.4 |
|
55B |
27.5 |
50.5 |
17.3 |
|
95B |
35.1 |
55.3 |
16.4 |
|
96B |
26.6 |
49.4 |
17.3 |
|
Overall |
27.9 |
48.4 |
20.0 |
age performing at an outstanding level varied from 15 percent for 54B to 33 percent for 29E.
Summary of SYNVAL Standard-Setting Results
The SYNVAL Project demonstrated both the promise and the difficulties of efforts to define comparable performance categories across different jobs. There were a number of arguments and concerns about differences in procedures and instruments and the reliability of individual judgments was not extremely high. One persistent finding was that standards set using the hands-on performance tests appeared harsh in comparison with direct estimates of performance level distributions. The consequence, in Phase III, that over a quarter of all recruits are performing unacceptably and should be terminated may be difficult to accept. That as many as half of the incumbents would benefit from additional training is much more credible and is consistent with current refresher training programs. At the upper end, the definition of outstanding performance is somewhat more subjective, and 20 percent outstanding is not unreasonable.
An important finding from the SYNVAL project was that cutoff scores for the percent-GO scale on the hands-on performance tests were reasonably similar across jobs. It would be reasonable to adopt 65, 80, and 95 percent cutoffs for all jobs, eliminating a requirement to collect new judgments for each new jobs. This is particularly important since this is the same metric used in the model. What remains is to identify factors associ-
ated with differences in optimal mixes of performance levels across different jobs. The key question seems to be "When are higher proportions of outstanding performers required?"
CONCLUSIONS
Summary of Findings
The performance metric used with the DoD model was constructed in such a way that a domain-referenced interpretation is at least plausible. There were some potentially offsetting restrictions on the domain of job performance covered by the hands-on performance tests. Although no absolute definition of successful performance was developed at the task level, there were clear criteria for success on individual task steps. For the global purposes required by the model, it is not unreasonable to interpret the scores as the percentage of the job that a recruit can perform successfully.
Normative data for two different entry cohorts showed significant variation across jobs in mean predicted performance but remarkable stability over time periods. Mean predicted performance scores ranged between 60 and 80 percent across different jobs with an overall average of 66 percent. Based on these data, it appears reasonable to use past predicted performance levels in setting performance targets for each job, but generalization across jobs will be somewhat limited.
In a more criterion-referenced approach, the Army Synthetic Validity Project analyzed procedures for defining different levels of job performance that are tied to possible economic consequences associated with good or poor performance. Task-based methods tied to the hands-on performance tests tended to yield stricter standards in comparison to direct judgments about the proportion of soldiers at each performance level. Standards set using the task-based methods were reasonably consistent across jobs. Performance below 65 percent was considered unacceptable, with the implication that the recruit should be discharged; from 65 to 80 percent was considered marginal, with the implication that additional training should be provided; from 80 to 95 percent was considered acceptable; and above 95 percent was considered outstanding with promotion or some other recognition deemed appropriate. Some variation among jobs in the proportion of incumbents at each performance level was observed for each of the standard-setting methods.
The normative and criterion-referenced approaches agreed that there was significant variation across jobs in performance levels. Normative data suggested that performance level targets of about 66 percent were consistent with current accession and readiness levels. The criterion-referenced approach implied that this was a minimally acceptable level and not necessarily a good target for average performance.
Implications for Further Research
If we accept the results of the normative and criterion-referenced approaches summarized above, we can consider setting performance targets for the DoD model by multiplying the targeted number of recruits by an average performance level between 60 and 80 on the hands-on performance test percent-GO scale. Further research would be useful in defending more precise mean predicted performance level targets and, in particular, in supporting differences among occupational specialties in performance level targets. Several specific topics for additional research are discussed below.
Enhancing Performance Level Descriptions
The SYNVAL project attempted to link performance levels to operational decisions about individuals. This linkage was based entirely on expert judgments. A fruitful area for further research would be the development of better descriptions of what individuals at different performance levels can and cannot do. There has been a considerable effort in recent years to establish overall standards for educational achievement for use in interpreting results from the National Assessment of Educational Progress. Part of this process has involved analyses of items answered successfully by students at one level by not at the next lower level. A similar effort with the hands-on test performance levels would help in the development of explicit rationales for economic consequences of performance at specific levels.
Linking Job Characteristics to Performance Distribution Targets
While common performance level descriptions appeared feasible, there was considerable variation across jobs in the proportion of incumbents at each level. More systematic research is needed on the relationship of job characteristics (e.g., task complexity, the extent of teamwork, indicators of criticality of tasks, specific consequences of unsuccessful task performance) to different performance distribution targets. Most particularly, differences among jobs in the need for outstanding performers should be modeled.
Linking Performance Distribution Targets to Unit Effectiveness and Readiness
As more concrete conceptions of factors relating to readiness emerge, it would be useful to relate these factors to level and heterogeneity of the performance of individuals in different units. In particular, analysis data from unit training exercises should prove useful in linking individual performance levels to indicators of unit effectiveness.
REFERENCES
Campbell, C.H., Ford, P., Rumsey, M.G., Pulakos, E.D., Borman, W.C., Felker, D.B., de Vera, M.V., and Riegelhaupt, B.J. 1990 Development of multiple job performance measures in a representative sample of jobs. Personnel Psychology 43:277–300.
Carey, N.B., and Mayberry, P.W. 1992 Development and scoring of hands-on performance tests for mechanical maintenance specialties. CNA Research Memorandum 91–242 . Alexandria, Va.: Center for Naval Analyses.
Eitelberg, M.J. 1988 Manpower for Military Occupations. Alexandria, Va.: Office of the Assistant Secretary of Defense (Force Management and Personnel).
Green, B.F, Jr., and Wigdor, A.K. 1991 Measuring job competency. In A.K. Wigdor and B.F. Green, eds., Performance Assessment for the Workplace, Volume 2. Committee on the Performance of Military Personnel. Washington, D.C.: National Academy Press.
Laurence, J.H., and Ramsberger, P.F. 1991 Low-Aptitude Men in the Military: Who Profits, Who Pays? New York: Praeger Publishers.
Lipscomb, M.S., and Hedge, J.W. 1988 Job Performance Measurement: Topics in the Performance Measurement of Air Force Enlisted Personnel . Technical Report AFHRL-TP-87-58. Brooks Air Force Base, Tex.: Air Force Human Resources Laboratory.
McCloy, R.A., Harris, D.A., Barnes, J.D., Hogan, P.F., Smith, D.A., Clifton, D., and Sola, M. 1992 Accession Quality, Job Performance, and Cost: A Cost-Performance Tradeoff Model. HumRRo Report No. FR-PRD-92-11. Alexandria, Va.: Human Resources Research Organization.
Peterson, N.G., Owens-Kurtz, C., Hoffman, R.G., Arabian, J.M., and Whetzel, D.L. 1990 Army Synthetic Validity Project: Report of Phase II Results. Volume I. Army Research Institute Technical Report 892. Alexandria, Va.: United States Army Research Institute for the Behavioral and Social Sciences.
Whetzel, D.L., and Wise, L.L. 1990 Analysis of the standard setting data. In N.G. Peterson, C. Owens-Kurtz, R.G. Hoffman, J.M. Arabian, and D.L. Whetzel, eds., Army Synthetic Validity Project: Report of Phase II Results, Volume I. Army Research Institute Technical Report 892. Alexandria, Va.: United States Army Research Institute for the Behavioral and Social Sciences.
Wigdor, A.K., and Green, B.F., Jr., eds. 1991 Performance Assessment for the Workplace, Volume 1. Committee on the Performance of Military Personnel. Washington, D.C.: National Academy Press.
Wise, L.L., Peterson, N.G., Hoffman, R.G., Campbell, J.P., and Arabian, J.M. 1991 The Army Synthetic Validity Project: Report of Phase III Results, Volume 1. Army Research Institute Technical Report 922. Alexandria, Va.: United States Army Research Institute for the Behavioral and Social Sciences.
Predicting Job Performance Scores Without Performance Data
Rodney A. McCloy
Military manpower and personnel policy planners have pursued the goal of documenting the relationship between enlistment standards and job performance for over 10 years (Steadman, 1981; Waters et al., 1987). Prior to the Joint-Service Job Performance Measurement/Enlistment Standards (JPM) Project begun by the Department of Defense (DoD) in 1980, proponents of validity studies examining the Services' selection test, the Armed Services Vocational Aptitude Battery (ASVAB), had primarily relied on measures of success in training as criteria. The catalysts for the enormous JPM effort included the misnorming of ASVAB forms 6 and 7 that resulted in the accession of a disproportionate number of low-aptitude service men and women, a decrease in the number of 18–21-year-olds (i.e., the enlistmentage population), and the perpetual requirement of high-quality accessions (Laurence and Ramsberger, 1991). These events simultaneously focused attention on the need to relate the ASVAB to measures of job performance and the absence of such measures.
The outcome of this series of events was an all-Service effort to measure job performance and to determine the relationship between job performance and military enlistment standards. The steering committee for this effort established general guidelines for the work but encouraged diverse approaches to performance measurement in the interests of comparative research. To this end, each Service conducted its own JPM research program with its own specific goals and questions. As a result, the measures and samples across the Services are sometimes quite different. For ex
ample, the Army wished to limit the effect that job experience would have on the results from their JPM research project (Project A; Campbell, 1986). Hence, the range of months in service in the Army sample is small.1 In contrast, the Marine Corps was keenly interested in the effect of job experience on performance and developed its performance measures to be applicable to soldiers in both their first and second tours. Accordingly, the range of experience in the Marine Corps sample is relatively large.
Although each Service developed several job performance measures (Knapp and Campbell, 1993), the Joint-Service steering committee selected the work sample (or ''hands-on") performance test as the measure to be "given [resource and scientific] primacy" and to serve as "the benchmark measure, the standard against which other, less faithful representations of job performance would be judged" (Wigdor and Green, 1991:60). Although some have questioned whether hands-on measures are the quintessential performance measures (Campbell et al., 1992), there is little debate over the notion that hands-on measures provide the best available assessment of an individual's job proficiency—the degree to which one can perform (as opposed to will perform) the requisite job tasks.
The advantages and disadvantages of hands-on measures are well known. The scientific primacy given them by the Committee on the Performance of Military Personnel is justifiable at least in part by their face validity and their being excellent measures of an individual's task proficiency. However, there can be limitations regarding the types of tasks they can assess (e.g., it would be difficult to assess a military policeman's proficiency at riot control using a hands-on measure), and their resource primacy is virtually required given their expense to develop (see Knapp and Campbell, 1993, and Wigdor and Green, 1991, for detailed descriptions of the development of the hands-on performance tests). To highlight this point, consider that hands-on tests were developed for only 33 jobs as part of the JPM Project (Knapp and Campbell, 1993), the most extensive performance measurement effort ever conducted.2
Much has been gained from the JPM research. The ASVAB has been shown to be a valid predictor of performance on the job as well as in training (Wigdor and Green, 1991). In addition, project research demonstrated that valid, reliable measures of individual job performance can be developed, including hands-on tests. JPM research supports the use of the ASVAB to select recruits into the military. But if a recruiter wished to predict an individual's performance score for a military job, he or she would
be limited to at best 45 jobs (those having some form of performance criterion) and 33 jobs that have hands-on measures. More desirable would be the capability to predict an individual's job performance for any military job, whether or not a hands-on measure (or other performance measures) had been developed for it.
Transporting validation results beyond a specific setting to other settings has been the concern of two methods in the industrial/organizational psychology literature: validity generalization and synthetic validation. In this paper, following a brief discussion of these two methods, a third method that can be used to provide performance predictions for jobs that are devoid of criterion data—multilevel regression—is introduced and discussed in detail. The application of multilevel regression models to the JPM data is presented, and results are also given from an investigation of the validity of the performance predictions derived from the multilevel equations.
VALIDITY GENERALIZATION
For many years, psychologists specializing in personnel selection emphasized the need to demonstrate the validity of selection measures upon each new application—whether the goal was to predict performance in a different job, or for the same job in a different setting. The rationale for this approach was that the validity of a selection measure was specific to the situation. Indeed, one typically observed a rather large range in the magnitude of validity coefficients across various situations for the same test or for similar tests of the same construct (e.g., verbal ability). But conducting job-specific validity studies could be very expensive. Furthermore, for jobs containing a small number of incumbents, such studies would be likely to provide either unstable or nonsensical results.
Focusing on this latter shortcoming of the situational specificity hypothesis, Schmidt, Hunter, and their colleagues (e.g., Hunter and Hunter, 1984; Schmidt and Hunter, 1977; Schmidt et al., 1981; Schmidt et al., 1979) suggested that the majority of variation in observed validity coefficients across studies could be explained by statistical artifacts. This notion led to the conclusion that, contrary to the conventional wisdom, the validities of many selection measures (and cognitive ability measures in particular) were in fact generalizable across jobs and situations.
In validity generalization, a distribution of validities from numerous validation studies is created and then corrected for the statistical artifacts of sampling error, criterion unreliability, and predictor range restriction.3 The
result is a new distribution that more accurately reflects the degree of true variation in validity for a given set of predictors. If a large portion of the coefficients in the corrected distribution exceeds a value deemed to be meaningful, then one may conclude the validity generalizes across situations. In essence, validity generalization is a meta-analysis of coefficients from validation studies, and other recta-analytic approaches have been suggested (Hedges, 1988).
Concluding that validity coefficients generalize across situations, however, does not preclude variation in the coefficients across situations. The portion of the corrected distribution lying above the "meaningful" level may exhibit significant variation. If a substantial portion of the variation in the observed coefficients can be attributed to statistical artifacts (75 percent has served as the rule of thumb), however, then the mean of this distribution is considered the best estimate of the validity of the test(s) in question—situational specificity is rejected and the mean value is viewed as a population parameter (i.e., the correlation between the constructs in question). Hunter and Hunter (1984:80) reported that the validity generalization literature clearly indicates that most of the variance in the validity results for cognitive tests observed across studies is due to sampling error such that "for a given test-job combination, there is essentially no variation in validity across settings or time."
Although the findings of validity generalization research have considerably lightened the burden for personnel psychologists interested in demonstrating the validity of certain selection measures, the procedure is not without its critics, and many of its features are questioned (Schmitt et al., 1985; Sackett et al., 1985). Furthermore, the approach does not speak directly to the issue of obtaining performance predictions for jobs devoid of criteria. Although the corrected mean validity could be used to forecast performance scores, the approach is too indirect. Selection decisions are often based on prediction equations, which may in turn comprise a number of tests. The application of validity generalization results to this situation would require a number of validities for the test battery (i.e., composite) in question. Furthermore, even if such results were available, a more desirable approach would be to "focus the across-job analysis on the regression parameters of direct interest in the performance prediction, rather than on the correlations of the validity generalization analysis" (Bengt Muthén, personal communication, January 18, 1990).
SYNTHETIC VALIDITY
A second alternative to the situational specificity hypothesis is synthetic validity (Lawshe, 1952:32), defined as "the inferring of validity in a specific situation." The basic approach is to derive the validity of some test
or test composite by reducing jobs into their components (i.e., behaviors, tasks, or individual attributes necessary for the job) via job analysis, determining the correlations between the components and performance in the job, and aggregating this validity information into a summary index of the expected validity. Wise et al. (1988:78–79) noted that "synthetic validation models assume that overall job performance can be expressed as the weighted or unweighted sum of individual performance components." Mossholder and Arvey (1984:323) pointed out that synthetic validity is not a specific type of validity (as opposed to content or construct validity), but rather "describes the logical process of inferring test-battery validity from predetermined validities of the tests for basic work components."
Several approaches to synthetic validation may be found in the literature, including the J-coefficient (Primoff, 1955) and attribute profiles from the Position Analysis Questionnaire (McCormick et al., 1972). Descriptions of these approaches are available in Crafts et al. (1988), Hollenbeck and Whitemer (1988), Mossholder and Arvey (1984), and Reynolds (1992). To illustrate the process of obtaining synthetic validity estimates, consider the Army's Synthetic Validation Project (SYNVAL) as an example.
The goal of the SYNVAL project (Wise et al., 1991) was to investigate the use of the results of the Army's JPM Project (Project A) to derive performance prediction equations for military occupational specialties (MOS) for which performance measures were not developed. SYNVAL researchers employed a validity estimation task to link 26 individual attributes, which roughly corresponded to the predictor data available on the Project A sample, to job components described in terms of three dimensions (i.e., tasks, activities, or individual attributes). These validity estimates were provided by experienced personnel psychologists.
The validity estimates, in concert with information regarding the importance, difficulty, and frequency of various job tasks or activities (component "criticality" weights) and empirical estimates of predictor construct intercorrelations, were used to generate synthetic equations for predicting job-specific and Army-wide job performance. The task and activity judgments were obtained from subject matter experts (noncommissioned officers and officers). Similar to previous results from a Project A validity estimation study (Wing et al., 1985), the estimates were found to have a high level of interrater agreement. Various strategies for weighting (1) the predictors in the component equations and (2) the component equations to form an overall equation were investigated.
A substantial advantage of the SYNVAL project is the capacity to compare the predicted scores generated by the synthetic equations to existing data. First, synthetic prediction equations were developed for the MOS having performance data. The synthetic equations were compared with ordinary least-squares prediction equations for the corresponding MOS, based
on data from Project A validation studies. The data had been corrected for range restriction and criterion unreliability. Validity coefficients for the synthetic equations were found to be slightly lower than the adjusted validity coefficients (adjusted for shrinkage) for the least-squares equations. The differential validity (i.e., the degree to which the validity coefficients for job-specific equations were higher when the equations were applied to their respective job than when applied to other jobs) of the synthetic equations was also somewhat lower than that evidenced by the least-squares equations.
Now that personnel psychologists have provided the estimated linkages between the attributes and Army job components, all that remains is to obtain criticality estimates of each component from subject matter experts for any Army MOS without criteria or for any new MOS. This information can then be combined with the estimated attribute-component relationships to form a synthetic validity equation for the job.
An important characteristic of the synthetic validation approach used in SYNVAL is that synthetic equations could have been developed without any criterion data whatsoever. The presence of actual job performance data, however, allowed validation of the synthetic validity procedure. Although the SYNVAL project demonstrated the synthetic validation technique to approximate optimal (i.e., least-squares) equations closely, some researchers might be wary of deriving equations that rely so heavily on the judgments of psychologists or job incumbents.
A procedure is available that operates directly on the job-analytic information to provide estimated performance equations for jobs without criterion data (although this procedure does require the presence of criterion data for at least a subset of jobs). The procedure is presented by describing its use in the Linkage project (Harris et al., 1991; McCloy et al., 1992), the project that marked the beginning of the enlistment standards portion of the JPM Project. The goal of the Linkage project was to use JPM Project data to investigate the relationship (i.e., linkage) between job performance and enlistment standards. To explore this relationship fully, it was imperative that the method of analysis provide equations that were generalizable to the entire set of military jobs. The synthetic validity approach used in SYNVAL was not selected for the Linkage project because the cost of implementing the approach would have been prohibitive. Specifically, the SYNVAL approach would have necessitated an extensive data collection, because job component information and validity estimates of the predictor/job component linkages were not available for non-Army jobs. In the next section, multilevel regression analysis is proffered as an alternative method for deriving job performance predictions for jobs without criterion data.
MULTILEVEL REGRESSION ANALYSIS
An Example
Suppose that some new selection measures have been developed for predicting performance, and it is of interest to investigate their predictive validity for several jobs. In this example, we have a criterion (e.g., a score from a hands-on test of job performance) Pij for person i in job j. We assume that Pij depends on an individual's aptitude test score (call it Aij; this could be a set of test scores) and some set of other individual characteristics such as education and time in service (call this Oij). We further assume that the effects of these independent variables could differ across jobs and that the jobs are a random sample of the total set of jobs. Thus, the model is
Pij = α j +βjAij+ γjOij+εij(1)
where αj is a job-specific intercept, βj and γj are job-specific slopes, and εij is an error term. This is the general form for the equation linking individual job performance to enlistment standards—the linkage equation.
This model says that αj, βj, and γj can, in principle, vary across jobs. Multilevel regression allows one to quantify the variation in these parameters and to determine if the variation is statistically significant. The variation is addressed by assuming that the parameters themselves have a stochastic structure. Namely,
αj = α + αj, where αj ~ N(O, σ2a) (2)
βj = β + bj where bj ~ N(O, σ2b) (3)
γj = γ + cj where cj ~ N(O, σ2c ) (4)
This formulation says that the intercept for job j (αj) has two components: α, the mean of all the αj's (note the lack of the j subscript), and aj, a component that can be viewed as the amount by which job j's intercept differs from the average job j's intercept (i.e., differs from α). Note that the model assumes the distributions of aj, bj, and cj are to be normal; their joint distribution is assumed to be multivariate normal. Although aj, bj, and cj are completely determined for any specific job, the multilevel model conceives of these components as random, because the sample of jobs is assumed to be chosen at random. If the jobs are picked at random, these components are likewise random. Thus, coefficients modeled to vary across groups (here, jobs) may be labeled random effects (indeed, multilevel models are sometimes called random effects models), whereas coefficients mod-
eled to remain constant across groups may be labeled fixed effects. The variance components represent the variance of the random effects across jobs. For example, σ2a is the variance across jobs of the aj's and therefore of the αj's, because α is the same for all jobs.
A multilevel regression model was chosen for the linkage equation because the JPM data are multilevel or "nested." Specifically, in the JPM database, individuals are nested within jobs.4 Ordinary least-squares (OLS) regression models are inappropriate for multilevel data. To see why this is so, consider a simpler version of equation (2) in which only the intercept (α) is allowed to vary across jobs (i.e., estimate αj). Thus, the model is
Pij = αj + βAij + γOij + εij (5)
and αj is modeled by equation (2). Substituting equation (2) into equation (5) results in a residual term of
aj + εij (6)
implying that the residuals from two individuals in the same job are correlated (i.e., individuals within a job share the same error component, aj). The same situation obtains for the other parameters as well. Therefore, applying the ordinary regression model to these data would result in biased standard errors for the regression parameters (generally biased downward, increasing the chance of a Type I error; see Green, 1990:478 for more details).
A key feature of the random effects (aj, bj, cj) is that a portion of the variation they represent may be systematic. Consider the general form of the linkage equation given by equation (1). The parameters in this equation possess a j subscript, signifying they may vary across jobs. One might surmise that some of the across-job variation in the parameters may be due to job characteristics (e.g., cognitive demands, demand for psychomotor ability). If so, variables assessing those job characteristics (call them Mj) thought to contribute to this variation could be included in the multilevel regression model. Thus equation (2) would become
αj = α + παMj + ηaj
where πα is a weight applied to the job characteristic variables Mj, and ηαj is the residual random effect. To the extent that the job characteristic variables were predictive of the parameter variation across jobs, the amount of error in the prediction system would be reduced.
Thus, the linkage equation contains not only individual characteristic information, but also variables that assess various characteristics of the military jobs. Before a discussion of the specific form taken by equation (1) in the Linkage project, the variables constituting it deserve comment.
The Building Blocks of the Linkage Equation: Individual- and Job-Characteristic Variables
As noted above, equation (1) gives the general form of the linkage equation. Before discussing the specific form taken by equation (1) in the Linkage project, the variables constituting it deserve comment.
Derivation of the Individual-Characteristic Variables
Measures of individual characteristics were obtained from the Services' JPM data files. The measures were: (1) hands-on job performance test scores (percentage correct),5 (2) educational attainment (high school diploma graduate or non-high school graduate), (3) experience (total months of service), (4) 10 ASVAB subtest standard scores,6 and (5) MOS code. The data were available for 8,464 individuals from 24 jobs studied in the JPM Project. A total of 24 MOS were included in the Linkage project:
|
Army: |
N |
|
Infantryman (11B) |
663 |
|
Cannon crewman (13B) |
597 |
|
Tank crewman (19E) |
465 |
|
Single channel radio operator (31C) |
346 |
|
Light wheel vehicle/power generation mechanic (63B) |
594 |
|
Motor transport operator (64C) |
646 |
|
Administrative specialist (71L) |
490 |
|
Medical specialist (91A) |
483 |
|
Military police (95B) |
657 |
|
Navy: |
|
|
Electronics technician (ET) |
136 |
|
Machinist's mate (MM) |
178 |
|
Radioman (RM) |
224 |
|
Air Force: |
|
|
Aircrew life support specialist (122X0) |
166 |
|
Air traffic control operator (272X0) |
171 |
|
Precision measuring equipment specialist (324X0) |
124 |
|
Avionic communications specialist (328X0) |
83 |
|
Aerospace ground equipment specialist (423X5) |
216 |
|
Jet engine mechanic (426X2) |
188 |
|
Information systems radio operator (492X1)7 |
120 |
|
Personnel specialist (732X0) |
176 |
|
Marine Corps: |
|
|
Rifleman (0311) |
940 |
|
Machinegunner (0331) |
271 |
|
Mortarman (0341) |
253 |
|
Assaultman (0351) |
277 |
The small number of jobs for which performance data were available made reducing the number of predictors in the performance model advisable. Using each of the ASVAB subtest scores as a predictor along with the other measures of individual characteristics and job characteristics would have involved estimating too many parameters, whereas using only the Armed Forces Qualification Test (AFQT) or some other general ability factor might have missed important job differences. The solution to this problem was to use nonoverlapping ASVAB composite scores, thus reducing the number of predictors while retaining as much ability information as possible. The ASVAB composite scores were calculated from a database used to develop the ASVAB-to-Reading Grade Level (RGL) conversion table (Waters et al., 1988) and have been discussed elsewhere (e.g., Campbell, 1986). There are four ASVAB factors:
Quantitative = MK + AR8
Speed = NO + CS
Technical = AS + MC + EI
Verbal = PC + WK + GS.
TABLE 1 Individual Characteristics for the Job Performance Measurement Project Sample (N = 8,464)
|
Variable Label |
Description |
Mean |
Standard Deviation |
|
HOPT |
Hands-on job performance test score (percentage) |
67.37 |
12.68 |
|
AFQT |
ASVAB AFQT composite score |
206.94 |
22.22 |
|
|
|
(201.03) |
(28.07) |
|
TECH |
ASVAB technical composite score |
159.28 |
21.16 |
|
|
|
(152.57) |
(25.04) |
|
TIS |
Total months of service |
23.65 |
10.66 |
|
EDUC |
Educational attainment |
1.92 |
0.28 |
|
|
|
(1.73) |
(0.48) |
The quantitative and verbal factors form the AFQT score:
AFQT = PC + WK + MK + AR.9
To supplement the AFQT, the technical composite was also selected. The speed composite was not used in subsequent modeling efforts because it was not a significant predictor of hands-on performance.
Descriptive statistics were calculated on the individual characteristics for the JPM Project sample (N = 8,464). Means and standard deviations for the hands-on performance (HOPT) test score, the AFQT composite score, the technical composite score (TECH), months of service experience (TIS), and educational attainment10 (EDUC) are presented in Table 1. Means and standard deviations for AFQT, TECH, and EDUC calculated from the Waters et al. data are in parentheses. Note that the test score distributions for the JPM job incumbents do not differ greatly from the distributions obtained from military recruits. Table 2 contains job-specific means and standard deviations for the individual characteristics for each of the jobs in the JPM Project sample.
Derivation of the Job-Characteristic Variables
Development of the job-level variables for the multilevel model was based on an analysis of civilian jobs. Because job-characteristic data for entry-level military jobs were not available, alternative sources of this type
TABLE 2 Individual Characteristics by Occupation
|
Occupation |
|
Performance Score (P.j) |
AFQT Composite (A.j) |
TECH Composite (T.j) |
Education (E.j) |
Experience (X.j) |
|||||
|
|
N |
Mean |
SD |
Mean |
SD |
Mean |
SD |
Mean |
SD |
Mean |
SD |
|
Army |
4,941 |
70.66 |
10.48 |
204.70 |
22.24 |
158.74 |
20.27 |
1.93 |
.25 |
20.70 |
5.30 |
|
Infantryman |
663 |
69.92 |
7.42 |
206.01 |
23.62 |
162.28 |
18.66 |
1.92 |
.27 |
20.26 |
5.51 |
|
Cannon Crewman |
597 |
62.03 |
11.28 |
196.51 |
21.70 |
149.69 |
21.70 |
1.90 |
.30 |
21.36 |
5.90 |
|
Tank Crewman |
465 |
77.08 |
7.89 |
203.99 |
23.67 |
162.33 |
20.02 |
1.94 |
.24 |
19.25 |
4.78 |
|
Radio Operator |
346 |
69.98 |
7.90 |
209.06 |
21.65 |
158.66 |
19.90 |
1.93 |
.26 |
20.29 |
5.46 |
|
Vehicle Mechanic |
594 |
84.34 |
5.03 |
200.06 |
21.61 |
164.00 |
18.84 |
1.92 |
.27 |
20.08 |
5.64 |
|
Motor Transport |
646 |
71.21 |
7.67 |
193.24 |
21.22 |
156.70 |
18.12 |
1.92 |
.28 |
20.32 |
4.50 |
|
Administrative Specialist |
490 |
59.04 |
8.41 |
206.43 |
21.30 |
142.96 |
19.29 |
1.99 |
.09 |
22.41 |
4.56 |
|
Medical Specialist |
483 |
71.48 |
7.25 |
213.29 |
17.24 |
159.35 |
18.40 |
1.90 |
.30 |
20.89 |
5.60 |
|
Military Police |
657 |
70.22 |
6.23 |
216.92 |
15.50 |
169.43 |
15.09 |
1.97 |
.18 |
21.28 |
4.96 |
|
Navy |
538 |
75.71 |
12.03 |
211.92 |
25.97 |
156.61 |
23.92 |
1.97 |
.17 |
35.40 |
14.23 |
|
Electronics Technician |
136 |
81.51 |
9.48 |
233.98 |
18.46 |
176.43 |
20.34 |
2.00 |
.00 |
43.96 |
12.86 |
|
Machinist's Mate |
178 |
82.16 |
9.14 |
217.56 |
24.40 |
160.59 |
20.16 |
1.95 |
.22 |
34.82 |
14.09 |
|
Radioman |
224 |
67.07 |
9.94 |
194.04 |
17.37 |
141.41 |
19.88 |
1.97 |
.17 |
30.67 |
12.74 |
|
Occupation |
|
Performance Score (P.j) |
AFQT Composite (A.j) |
TECH Composite (T.j) |
Education (E.j) |
Experience (X.j) |
|||||
|
|
N |
Mean |
SD |
Mean |
SD |
Mean |
SD |
Mean |
SD |
Mean |
SD |
|
Air Force |
1,244 |
68.25 |
13.20 |
217.73 |
19.37 |
165.83 |
21.75 |
1.98 |
.13 |
28.19 |
11.46 |
|
Aircrew Life Support |
166 |
69.93 |
13.73 |
212.63 |
17.65 |
157.27 |
20.34 |
1.99 |
.11 |
28.78 |
11.10 |
|
Air Traffic Control |
171 |
70.08 |
10.87 |
227.20 |
15.03 |
169.02 |
19.16 |
1.98 |
.13 |
26.88 |
8.87 |
|
Precision Measuring Equipment |
124 |
76.00 |
8.84 |
234.23 |
13.33 |
181.83 |
14.52 |
2.00 |
.00 |
27.57 |
10.68 |
|
Avionic Communications Specialist |
83 |
77.33 |
11.39 |
235.24 |
12.56 |
184.06 |
13.72 |
1.99 |
.11 |
35.28 |
14.85 |
|
Aerospace Ground Equipment Specialist |
216 |
57.08 |
9.51 |
212.52 |
17.31 |
171.85 |
14.72 |
1.99 |
.10 |
28.04 |
10.47 |
|
Jet Engine Mechanic |
188 |
73.16 |
10.42 |
209.47 |
19.82 |
174.23 |
16.41 |
1.95 |
.22 |
29.36 |
10.78 |
|
Information Systems Radio Operator |
120 |
71.06 |
13.14 |
212.22 |
19.21 |
149.89 |
21.09 |
1.98 |
.13 |
23.61 |
13.10 |
|
Personnel Specialist |
176 |
61.67 |
13.66 |
212.44 |
17.54 |
145.47 |
19.74 |
1.99 |
.08 |
28.04 |
11.81 |
|
Marine Corps |
1,741 |
54.82 |
9.38 |
204.01 |
20.21 |
156.97 |
21.41 |
1.81 |
.39 |
25.16 |
15.25 |
|
Rifleman |
940 |
52.62 |
8.96 |
201.65 |
19.61 |
153.50 |
21.57 |
1.79 |
.41 |
22.96 |
12.37 |
|
Machinegunner |
271 |
54.79 |
7.92 |
203.45 |
20.52 |
159.59 |
20.80 |
1.85 |
.36 |
30.10 |
18.78 |
|
Mortarman |
253 |
52.86 |
8.76 |
204.81 |
21.03 |
158.30 |
20.83 |
1.81 |
.39 |
24.10 |
17.36 |
|
Assaultman |
277 |
64.06 |
6.69 |
211.84 |
19.25 |
165.00 |
19.37 |
1.83 |
.38 |
28.73 |
16.47 |
|
Total Sample |
8,464 |
67.37 |
12.68 |
206.94 |
22.22 |
159.28 |
21.16 |
1.92 |
.28 |
23.65 |
10.66 |
of information were sought. A readily available source of job-characteristic information is the Dictionary of Occupational Titles (DOT) (U.S. Department of Labor, 1977). The Department of Labor database used to compile the most recent edition of the DOT was obtained from the National Technical Information Service. The database contains the DOT codes for ratings of worker functions and worker traits for approximately 12,000 civilian occupations. Military-civilian job matches were obtained from the Military-Civilian Crosscode Project database (Wright, 1984). Each military job so matched adopted the ratings of its civilian counterpart.
Because the Linkage project was concerned with first-term job performance, only cross-code matches for entry-level jobs were obtained from DoD. The database contained military-civilian equivalents for 965 entry-level military occupations. Once the military-civilian equivalents were obtained, 44 DOT job-characteristic variables describing the civilian jobs were used to characterize the military occupations. These variables represent a variety of job functions and worker traits, including job complexity, training time, aptitude and temperament requirements, physical demands, and environmental conditions.
Job-level composite scores were developed to decrease the number of predictors in the performance equation. To calculate job-level composite scores from the full set of 44 DOT variables, principal components analyses were performed using the 965 military occupations from the cross-code database. An orthogonal component structure was maintained to produce nonoverlapping composites of job characteristics.
A four-factor solution with orthogonal varimax rotation was selected as most appropriate; the four factors accounted for 48 percent of the total variance in the original variables. The first component accounted for 18.5 percent of the variance and consisted of 16 variables that deal mainly with working with things, suggesting that this component reflects the extent to which manual labor is a part of the job. The second component accounted for 15 percent of the total variance and consisted of 10 variables that reflect the cognitive complexity of work. The third component accounted for 8.6 percent of the variance and included 9 variables dealing with unpleasant working conditions . The fourth component accounted for 5.9 percent of the variance and contained 12 items dealing with fine motor control and coordination needed in some jobs.
Using the results of the four-component solution, component scores were obtained for the 925 military jobs having complete data (i.e., observations on all 44 occupational variables). These job-specific component scores were then used as the job-characteristic variables in the multilevel regression model of military job performance.11
Specification of the Linkage Equation
For the Linkage project, the general specification given in equation (1) is expanded so that job performance is a function of the characteristics of individuals (AFQT standard score, ASVAB technical composite score, time in service, and education). Job performance, in turn, is operationalized as scores on the job-specific hands-on performance tests developed for each service during the JPM Project. Thus, the prediction equation takes the form:
where Pij is the hands-on performance test (HOPT) score for person i in job j; Aij is the AFQT composite score; Tij is the ASVAB technical composite (TECH) score; Eij is educational attainment (EDUC); Xij is time in service (TIS); and αj, βj, ![]() j, γ, δj and ρ are model parameters. Note that γ has no j subscript because the effect of education was found not to vary across jobs:
j, γ, δj and ρ are model parameters. Note that γ has no j subscript because the effect of education was found not to vary across jobs:
γj = γ (8)
Structure of the Linkage Parameters
The structure of the model parameters for the linkage equation is the following:
where α, β, δ, and ![]() are the mean values of the parameters across all jobs (note the lack of the j subscript), the π's are vectors of coefficients constrained to be the same across jobs (i.e., they are ''fixed" coefficients), Mj is a vector of four standardized component scores that describe job characteristics (working with things, cognitive complexity, unpleasant working conditions, and fine motor control) described earlier, and the η's are random variation.12 (To generalize the model to the universe of first-term military
are the mean values of the parameters across all jobs (note the lack of the j subscript), the π's are vectors of coefficients constrained to be the same across jobs (i.e., they are ''fixed" coefficients), Mj is a vector of four standardized component scores that describe job characteristics (working with things, cognitive complexity, unpleasant working conditions, and fine motor control) described earlier, and the η's are random variation.12 (To generalize the model to the universe of first-term military
jobs, the job-level coefficients—the π's—cannot be job-specific.) Because the linkage equation contains both individual- and job-level predictors, it qualifies as a multilevel model, with individuals being level one and jobs being level two.13
This structure for the model parameters assumes that some of their variation (except for γ) is due to characteristics of the jobs. The Mj variables represent characteristics of jobs believed to influence an individual's performance. The inclusion of such job-characteristic information is our attempt to generalize from our small sample of jobs (the 24 JPM jobs having hands-on criterion data) to the population of military jobs. To the extent that some portion of the parameter variation is due to job characteristics and the proper job-characteristic variables (Mj's) are included in the multilevel model, the amount of variance in the parameters that is unaccounted for can be reduced, thereby increasing the accuracy of prediction or, equivalently, decreasing the standard error of estimate.
The Mj variables reduce the uncertainty in the job-specific parameters by absorbing some of the variation across jobs that would be part of the random effect if the Mj variables were not in the model. For example, for the job-specific intercept αj, the term παMj models part of the variation in intercept parameters across jobs that otherwise would be part of the random effect αj Including the second-level variables should reduce the uncertainty in the estimation of the αj's. This same logic holds for all other model parameters.
The multilevel model may be approximated by a fixed-effects (i.e., conventional OLS) regression model. Substituting equations (8)–(11) into (7) gives the following:
Multiplying through and collecting terms yields:
where
Thus, a model containing the job-characteristic variables and interactions between the job-characteristic variables and the variables whose effects are
to vary across occupations may be used to estimate the structural parameters (regression coefficients) in the multilevel analysis. The standard errors of the parameter estimates for this model will be biased, however, due to the failure of the fixed-effects regression to adequately model the correlations among errors in the multilevel error structure. The standard errors will typically be smaller than they should be, thereby increasing the probability of a Type I error.
To determine if the simpler fixed-effects approximation adequately characterized the Linkage data, equation (14) was estimated and compared with the multilevel model. The two sets of parameter estimates were sufficiently different to suggest retaining the multilevel model (see Harris et al., 1991, for a detailed description of the formulation of the performance equation).
The Parameters for the Linkage Equation
The linkage equation's parameters were estimated using the VARCL software package for the analysis of multilevel data (Longford, 1988). This program uses maximum likelihood estimation to obtain parameter values for the model. The specific, unstandardized parameter estimates for the linkage equation are given in Table 3, along with their associated standard errors. (Table 1 contains the means and standard deviations of the individual-characteristic variables.) Also included in this table are values giving the square root of the variance (designated σ) of each parameter across jobs (i.e., the random effects remaining after taking into account job-characteristic information) and their respective standard errors (SEσ).
The standard errors of the fixed-effect parameter estimates (e.g., β, ![]() ) indicate that all of these values are significant. Thus, the variables in the linkage equation demonstrate statistically reliable predictive relationships with job performance for the total sample of jobs. The SEσ values indicate that the σ values for the random-effect parameters are also significant, suggesting reliable variation remains in these parameters across the sample of jobs, even after the job-characteristic variables are used to model this variation.
) indicate that all of these values are significant. Thus, the variables in the linkage equation demonstrate statistically reliable predictive relationships with job performance for the total sample of jobs. The SEσ values indicate that the σ values for the random-effect parameters are also significant, suggesting reliable variation remains in these parameters across the sample of jobs, even after the job-characteristic variables are used to model this variation.
Examination of the standard errors for the job-level parameter estimates (e.g., πα1, πδ3) shows how well the four job-characteristic variables model the across-job variation in the parameter values for each variable. Specifically, the factor scores do account for a statistically significant portion of the variation in the TECH parameter but do not do as well for the remaining parameters, the values of the intercept term being of particular note (i.e., πα1 through πα4). Combined with the results of the variation in the random effects (the σ values), we conclude that there might be other moderators (i.e., Mj variables) that would better model the variation of the parameters of the primary linkage equation.
TABLE 3 Coefficient and Variance Component Estimates for the Primary Linkage Equation: the INTERCEPT, AFQT, TECH, and TIS as Random Effects with the EDUC and TECH × TIS Interaction as Fixed Effects
|
Coefficient |
|
Estimate |
Error Standard |
σ |
SEσ |
|
Intercept |
α |
31.434 |
|
6.679 |
.974 |
|
FS1 |
(πα1) |
2.763 |
4.607 |
|
|
|
FS2 |
(πα2) |
5.700 |
4.086 |
|
|
|
FS3 |
(πα3) |
3.779 |
4.001 |
|
|
|
FS4 |
(πα4) |
-1.591 |
8.185 |
|
|
|
AFQT |
β |
.074 |
.014 |
.039 |
.009 |
|
AFQTFS1 |
(πβ1 |
-.030 |
.014 |
|
|
|
AFQTFS2 |
(πβ2) |
.001 |
.012 |
|
|
|
AFQTFS3 |
(πβ3) |
-.020 |
.012 |
|
|
|
AFQTFS4 |
(πβ4) |
-.036 |
.025 |
|
|
|
TECH |
|
.110 |
.017 |
.035 |
.008 |
|
TECHFS1 |
|
.035 |
.013 |
|
|
|
TECHFS2 |
|
-.006 |
.011 |
|
|
|
TECHFS3 |
|
.023 |
.011 |
|
|
|
TECHFS4 |
|
.050 |
.023 |
|
|
|
EDUC |
γ |
.882 |
.325 |
|
|
|
TIS |
δ |
.421 |
.074 |
.079 |
.016 |
|
TISFS1 |
(πd1) |
.032 |
.029 |
|
|
|
TISFS2 |
(πd2) |
-.048 |
.025 |
|
|
|
TISFS3 |
(πd3) |
-.082 |
.024 |
|
|
|
TISFS4 |
(πd4) |
-.016 |
.049 |
|
|
|
TECHXTIS |
ρ |
-.001 |
.000 |
|
|
Take note that the application of multilevel analysis in the Linkage project is rather atypical. That is, most applications of multilevel regression analysis involve many groups (e.g., 100–200 schools) with relatively few members in each group (e.g., 20–30 students). In the present analyses, there are relatively few groups (i.e., 24 jobs) that contain many members (sample sizes ranging from 83 to 940). Although this complicates estimation of the variance components for the job-level parameters (i.e., the σ's in Table 3), these components are estimated with enough precision to be statistically significant.
The VARCL output also includes a covariance matrix of the random effects. This matrix provides information regarding the degree to which the parameter values across jobs for one variable covary with the parameter values across jobs for another variable. The covariances for the linkage parameters are presented in Table 4, along with the corresponding correlations. As an example of the information provided in the table, the substantial negative correlation between the intercept and TECH indicates that the TECH parameter tends to be smaller in jobs having a higher overall mean performance level.
TABLE 4 Covariances and Correlations Among the Random Effects
Variance of Predicted Performance Scores
Although VARCL provides standard errors of the model parameters, no standard error of estimate is printed. One may be calculated, however, by taking the square root of the equation:
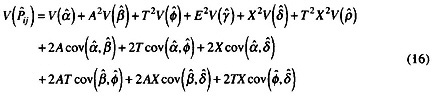
where V(•) and Cov(•,•) are the variance and covariance of the random effects, respectively. The terms A, T, E, and X are the mean AFQT, TECH, EDUC, and TIS values for the job under consideration (see Harris et al., 1991). Note that not terms including job-characteristic variables appear in equation (16). This is because the parameters of the job-characteristic variables (the π's) are fixed (the values of the job-characteristic variable are constants for a given job).
The information for this equation is available form Tables 3 and 4. There are two sources of variability in the job-specific parameters. The largest is the variance of the coefficients across jobs (σ2α, σ2β, ![]() , σ2δ), the square roots of which are given in Table 3. This source arises because the coefficient αj is imperfectly estimated by (α + παMj), βj by (β + πβMj), and so on. Residual error variance ( i.e., the η's), conditional on the job-characteristic variables, remains in the parameter estimates. The variance of these errors across the population of jobs is the variance component, σ2.
, σ2δ), the square roots of which are given in Table 3. This source arises because the coefficient αj is imperfectly estimated by (α + παMj), βj by (β + πβMj), and so on. Residual error variance ( i.e., the η's), conditional on the job-characteristic variables, remains in the parameter estimates. The variance of these errors across the population of jobs is the variance component, σ2.
The second (and usually smaller) source of variation is the variance of the estimate of the mean effects (e.g. ![]() ,
, ![]() ,). These are the standard errors of the parameters given in Table 3. Thus, for the TECH parameter
,). These are the standard errors of the parameters given in Table 3. Thus, for the TECH parameter ![]() j,
j,
where ![]() is the variance component for the slope
is the variance component for the slope ![]() j and SE (
j and SE (![]() ) is the standard error of
) is the standard error of ![]() (the estimate of the mean of the
(the estimate of the mean of the ![]() j 's). The intercept contributes only its random effect component to the variability of
j 's). The intercept contributes only its random effect component to the variability of ![]() j, because a shift in the mean of the intercepts does not contribute to variability in the
j, because a shift in the mean of the intercepts does not contribute to variability in the ![]() ij values. Slopes that are constrained to be the same across all jobs (i.e., are a fixed, but not a random, effect) contribute only their [SE(•)]2 component. Thus, for the EDUC parameter,
ij values. Slopes that are constrained to be the same across all jobs (i.e., are a fixed, but not a random, effect) contribute only their [SE(•)]2 component. Thus, for the EDUC parameter,
The covariance terms inn equation (16) are the covariances between the conditional (or residual) random effects (the random effects not accounted for by the second-level variables—the job characteristic). These values are given in Table 4. Note that no covariances are given between the random parameters that vary across jobs and the parameters constrained to be the same across jobs (i.e., the fixed parameters γ and ρ). Because the fixed parameters do not vary across jobs, their covariance terms equal zero.
Table 5 contains the means of the predicted performance scores and associated standard errors of estimate for the 24 JPM jobs. The values of the standard error range from 6.80 for Army MOS 64C (motor transport operator) to 9.62 for the Navy Rating ET (electronics technician). In no instance does a 95-percent confidence interval around the predicted scores yield an implausible value (i.e., less than zero or grater than 100).
Much of the variation in prediction is due to scaling difference across jobs (specifically, intercept variation introduced by the differences in mean HOPT scores across jobs). The HOPT scores were not standardized within jobs but rather remain in their original metric. By retaining the original HOPT metric, the mean differences in HOPT scores across jobs remain. Part of the mean differences in performance scores is attributable to differences in job difficulty. Another contributor to the mean difference in HOPT across jobs is differences in test difficulty, with the difficulty of a given hands-on test being determined by comparing that test to other tests that could be constructed for a given job. For example, recall that the Marine Corps JPM sample h as a wider range of experience than the Army. The Marine Corps HOPT for rifleman (the Marine Corps's infantry MOS) contains items that assess performance of second-tour tasks. Clearly, this test would be more difficult for first-term soldiers than a test assessing
TABLE 5 Standard Errors of Predicted Performance Scores
|
MOS |
Predicted Performance Score |
Standard Error |
|
11B |
62.01 |
6.32 |
|
13B |
59.87 |
6.03 |
|
19E |
64.29 |
6.23 |
|
31C |
70.45 |
6.45 |
|
63B |
74.30 |
6.08 |
|
64C |
59.26 |
5.86 |
|
71L |
63.45 |
6.48 |
|
91A |
64.70 |
6.62 |
|
95B |
69.67 |
6.73 |
|
ET |
79.29 |
8.11 |
|
MM |
75.14 |
7.12 |
|
RM |
69.67 |
6.19 |
|
122x0 |
66.73 |
6.76 |
|
272x0 |
69.87 |
7.25 |
|
324x0 |
76.41 |
7.52 |
|
328x0 |
79.70 |
7.80 |
|
423x5 |
69.82 |
6.69 |
|
426x2 |
79.58 |
6.61 |
|
492x1 |
71.09 |
6.68 |
|
723x0 |
64.64 |
6.80 |
|
0311 |
60.84 |
6.23 |
|
0331 |
63.97 |
6.43 |
|
0341 |
63.15 |
6.35 |
|
0351 |
64.60 |
6.70 |
performance on tasks that are performed during the first tour. In contrast, the Army's infantry HOPT assesses performance on first-term tasks only. This difference in performance test design is reflected in the mean HOPT scores for Marine Corps rifleman (mean = 52.62, SD = 8.96) and Army infantryman (mean = 69.92, SD = 7.42) given in Table 2.
Job difficulty variance is desirable to retain, but test difficulty variance is not. Although standardizing within job would remove the unwanted test difficulty differences, the desired job differences would also be lost. For the approach of leaving the scores in their original metric to be tenable, one must assume that the variance due to test difficulty across jobs is uncorrelated with the individual- and job-characteristic variables. Considering the job-characteristic variables, there is no reason to believe that the characteristics of the job and the difficulty of the test are related. It is possible that more difficult jobs have more difficult tests. If this is due to the content of the job, however, then this reflects job difficulty, not test difficulty, and is not a
concern. Thus, for any given job, tests may be relatively easy or relatively difficult. For example, there is no reason to suspect that tests for jobs requiring performance in difficult working conditions would be easier or more difficult than tests for other jobs. Test comparisons as difficult or easy must be made within a job. Comparisons across jobs are confounded by job difficulty.
The reasoning for a negligible correlation between test difficulty and individual-characteristic variables runs parallel to that for job characteristics. Although intelligent people are placed in difficult jobs, this relationship is based on job content, not test difficulty. There is no reason to believe that people with certain individual characteristics are disproportionately placed into jobs that have very difficult or very easy tests–again, difficult or easy represents a relative comparison within a job rather than across jobs.
Deriving Job-Specific Equations
As mentioned above, the linkage to be made in the Linkage project was the relationship between measures of recruit quality (i.e., enlistment standards) and job performance. The multilevel performance equation given in equation (7) characterizes this relationship for the 24 JPM occupations. In addition, this prediction model is the primary linkage equation—it is the progenitor of all job-specific linkage equations. That is, this model's parameter estimates (given in Table 3) are used to calculate the parameters for equations that allow job-specific performance predictions.
The principal advantage of the primary linkage equation is that it allows performance predictions for jobs having no criterion data. Using ordinary regression, performance scores can be estimated for individuals without criterion data by weighting their predictor information by the appropriate regression coefficients. Performance data, however, are needed for some individuals in that job before the job-specific equation may be estimated. By including job-characteristic variables in our multilevel model, job-specific parameters can be derived for any job having job-characteristic data. These parameters are functions of the job-characteristic variables and, together with the fixed effects of EDUC and the interaction between TECH and TIS, constitute job-specific linkage equations.
Returning to Table 3, the value associated with a Greek letter represents the mean effect of the variable across jobs (e.g., β = .074). The parameters subscripted from 1 to 4 (e.g., πβ1) signify the values in the π vector that are applied to the four component scores, respectively. For AFQT, these values are -.030, .001, -.020, and -.036. Substituting these values into equations (8) through (11) allows the estimation of job-specific parameters. Equations (8) through (11) also demonstrate that these esti-
mated job-specific parameter estimates are deviations from the mean parameter estimate—the degree of deviation being a function of the job's factor scores. (Note that γ and ρ, fixed across jobs, do not have any corresponding subscripted values.) Consider the Army MOS 11B (infantryman). The four factor scores for this MOS are -0.68, -2.41, 2.33, and 0.18. Substituting these Mj values and the multilevel parameter estimates just given into equation (9) yields the AFQT parameter (βj) for predicting job performance for infantrymen:
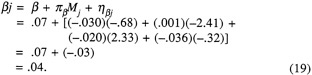
Substituting into equations (8), (10), and (11), the same procedure yields the remaining parameters for MOS 11B:
The coefficients for the job-specific linkage equations for the 24 JPM jobs used in the Linkage project are given in Table 6.
The same procedure affords job-specific parameters for jobs without criterion data. For example, continuing with the AFQT parameter, the following job-specific value is obtained for the Army MOS combat engineer (12B) using its factor scores of -.51, -3.09, 1.90, and -.97:
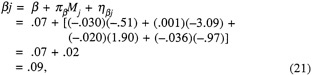
and for the other parameters,
Note that the value for β and the four πβ values remain constant in the βj equations for both MOS; the equations differ only in the Mj values.
Performance equations may also be generated for groups of jobs. For example, jobs were grouped into 9 of the 10 DoD occupation codes (see
TABLE 6 Regression Coefficients for Job-Specific Linkage Equations for the 24 JPM Jobs Used in the Linkage Project
|
MOS |
Intercept (αj) |
AFQT (βj) |
TECH ( |
TIS (δj) |
EDUC (γ) |
TECHxTIS (ρ) |
|
11B |
24.35 |
0.04 |
0.16 |
0.32 |
.88 |
-.001 |
|
13B |
22.17 |
0.05 |
0.15 |
0.39 |
.88 |
-.001 |
|
19E |
25.42 |
0.04 |
0.16 |
0.39 |
.88 |
-.001 |
|
31C |
30.74 |
0.09 |
0.09 |
0.47 |
.88 |
-.001 |
|
63B |
37.90 |
0.04 |
0.15 |
0.34 |
.88 |
-.001 |
|
64C |
19.09 |
0.07 |
0.13 |
0.45 |
.88 |
-.001 |
|
71L |
22.35 |
0.14 |
0.03 |
0.48 |
.88 |
-.001 |
|
91A |
29.40 |
0.05 |
0.14 |
0.26 |
.88 |
-.001 |
|
95B |
31.64 |
0.11 |
0.07 |
0.27 |
.88 |
-.001 |
|
ET |
29.08 |
0.04 |
0.16 |
0.50 |
.88 |
-.001 |
|
MM |
34.72 |
0.05 |
0.13 |
0.43 |
.88 |
-.001 |
|
RM |
32.75 |
0.07 |
0.11 |
0.40 |
.88 |
-.001 |
|
112x0 |
22.48 |
0.08 |
0.11 |
0.51 |
.88 |
-.001 |
|
272x0 |
27.60 |
0.11 |
0.07 |
0.38 |
.88 |
-.001 |
|
324x0 |
33.37 |
0.05 |
0.14 |
0.41 |
.88 |
-.001 |
|
328x0 |
34.64 |
0.05 |
0.13 |
0.48 |
.88 |
-.001 |
|
423x5 |
26.64 |
0.04 |
0.16 |
0.44 |
.88 |
-.001 |
|
426x2 |
41.41 |
0.02 |
0.17 |
0.34 |
.88 |
-.001 |
|
492x1 |
30.74 |
0.09 |
0.09 |
0.47 |
.88 |
-.001 |
|
732x0 |
18.09 |
0.13 |
0.06 |
0.51 |
.88 |
-.001 |
|
0311 |
24.35 |
0.04 |
0.16 |
0.32 |
.88 |
-.001 |
|
0331 |
23.73 |
0.04 |
0.17 |
0.34 |
.88 |
-.001 |
|
0341 |
23.73 |
0.04 |
0.17 |
0.34 |
.88 |
-.001 |
|
0351 |
27.19 |
0.05 |
0.14 |
0.31 |
.88 |
-.001 |
Table 7) in the Linkage project.14 Scores on the four factors for the nine job groups were obtained by calculating the weighted (by sample size) mean of the factor scores across the jobs in each of the nine occupational codes. As above, the weighted mean factor scores would be inserted into the primary linkage equation to generate performance equations for each of the occupational codes.
The model also may be amended to include additional or different individual and job characteristics. All that is required is to reestimate the primary linkage equation with the new variables in the model so that new parameter values may be obtained. The procedure just described still applies.
TABLE 7 Job Categories Represented by the DoD Occupation Codes
|
Code |
Job Category |
|
0 |
Infantry, gun crews, and seamanship specialists |
|
1 |
Electronic equipment repairmen |
|
2 |
Communications and intelligence specialists |
|
3 |
Health care specialists |
|
4 |
Other technical and allied specialists |
|
5 |
Functional support and administration |
|
6 |
Electrical/mechanical equipment repairmen |
|
7 |
Craftsmen |
|
8 |
Service and supply handlers |
|
9 |
Nonoccupational |
Validation of the Primary Linkage Equation
The capacity to generate prediction equations for jobs without criterion data (given that job-characteristic data are available) is a very attractive feature of the multilevel primary linkage equation. Nevertheless, at least two issues should be addressed with regard to the ability of the primary equation to generate job-specific linkage equations that yield quality predictions for jobs without criterion data.
First, the primary equation was estimated on a sample of only 24 jobs. Although these jobs have various desirable qualities—for example, they are high-density jobs, and they are representative in the sense that they span important job groups in the Services (e.g., mechanical, administrative, and combat occupations)—there are still several limitations inherent in them for the Linkage project. For example, they do not span the job-characteristic space defined by the four component scores (e.g., most of the jobs are low m cognitive complexity), and 24 jobs is not a large number of cases for estimating across-job variability. As a result, there is some question about the degree to which the parameters from the primary linkage equation and the corresponding job-specific equations would change if any one of the 24 jobs were deleted from the sample.
Second, quite apart from the capability simply to generate job-specific linkage equations for jobs devoid of criterion data and the independence of those equations from the 24 jobs included in the estimation sample is the issue of how well those generated equations actually predict performance in the out-of-sample jobs. Such information is crucial for evaluating the validity of the performance equation. Hence, there are two primary issues to be addressed: (1) the sensitivity of the primary linkage equation to the jobs m the estimation sample and (2) the validity of the job-specific linkage equations that are generated by the primary linkage equation.
Parameter sensitivity results were reported by McCloy et al. (1992). They estimated the linkage equation 24 times, once as each job in the sample was removed from consideration. Distributions of the parameters from the resulting 23-job equations were obtained, and ratios of predicted performance scores were calculated both across AFQT categories within jobs and within AFQT category across jobs. They found that (1) the parameters were not unduly influenced by the presence of any particular JPM job in the sample of 24 and (2) the predicted performance scores evidenced reasonable stability, suggesting that the performance equations yield consistent results and are mostly unaffected by the presence or absence of specific jobs in the estimation sample.
The second question refers to the validity of the job-specific linkage equations generated by the primary linkage equation. The results of the validity analyses are given here. The capacity to generate predicted performance scores (via job-specific linkage equations) for individuals in jobs for which no criterion data are available begs the question of how well the job-specific linkage equations predict performance for various jobs—in particular, any out-of-sample jobs without criterion data.
Answering this question requires jobs that have criterion data but were not part of the estimation sample for the primary linkage equation. There are essentially two ways such a situation could arise: (1) manufacture such a situation out of the extant sample by using a holdout procedure or (2) obtain relevant data on one or more new jobs after estimating the original primary linkage equation. Both conditions obtained in the present analyses.
Method
The primary linkage equation can be used to generate a job-specific equation for any job having job-characteristic data, whether it appears in the estimation sample or not. The quality of the predictions from any of these equations is of interest, but perhaps the most stringent test of the linkage methodology lies in the prediction of performance scores for out-of-sample jobs. To investigate the validity of the job-specific linkage equations, two types of analyses were performed.
First, each of the 24 JPM jobs was held out of the sample and a ''reduced" primary equation was estimated on the remaining 23 jobs. This process resulted in 24 reduced equations. These reduced equations were used to generate a job-specific equation for their corresponding holdout (i.e,, out-of-sample) job. The existence of criterion data for each holdout job permitted the observed performance scores for each job to be correlated with the performance scores predicted by the corresponding job-specific linkage equation.
Second, job-specific linkage equations were generated from the 24-job
primary linkage equation for two Navy ratings[ electrician's mate (EM) and gasoline turbine mechanic (GSM)] and five Marine Corps jobs [organizational automotive mechanic (3521), helicopter mechanic CH-46 (6112), helicopter mechanic CH-53 (6113), helicopter mechanic U/AH-1 (6114), and helicopter mechanic CH-53E (6115)] that were not part of the original estimation sample. These equations yielded predicted performance scores for the individuals in the additional Navy jobs. As in the holdout analyses, the correlation between the observed and predicted performance scores wa obtained.
When conducting cross-validation, one typically splits the total sample into two random subsamples, developing a prediction equation on the first sample and applying that equation to the second sample. But this method underestimates the R2 expected if the regression equation were developed using the entire sample and then applied to the population, because the best set of regression weights (i.e., the full-sample weights) is not used (Campbell, 1990). The present analyses do not match typical cross-validation procedures exactly: job-specific equations were (1) generated from a primary linkage equation that in turn was estimated from a sample of 23 (holdout analyses) or 24 (new Navy and Marine Corps specialties) jobs and (2) applied to their respective jobs that were not part of the estimation sample. That is, the validation sample was a job that was not part of the original sample of 23 (holdout analyses or 24 (new Navy and Marine Corps specialties) jobs, rather tan a random subsample of the original test of the ability of the job-specific linkage equations to provide accurate predictions of actual performance scores for out-of-sample jobs. Such information is vital because these situations reproduce the scenario in which the primary linkage equation would be implemented by manpower planners.
Results
The results of the analyses are presented in Table 8, which contains (1) the sample size for each job (N), (2) the squared multiple correlation for the least-squares job-specific regression equations (R2OLS), (3) the squared multiple correlation for the job-specific linkage equation generated from the reduced 23-job "primary" equation (R2cv) (i.e., the correlation between the predicted performance scores taken from the job-specific linkage equation and the actual observed performance scores), (4) the difference between the values of R2OLS and R2cv, and (5) R2OLS values adjusted using various shrinkage formulae (R2adj).
Two feature of the first two columns of R2 values are of note: (1) the values are quite variable, ranging from .065 to .508 for R2OLS and .031 to .461 for R2cv, and (2) R2OLS >R2cv. The latter finding is expected, given that
TABLES 8 R2 Obtained for the job-Specific Least-Squares and Linkage Equationa and Shrinkage Expected Using 4 Formulae
|
|
|
|
|
|
Shrinkage Formula (R2adj) |
|
|
|
|
JOB |
N |
R2OLS |
R2cv |
Differenceb |
Wherry 1931 |
Browne 1975c |
Rozeboom 1978 |
Lord 1950-Nicholson 1960 |
|
11B |
663 |
0.086 |
0.080 |
0.006 |
0.080 |
0.076 |
0.075 |
0.073 |
|
13B |
597 |
0.065 |
0.038 |
0.027 |
0.059 |
0.054 |
0.052 |
0.051 |
|
19E |
465 |
0.141 |
0.126 |
0.015 |
0.133 |
0.128 |
0.126 |
0.124 |
|
31B |
346 |
0.140 |
0.103 |
0.037 |
0.130 |
0.123 |
0.120 |
0.117 |
|
63B |
594 |
0.076 |
0.057 |
0.019 |
0.069 |
0.065 |
0.063 |
0.062 |
|
64C |
646 |
0.108 |
0.089 |
0.019 |
0.103 |
0.099 |
0.097 |
0.096 |
|
71L |
490 |
0.127 |
0.110 |
0.017 |
0.120 |
0.114 |
0.112 |
0.111 |
|
91A |
483 |
0.117 |
0.056 |
0.061 |
0.110 |
0.104 |
0.102 |
0.100 |
|
95B |
657 |
0.102 |
0.056 |
0.046 |
0.097 |
0.093 |
0.091 |
0.090 |
|
ET |
136 |
0.081 |
0.056 |
0.025 |
0.053 |
0.039 |
0.025 |
0.018 |
|
MM |
178 |
0.154 |
0.120 |
0.035 |
0.135 |
0.122 |
0.116 |
0.111 |
|
RM |
224 |
0.154 |
0.099 |
0.054 |
0.138 |
0.128 |
0.123 |
0.119 |
|
EM |
80 |
0.348 |
0.281 |
0.067 |
0.313 |
0.288 |
0.279 |
0.270 |
|
|
|
|
|
|
Shrinkage Formula (R2adj) |
|
|
|
|
JOB |
N |
R2OLS |
R2cv |
Differenceb |
Wherry 1931 |
Browne 1975c |
Rozeboom 1978 |
Lord 1950-Nicholson 1960 |
|
GSM |
88 |
0.140 |
0.077 |
0.063 |
0.098 |
0.076 |
0.058 |
0.047 |
|
112 |
166 |
0.141 |
0.106 |
0.034 |
0.119 |
0.105 |
0.098 |
0.093 |
|
272 |
171 |
0.077 |
0.031 |
0.046 |
0.055 |
0.043 |
0.033 |
0.027 |
|
324 |
124 |
0.224 |
0.181 |
0.042 |
0.198 |
0.180 |
0.172 |
0.165 |
|
328 |
83 |
0.223 |
0.140 |
0.083 |
0.183 |
0.157 |
0.144 |
0.134 |
|
423 |
216 |
0.173 |
0.149 |
0.024 |
0.157 |
0.146 |
0.142 |
0.138 |
|
426 |
188 |
0.088 |
0.050 |
0.038 |
0.068 |
0.056 |
0.049 |
0.043 |
|
492 |
120 |
0.216 |
0.178 |
0.038 |
0.189 |
0.170 |
0.162 |
0.155 |
|
732 |
176 |
0.226 |
0.198 |
0.028 |
0.208 |
0.195 |
0.190 |
0.185 |
|
031 |
940 |
0.324 |
0.314 |
0.010 |
0.321 |
0.319 |
0.318 |
0.317 |
|
033 |
271 |
0.358 |
0.297 |
0.061 |
0.348 |
0.341 |
0.338 |
0.336 |
|
034 |
253 |
0.379 |
0.366 |
0.013 |
0.369 |
0.362 |
0.360 |
0.357 |
|
035 |
277 |
0.238 |
0.230 |
0.008 |
0.227 |
0.219 |
0.216 |
0.213 |
|
3521 |
907 |
0.240 |
0.176 |
0.064 |
0.237 |
0.233 |
0.234 |
0.232 |
|
6112 |
152 |
0.464 |
0.461 |
0.003 |
0.449 |
0.435 |
0.438 |
0.431 |
|
6113 |
93 |
0.508 |
0.453 |
0.055 |
0.486 |
0.464 |
0.469 |
0.458 |
|
6114 |
190 |
0.187 |
0.167 |
0.020 |
0.169 |
0.152 |
0.157 |
0.148 |
|
6115 |
113 |
0.237 |
0.203 |
0.034 |
0.209 |
0.181 |
0.189 |
0.174 |
|
a All job-specific equations derived from 23-job performance equations except EM, GSM, 3521, 6112, 6112, 6113, 6114, and 6115 (derived from the 24-job equation) b Difference = R2OLS-R2cv. |
||||||||
the least-squares equations are optimal for the samples on which they were derived; the job-specific linkage equations are not. The largest differences between R2OLS and R2cv primarily occur in the jobs having the smallest sample sizes (e.g., EM, GSM, 328X0). The absolute magnitude of the differences is not particularly large, however, ranging from .006 for 11B to .083 for 328X0. The question remaining is what to make of this difference in R2 values.
Shrinkage Formulae
The value of R2 obtained for the least-squares job-specific regression equation (R2OLS in Table 8) can be viewed as an upper bound because calculating least-squares regression weights capitalizes on chance fluctuations specific to the sample in which the equation is developed. Applying the weights from this equation to another sample would result in a decrease in R2, because the weights are suboptimal for the second sample. Thus, the R2 yielded by the regression weights "shrinks" relative to the original R2.
The amount of shrinkage to be expected may be estimated using a shrinkage formula. Perhaps the best known of these is a formula developed by Wherry (1931):
where N is the size of the sample used to estimate the equation, k is the number of predictors, and R2yx is the sample coefficient of determination (R2OLS from Table 8). Wherry's formula gives the value for R2 expected if the equation were estimated in the population rather than a sample.
Because the population will virtually never be at the researcher's disposal, Wherry's formula is of little practical value. As noted by Darlington (1968) and Rozeboom (1978), the Wherry formula does not answer the more relevant question of what the R2 would be if the sample equation were applied to the population. Both Cattin (1980) and Campbell (1990) reported that no totally unbiased estimate for this value exists, although the amount of bias inherent to current estimates is generally small. They recommended a formula developed by Browne (1975), on the basis of its desirable statistical properties. Browne's formula, appropriate when the predictor variables are random (as opposed to fixed), is
where ρ is the adjusted R2 from the Wherry formula; N and k are defined as above. In truth, Browne's formula contains two terms, this equation being
the first (and by far the larger). Browne reported the bias introduced by neglecting the second term of his R2 adjustment to be no greater than .02. (He also provided an equation for fixed predictor variables.)
A second formula for estimating the validity of the sample equation in the population was provided by Rozeboom (1978):
with N, k, and R2yx defined as above.
The shrinkage formulae just described allow one to estimate the population multiple correlation for the full sample equation. If the average sample cross-validity coefficient is of interest, Lord (1950) and Nicholson (1960) independently developed a shrinkage formula for estimating this value:
with N, k, and R2yx defined as above.
Comparison of Adjusted and Cross-Validity R2Values
Because the job-specific least-squares equations are optimal for the samples on which they were developed but the job-specific linkage equations are not, the comparison of R2OLS to R2cv is not exactly fair. A more equitable comparison obtains through adjustment of the R2OLS values for shrinkage. Thus, the four shrinkage formulae were applied to the R2 values from the least-squares job-specific regression equations (i.e., R2OLS). These adjusted R2 values (R2adj) were then compared to the cross-validity R2 values obtained from the job-specific equations generated by the 23-job and primary (24-job) linkage equations in the holdout and new-job analyses, respectively (i.e., R2cv). The results appear in Table 8.
In general, the decrease in R2 associated with using the job-specific linkage equation as compared to the least-squares equation is virtually identical to that expected based on the Browne, Rozeboom, and Lord-Nicholson formulae (i.e., R2cv ≈ R2adj)—the unweighted and weighted (by sample size) average differences (R2cv-R2adj) being -.007, -.003, .002; and -.014, -.011, and -.008; respectively. In contrast, R2adj as given by the Wherry formula is typically larger than R2cv (unweighted and weighted differences of -.019 and -.021, respectively), but this comparison is not particularly appropriate because no population equation exists.
Of the four shrinkage formulae presented in Table 8, the Lord-Nicholson
adjustment probably provides the best referent for the holdout analyses (i.e., the 23-job linkage equations), because job-specific linkage equations were generated from a primary linkage equation estimated on a partial sample. The job-specific linkage equations were then applied to a second "sample" (i.e., the holdout job). Thus, the regression parameters for the 23-job equations are not full-sample weights and therefore not the best estimates available. This, in turn, means the parameters for the job-specific linkage equations generated from the 23-job equations are not the best estimates available. Nevertheless, the use of equations containing partial-sample weights rather than full-sample weights suggests that the Lord-Nicholson shrinkage formula provides an appropriate comparison.
For the 7 new jobs that were not part of the original 24-job estimation sample, however, the sample-based linkage equations were generated using full-sample weights (i.e., the 24-job primary linkage equation) and used to estimate performance scores for all individuals in a new job (as will be the case upon implementation by manpower planners). Here, one could argue that the Browne formula is the correct referent (i.e., a sample equation based on full-sample weights, applied to a new sample from the population). One might also consider the 24-job equation to be a partial-sample equation, however, given that the data from the new Navy ratings were not incorporated into the sample to yield a 31-job equation. If so, for reasons given above, Lord-Nicholson remains a viable referent.
The conclusion is the same no matter which comparison one chooses: the preponderance of small differences between R2cv and R2adj values demonstrates that the linkage methodology provides a means of obtaining predictions of job performance for jobs without criterion data that are nearly as valid (and sometimes more valid) as predictions obtained when (1) criterion data are available for the job, (2) a job-specific least-squares prediction equation is developed, and (3) the equation is applied in subsequent samples.
Comparison of Validity Coefficients to the Literature
Another means of assessing the predictive power of the job-specific linkage equations is to compare their validity coefficients with those reported in the literature for similar predictor/criterion combinations. McCloy (1990) demonstrated that the determinants of relevant variance in performance criteria differ across criterion measurement methods (i.e., written job knowledge tests, hands-on performance tests, and personnel file data and ratings of typical performance), leading to different correlations between a predictor or predictor battery and criteria assessing the same content but measured with different methods. Hence, the most relevant comparisons for the R2 values given in Table 8 are validity studies involving cognitive ability as a predictor and hands-on measures as performance criteria.
Unfortunately, relatively few studies employ hands-on performance tests as criteria. The vast majority of validity research has used supervisory ratings or measures of training success (e.g., written tests or course grades) as criteria. The preference for these measures is probably due to the ease and lower cost of constructing them, relative to hands-on tests. Nevertheless, there are a few studies that may serve as a standard of comparison.
In a meta-analysis of all criterion-related validity studies published in the Journal of Applied Psychology and Personnel Psychology from 1964 to 1982, Schmitt et al. (1984) reported the mean correlation between various predictors and hands-on job performance measures to be r = .40, based on 24 correlations. They also provided mean validities for specific types of predictors when predicting performance on hands-on tests. General mental ability measures yielded a mean validity r = .43 (based on three correlations). Note that meta-analysis corrects the distribution of validity coefficients for range restriction and criterion unreliability.
Hunter (1984, 1985, 1986) reported the correlation between measures of general cognitive ability and hands-on job performance measures to be r = .75 in civilian studies and r = .53 in the military. These correlations were adjusted for range restriction. A study of military job performance by Vineberg and Joyner (1982) reported an average validity of various predictors for task performance of r = .31, based on 18 correlations. In a later study, Maier and Hiatt (1984) reported validities of the ASVAB when predicting hands-on performance tests to range from r = .56 to .59. Finally, Scribner et al. (1986) obtained a multiple correlation of r = .45 when predicting range performance for tankers in the U.S. Army using general cognitive ability (AFQT), experience, and demographic variables.
The R2 values for the job-specific least-squares and linkage equations given in Table 8 have not been corrected for range restriction or criterion unreliability. For the job-specific least-squares regression equations, values of the multiple correlation range from r = .26 (Army MOS 13B) to r = .71 (Marine Corps MOS 6113) with unweighted and weighted (by sample size) means of r = .43 and r = .40, respectively. For the job-specific linkage equations, values range from r = .18 (Air Force specialty 272X0) to r = .68 (Marine Corps MOS 6112) with unweighted and weighted means of r = .38 and r = .36, respectively. Clearly, the predictive validity of the job-specific linkage equations lies well within the range of validities that have appeared in the literature.
Summary
Taken together, the results from the cross-validity analyses suggest that the linkage methodology has yielded a performance equation that provides predictions for out-of-sample jobs that are not much below the best one
could expect. Predictions are generally better for high-density jobs than for low-density jobs. Nevertheless, the cross-validity analyses have strongly suggested that there is relatively little loss in predictive accuracy when predictions are made for jobs devoid of criterion information. Tempering this finding, however, is the finding that the absolute level of prediction typically ranges from about R2 = .10 to R2 = .20, even when using optimal (i.e., job-specific OLS) prediction equations. Clearly, there remains room for improvement in the prediction of hands-on performance. Nevertheless, from a slightly different perspective, the utility of prediction of job performance for out-of-sample jobs is increased by R2 percent over what it would be without the primary linkage equation. These results are positive and supportive of the multilevel regression approach to predicting performance for jobs without criterion data.
Discussion
One characteristic shared by validity generalization, synthetic validation, and multilevel regression is that they act as "data multipliers"—they take the results of a set of data and expand their application to other settings when the collection of complete data is too expensive or impossible. Validity generalization does not yield information that is directly applicable to the development of prediction equations for jobs without criteria. Rather, the results suggest (1) whether measures of a particular construct would be valid across situations and (2) whether there is reliable situational variance in the correlations.
Synthetic validity does provide information directly applicable to the task of performance predictions without performance criteria. In fact, as mentioned earlier, no performance criteria of any kind are required. Judgments and good job analytic data alone are sufficient for the production of prediction equations. This would appear to be highly advantageous to small organizations that might otherwise be unable to afford a large-scale performance measurement/validation effort. Furthermore, the largest synthetic validity study ever undertaken, the Army's SYNVAL project, demonstrated these equations to be nearly as predictive as optimal least-squares equations that had been adjusted for shrinkage.
Although not developed for this purpose, multilevel regression analysis has been shown to provide a means of generating equations that occasionally exceed appropriately adjusted validity values from least-squares equations. The results compare favorably with the results from the SYNVAL project, although, unlike the SYNVAL data, the data supplied to the multilevel regression analyses had not been corrected for range restriction. It is possible that the results could be more positive if more appropriate job analytic information were used. Recall that the job characteristic data used
in the Linkage project were originally collected on civilian jobs and transferred to the most similar military occupations. A job analysis instrument specifically applied to military jobs might result in better Mj variables and therefore better estimates of the job-specific regression parameters. The Navy has finished a job clustering project that used a job analysis questionnaire developed for Navy jobs—the Job Activities Inventory (JAI; Reynolds et al., 1992) that could easily be modified for application to all military jobs.
One potential drawback of applying multilevel regression techniques is that a number of jobs must have criterion data for estimating the primary linkage equation. The 24 jobs used in the Linkage project did supply enough stability to obtain statistically reliable results based on across-job variation, but including more jobs in the estimation sample would certainly have resulted in better estimates. Increasing the estimation sample should not be unreasonably difficult for larger organizations with some form of performance assessment program in place. For one, the performance criterion does not need to be a hands-on performance test. Written tests of job knowledge or supervisory ratings could serve as criteria just as easily. Performance prediction equations could be developed for new jobs or jobs not having the performance criterion in question.
For example, assessment center research might be helped by this method of estimating predicted performance scores. Sending promising young managers to assessment centers is very costly. A primary equation could be developed based on the individuals who were sent to the assessment centers. Estimated assessment center scores could then be obtained from job-specific regression equations developed from the primary equation. There are a couple of potential drawbacks to this application, including the ability to differentiate between various managerial positions and the effects of range restriction.
The application of multilevel regression techniques also might provide benefits to organizations that are members of larger consortia. The organizational consortium could pool its resources and develop a primary performance prediction equation on a subset of jobs having criterion data across organizations within the consortium. Job-specific equations could then be developed for the remaining jobs.
The research from the Synthetic Validation and Linkage projects has advanced our knowledge of the degree to which performance equations may be created for jobs without criteria. The methodology provided by multilevel regression analysis closely resembles synthetic validation strategies. Both rely heavily on sound job analytic data. After SYNVAL, Mossholder and Arvey's (1984) observation that little work had been done in the area of synthetic validity is no longer true. Further, the Linkage project has demonstrated another successful procedure for generating performance predic-
tion equations that operates without judgments about the validity of individual attributes for various job components. Both procedures should be examined closely in future research because they have the potential for turning an initial investment into substantial cost savings—they make a few data go a long, long way.
ACKNOWLEDGMENTS
The author wishes to thank Larry Hedges and Bengt Muthén for their invaluable help and patience in communicating the details of multilevel regression models and their application, the Committee on Military Enlistment Standards for their challenging comments and creative ideas, Linkage project director Dickie Harris for his support and good humor throughout this research, and the reviewers of the manuscript for their careful reading of a previous version of this chapter. Any errors that remain are the responsibility of the author.
REFERENCES
Browne, M.W. 1975 Predictive validity of a linear regression equation. British Journal of Mathematical and Statistical Psychology 28:79–87.
Campbell, J.P., ed. 1986 Improving the Selection, Classification, and Utilization of Army Enlisted Personnel: Annual Report, 1986 Fiscal Year (Report 813101). Alexandria, Va.: U.S. Army Research Institute.
Campbell, J.P. 1990 Modeling the performance prediction problem in industrial and organizational psychology. Pp. 687–732 in M.D. Dunnette and L.J. Hough, eds., Handbook of Industrial and Organizational Psychology , 2nd ed., Vol. 1. Palo Alto, Calif.: Consulting Psychologists Press.
Campbell, J.P., McCloy, R.A., Oppler, S.H., and Sager, C.E. 1992 A theory of performance. Pp. 35–70 in N. Schmitt and W.C. Borman, eds., Personnel Selection in Organizations. San Francisco, Calif.: Jossey-Bass.
Campbell, J.P., and Zook, L.M., eds. 1992 Building and Retaining the Career Force: New Procedures for Accessing and Assigning Army Enlisted Personnel (ARI Research Note). Alexandria, Va.: U.S. Army Research Institute.
Cattin, P. 1980 Estimation of the predictive power of a regression model. Journal of Applied Psychology 65:407–414.
Crafts, J.L., Szenas, P.L., Chia, W.J., and Pulakos, E.D. 1988 A Review of Models and Procedures for Synthetic Validation for Entry-Level Army Jobs (ARI Research Note 88–107). Alexandria, Va.: U.S. Army Research Institute.
Darlington, R.B. 1968 Multiple regression in psychological research and practice. Psychological Bulletin 69:161–182.
Green, W.H. 1990 Econometric Methods. New York: McMillan.
Harris, D.A., McCloy, R.A., Dempsey, J.R., Roth, C., Sackett, P.R., Hedges, L.V., Smith, D.A., and Hogan, P.F. 1991 Determining the Relationship Between Recruit Characteristics and Job Performance: A Methodology and a Model (FR-PRD-90-17). Alexandria, Va.: Human Resources Research Organization.
Hedges, L.V. 1988 The meta-analysis of test validity studies: Some new approaches. Pp. 191–212 in H. Wainer and H.I. Braun, eds., Test Validity. Hillsdale, N.J.: Erlbaum.
Hollenbeck, J.P., and Whitemer, E.M. 1988 Criterion-related validation for small sample contexts: An integrated approach to synthetic validity. Journal of Applied Psychology 73:536–544.
Hunter, J.E. 1984 The Prediction of Job Performance in the Civilian Sector Using the ASVAB . Rockville, Md.: Research Applications.
1985 Differential Validity Across Jobs in the Military. Rockville, Md.: Research Applications.
1986 Cognitive ability, cognitive aptitudes, job knowledge, and job performance. Journal of Vocational Behavior 29:340–362.
Hunter, J.E., and Hunter, R.F. 1984 Validity and utility of alternative predictors of job performance. Psychological Bulletin 98(1):72–98.
Knapp, D.J., and Campbell, J.P. 1993 Building a Joint-Service Classification Research Road Map: Criterion-Related Issues (FR-PRD-93-11). Alexandria, Va.: Human Resources Research Organization.
Lawshe, C.H. 1952 Employee selection. Personnel Psychology 5:31–34.
Laurence, J.H., and Ramsberger, P.F. 1991 Low Aptitude Men in the Military: Who Profits, Who Pays? New York: Praeger.
Longford, N.T. 1988 VARCL Software for Variance Component Analysis of Data with Hierarchically Nested Random Effects (Maximum Likelihood) . Princeton, N.J.: Educational Testing Service.
Lord, F.M. 1950 Efficiency of prediction when a regression equation from one sample is used in a new sample . Research Bulletin (50–40), Princeton, N.J.: Educational Testing Service.
Maier, M.H., and Hiatt, C.M. 1984 An Evaluation of Using Job Performance Tests to Validate ASVAB Qualification Standards (CNR 89). Alexandria, Va.: Center for Naval Analyses.
McCloy, R.A. 1990 A New Model of Job Performance: An Integration of Measurement, Prediction, and Theory. Unpublished doctoral dissertation, University of Minnesota.
McCloy, R.A., Harris, D.A., Barnes, J.D., Hogan, P.F., Smith, D.A., Clifton, D., and Sola, M. 1992 Accession Quality, Job Performance, and Cost: A Cost-Performance Tradeoff Model (FR-PRD-92-11). Alexandria, Va.: Human Resources Research Organization
McCormick, E.J., Jeanneret, P.R., and Mecham, R.C. 1972 A study of job characteristics and job dimensions based on the Position Analysis Questionnaire (PAQ). Journal of Applied Psychology 56:347–367.
Mossholder, K.W., and Arvey, R.D. 1984 Synthetic validity: A conceptual and comparative review. Journal of Applied Psychology 69:322–333.
Nicholson, G.E. 1960 Prediction in future samples. Pp. 424–427 in I. Olkin et al., eds., Contribution to Probability and Statistics. Stanford, Calif.: Stanford University Press.
Primoff, E.S. 1955 Test Selection by Job Analysis: The J-Coefficient, What It Is, How It Works (Test Technical Series, No. 20). Washington, D.C.: U.S. Civil Service Commission.
Reynolds, D.H. 1992 Developing prediction procedures and evaluating prediction accuracy without empirical data. In J.P. Campbell, ed., Building a Joint-Service Research Road Map: Methodological Issues in Selection and Classification (Draft Interim Report). Alexandria, Va.: Human Resources Research Organization.
Reynolds, D.H., Barnes, J.D., Harris, D.A., and Hams, J.H. 1992 Analysis and Clustering of Entry-Level Navy Ratings (FR-PRD-92-20). Alexandria, Va.: Human Resources Research Organization.
Rozeboom, W.W. 1978 The estimation of cross-validated multiple correlation: A clarification. Psychological Bulletin 85:1348–1351.
Sackett, P.R., Schmidt, N., Tenopyr, M.L., Kehoe, J., and Zedeck, S. 1985 Commentary on ''Forty questions about validity generalization and meta-analysis." Personnel Psychology 38:697–798.
Schmidt, F.L., and Hunter, J.E. 1977 Development of a general solution to the problem of validity generalization. Journal of Applied Psychology 62:529–540.
Schmidt, F.L., Hunter, J.E., and Pearlman, K. 1981 Task differences as moderators of aptitude test validity in selection: A red herring. Journal of Applied Psychology 66:166–185.
Schmidt, F.L., Hunter, J.E., Pearlman, K., and Hirsh, H.R. 1985 Forty questions about validity generalization and meta-analysis. Personnel Psychology 38:697–798.
Schmidt, F.L., Hunter, J.E., Pearlman, K., and Shane, G.S. 1979 Further tests of the Schmidt-Hunter Bayesian validity generalization procedure. Personnel Psychology 32:257–281.
Schmitt, N., Gooding, R.Z., Noe, R.D., and Kirsch, M. 1984 Meta-analysis of validity studies published between 1964 and 1982 and the investigation of study characteristics. Personnel Psychology 37:407–422.
Scribner, B.L., Smith, D.A., Baldwin, R.H., and Phillips, R.L. 1986 Are smart tankers better? AFQT and military productivity. Armed Forces and Society 12(2): 193–206.
Steadman, E. 1981 Relationship of Enlistment Standards to Job Performance . Paper presented at the 1st Annual Conference on Personnel and Training Factors in Systems Effectiveness, San Diego, California.
U.S. Department of Defense 1991 Joint-Service Efforts to Link Military Enlistment Standards to Job Performance. Report to the House Committee on Appropriations. Washington, D.C.: Office of the Assistant Secretary of Defense (Force Management and Personnel).
U.S. Department of Labor 1977 Dictionary of Occupational Titles. Fourth Edition. Washington, D.C.: U.S. Department of Labor.
Vineberg, R., and Joyner, J.N. 1982 Prediction of Job Performance: Review of Military Studies. Alexandria, Va.: Human Resources Research Organization.
Waters, B.K., Barnes, J.D., Foley, P., Steinhaus, S.D., and Brown, D.C. 1988 Estimating the Reading Skills of Military Applicants: Development of an ASVAB to RGL Conversion Table (FR-PRD-88-22). Alexandria, Va.: Human Resources Research Organization.
Waters, B.K., Laurence, J.H., and Camara, W.J. 1987 Personnel Enlistment and Classification Procedures in the U.S. Military. Paper prepared for the Committee on the Performance of Military Personnel. Washington, D.C.: National Academy Press.
Wherry, R.J. 1931 A new formula for predicting the shrinkage of the coefficient of multiple correlation. Annals of Mathematical Statistics 2:446–457.
Wigdor, A.K., and Green, B.F., Jr., eds. 1991 Performance Assessment for the Workplace, Volume I. Committee on the Performance of Military Personnel, Commission on Behavioral and Social Sciences and Education, National Research Council. Washington, D.C.: National Academy Press.
Wing, H., Peterson, N.G., and Hoffman, R.G. 1985 Expert judgments of predictor-criterion validity relationships. Pp. 219–270 in Eaton, N.K., Goer, M.H., Harris, J.H., and Zook, L.M., eds., Improving the Selection, Classification, and Utilization of Army Enlisted Personnel: Annual Report, 1984 Fiscal Year (Report 660). Alexandria, Va.: U.S. Army Research Institute.
Wise, L.L., Campbell, J.P., and Arabian, J.M. 1988 The Army synthetic validation project. Pp. 76–85 in B.F. Green, Jr., H. Wing, and A.K. Wigdor, eds., Linking Military Enlistment Standards to Job Performance: Report of a Workshop. Committee on the Performance of Military Personnel. Washington, D.C.: National Academy Press.
Wise, L.L., Peterson, N.G., Hoffman, R.G., Campbell, J.P., and Arabian, J.M. 1991 Army Synthetic Validity Project Report of Phase III Results, Volume I (Report 922). Alexandria, Va.: U.S. Army Research Institute.
Wright, G.J. 1984 Crosscoding Military and Civilian Occupational Classification Systems. Presented at the 26th Annual Conference of the Military Testing Association, Munich, Federal Republic of Germany.


