
2
Understanding the Epidemiology of Vision Loss and Impairment in the United States
The vast majority of individuals in the United States who reach average life expectancy will experience some type and degree of vision loss and impairment1 during their lifetimes, given current knowledge about effective prevention strategies, barriers to accessing appropriate health care, and the aging process itself. Even mild vision impairment (i.e., near-normal vision) can have a “tangible influence on quality of life” (Cumberland et al., 2016, p. E1). Many eye diseases, conditions, and injuries affect vision, but they do not all contribute equally to the overall burden of vision loss in terms of numbers or populations affected nor the severity or the permanence of subsequent visual impairment. From clinical management and public health perspectives, it is important to understand what the major etiologies of vision loss are, who is most at risk, what risk and protective factors are known and modifiable, and how outcomes may be changed through policy and practice.
There is no peer-reviewed literature on the total population affected by all causes of vision impairment in the United States. Presbyopia, an
___________________
1 In Chapter 1, the committee defines vision loss as the process by which physiological changes or structural, neurological, or acquired damage to the structure or function of one or both eyes or visual information processing structures in the brain occurs, resulting in vision impairment. Vision impairment is defined as a measure of the type and severity of clinical or functional limitation of one or both eyes or visual information processing structures in the brain. These limitations range in severity from mild impairment to total blindness and can affect visual acuity, visual field, and aspects of the eyes or visual system. However, as indicated throughout this chapter, different studies may define vision impairment more narrowly and separately from blindness.
age-related condition that results from the lens losing its ability to change shape and focus clearly on near objects, affects almost everyone entering the middle-age years but can be treated with near-vision lenses (e.g., bifocal, progressive or multifocal lenses, or reading glasses) (Petrash, 2013). One model, based on a review of 12 major epidemiological studies and the 2010 U.S. Census population, estimates that approximately 90 million of the 142 million adults over the age of 40 in the United States experienced vision problems attributable to vision impairment, blindness, refractive error (i.e., myopia and hyperopia), age-related macular degeneration (AMD),2 cataracts, diabetic retinopathy, and glaucoma (Prevent Blindness, 2012b).3 Refractive error alone is estimated to affect more than 48 million people ages 12 and older in the United States (Prevent Blindness, 2012g), and between 8.2 and 15.9 million people have undiagnosed or untreated refractive error (Varma et al., 2016; Wittenborn and Rein, 2016).4 As the baby boomer generation ages, older adults will account for an ever larger proportion of the total population, and age-related eye diseases and conditions are projected to increase accordingly (Varma et al., 2016; Wittenborn and Rein, 2016).
This chapter provides an overview of the epidemiology of eye and vision health in the United States. The first section describes some of the major components of a healthy, functioning visual system. The second section describes the epidemiology of vision impairment and common eye disorders in the United States, including differences by age, gender, and race and ethnicity and current evidence about specific risk and protective factors. The third section proposes four categories of vision impairment by which to frame different population health approaches and provides examples of relevant interventions and treatments. The fourth section describes potential opportunities to reduce the preventable burden of vision impairment from uncorrected refractive error and cataracts in the United States based, in part, on an analysis commissioned by the committee.5 The chapter concludes with a brief summary of key knowledge and research gaps.
___________________
2 The estimate for AMD includes individuals ages 50 and older.
3 This statistic was corrected following release of the prepublication copy of the report.
4 The committee commissioned an analysis, which was not available in the current literature, to establish the preventable burden of vision impairment in the United States from five conditions (diabetic retinopathy, glaucoma, refractive error, cataracts, and AMD). Estimates are based on a variety of sources (including population surveys and compilations of population-based studies) and reflect the best available public data. The committee presents only the results related to cataracts and uncorrected refractive error in this report because the analyses are most robust for these conditions. Chapter 3 provides a more in-depth description of the study’s assumptions and limitations, which are also documented in the commissioned paper itself (Wittenborn and Rein, 2016).
5 The number of people ages 65 years and older in the United States is expected to almost double from 44.7 million (14.1 percent) in 2013 to 82.3 million (21.7 percent) in 2040 (AoA, 2014).
ANATOMY OF THE EYE AND FUNCTION OF THE VISUAL SYSTEM
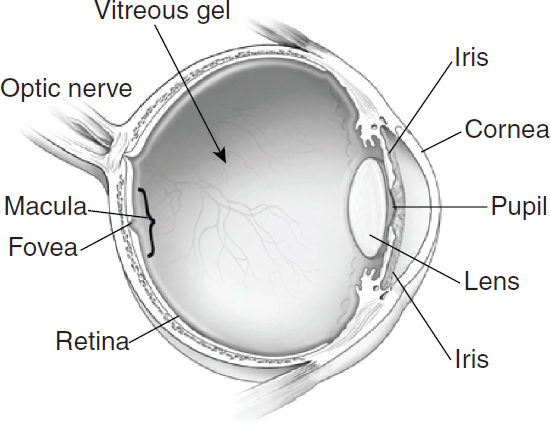
Good eye and vision health requires a functioning visual system to effectively capture light from an object and translate it into neural impulses that are processed in the brain. The visual system consists of the eye, the pathways that conduct neural impulses from the eye to the brain, and specific areas within the brain to interpret the signals. Figure 2-1 illustrates some of the major parts of the eye, which are referenced throughout this chapter. Light enters the eye through the cornea, which helps refract light. The pupil is the small opening at the center of the iris, which functions like the shutter of a camera to regulate the amount of light entering the pupil and expanding and contracting the opening in response to ambient light. The lens further focuses light on the retina, with muscles controlling the lens shape to differentially focus on objects based on distance from the eye. Between the lens and the retina is the vitreous humor—a clear gel that gives the eye its spherical shape and keeps the retina in place. The retina includes blood vessels and a thin layer of light-sensitive tissue (photoreceptors called cones and rods), which translate light energy into neural impulses. Within the retina, the macula has millions of tightly packed cones that are concentrated at the fovea and are responsible for sharp, detailed central vision and color vision. Surrounding the macula, rods are more sensitive to light and are responsible for night vision, peripheral vision, and the ability to
SOURCE: NEI/NIH, 2012a.
detect motion. Photoreceptors convert light into electrical signals, which are relayed to the brain through the optic nerve. Within the brain, visual information is parsed and relayed along various pathways, and eventually interpreted as a recognizable image.
Vision impairment can result from damage or dysfunction to any part of the visual system, including individual components of the eye. How a person’s vision is affected depends on the structures involved and the degree of subclinical and clinical damage or dysfunction to those structures. There are hundreds of diseases, conditions, and injuries to the eye that can negatively affect vision, including various rare diseases, which often have a genetic component and can have substantial impacts on the people affected. However, most cases of vision impairment in the U.S. population are attributable to a small number of causes. Table 2-1 defines and provides
TABLE 2-1 Common Visual System Conditions and Diseases and General Examples of Therapeutic Approaches for Improvement
| Disease or Condition | Affected Structure | Definition and General Approaches for Improvement |
|---|---|---|
| Age-related macular degeneration (AMD) | Macula | A degenerative eye disease that causes damage to the macula. “Dry” AMD is caused by the breakdown of light-sensitive cells in the macula, where as neovascular or “wet” AMD is caused by fluid leaking from abnormal vessels under the retina, leading to blurred vision, dark areas or distortion in central field of vision, and loss of central vision (NEI/NIH, 2013). Treatments are available to slow the progression of neovascular AMD. For late neovasular AMD, eye injections to control edema and the growth of new blood vessels are available. Dry AMD is largely untreatable, although there have been promising discoveries related to nutrition and certain injections. |
| Amblyopia | Brain | A neurological disorder in children, also referred to as “lazy eye,” in which reduced vision in one or both eye occurs due to abnormal interaction or lack of a clear image (Barrett et al., 2013; Pascula et al., 2014). Treatments include refractive correction, patching, vision therapy, orthoptics, and eye drops. |
| Cataracts | Lens | Clouding or discoloration of the lens caused by the clumping of proteins (NEI/NIH, 2010d). Over time the cataracts may grow denser and cloud more of the lens, making it harder to see. Infants may be born with cataracts. Treatments include lens removal usually accompanied by lens replacement. Use of eyeglasses, better lighting, and magnifying glasses may help to reduce symptoms. |
| Disease or Condition | Affected Structure | Definition and General Approaches for Improvement |
|---|---|---|
| Diabetic retinopathy | Blood vessels in retina | Chronically high blood glucose from diabetes causes the blood vessels in the retina to leak fluid and/or hemorrhage, leading to a build-up of fluid in the macula and eventually retinal detachment (NEI/NIH, 2010e). New blood vessels may also form either within the retina or optic nerve. Symptoms include seeing “floating” spots, blurred vision, and permanent vision loss. Treatments include control of systemic blood glucose, laser treatment for growth of new blood vessels, and eye injections to control macular edema. |
| Glaucoma (Open Angle) | Optic nerve | Loss of nerve tissue and axons in the optic nerve associated with elevated intraocular pressure above the level which the eye can tolerate, although normotensive glaucoma occurs in patients without elevated intraocular pressure (NEI/NIH, 2010h). Treatments include control of eye pressure through therapeutic eye drops and surgery. |
| Infection | Different parts of the eye, depending on type of infection | Can include ocular, systemic, and nosocomial infections. Infections can affect the conjunctiva, cornea, and various internal structures of the visual system. Prevention includes improved hygiene, up-to-date immunizations, safe sex practices, and other measures. |
| Injury | The eye or brain | Injuries to the eye, surrounding structures, or damage to visual processing areas within brain. Prevention includes use of protective eyewear in workplaces and for sports activities. |
| Refractive error | Cornea, lens, or eye shape | Irregular shape of cornea, lens, or eyeball prevents light from focusing properly on the retina, causing blurred vision (NEI/NIH, 2010f). Treatments include corrective lenses to improve vision and refractive eye surgery. |
| Strabismus | The accommodative systema | A condition in which there is a misalignment of the eyes, such that one eye constantly or intermittently turns in (esotropia), out (exotropia), up, or down as the other eye looks straight ahead (Hatt and Gnanaraj, 2013). Treatments include corrective lenses, prism, eye exercises, patching, eye drops, and/or eye muscle surgery. |
a The accommodative system can be simply described as the lens, eye muscles, and cranial nerves or brainstem that controls eye movement, although the exact pathway and mechanism are more nuanced.
a high-level summary of some of the more common visual system diseases and conditions, which the committee selected based on the number of children and adults affected and to highlight the variety of public health strategies that will be necessary to comprehensively address eye and vision health in the United States.
As a person ages, many physiological changes occur within the eye that affect vision. Over time, virtually every measure of visual function declines to some extent, including but not limited to decreasing visual acuity (the ability to resolve images of various sizes at fixed distances), sensitivity of the visual field (the ability to detect objects of various sizes within visual space), contrast sensitivity (the ability to detect images against decreasingly contrasting backgrounds), slowed visual processing speeds (increasing time to complete visual tasks), tear production and elimination (resulting in dry eye or obscured vision), and dark adaptation (the ability to adjust to low levels of illumination) (Owsley, 2011; Salvi et al., 2006; Sharma and Hindman, 2014). In diseases such as diabetic retinopathy, glaucoma, and AMD, physiological changes related to the aging process alter the physical conditions under which light enters the eye or compromise the cellular function or neural pathways that relay information about the physical environment to the eye or the brain. In their early and intermediate stages, changes in vision may not be noticeable without a dilated eye examination, despite ongoing damage to structures of the visual system.
THE EPIDEMIOLOGY OF VISION IMPAIRMENT IN THE UNITED STATES
Determining the overall burden of vision impairment in the United States is challenging. Several well-designed population-based studies in the United States provide vital epidemiological estimates, but national epidemiological data related to prevalence, incidence, trends, and impact are limited, especially for adults under age 40 and for children and adolescents. (See Chapter 4 for detailed discussion of surveillance and research challenges in eye and vision health.) National prevalence rates of vision impairment by etiology are typically calculated from the results of surveys, often self-reported by respondents, or are an aggregation of smaller studies, usually cross-sectional and not prospective. Studies of specific diseases and conditions may use the history of a medical intervention as a proxy for actual disease prevalence, which likely results in underestimations. Smaller studies of specific diseases and conditions that include comprehensive eye
examinations6 tend to have more accurate measures of prevalence, incidence, and disease severity, but the results may be less generalizable and representative nationally.
Reporting of epidemiological data is further complicated because outcomes are not measured or reported consistently. The differences may seem minor, but they can have substantial implications for which policies and practices are most appropriate, For example, uncorrectable vision impairment can be described as the amount of vision impairment that remains after appropriate treatment or intervention. Thus, the public health goal to improve health for individuals with uncorrectable vision impairment is to prevent the impairment, develop new therapies that will further correct or reverse the impairment, or provide services that improve the function of those individuals with the impairment. Uncorrected vision impairment refers to the proportion of overall vision impairment that could be improved through currently available and appropriate treatment or intervention. For example, many people have significant refractive error that could easily be corrected through use of prescription glasses or contact lenses. Thus, the public health goal is to either prevent the impairment or to increase access to treatments and interventions that do correct for the vision impairment.
This section presents estimates of overall prevalence for uncorrectable vision impairment only, along with the epidemiology for refractive error, amblyopia and strabismus, visual system injury, glaucoma, diabetic retinopathy, AMD, cataract, vision-threatening infection, and rare eye diseases and conditions. The committee commissioned an analysis to provide current estimates of uncorrected refractive error and cataract in the United States. These results, along with estimates of preventable eye injuries, are discussed in a subsequent section.
Uncorrectable Vision Impairment
Two recent estimates suggest that approximately 4.2 million adults ages 40 years and older in the United States suffer from uncorrectable vision impairment, including blindness (Prevent Blindness, 2012b; Varma et al., 2016). In commissioned work for Prevent Blindness, Wittenborn and colleagues (2013) estimated that another 2.155 million children and adults under age 40 have uncorrectable vision impairment or blindness.7
___________________
6 The committee defines a comprehensive eye examination as a dilated eye examination that may include a range of other tests, in addition to the dilation of the pupil to see the retinal structures (or back of the eye).
7 All three studies define “uncorrectable visual impairment” in terms of visual acuity less than 20/40 but better than 20/200 in the better-seeing eye after correction and separate from blindness. Blindness is defined as visual acuity less than or equal to 20/200 in the better-seeing eye after correction (Prevent Blindness, 2012h; Varma et al., 2016; Wittenborn et al., 2013).
This raises questions about how to improve access to treatments to slow progression of vision loss and how to promote function and health within this population.
Vision Impairment in Adults Ages 40 and Older
Most of the data available about overall vision impairment in adults focus on individuals ages 40 and older. The most recent data on the prevalence and total numbers of individuals with uncorrectable visual impairment (20/40 or worse vision with best possible correction) and blindness in adults come from two, separate sources that pool data from a number of studies to calculate national estimates. Varma and colleagues (2016) calculated prevalence rates and the number of individuals with vision impairment by aggregating data from six major U.S. population-based studies that included more detailed data on U.S. minority groups.8 Prevent Blindness aggregated data from 12 studies that included both U.S. and non-U.S. based studies (Prevent Blindness, 2012e).9 Both studies have methodological and interpretation limitations due to the pooling of data from diverse studies; however, they are the best estimates available at this time.10
Table 2-2 provides prevalence estimates and numbers of persons with uncorrectable vision impairment and blindness from these studies. According to the Varma study, in 2015, the overall estimated prevalence of uncorrectable visual impairment in the U.S. population among individuals ages 40 and older was 2.14 percent, and the overall estimated prevalence of blindness was 0.68 percent. Prevent Blindness estimated the prevalence of uncorrectable visual impairment to be 2.04 percent and the prevalence of blindness to be 0.90 percent based on the 2010 U.S. population (Prevent Blindness
___________________
8Varma and colleagues (2016) pooled prevalence data from U.S.-based studies: Baltimore Eye Survey, Beaver Dam Eye Study, LALES for Asian individuals, Proyecto VER, and the Salisbury Eye Evaluation Study.
9 Prevent Blindness America pooled data from U.S. and international studies: Baltimore Eye Survey, Beaver Dam Eye Study, Blue Mountains Eye Study, Kongwa Eye Survey, Proyecto VER, Rotterdam Study, Salisbury Eye Evaluation Study, San Antonio Heart Study, San Luis Valley Diabetes Study, Visual Impairment Project, and Wisconsin Epidemiological Study of Diabetic Retinopathy.
10 Although these studies represent the best available data on the prevalence of vision impairment and blindness in the United States, they are not without limitations. Varma and colleagues (2016) note that their models do not account for changes in treatment or prevention of major causes of vision impairment and blindness, and that the criterion for blindness is based on visual acuity alone. Not accounting for the effects of visual field loss on the prevalence of blindness could lead to an underestimation of the prevalence of vision impairment and blindness. Prevalence data in the Prevent Blindness database are aggregated from 12 studies, including 5 studies on populations outside the United States. Thus, the generalizability to the U.S. general population is limited for this reason.
TABLE 2-2 Estimated Prevalence and Number of Persons with Uncorrectable Vision Impairment and Blindness in the United States
| Source | Varma et al. (2016)a | Prevent Blindness (2012)b |
|---|---|---|
| Prevalence estimates (in percentages) for uncorrectable vision impairment | 2.14 | 2.04c |
| Prevalence estimates (in percentages) for blindness | 0.68 | 0.86d |
| Number of persons affected (in millions) for uncorrectable vision impairment | 3.22 | 2.91 |
| Number of persons affected (in millions) for blindness | 1.02 | 1.29 |
| Total number of people with uncorrectable visual impairment and blindness | 4.24 | 4.20 |
a Varma defines uncorrectable vision impairment as best-corrected visual acuity worse than 20/40 but better than 20/200 in the better-seeing eye; Varma defines blindness as best-corrected visual acuity of 20/200 or worse in the better-seeing eye.
b Prevent Blindness defines vision impairment as having worse than 20/40 vision in the better eye even with eyeglasses and blindness as visual acuity with best correction in the better eye worse than or equal to 20/200 or a visual field extent of less than 20 degrees in diameter.
c Prevalence is calculated by dividing the number of individuals with visual impairment (2,907,691) by the 2010 U.S. Census Population (142,648,393) and multiplying by 100.
d Prevalence is calculated by dividing the number of blind individuals (1,288,275) by the 2010 U.S. Census Population (142,648,393) and multiplying by 100. SOURCES: Prevent Blindness, 2012c,h; Varma et al., 2016, table 5.
2012c,h). Because of continued changes in the size and demographics of the U.S. population and the availability of data on Asians as a separate category, the more recent data from Varma and colleagues (2016), rather than the data from Prevent Blindness, are used to describe current overall prevalence rates for uncorrectable visual impairment and blindness by age, race and ethnicity, and gender.
Table 2-3 provides estimates of uncorrectable vision impairment and blindness by the decades of life, beginning at age 40 for 2015 and projected for 2050; the data are presented for those individuals with uncorrectable vision impairment and blindness. About half of the cases of visual impairment and blindness affect persons ages 40 to 79. The combined total number of persons ages 40 and older who have uncorrectable vision impairment or are blind is projected to more than double from 4.24 million in 2015 to 8.96 million in 2050 (Varma et al., 2016).
Table 2-4 shows the numbers and prevalence of individuals ages 40 and older with uncorrectable visual impairment and blindness by gender and race and ethnicity in the United States for the year 2015 and the projected numbers for 2050. African Americans ages 40 and older have a higher overall age-adjusted prevalence of uncorrectable visual impairment and blindness than people in other racial and ethnic groups. The
TABLE 2-3 The Number of Persons with Uncorrectable Vision Impairment and Blindness in Adults Ages 40 and Older by Age Group in the United States in the Year 2015 and Projected for the Year 2050 (in millions)
| Year | Vision Impairment | Blindness | Total | Vision Impairment | Blindness | Total |
|---|---|---|---|---|---|---|
| 2015 | 2050 | |||||
| Ages 40–49 | 0.13 | 0.11 | 0.24 | 0.16 | 0.13 | 0.29 |
| Ages 50–59 | 0.17 | 0.15 | 0.32 | 0.21 | 0.15 | 0.36 |
| Ages 60–69 | 0.52 | 0.16 | 0.68 | 0.70 | 0.23 | 0.93 |
| Ages 70–79 | 0.78 | 0.17 | 0.95 | 1.43 | 0.32 | 1.75 |
| Ages 80 and older | 1.61 | 0.43 | 2.04 | 4.44 | 1.18 | 5.62 |
| All ages 40 and older | 3.22 | 1.02 | 4.24 | 6.95 | 2.01 | 8.96 |
SOURCE: Varma et al., 2016, p. E3.
TABLE 2-4 Prevalence and Number of Uncorrectable Visual Impairment and Blindness in Adults Ages 40 and Older by Age Group by Race/Ethnicity and Gender in 2015 and Projected for 2050 in the United States
| Race/Ethnicity | Gender | Vision Impairment | Blindness | ||||
|---|---|---|---|---|---|---|---|
| Number in Millions | Age-Adjusted Prevalence (%)a | Number in Millions | Age-Adjusted Prevalence (%)a | ||||
| 2015 | 2050 | 2015 | 2015 | 2050 | 2015 | ||
| Non-Hispanic White | Men | 0.99 | 1.78 | 1.79 | 0.32 | 0.46 | 0.6 |
| Women | 1.29 | 2.15 | 2.25 | 0.37 | 0.61 | 0.65 | |
| Total | 2.28 | 3.93 | 4.04 | 0.69 | 1.07 | 1.25 | |
| African American |
Men | 0.22 | 0.51 | 2.84 | 0.12 | 0.27 | 1.47 |
| Women | 0.27 | 0.62 | 2.67 | 0.1 | 0.20 | 1.01 | |
| Total | 0.49 | 1.13 | 5.51 | 0.21 | 0.47 | 2.48 | |
| Hispanic/Latino | Men | 0.11 | 0.49 | 1.12 | 0.05 | 0.21 | 0.52 |
| Women | 0.21 | 0.92 | 2.12 | 0.05 | 0.21 | 0.55 | |
| Total | 0.32 | 1.41 | 3.24 | 0.10 | 0.42 | 1.07 | |
| Asian | Men | 0.05 | 0.21 | 1.38 | 0.004 | 0.015 | 0.18 |
| Women | 0.05 | 0.2 | 1.09 | 0.005 | 0.018 | 0.13 | |
| Total | 0.1 | 0.41 | 2.47 | 0.009 | 0.033 | 0.31 | |
| Other Minorities | Men | 0.01 | 0.01 | 1.83 | 0.004 | 0.009 | 0.62 |
| Women | 0.02 | 0.02 | 2.49 | 0.003 | 0.008 | 0.5 | |
| Total | 0.03 | 0.03 | 4.32 | 0.007 | 0.018 | 1.12 | |
| All Races | Men | 1.38 | 3.00 | 8.96 | 0.50 | 0.96 | 3.39 |
| Women | 1.84 | 3.91 | 10.62 | 0.53 | 1.05 | 2.84 | |
| Total | 3.22 | 6.91b | 19.58 | 1.03 | 2.01 | 6.23 | |
a Projections for age-adjusted estimates were not available for 2050.
b Slight difference due to rounding.
SOURCE: Varma et al., 2016, p. E3, eTable 2, and eTable 4.
age-adjusted prevalence of uncorrectable vision impairment and blindness is lower among Hispanics and Asians than among other minorities and non-Hispanic whites. Among Hispanics, non-Hispanic whites, and other minorities, uncorrectable vision impairment occurs more frequently in women than in men; among African Americans and Asians, men are at a greater risk of uncorrectable vision impairment than women. Non-Hispanic white women contribute larger numbers to the current and projected burden of uncorrectable vision impairment and blindness than any other group.
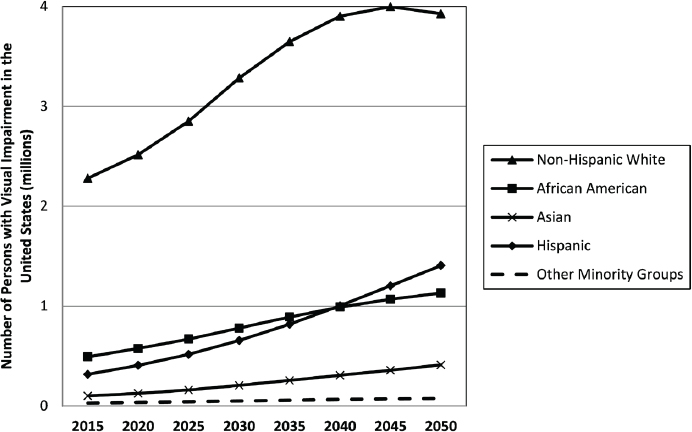
Minority populations in the United States are already at risk for poorer overall health (IOM, 2003). Demographic trends in the United States suggest that the burden of uncorrected vision impairment will increasingly affect these populations. By 2020, more than half of all children in the United States will be part of a minority race or ethnic group; by 2044, that will be true of all age groups (U.S. Census Bureau, 2015). These demographic trends will affect the relative prevalence of uncorrectable vision impairment among groups (see Figure 2-2). Women will continue to account for more cases of uncorrectable vision impairment and blindness than men, but this gap will close slightly from 1.33 to 1.3 women for every man in 2015 and
SOURCE: Varma et al., 2016, Figure 1.
2050, respectively (Varma et al., 2016). Similarly, non-Hispanic whites will account for the majority of uncorrectable visual impairment cases, but this proportion will decrease from 71 percent in 2015 to 57 percent in 2050. The number of Hispanics, African Americans, and Asians with uncorrectable vision impairment is also predicted to increase from 2015 to 2050, but the number of “other minorities” will remain relatively static. By 2050, Hispanics will surpass the number of African Americans with uncorrectable visual impairment. The estimated number of individuals with blindness follows similar trends; non-Hispanic whites will continue to account for a greater proportion of individuals affected by blindness followed by African Americans and Hispanics. The total number of cases of blindness among people ages 80 and older is projected to increase from 430,000 in 2015 to 1.18 million in 2050.
Vision Impairment in Younger Adults
Data on the visual conditions and disorders affecting younger adults and children are more limited. Wittenborn and colleagues (2013) used data from the 2003 to 2008 Medical Expenditure Panel Surveys (MEPS) to estimate that approximately 2.41 million (2.62 percent) of individuals ages 18 to 39 were affected with 13 medical eye conditions (excluding disorders of refraction and accommodation) in 2012 (see Table 2-5). Injury and burns to the eye and disorders of the conjunctiva were the most prevalent.
Wittenborn and colleagues (2013) also included estimates on the severity of uncorrectable visual impairment based on companion data from the 2005–2008 National Health and Nutrition Examination Study (NHANES). As discussed in Chapter 4, for children ages 12 and older, NHANES has included general questions related to eye and vision health from 2005 to 2008, along with a “vision examination” from 2003 to 2008 (CDC, 2015d). Researchers can impute prevalence for younger ages based on “incidence of blindness adjusted such that predicted prevalence at age 16 equals the observed NHANES prevalence” (Wittenborn et al., 2013, p. 1731). Of the 1.3 million people 39 years old and younger who had some degree of uncorrectable vision impairment, approximately 83 percent (1.1 million) had mild impairment (a visual acuity of worse than 20/40 to 20/80), 10 percent (128,000) had moderate impairment (visual acuity of 20/80 to 20/200), and about 7 percent (92,000) were blind (Wittenborn et al., 2013).11
___________________
11 The nomenclature of mild and moderate impairment understates the degree to which the impairment can affect one’s ability to operate in the wider world; for example, driver’s licenses are often restricted for persons with visual acuity worse than 20/40.
TABLE 2-5 Prevalence of Vision Disorder Diagnoses Among Young Adults (Ages 18–39) in the Medical Expenditure Panel Survey, 2003 Through 2008
| Conditiona | Prevalence (%)b | Individuals (in thousands) |
|---|---|---|
| Disorders of the globe | 0.45 | 417 |
| Injury and burns | 0.56 | 511 |
| Disorders of conjunctiva | 0.54 | 493 |
| Other eye disorders | 0.46 | 422 |
| Strabismus, binocular eye movements | 0.03c | 27 |
| Visual disturbances | 0.17 | 160 |
| Blindness and low vision | 0.12 | 107 |
| Disorders of lacrimal system | 0.13 | 120 |
| Cataract | 0.05 | 48 |
| Retinal detachment, defects, and disorders | 0.05 | 48 |
| Disorders of the eyelids | 0.19 | 174 |
| Glaucoma | 0.11 | 97 |
| Disorders of optic nerve and visual pathways | 0.03c | 24 |
| Total | 2.62 | 2,405 |
a Medical conditions exclude disorders of refraction and accommodation.
b Values do not sum because some individuals had multiple conditions.
c Not statistically distinguishable from zero.
SOURCE: Adapted from Wittenborn et al., 2013.
Vision Impairment in Children and Adolescents
The epidemiology of visual impairment in children and adolescents differs from that in adults, and far less information is available on the prevalence of visual impairment in this group. Vision impairment in young children is common (Kemper et al., 2004). The U.S. Preventive Services Task Force states that between 1 and 5 percent of preschool-aged children in the United States have vision impairment (USPSTF, 2011). One study found that among U.S. children ages 30 to 72 months, visual impairment due to an underlying eye disease occurred in the worse eye of 3.4 percent of Asian children and 2.6 percent of non-Hispanic white children (Tarczy-Hornoch et al., 2013). The prevalence of visual impairment or amblyopia from uncorrected refractive error was more than 5 percent among African American and Hispanic preschoolers (ages 30 to 72 months) (MEPEDS, 2009). Among 0 to 17-year-olds, Wittenborn et al. (2013) estimated that 857,000 individuals have uncorrectable vision loss (prevalence of 1.16 percent), and parses this group by degree of impairment: 775,000 have mild impairment (visual acuity of less than 20/40 to 20/80), 76,000 have moderate impairment (visual acuity of 20/80 to 20/200), and 6,000 are blind. Table 2-6 lists the prevalence of 13 types of vision problems among
TABLE 2-6 Prevalence of Vision Disorder Diagnoses Among Children (Ages 0–17) in the Medical Expenditure Panel Survey, 2003 Through 2008
| Conditiona | Prevalence (%)b | Individuals (in thousands) |
|---|---|---|
| Disorders of the globe | 0.67 | 499 |
| Injury and burns | 0.38 | 280 |
| Disorders of conjunctiva | 1.76 | 1,302 |
| Other eye disorders | 0.51 | 377 |
| Strabismus, binocular eye movements | 0.24 | 175 |
| Visual disturbances | 0.26 | 196 |
| Blindness and low vision | 0.09 | 69 |
| Disorders of lacrimal system | 0.18 | 136 |
| Cataract | 0.01c | 11 |
| Retinal detachment, defects, and disorders | 0.04 | 31 |
| Disorders of the eyelids | 0.16 | 121 |
| Glaucoma | 0.04c | 28 |
| Disorders of optic nerve and visual pathways | 0.02c | 14 |
| Total | 4.13 | 3,063 |
a Medical conditions exclude disorders of refraction and accommodation.
b Values do not sum because some individuals had multiple conditions.
c Not statistically distinguishable from 0.
SOURCE: Adapted from Wittenborn et al., 2013.
U.S. children ages 17 and younger, which does not include refractive error or accommodation disorders.
Geographic Distribution of Uncorrectable Vision Impairment and Blindness
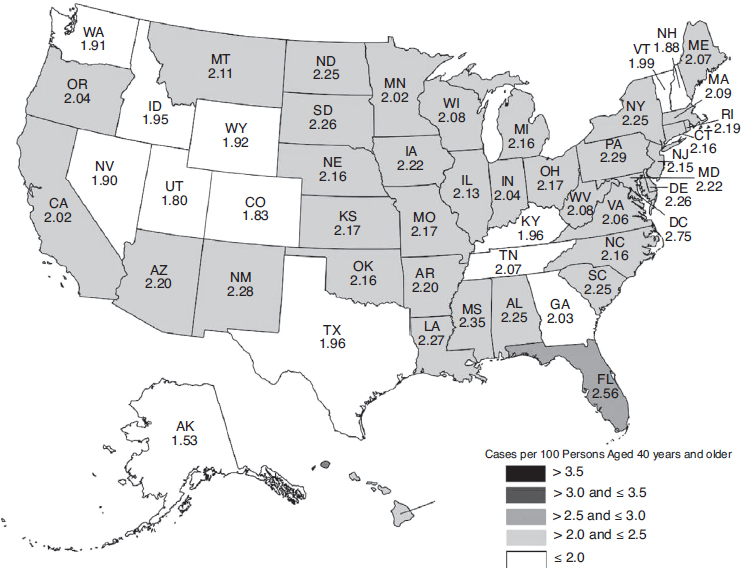
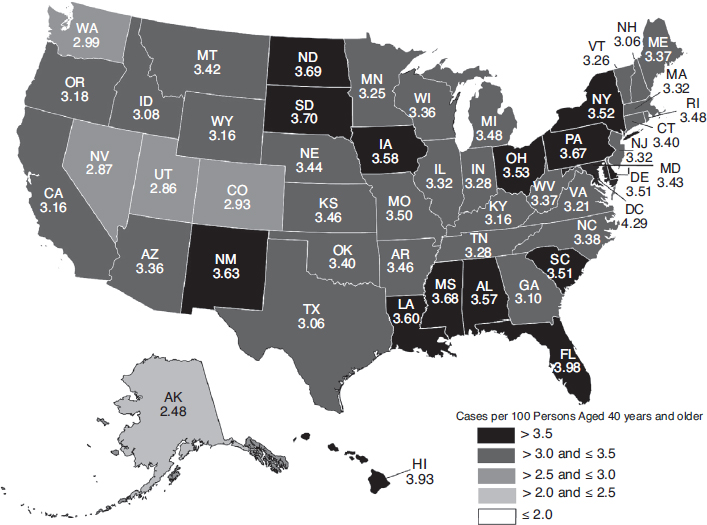
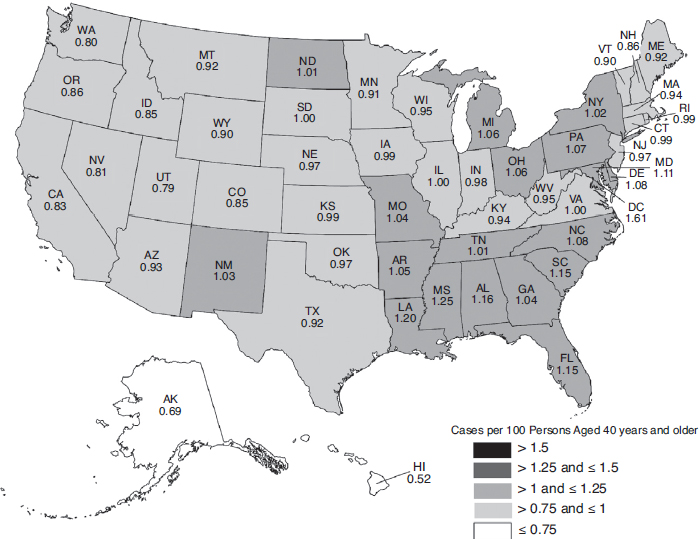
The overall burden of eye disease varies from state to state, and the pattern of highest and lowest prevalence varies by condition. Similarly, the distribution of uncorrectable visual impairment and blindness varies significantly by region and state. Figures 2-3, 2-4, 2-5, and 2-6 depict the estimated per-capita rates of visual impairment and blindness in each state for populations ages 40 and older in 2015 and 2050 (Varma et al., 2016). Per-capita rates (per 100 persons) were highest in the District of Columbia (2.75), Florida (2.56), Mississippi (2.35), Hawaii (2.35), and Pennsylvania (2.29), whereas the lowest per-capita rates were found in Western states—Alaska (1.53), Utah (1.80), Colorado (1.83), Nevada (1.90), and Washington (1.91) (Varma et al., 2016). By 2050, the projected per-capita rates will remain the highest in the District of Columbia (4.29) and Florida (3.98), followed by Hawaii (3.93), South Dakota (3.70), and North Dakota (3.69),
SOURCE: Used with permission, Varma et al., 2016.
although per-capita prevalence of uncorrectable visual impairment is projected to rise in every state.
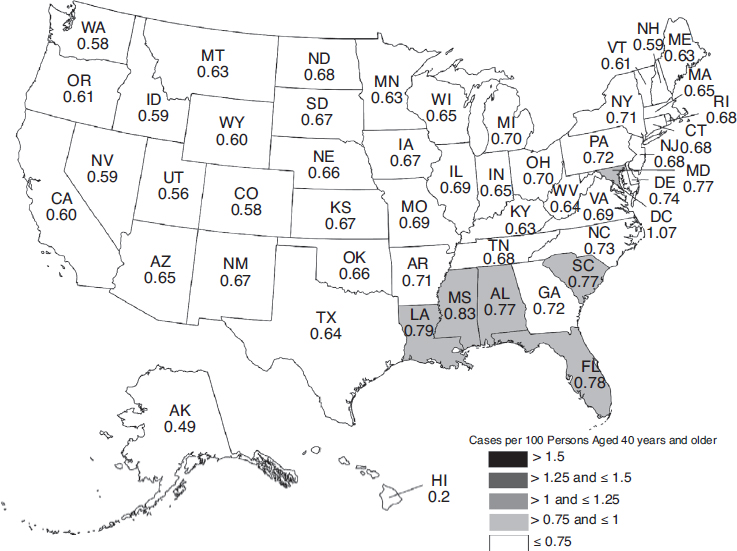
Per-capita rates of blindness in the United States demonstrate similar patterns. In 2015, the District of Columbia (1.07), Mississippi (0.83), Louisiana (0.79), and Florida (0.78), have the highest per-capita rates, followed closely by South Carolina, Alabama, and Maryland (0.77). Hawaii (0.42), Alaska (0.49), Utah (0.56), Colorado (0.58), and Washington (0.58) have the lowest per-capita rates. Projected per-capita rates of blindness in 2050 will remain higher in the East than in the West, with every state projected to have prevalence increases.
Another study by the Centers for Disease Control and Prevention (CDC) collected data from 19 states that fielded a special vision module during the 2006–2008 Behavioral Risk Factor Surveillance System (BRFSS) to estimate prevalence rates based on self-reported data among adults ages 65 and older for cataract, glaucoma, AMD, and diabetic retinopathy (CDC,
SOURCE: Used with permission, Varma et al., 2016.
2011b). Iowa, Missouri, North Carolina, and West Virginia reported the highest prevalence rates for cataract (31.2 to 33.7 percent). New York, North Carolina, Ohio, and Texas reported the highest prevalence rates for glaucoma (10.3 to 12.3 percent). Indiana, Nebraska, New Mexico, and Wyoming reported the highest prevalence rates of age-related macular degeneration (10.6 to 11.5 percent). Alabama, Georgia, Indiana, New York, and North Carolina reported the highest prevalence rates of diabetic retinopathy (4.0 to 5.0 percent).12
Even within states there can be substantial variation in severity of vision loss. At the county level, variations in the prevalence of vision loss are dramatic. Data from the American Community Survey from 2009 to 2013 show significant inter-county variation (between less than 1.0 percent to 18.4 percent) in the prevalence of severe vision loss among adults ages
___________________
12 Note: BRFSS data can be compared to Prevent Blindness data at www.visionproblems.org/index/state-summaries.html (accessed August 28, 2016).
SOURCE: Used with permission, Varma et al., 2016.
18 and older (Kirtland et al., 2015).13,14 Of counties in the top quartile of severe vision loss prevalence,15 77.3 percent are located in Southern states. High prevalence rates have also been significantly correlated with poverty (Kirtland et al., 2015).
Prevalence rates are influenced by characteristics of the population, such as age, race and ethnicity, and socioeconomic status, among other broader determinants of health. Better county-level data would allow for more specific allocation of resources than state-level data. State-level data can mask disparities among and within geographically smaller areas. Smaller geographic areas more closely align with service referral and delivery patterns
___________________
13 The survey included people ages 18 and older.
14 Severe vision loss is defined in the American Community Survey as a positive self-reported response to the question, “Is this person blind or does s/he have serious difficulty seeing even when wearing glasses?”
15 The top quartile was defined as ≥ 4.2 percent compared with a national median of 3.1 percent.
SOURCE: Used with permission, Varma et al., 2016.
where interventions can be more easily targeted, but small sample sizes can affect generalizability and raise privacy concerns. Better data from all states and their subdivisions are needed to assist in efforts to target resources. Chapter 4 of this report contains more detail on what additional surveillance activities and vision-related research data are needed.
Socioeconomic Status and the Risk for Vision Impairment
“[S]ocioeconomic status itself is an important determinant of visual impairment” (Tielsch et al., 1991, p. 637). Both nationally and globally, vision impairment and blindness are more prevalent in less affluent regions (Ho and Schwab, 2001; Shweikh et al., 2015; Yip et al., 2014). As noted by Kirtland and colleagues (2015), socioeconomic factors are associated with eye disease burden in a geographical area. Persons of all ages are at greater risk of developing eye disease if they are poor, have less education, or are unemployed (e.g., Ko et al., 2012; Roy, 2000; Roy and Affouf, 2006; Tielsch et al., 1991; Varma et al., 2004b). One study of individuals with
age-related eye disease (i.e., AMD, diabetic retinopathy, glaucoma, and cataracts) found that a lower income and a lower level of education attainment were both associated with a decreased likelihood of having an eye care visit in the past 12 months (Zhang et al., 2012). A study of individuals with diabetes also found that minority patients are also more likely to have poor glycemic control and not perceive a need for care (Chou et al., 2014).
Children who live in low-income homes are also at greater risk for various types of vision loss and untreated vision impairment. Being a member of a family who lives below the federal poverty level nearly doubles the likelihood that a child will be visually impaired compared with children from families whose income is greater than or equal to 200 percent of the poverty level (Cotch et al., 2005). In a nationally representative sample of school-age children, those from lower-income families were more likely to have eye conditions that were underdiagnosed or undertreated than children from wealthier families, “placing them at risk for future problems” (Ganz et al., 2006, p. 2298). A citywide screening program in Philadelphia found that 10 percent of the 924 children needed continuous eye care, most notably for amblyopia, 10 children needed ocular surgery for strabismus and other conditions, and 567 needed eyeglasses (Dotan et al., 2015). Similarly, a study of 2,286 first-graders in Southern California schools found that 14 of the 17 students with amblyopia were not receiving treatment at the time the exam was performed, and 45 of the 57 students with clinically meaningful hyperopia lacked eyeglasses (Kodjebacheva et al., 2016). This same study also found that students who were Hispanic or African American or attending a Title 1 school were more likely to have untreated refractive error as well. In a previous MEPEDS project examining African American and Hispanic children living in a less affluent community, none of those with amblyopia had been identified before the study (Tarczy-Hornoch et al., 2007).
Insurance status can have a direct impact on whether populations have access to appropriate eye and vision care. Numerous studies have identified an association between lack of insurance and lower utilization of eye and vision care (Li et al., 2013; Varma et al., 2004c), especially in minority populations (Chou et al., 2014), although some studies did not find insurance to be significant after controlling for other factors (Sloan et al., 2014). Although having insurance can help mitigate the impact associated with lower family income, additional barriers can still affect access to care. For example, Kovarik and colleagues (2016) found that 89 percent of patients at an inner-city hospital in Pittsburgh had insurance, yet 25 percent and 19 percent of this population had undiagnosed retinopathy and advanced sight-threatening retinopathy, respectively, because of barriers such as low income, transportation issues, and physical disabilities associated with diabetes complications (Kovarik et al., 2016). Other factors may include
limited physical and cognitive function and distance to an eye care provider (Sloan et al., 2014). The lack of awareness about the causes of eye diseases and what can be done to minimize subsequent vision impairment, which can be another risk factor, is discussed in Chapter 4. Strategies to improve the access and quality of eye and vision care are described in more detail in Chapters 6 and 7, respectively.
UNDERSTANDING THE ETIOLOGY OF VISION IMPAIRMENT IN THE UNITED STATES
Understanding how the etiology of vision impairment and blindness vary among populations can help policy makers and communities tailor interventions and deploy limited resources to best achieve health equity and improve population health. As with overall vision impairment, the prevalence of specific eye disorders varies among individuals age 40 and older. The prevalence of hyperopia, cataract, diabetic retinopathy, glaucoma, and age-related macular degeneration increases with advancing age; in the case of myopia, this trend is reversed. Because an individual can have more than one eye disorder, combining the number of cases of specific diseases represented in Table 2-7 would likely result in higher total than actually exists.
The prevalence and distribution of specific eye diseases also vary by race and ethnicity. Figure 2-7 depicts the extent to which different eye diseases contribute to the prevalence of vision impairment and blindness among different racial and ethnic groups. Glaucoma and diabetic retinopathy account for a greater proportion of vision impairment and blindness among Hispanics and individuals of African ancestry than among non-Hispanic whites. By comparison, age-related macular degeneration accounts for a greater proportion of vision impairment and blindness among non-Hispanic whites than among other racial and ethnic groups. For all represented populations, cataract is the most common cause of vision impairment. Among individuals of African ancestry, cataract is also the most common cause of blindness.
Refractive Error
Refractive error results from an irregular shape of the cornea, lens, or eyeball, which prevents light from focusing properly on the retina. Symptoms of uncorrected refractive error may include blurry vision, headaches, haziness, and eye strain (NEI/NIH, 2010f). Myopia and hyperopia are conditions in which abnormalities in the shape of the cornea, lens, or length of the eye cause light entering the eye to focus at points in front and/or behind the retina (NEI/NIH, 2010f). With myopia (nearsightedness), objects close up appear clear, while objects far away appear blurry. With hyperopia (farsightedness), distant objects appear clear, while objects that are close
TABLE 2-7 Number Affected and Rate of Prevalence for Eye Diseases and Vision Disorders by Age in Adults Ages 40 and Older in the United States in 2010
| Disease or Condition | Measure | Total Population Ages 40+ | 40–49 | 50–59 | 60–69 | 70–79 | 80+ |
|---|---|---|---|---|---|---|---|
| Hyperopia | Number (in millions) | 14.2 | 1.59 | 3.13 | 3.76 | 3.09 | 2.62 |
| Rate per 100 personsa | 9.95 | 3.65 | 7.47 | 12.84 | 18.62 | 23.31 | |
| Myopia | Number (in millions) | 34.12 | 15.05 | 9.61 | 4.97 | 2.50 | 1.98 |
| Rate per 100 personsa | 23.92 | 34.52 | 22.91 | 16.88 | 15.09 | 17.60 | |
| Cataract | Number (in millions) | 24.41 | 1.09 | 2.96 | 5.67 | 7.01 | 7.67 |
| Rate per 100 personsa | 17.11 | 2.51 | 7.05 | 19.40 | 42.22 | 68.30 | |
| Diabetic retinopathyb | Number (in millions) | 7.69 | 1.02 | 3.24 | 1.92 | 1.51 | — |
| Rate per 100 personsa | 5.39 | 2.34 | 5.50a | 8.84a | 8.13a | — | |
| Glaucoma | Number (in millions) | 2.72 | 0.30 | 0.45 | 0.53 | 0.56 | 0.89 |
| Rate per 100 personsa | 1.91 | 0.69 | 1.07 | 1.80 | 3.34 | 7.89 | |
| Age-related macular degeneration | Number (in millions) | 2.07 | NA | 0.16 | 0.21 | 0.38 | 1.32 |
| Rate per 100 personsa | 1.45 | NA | 0.38 | 0.71 | 2.30 | 11.73 |
a The rate per 100 persons is calculated by dividing the number of individuals affected by the 2010 Census population for the specific age group.
b Age ranges for diabetic retinopathy include 40–49, 50–64, 65–74, and 75+.
SOURCE: Prevent Blindness, 2012a.
appear blurry. However, younger individuals with hyperopia may be able to accommodate sufficiently to see clearly. Astigmatism occurs when the unequal curvature of one or more refractive surfaces of the eye does not allow for light to focus evenly onto the retina (NEI/NIH, 2010g; Tarczy-Hornock et al., 2010). Uncorrected astigmatism can lead to reductions in visual performance for both distance and near tasks.
Refractive Error in Adults
Refractive error is the most common cause of vision impairment among adults in the United States. One estimate suggests that more than 48 million
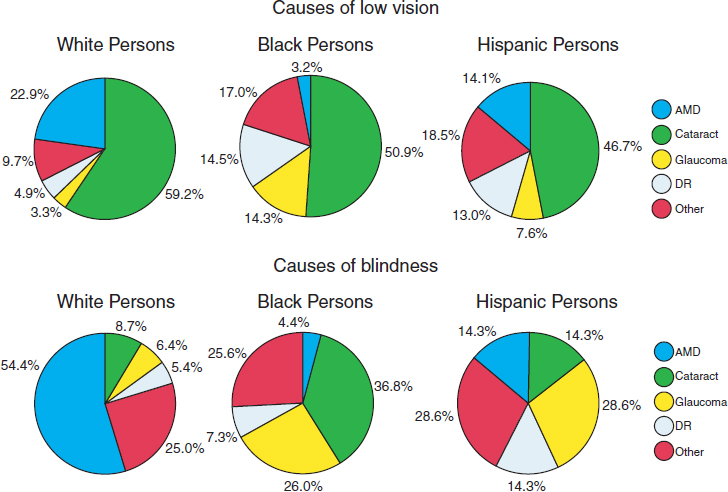
NOTES: Study authors defined “low vision” as best-corrected visual acuity of 20/40 or worse in the better-seeing eye, excluding those who were categorized as being blind. Blindness refers to best-corrected visual acuity of 20/200 or worse in the better-seeing eye.
AMD = age-related macular degeneration; DR = diabetic retinopathy.
SOURCE: Adapted from Congdon et al., 2004a.
adults ages 40 and older in the United States—approximately one out of every three—experienced some degree of myopia (34 million) or hyperopia (14 million) in 2010 (Prevent Blindness, 2012g). Another estimate based on NHANES data from 1999 to 2004 found age-standardized prevalences of 3.6 percent, 33.1 percent, and 36.2 percent for hyperopia, myopia, or astigmatism, respectively, in populations over the age of 20 (Vitale et al., 2008). In older adults, uncorrected refractive error can lead to a greater risk of mortality, functional decline, social isolation, falls and related hip fractures, and accidents (Cummings et al., 1995; Klein et al., 1998; Thompson et al., 1989; West et al., 1997), whereas corrected refractive error can improve “vision-specific quality of life” and vision-related mental health and well-being (Coleman et al., 2006). One recent study found that older adults ages 65 to 84 with uncorrected refractive error and vision impairment16
___________________
16 Uncorrected refractive error was defined as visual acuity between 20/30 and 20/80 without corrective lenses, and vision impairment was defined as post-refraction best-corrected visual acuity in both eyes of 20/30 or worse (Zebardast et al., 2015).
walked more slowly, demonstrated slower near-task performance, experienced more frequent driving cessation, and self-reported more visual difficulties compared to individuals with normal vision, although the impact of vision impairment was greater and affected more functional metrics than the impact of uncorrected refractive error (Zebardast et al., 2015).
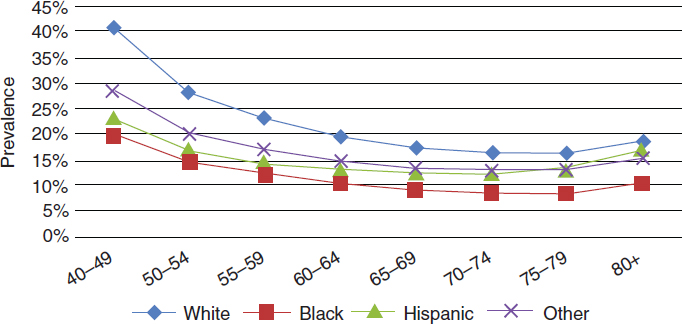
The prevalence of hyperopia and myopia varies by gender, as well as by race and ethnicity. Prevalence of myopia and hyperopia are slightly higher among women than among men ages 40 and older (Prevent Blindness, 2012d,f). In 2010, the prevalence rate of hyperopia among persons ages 40 and older self-identifying as white was 11.4 percent; African American, 5.2 percent; Hispanic, 6.4 percent; and other minorities, 7.2 percent (NEI/NIH, 2010a). Figure 2-8 shows how hyperopia prevalence increases with age for all racial and ethnic groups. Between 2010 and 2050, the estimated number of cases of hyperopia will increase for all racial and ethnic groups (NEI/NIH, 2010a).
In 2010, the prevalence rate for myopia among persons ages 40 and older self-identifying as white was 26.4 percent; African American, 14.5 percent; Hispanic, 18.3 percent; and other minorities, 20.7 percent (NEI/NIH, 2010b). Figure 2-9 shows that myopia decreases by age group for all races and ethnicities after age 40, although the prevalence of myopia remains higher overall for white and other populations, compared to Hispanic and black populations. Estimates for the projected number of cases of myopia between 2010 and 2050 indicate that, among whites, the number of cases will remain fairly stable, there will be a 1.5-fold increase of cases in African Americans, an almost 3-fold increase in the number of cases among Hispanics, and a 2.5-fold increase in cases among other minority
SOURCE: NEI/NIH, 2010a.
SOURCE: NEI/NIH, 2010b.
populations (NEI/NIH, 2010b). Using NHANES data from 1999 to 2004, Vitale and colleagues (2008) found the prevalence of astigmatism was 31 percent among people ages 40 and older in the United States.
Using data from 1999 to 2004 to assess the occurrence of clinically important refractive error17 in 20- to 39-year-olds, as well as in older age groups, Vitale and colleagues (2008) found that myopia was more prevalent in females than in males (40 versus 33 percent), whereas hyperopia was less prevalent among females than males (0.8 percent versus 1.3 percent). Astigmatism affected 23.1 percent of this age group and 36.2 percent of all participants.
Refractive Error in Children
Uncorrected refractive error can have a substantial impact on children. Uncorrected refractive error in young children can lead to physical, developmental, and academic problems. For example, hyperopia is associated with amblyopia and strabismus, as well as delays in visuomotor and visuocognitive development in children younger than age 7 (Atkinson et al., 2007). As compared to children ages 4 to 5 without hyperopia, those with uncorrected bilateral hyperopia are more likely to underperform on some measures of preschool early literacy, which has been associated with future
___________________
17 Clinically important refractive error was defined using data from the eye with a greater absolute spherical equivalent (SphEq) value: hyperopia, SphEq value of 3.0 diopters (D) or greater; myopia, SphEq value of −1.0 D or less; and astigmatism, cylinder of 1.0 D or greater in either eye (Vitale et al., 2008).
performance in learning to read and write (Kulp et al., 2016). Similarly, a recent study found that astigmatism is associated with two measures of reduced academic readiness among at-risk preschool-age children (Orlansky et al., 2015).
Establishing the prevalence of refractive error in the United States for those younger than age 12 is more difficult than for older populations. There is no national database tracking the prevalence or incidence of refractive error in children under age 12, requiring prevalence to be imputed, as discussed earlier. Large population-based studies have been used to estimate national rates for younger age groups. One study found prevalence for myopia of 4.5 percent and 28 percent among 6- to 7-year-olds and 12-year-olds, respectively, in the United States (Zadnik, 1997). The Collaborative Longitudinal Evaluation of Ethnicity and Refractive Error (CLEERE) study, a longitudinal observational study encompassing grades 1 to 8 and four race and ethnicity groups estimated overall population prevalence rates of 9.2 percent for myopia, 12.8 percent for hyperopia, and 28.4 percent for astigmatism in 1997 (Kleinstein et al., 2003). Table 2-8 presents estimates from four studies on the prevalence for different types of refractive errors among children of different age groups.
Racial and socioeconomic disparities have been examined as potential risk factors in uncorrected and undercorrected refractive error in both adult and pediatric populations. Qiu and colleagues (2014) identified high-risk groups among the population ages 12 and older surveyed in the 2005–2008 NHANES. Overall, half of the subjects had refractive errors, and among these individuals the unmet need for proper correction was 11.7 percent. Mexican Americans and non-Hispanic blacks were more likely to have inadequate refractive corrections than non-Hispanic whites across all age groups. This observed disparity was greatest among 12- to 19-year-olds. Other factors that are associated with worse adult access to eye care were low socioeconomic status (low income, low education) and a lack of health insurance. Similarly, a direct assessment of 11,332 first-graders in low-income areas visited by the University of California, Los Angeles, Mobile Eye Clinic found that 95 percent of the students with decreased visual acuity did not have the glasses needed for attaining normal vision (Kodjebacheva et al., 2011). More than 95 percent of the students were identified as being of a minority race or ethnicity. Boys were less likely than girls to have eyeglasses, and African American and Latino students were less likely than non-Hispanic white students to have glasses. The authors noted the importance of early interventions to address this deficit and to prevent problems later in life.
TABLE 2-8 Examples of Studies on the Prevalence of Different Types of Refractive Error Among Children by Race/Ethnicity
| Study Age | Population | Myopia (%) | Hyperopia (%) | Astigmatism (%) |
|---|---|---|---|---|
| Ages 6–72 months (BPEDS)a | Non-Hispanic white | 1.1f | 13.2g | 8.3(WTR)h |
| 0.7(ATR)h | ||||
| 2.4(OBL)h | ||||
| African Americans | 7.4f | 6.9g | 9.0(WTR)h | |
| 1.0(ATR)h | ||||
| 3.1(OBL)h | ||||
| Grades 1–8 (ages 5–17 years)b | Non-Hispanic white | 4.4i | 19.3j | 26.4k |
| African American | 6.6i | 6.4j | 20.0k | |
| Hispanic | 13.2i | 12.7j | 36.9k | |
| Asian | 18.5i | 6.3j | 33.6k | |
| Groups combined | 9.2i | 12.8j | 28.4k | |
| Ages 6–72 months (MEPEDS)c,d | African American | 6.6f | 8.8g | 12.7h |
| Hispanic | 3.7f | 12.0g | 16.8h | |
| Ages 6–72 months (MEPEDS)e | Non-Hispanic white | 1.20f | 9.13g | 6.33h |
| Asian | 3.98f | 4.84g | 8.29h |
NOTES: f Prevalence of myopic spherical equivalent refractive error of ≤–1.00 D in the eye with the greater refractive error. g Prevalence of hyperopic spherical equivalent refractive error of ≥+3.00 D in the eye with the greater refractive error. h Prevalence of Astigmatism of ≥1.50 D or greater in the eye with greater refractive error. i Prevalence of myopia of ≤−0.75 D in each principal meridian. j Prevalence of hyperopia of ≥+1.25 D in each principal meridian. k Prevalence of astigmatism of ≥1.00 D difference in refractive error between the two principal meridians.
ATR = against the rule; BPEDS = Baltimore Pediatric Eye Disease Study; MEPEDS = Multi-Ethnic Pediatric Eye Disease Study Group; OBL = oblique; WTR = with the rule.
SOURCES: a Giordano et al., 2009; b Kleinstein et al., 2003; c Fozailoff et al., 2011; d MEPEDS, 2010; e Wen et al., 2013.
Common Risk Factors for Refractive Error
Risk factors for significant refractive error in childhood include parental history; having had prenatal, perinatal, or postnatal complications; and having had a significant neurodevelopmental condition (Jones-Jordan et al., 2010; O’Donoghue et al., 2015; Parssinen et al., 2014; Zadnik et al., 1994, 2015). For example, the prevalence of myopia in 12-year-old children in Australia was approximately 15 percent and 44 percent for children with one and two myopic parents, respectively, compared with almost 8 percent in children with no myopic parents (Ip et al., 2007). Children with neurodevelopmental diagnoses (e.g., Down syndrome, fragile X, or cerebral palsy, as well as children who are born very low birth weight or preterm)
are also at a higher risk for significant refractive errors along with other ocular complications (Salt and Sargent, 2014). Of a study cohort of 1,098 infants born at extremely low birth weight (401–1,000 grams), some vision impairment was present in 9 percent, and vision impairment was increased in infants with lower birth weight. This ranged from 5 percent of infants weighing between 801–900 and 901–1,000 grams exhibiting some degree of vision impairment, to 21 percent of infants weighing between 401–500 grams (Vohr et al., 2000). Another follow-up study evaluating extremely preterm children at the age of 6.5 years found that 37.9 percent of the children had some ophthalmologic abnormality, compared with 6.2 percent of the control cohort (Hellgren et al., 2016). Other risk factors for refractive errors in children may include a sedentary lifestyle and maternal smoking during pregnancy (Borchert et al., 2011; O’Donoghue et al., 2015; Pan et al., 2012).
Environmental factors can also play an important role in the development of myopia. A number of studies have found an inverse association between myopia and the amount of time spent outdoors in school-age children (Dirani et al., 2009; Parssinen et al., 2014; Rose et al., 2008). For example, one cross-sectional study comparing the prevalence of myopia in 6- and 7-year-old children of Chinese ethnicity in Sydney and Singapore found that low levels of outdoor time and high near-work time were significant factors associated with differences in the prevalence of myopia between the two study populations, 3.3 and 29.1 percent, respectively (Rose et al., 2008). A recent randomized controlled trial among 6-year-old school children in China found the addition of 40 minutes of outdoor time resulted in a 9.1 percent decrease in the incidence of myopia over the next 3 years, compared to the control group (He et al., 2015).
Most studies on myopia and near work (e.g., time spent reading, studying, watching television, or playing computer or video games) include self-reported data and are cross-sectional, so they cannot explore the temporal relationship between outcomes and predictors. Studies on near-work and myopia in younger adults have had mixed results, depending on the measure of near work. For example, a study of adolescent students in rural China did not find the length of near-work activity to be significantly different between children with and without myopia (Lu et al., 2009), but another study of 12-year-old Australian school children did find an association between myopia and close reading distance and time spent continuously reading before taking a 5-minute break (Ip et al., 2008). A longitudinal study of non-myopic first-grade students followed through 8th grade found that children who become myopic spend less time outdoors than non-myopic children, which may influence levels of near work (Jones-Jordan et al., 2011). Citing evidence of seasonal effects on myopia progression, the study concluded that less time spent outdoors may have a
stronger influence on subsequent development of myopia than near work. Data evaluating myopia in children and cumulative near work, using various measures of near work, did not find a relationship between near-work activities and the onset of myopia (Jones-Jordan et al., 2011).
The biological mechanism that would explain the association between outdoor activity and myopia is not well understood, but the evidence suggests that greater exposure to it may be an opportunity to reduce prevalence rates of myopia (Dirani et al., 2009). The effect of gene–environment interaction on the etiology of myopia is still controversial, with inconsistent findings in different studies (Pan et al., 2012). Longitudinal cohort studies or randomized clinical trials of community-based health behavior interventions should be conducted to further clarify the etiology of myopia (Pan et al., 2012).
Strabismus and Amblyopia
Strabismus and amblyopia are frequent diagnoses associated with monocular vision loss in children, but may also persist or develop during adulthood. Other related conditions, which are not examined in this chapter but are important to acknowledge, include anisometropia (significant differences in refractive error in both eyes), convergence insufficiency (an eye muscle condition in which both eyes do not easily turn inward to see at near distances), or eye tracking problems (e.g., difficultly following words across a page, smoothly following a moving object, or jumping from one object to another), among others.
Strabismus is a condition in which there is a misalignment of the eyes, such that one eye constantly or intermittently turns in (esotropia), out (exotropia), up, or down as the other eye looks straight ahead (Hatt and Gnanaraj, 2013). As a result of the misalignment, a person’s eyes do not fixate on the same object in space, and two different signals are sent to the brain. The amount of eye turn, the frequency of the eye turn, and the level of stereoacuity (sensory fusion of images) affects the severity of the strabismus (Hatt and Gnanara, 2015). Strabismus typically will not improve without intervention, which may involve refractive correction, patching, surgery, or pharmacological treatment (PEDIG, 2006).
Amblyopia, also referred to as “lazy eye,” is a neurological disorder in children, in which reduced vision in one or both eyes occurs due to abnormal interaction or lack of a clear image (Barrett et al., 2013; Pascual et al., 2014). To develop normal vision, both eyes must receive a clear, single image from both eyes. If one of the images is less clear, then the brain may compensate by inhibiting or suppressing input from the weaker eye, which can eventually result in decreased vision in that eye. Amblyopia can cause persistent deficits in cortical processing, even after normal input to the
brain is restored (Hamm et al., 2014). Treatments for amblyopia generally include correcting the underlying condition and reducing or eliminating the suppressive effects of the dominant eye through patching or pharmaceuticals (PEDIG, 2012), although ongoing studies are investigating the effects of refractive correction alone or different combinations of treatments to sustain long-term outcomes for different age groups (Cotter et al., 2014; PEDIG, 2006).
A number of population-based studies provide data on the prevalence of amblyopia and strabismus among children in the United States. The prevalence of amblyopia ranges from 0.8 percent to 2.6 percent in children ages 30 to 71 months, and the prevalence of strabismus ranges from 2.1 percent to 3.5 in children ages 6 to 71 months (Friedman et al., 2009; McKean-Cowdin et al., 2013; MEPEDS, 2008). The Baltimore Pediatric Eye Disease Study (BPEDS) examining white and African American children found a higher rate of strabismus among non-Hispanic white children (3.3 percent) compared to African American children (2.1 percent). The prevalence of amblyopia was also higher in non-Hispanic white children (1.8 percent) compared to African American children (0.8 percent) (Friedman et al., 2009). Strabismus was more prevalent in older children than in younger children, whereas amblyopia prevalence varied little within the narrow age range examined (i.e., 30 to 71 months). Data from the Multi-Ethnic Pediatric Eye Disease Study (MEPEDS) found similar rates of strabismus (3.2 percent and 3.5 percent, respectively) and amblyopia (1.8 percent) in white and Asian children (McKean-Cowdin et al., 2013). Among African American and Hispanic children participating in the same study, the prevalence rate of strabismus was similar (2.5 percent and 2.4 percent, respectively), but a significantly higher rate of amblyopia was found among Hispanic children (2.6 percent) compared to African American children (1.5 percent) (MEPEDS, 2008). Table 2-9 provides a summary of these findings.
Data on the prevalence or incidence of adult-onset strabismus are limited. One study based on claims data from Medicare fee-for-service beneficiaries found a 0.68 percent prevalence rate of adult-onset strabismus and increased with age and specific comorbidities for the period 2008 to 2010 (Repka et al., 2013). The prevalence of adult-onset strabismus also varies by geography with a significantly higher prevalence in the Southern region. Another study, including individuals ages 19 and older residing in Olmstead County, Minnesota, found that the annual incidence rate for adult-onset strabismus was 54.1 cases per 100,000 people and the lifetime risk of adult-onset strabismus was 4 percent after adjusting for age and gender (Martinez-Thompson et al., 2014). The study also found that the risk of developing adult-onset strabismus was similar for men and women and that the incidence peaked during the eighth decade of life. The characteristics
TABLE 2-9 Prevalence of Amblyopia and Strabismus Among Children by Race/Ethnic Group (in percent)
| Study | Race/Ethnic Group | Prevalence of Amblyopia (children ages 30–71 months) | Prevalence of Strabismus (children ages 6–71 months) |
|---|---|---|---|
| Friedman et al., 2009 (BPEDS) | Non-Hispanic white | 3.3 | 1.8 |
| African Americans | 2.1 | 0.08 | |
| McKean-Cowdin et al., 2013 (MEPEDS) MEPEDS, 2008 | Non-Hispanic white | 3.2 | 1.8 |
| Asian | 3.5 | 1.81 | |
| African Americans | 2.5 | 1.5 | |
| Hispanics | 2.4 | 2.6 |
NOTE: BPEDS = Baltimore Pediatric Eye Disease Study Group; MEPEDS = Multi-Ethnic Pediatric Eye Disease Study Group.
SOURCES: Friedman et al., 2009; McKean-Cowdin et al., 2013; MEPEDS, 2008.
of the population studied and the type of provider records included in the study limit the generalizability of study results.
Risk Factors for Amblyopia and Strabismus
Amblyopia is typically a diagnosis of exclusion. When no other organic reason exists for observed symptoms, certain amblyogenic factors—the most common are strabismus, anisometropia, and deprivation (e.g., obstruction due to a cataract or drooping of the eyelid because of paralysis or a congenital condition)—suggest amblyopia (Flynn and Cassady, 1978; Hamm et al., 2014; Kemper et al., 2004). Studies in the United States have found that strabismus and significant refractive error (e.g., ansiometropia) are risk factors for unilateral amblyopia, whereas bilateral astigmatism and bilateral hyperopia increase the risk of developing bilateral amblyopia (Pascual et al., 2014; Tarczy-Hornoch et al., 2013).
Risk factors for strabismus identified through MEPEDS and BPEDS and other studies include maternal smoking throughout pregnancy, prematurity, and hereditary factors (Cotter et al., 2011; Maconachie et al., 2013; Torp-Pedersen et al., 2010). However, a more recent study of risk factors for strabismus in young children in Singapore, found no associations between strabismus or amblyopia and prematurity, maternal age, or maternal smoking (Chia et al., 2013). Other risk factors for strabismus in children include cerebral palsy, Noonan syndrome, Prader-Willi syndrome, and other neurological disorders (Cotter et al., 2011; Shah and Patel, 2015). Childhood hyperopia is also a well-established risk factor for certain types of strabismus (Cotter et al., 2011; von Noorden and Campos, 2002).
Adult-onset strabismus is generally linked to another condition, such as traumatic eye injury, thyroid eye disease, tumors, stroke, surgical procedures, cranial nerve palsies, or other neurologic disease and residual childhood strabismus. Martinez-Thompson and colleagues (2014) found that adult-onset strabismus was more likely to result from a paralytic disorder in a geographically limited study of residents of Olmstead County, Minnesota.
Cataracts
A cataract is a treatable condition that occurs when the lens of the eye becomes cloudy or discolored due to a pathological clumping of proteins within the lens (NEI/NIH, 2010d). Cataracts can occur in one or both eyes. Symptoms may include cloudy or blurred vision, color fading, glare, poor night vision, double vision. Frequent prescription changes may also signal developing cataracts (NEI/NIH, 2009). Cataracts vary by type18 and in severity—not all require immediate action or the same type of intervention, depending on the stage of development. Eventually, cataracts worsen until subsequent vision impairment interferes with day-to-day life. Surgical removal of the lens is the only cure for cataracts, but regular monitoring by an eye care professional and updating one’s prescription glasses may be sufficient for early cataracts.
In adults, cataract is the most common ocular diagnosis after refractive error, and it accounts for the largest proportion of vision impairment in adults over age 40 (NEI/NIH, 2010d). At the turn of the past century, 20.5 million Americans were diagnosed with a cataract in at least one eye; that number is projected to hit more than 33.6 million in the over-40 age group by 2045 (Congdon et al., 2004b; Wittenborn and Rein, 2016). Cataracts are rare in children, although congenital cataracts may be present upon birth, in which case they are usually surgically removed upon diagnosis.
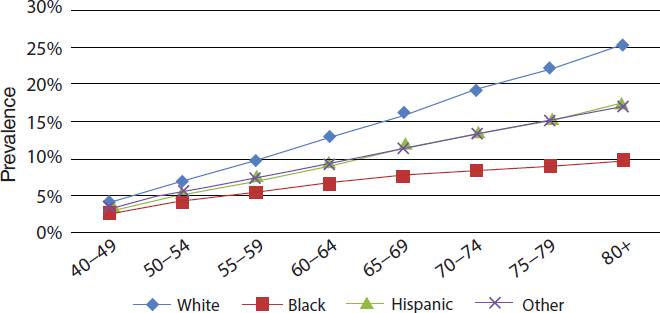
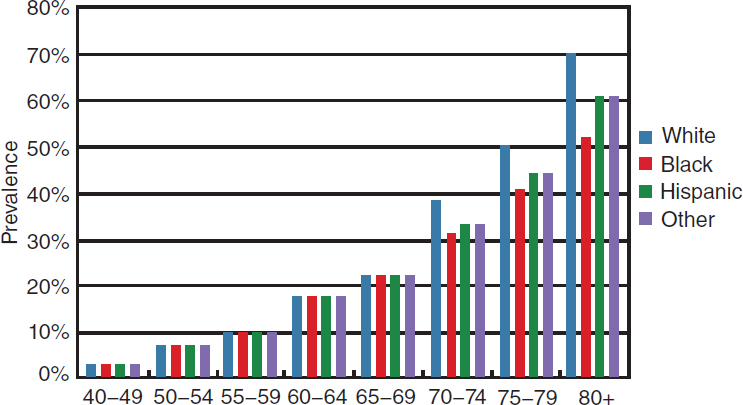
The burden of cataract increases dramatically with age for all races and ethnicities, and prevalence rates are higher for women than men (Congdon et al., 2004b; NEI/NIH, 2010d; Prevent Blindness, 2012a). Overall prevalence rates increased from 2.5 percent for people ages 40 to 49, to 19.4 percent for those ages 60 to 69, and 42.2 percent of individuals ages 70 to 79 (Prevent Blindness, 2012d). Studies consistently report higher prevalence rates and numbers of individuals with cataracts among older white populations. Figure 2-10 illustrates how cataract prevalence rates are similar
___________________
18 Nuclear sclerotic cataract involves a clouding or yellowing of the center of the lens, which progresses to hardening of the lens. A cortical cataract occurs when areas of white cloudiness develop along the outer edges of the lens, progressively moving inward. Posterior subcapsular cataracts begin as a small, cloudy, or opaque area on the back of the lens.
SOURCE: NEI/NIH, 2010d.
across all racial and ethnic groups until age 70, after which the prevalence rates begin to increase faster for whites, followed by Hispanics, other races and ethnicities, and blacks.
Despite having lower prevalence rates of cataracts, minority populations are more likely to have vision impairment from untreated cataracts. For example, adult African American participants in the Baltimore Eye Survey were five times as likely as whites to have unoperated “senile” cataracts (Sommer et al., 1991; Zambelli-Weiner et al., 2012). The study also found that among one-third of African Americans under age 70 were blind because of unoperated cataracts (Sommer et al., 1991). A more recent study examined disparities in necessary cataract surgery for whites and African Americans ages 65 and older in the state of Florida. Shahbazi and colleagues (2015) found that African Americans were less likely than whites to have cataract surgery (cataract surgery rates were 7.9 percent for African American males, 6.2 percent for African American females, 12.1 percent for white males, and 10.5 percent for white females). In the Los Angeles Latino Eye Study population, 29.9 percent of Latino/Hispanic participants who needed cataract surgery had not undergone the procedure (Richter et al., 2009). NHANES data consistently show lower rates of cataract surgery among non-Hispanic blacks than among whites; cataract surgery rates for
Mexican Americans, on the other hand, are similar to whites, even after age- and sex-standardization of the data (Zhang et al., 2012).19
Common Risk Factors for Cataract
Although traumatic eye injury, eye surgery, and ultraviolet (UV) radiation exposure are all well-established risk factors for developing cataracts, the aging process is the primary cause of most cataracts (Glynn et al., 2009). The link between UV exposure and cataracts has been documented (McCarty and Taylor, 2002), but more research is emerging on the biochemical damage done by UV exposure, even to young human lenses (20 to 36 years), leading to formation of cataracts earlier in life (Linetsky et al., 2014; McCarty et al., 2001). The purported associations of cataracts with smoking, consumption of alcohol, and physical activity have been disputed, with studies arriving at contradictory or inconclusive results (Glynn et al., 2009; Tan et al., 2008; Ye et al., 2012). The confusion may be partly due to differences among nuclear, cortical, and posterior subcapsular cataracts, each of which possesses a unique set of risk factors (Chang et al., 2011; Mukesh et al., 2006; Williams, 2009). A meta-analysis by Ye and colleagues (2012b) concluded that there was an association of smoking with age-related cataract: current smokers are at greater risk than past smokers, and those who ever smoked are more at risk than those who never smoked. A recent prospective cohort study found a dose–response effect of smoking on the development of cataracts in men (Lindblad et al., 2014), complimenting an earlier study that had observed the same effect in women (Lindblad et al., 2005).
The association between obesity and cataracts has been reported in several epidemiological studies, although the findings are not consistent (Cheung and Wong, 2007; Hiller et al., 1998; Pan and Lin, 2014). Compared to nuclear cataract, cortical and posterior subcapsular cataracts (in particular) have been most consistently associated with obesity (Cheung and Wong, 2007; Pan and Lin, 2014). Obesity is associated with glucose intolerance, insulin resistance, diabetes, hyperlipidemia, and hypertension (Feingold and Grunfeld, 2000; George et al., 2015; Yu, 2014), which are all considered to be risk factors for cataract formation; however, the primary role of these factors in cataract formation is less clear (Cheung and Wong, 2007; Leske et al., 1999; Park and Lee, 2015; Yu et al., 2014). Increased
___________________
19 According to NHANES III data, the rates of cataract surgery were 16.4 percent among African Americans, 19.3 percent among whites, and 20.4 percent among Mexican Americans; data from the NHANES 2005–2008 show the rates of cataract surgery were 13.5 percent among African Americans, 18.4 percent among whites, and 16.4 percent among Mexican Americans (Zhang et al., 2012).
physical activity, such as walking and biking, has been associated with a decreased risk of cataracts (Williams, 2009; Zheng Selin et al., 2015). Research also shows that heavy alcohol consumption is correlated with an increased cataract risk, although some studies have found that, after controlling for smoking status, the risk of heavy drinking is no higher than for moderate drinking (Gong et al., 2015; Kanthan et al., 2010). The literature does not clearly establish whether increasing dietary intake of specific vitamins or nutrients (e.g., supplementation with lutein or zeaxanthin) can reduce cataract formation (Chew et al., 2013). Other potential risk factors for cataracts, such as arthritis, the extended use of calcium channel blockers, thyroid hormone use, and corticosteroid use are in early stages of investigation. More research is needed to better understand the association and possible mechanism between weight (and associated chronic conditions), physical activity, diet, and cataract formation.
Eye Injuries and Damage to the Visual System
Injury to the visual system—including abrasions, chemical burns, lacerations, orbital wall fractures, and damage to the visual processing centers of the brain—are common. Each year, more than 2.5 million eye injuries occur in the United States, resulting in nearly 50,000 people permanently losing part or all of their vision (Owens and Mutter, 2011). Many eye injuries are preventable, especially in occupational and sports-related settings. In fact, a few studies have suggested that as much as 90 percent of sports-related eye injuries in particular populations can be prevented by wearing protective eyewear (Harrison and Telander, 2002; Mishra and Verma, 2012). Channa and colleagues (2016) analyzed nationally representative data from 2006 to 2011 and found that, among nearly 12 million eye-related emergency department visits, 13.7 percent were for corneal abrasions, 7.5 percent were related to a foreign body on the external eye, 2.8 percent were for contusion of the eye and orbital tissues, and 2.3 percent were related to lacerations of eyelids or skin near the eye. Among children and adolescents ages 0 to 5, 15.4 percent presented with corneal abrasions, contusions of the eye and orbital structures, laceration of the eyelid and the periocular area, open wounds of the ocular adnexa, and closed fractures of the orbital floor (Channa et al., 2016). Among children ages 6 to 12 and adolescents ages 13 to 18, 23.2 and 26.1 percent, respectively, visited the emergency department each year with eye injuries (Channa et al., 2016).20
___________________
20 Figures derived from Table 2. Total percentage among patients ages 0–5: 1.9 percent + 6.1 percent + 4.4 percent + 2.9 percent + 0.1 percent = 15.4 percent. Total number among patients ages 0–5: 36,383 + 114,521 + 83,113 + 54,339 + 1,377 = 289,733. Total percentage among patients ages 6–12: 4.7 percent + 11.4 percent + 4.0 percent + 2.6 percent + 0.5 percent
Occupational Eye Injuries
About 2,000 work-related eye injuries caused by blunt, sharp, or chemical trauma require medical treatment daily in the United States, and one-third of them are treated in hospital emergency departments (CDC, 2007). This translates to approximately 250,000 emergency room visits each year. In 2012, more than 20,000 eye injuries in private industry required time off from work (BLS, 2012), and eye injuries in general “cost an estimated $300 million a year in lost productivity, medical treatment, and worker compensation” (Dang, 2015). Common causes of workplace eye injuries include flying objects (such as bits of metal, wood, or glass), tools, particles, chemicals, radiation, blood-borne pathogens, and other hazards.
Data from the 2002 National Health Interview Survey (NHIS) reveal an overall lifetime prevalence of 4.4 percent for work-related injuries among adults 18 years and older (Forrest and Cali, 2009). The study also found the highest prevalence rate of eye injury (6 percent) among people between the ages of 45 and 54, but work injuries occurred at every age of 18 and older (Forrest and Cali, 2009). Another study found that people ages 20 to 34 were at greatest risk for work-related eye injury visits to emergency departments (Xiang et al., 2005). Men have four to five times the number of workplace injuries than women (Forrest and Cali, 2009; Luo et al., 2012). For instance, data from the 2005–2007 Behavioral Risk Factor Surveillance System found that the lifetime prevalence of workplace eye injury was significantly higher for men (13.5 percent) than for women (2.6 percent), although socioeconomic status was only associated with lifetime risk for men (Luo et al., 2012).
Workplace eye injuries vary by type of industry and are more likely to affect populations engaged in certain occupations. The more risky occupations include those in precision production, transportation, farming, mining, and construction (Forrest and Cali, 2009). For example, construction workers experience the highest prevalence of eye injury (CDC, 2007). Health care workers, laboratory staff, janitorial workers, animal handlers, and other workers are also at risk for infectious diseases via eye exposure (e.g., touching the eye with contaminated fingers, infected blood splashes, or respiratory droplets) (CDC, 2007). A 2009 study found that workers who are more likely to have eye injuries have less than a high-school education, are non-Hispanic whites, are self-employed, and live in the Midwest region (Forrest and Cali, 2009). Relatedly, another study found that men with no more than a high school education (compared with having more than a high school
___________________
= 23.2 percent. Total number among patients ages 6–12: 44,702 + 108,067 + 37,956 + 24,777 + 4,588 = 220,090. Total percentage among patients ages 13–18: 5.5 percent + 12.4 percent + 3.8 percent + 2.6 percent + 1.8 percent = 26.1 percent. Total number among patients ages 13–18: 48,555 + 109,350 + 33,590 + 22,667 + 15,783 = 229,945.
education) and men with an annual household income less than $15,000 (compared with greater than $50,000) were more likely to experience a lifetime workplace eye injury, after adjusting for age, race and ethnicity, eye care insurance, health status, and risk-taking behaviors (Luo et al., 2012).
Sports-Related Injuries
Estimates suggest that between 40,000 and 600,000 documented sports-related eye injuries occur in the United States every year (Goldstein and Wee, 2011), and approximately 13,500 result in a permanent loss of sight (Mishra and Verma, 2012). The leading cause of blindness in children is eye injury (NEI/NIH, 2016a). High-risk, moderate-risk, low-risk, and eye-safe activities accounted for 55, 27, 16, and 3 percent, respectively, of 208,517 sports-related eye injuries treatment in emergency departments from 2001 to 2009 (Kim et al., 2011). High-risk sports include air rifle, paintball, racquet sports, lacrosse, hockey, and boxing (Mishra and Verma, 2012). Moderate-risk activities include badmitton, tennis, volleyball, football, and fishing; swimming, diving, skiing, wrestling, and bicycling are considered low risk (Mishra and Verma, 2012). Although data suggest that high- and moderate-risk eye injuries decreased from 2001 to 2005, Kim and colleagues (2011) found that rates began to increase between 2007 and 2009. Beyond the use of protective eye injury, protective sunwear can reduce the risk of damage to the eye from UV radiation.
Eye Issues Associated with Traumatic Brain Injury
Traumatic brain injury (TBI), including concussions, results from “a bump, blow, or jolt to the head or a penetrating head injury” that causes local or diffuse disruption of normal brain function (CDC, 2016a). The CDC states that in 2010 there were approximately 2.5 million emergency department visits related to TBI, and that from 2006 to 2010, major identifiable causes of TBI included falls (40.5 percent), motor vehicle crashes (14.3 percent), and assaults (10.7 percent) (CDC, 2016e). Patients with TBI may experience a range of visual symptoms and disorders, including problems with visual acuity, visual fields, oculomotor function, among others (Brahm et al., 2009; Cockerham et al., 2009; Goodrich et al., 2013; Magone et al., 2014; Rosner et al., 2016). A recent study of 100 adolescents ages 11 to 17 examined for concussion, a mild form of TBI, found that 69 percent had one or more of the following disorders: accommodative disorders (51 percent), convergence insufficiency (49 percent), and saccadic dysfunction (29 percent) (Master et al., 2016).
Vision impairment as a result of TBI during active military duty is becoming a growing problem. The U.S. Department of Defense reports
that more than 347,000 service members have been diagnosed with TBI since 2000 (Defense and Veterans Brain Injury Center, 2016). Brahm and colleagues (2009) reported that, among combat-injured military personnel with TBI who were inpatients at a polytrauma rehabilitation center, the prevalence of vision impairment (20/100 or worse visual acuity) and visual field defects was 13 percent and 32.3 percent, respectively. An observational study of 103 patients at a Veterans Affairs polytrauma network site found that 76 and 75 percent of service members with polytrauma and TBI, respectively, reported visual symptoms (Stelmack et al., 2009). Goodrich and colleagues (2013) found that greater than 65 percent of combat-injured military personnel with blast-related and non-blast-related TBI report vision problems, such as difficulty reading and sensitivity to light. Similarly, a retrospective study of 31 patients found that long-term visual dysfunction, despite good distance acuity, is common even years after blast-induced mild traumatic brain injury (Magone et al., 2014).
Infections and Vision Impairment
The eye and vision health of children and adults can be compromised by infection, including eye infections, systemic infections that can potentially affect the development or function of the visual system, and nosocomial infections following eye surgery. For example, exposure to certain viruses and bacteria in utero can have lifelong effects on the developing visual system, especially in the absence of effective treatments or vaccinations. No single database tracks all potentially vision-threatening infections in the United States. Instead, data are usually available by specific infections, with varying availability of eye and vision health outcomes. This section covers some of the more common eye and systemic infections and is not intended to provide a comprehensive listing of all potential infectious agents. Nosocomial infections, such as endophthalmitis, are not covered here but are considered later in this chapter when discussing treatment.
Fetal and Neonatal Infections
During the first trimester of pregnancy, the visual system undergoes significant development. The recent outbreak of the Zika virus and its potential to affect the developing fetus has underscored the need to consider the effects of maternal infections on children’s health, including development of the visual system (Valentine et al., 2016). Historically, several maternal infections have been associated with interference in normal ocular development when the fetus is exposed during the first trimester. Maternal infections known to be teratogens (i.e., agents that have the potential to cause birth defects) are referred to as the TORCH constellation.
TORCH refers to toxoplasmosis, other (syphilis, varicella-zoster, parvovirus B19), rubella, cytomegalovirus (CMV), and herpes infections (Stegmann and Carey, 2002). Other ocular teratogens include, but are not limited to, alcohol, opioids, benzodiazepines, cocaine, thalidomide, anticonvulsants, vitamin A, radiation, and diabetes mellitus (Tandon and Mulvhill, 2009).
Some sexually transmitted diseases, along with other viruses or bacteria, can be passed from a mother to a fetus, which can lead to vision-threatening conditions. Neonatal conjunctivitis, may cause red eyes, swollen eye lids, and discharge of pus. Usually a minor eye infection, in some cases conjunctivitis can lead to scarring, eye damage, or vision loss. The most common neonatal infection is chlamydia, which presents as a milder case of conjunctivitis and requires oral antibiotic treatment (CDC, 2015a, 2016b). Gonococcal conjunctivitis can destroy the corneal barrier and rapidly damage the eye; intravenous antibiotics are usually given as treatment (CDC, 2016b). Herpes simplex viral neonatal conjunctivitis presents as corneal epithelial involvement and periocular vesicles on the skin (CDC, 2016b). Many forms of neonatal conjunctivitis can be treated by eye drops or ointment (commonly required by state law), or oral and intravenous antibiotics.
Eye Infections in Children and Adults
Eye infections can be caused by many different organisms, including bacteria, viruses, amoeba, and fungi (CDC, 2015b). Viral and bacterial conjunctivitis are highly contagious and may result from a number of common agents, including adenovirus, rubella, measles, herpes, Staphylococcus aureus, Streptococcus pneumoniae, among others (CDC, 2016c). Data from the National Ambulatory Medical Care Survey indicated that Americans made more than 4 million visits to ambulatory physicians for bacterial conjunctivitis in 2005 (Smith and Waycaster, 2009). Approximately 70 percent of patients with acute conjunctivitis present to primary and urgent care providers, which accounts for 1 percent of all primary care office visits (Kaufman, 2011; Shields and Sloane, 1990). Adenoviruses account for 65 to 90 percent of cases of viral conjunctivitis (O’Brien et al., 2009).
Bacterial conjunctivitis is another common cause of acute conjunctivitis. In a series of patients presenting with acute conjunctivitis in an inner city hospital, conjunctival scrapings indicated that 36 percent of patients had viral conjunctivitis and 40 percent had bacterial conjunctivitis (Fitch et al., 1989). The most common bacteria noted in adults are staphylococcal species, Streptococcus pneumoniae, and Haemophilus influenzae, whereas in children, Haemophilus influenzae is more common (Azari and
Barney, 2013). Among children in particular, Haemophilus influenzae can lead to orbital cellulitis, which can progress to meningitis. Keratoconjunctivitis secondary to herpes simplex is an important contributor to ocular pathology. Most commonly due to herpes simplex Type I, this potentially recurring infection can lead, if not appropriately treated, to either significant corneal pathology requiring corneal transplantation or corneal perforation leading to loss of the eye. Varicella zoster and herpes zoster are also associated with eye infections (Wu and Ariyasu, 1999). Chlamydial conjunctivitis, associated with the most common sexually transmitted disease in the United States, accounts for 1.8 to 5.6 percent of all cases of acute conjunctivitis (adults and infants) (Azari and Barney, 2013; CDC, 2016c).
Many ocular infections are associated with the use of extended wear contact lenses. Each year in the United States, approximately 1 million eye infections related primarily to keratitis, a fungal infection of the cornea, and contact lens infections account for estimated direct costs of $175 million (Collier et al., 2014). In severe cases, infectious keratitis can progress to corneal ulceration, which may lead to blindness if left untreated. The incidence of fungal keratitis is not known. Health care providers are not required to report cases to public health authorities, although public health departments, the CDC, and the U.S. Food and Drug Administration (FDA) have been involved in multi-state outbreaks (CDC, 2015c). However, as many as 40.9 million U.S. adults wear contact lenses, and 99 percent of 4,269 contact-lens wearers surveyed reported at least one contact lens–related hygiene behavior associated with an increased risk for eye infection or inflammation (Cope et al., 2015). This presents an opportunity to focus on hygiene in other health promotion activities to reduce the occurrence and risk of contact lens–related infections.
Diabetic Retinopathy
Diabetic retinopathy can occur when chronically high blood sugar levels from diabetes cause abnormal blood vessels to grow along the surface of the retina and into the eye. These fragile vessels can leak fluid or blood, resulting in blurred or spotted vision (NEI/NIH, 2012b). Diabetic retinopathy can progress through four stages of increasing severity: mild, moderate, severe, and proliferative (NEI/NIH, 2012b). The early stages of diabetic retinopathy usually have no symptoms. In some cases, scar tissue may form and contract, causing retinal detachment and potentially permanent vision loss. Left unchecked, diabetic retinopathy can also lead to diabetic macular edema (DME), a buildup of fluid in the macula of the retina, which can cause blurred vision.
In 2012, 29 million people in the United States were living with diabetes, and an additional 86 million adults were considered prediabetic (CDC, 2016d). These numbers are expected to grow, with one study predicting that as many as one-third of U.S. adults diagnosed with diabetes by 2050 (Boyle et al., 2010). In 2012, an estimated 208,000 children under age 20 were diagnosed with diabetes (CDC, 2014).
As cases of diabetes continue to rise in the United States, diabetic retinopathy has become the leading cause of new cases of blindness among U.S. adults ages 20 to 74 (CDC, 2011a). According to one study using data from NHANES 2005–2008, among persons ages 40 and older with diabetes, 28.5 percent had diabetic retinopathy and 4.4 percent had severe nonproliferative diabetic retinopathy, proliferative diabetic retinopathy, or clinically significant macular edema (Zhang et al., 2010). From 2010 to 2050, diabetic retinopathy is conservatively expected to rise from 7.7 million to 14.6 million among Americans ages 40 and older (NEI/NIH, 2010e). Diabetic retinopathy has been diagnosed in adolescents and patients as young as age 5 (Forlenza and Stewart, 2012). Although prevention and control of the underlying diabetes or prediabetes is crucial, additional treatments are available to help hold retinopathy and edema in check and slow the progression of vision loss.
In general, minority populations are more likely to develop diabetic retinopathy that whites in the United States (Lanting et al., 2005; Spanakis and Golden, 2013; Varma et al., 2016). Figure 2-11 shows that, among adults ages 40 and older in 2010, the prevalence of diabetic retinopathy by race and ethnicity was highest among Hispanics (8.0 percent), followed by blacks (5.4 percent), whites (5.1 percent), and other minorities (4.7 percent) (NEI/NIH, 2010e). Numerous studies have found diabetic retinopathy to be more common in men, citing differences in vascular and circulatory factors (Nittala et al., 2014; Varma et al., 2007; Zetterberg, 2016), although a recent study found no correlation after adjusting for metabolic and socioeconomic risk factors (Wong et al., 2008). A more limited number of studies have focused on age, specifically, as an independent risk factor, although the duration of diabetes in younger people is likely to exceed that of older people, increasing their risk for diabetic retinopathy.
Common Risk Factors for Diabetic Retinopathy
By definition, individuals with diabetic retinopathy have diabetes. Hyperglycemia, hypertension, and dyslipidemia (an abnormal amount of lipids) are associated with increased risk of all forms of diabetic retinopathy and are also modifiable (Nittala et al., 2014; Varma et al., 2007; Yau et al., 2012). Numerous studies have identified an increased duration of diabetes and insulin use as risk factors for developing diabetic retinopathy (Bertelsen
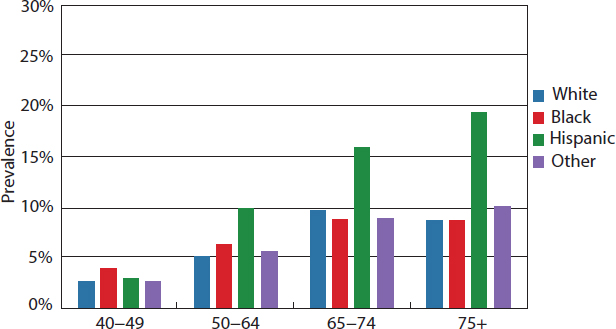
SOURCE: NEI/NIH, 2010e.
et al., 2013; Fong et al., 2004; Jee et al., 2013; Lim et al., 2008; Nittala et al., 2014). An earlier population-based study in southern Wisconsin of 1,370 diabetic patients also found that more severe diabetic retinopathy was associated with longer duration of the disease, younger age at diagnosis, higher systolic blood pressure, insulin use, and small body mass, among other factors (Klein et al., 2008).
In addition to being an independent risk factor for type 2 diabetes, obesity is also associated with systemic diseases, including hyperlipidemia and hypertension (Cusick et al., 2003; Feingold and Grunfeld, 2000; George et al., 2015; Haslam and James, 2005; Stratton et al., 2001; Tapp et al., 2003). Other possible mechanisms related to obesity for diabetic retinopathy include increased vasoproliferative factors (e.g., vitreous vascular endothelial growth factor [VEGF]), increased oxidative stress associated with high leptin levels, platelet dysfunction, and increased blood viscosity, all of which are common conditions in obesity (Anfossi et al., 2009; Miyazawa-Hoshimoto et al., 2003; Solerte et al., 1997). Thus, efforts to reduce the rates of obesity, diabetes, or other chronic conditions associated with increased risk of diabetic retinopathy, especially in children, may help reduce the risk of associated vision impairment.
Glaucoma
Glaucoma is a chronic condition that includes a group of eye disorders characterized by deterioration in the optic nerve or specific changes in the visual field. In most types of glaucoma, fluid buildup in the anterior
chamber of the eye causes increased intraocular pressure (IOP) that over time can damage the optic nerve, resulting in blindness. Glaucoma may occur in the absence of an increase in intraocular pressure. Initially individuals experience no pain and their vision remains normal. However, if glaucoma remains untreated, peripheral vision slowly deteriorates, and the vision field narrows progressively until it may seem as if a person is looking through a dark tunnel. Eventually, central vision disappears. In the United States, primary open-angle glaucoma (POAG) is the most common type of glaucoma. Unless otherwise noted, all discussions of glaucoma in this report refer to POAG.21
A 2010 estimate suggests that 2.7 million adults in the United States are affected by glaucoma, a number that is expected to rise to approximately 6.3 million individuals by 2050 (NEI/NIH, 2010i). Approximately 61 percent of glaucoma cases occur in women over age 40; in this age group, the prevalence rate of glaucoma in women and men is 2.2 percent and 1.6 percent, respectively (NEI/NIH, 2010i), although an earlier literature review found that men are more likely than women to have glaucoma after adjusting for age, race, year of publication, and study methods (Rudnicka et al., 2006). The prevalence of POAG increases with age and varies by race and ethnicity (Gordon et al., 2002; Varma et al., 2011). Prevalence is highest among African Americans (Gordon et al., 2002; Rudnicka et al., 2006), although Varma and colleagues (2011) found that Hispanics had comparable prevalence afer adjusting for age and gender. Figure 2-12 shows that the prevalence of glaucoma increases with age across all races and ethnicities, with the largest increases occurring for all racial and ethnic groups after age 80. Although overall prevalence rates are lower for the white population, white individuals still accounted for the majority of glaucoma cases (more than 66 percent) in 2010 (NEI/NIH, 2010i).
The severity of glaucoma and its effect on the eye is not uniform. One early study found that blindness from glaucoma was 6 to 8 times more common in African Americans than whites (Javitt et al., 1991). Another study found that visual impairment from glaucoma was 15 times more likely among African Americans than whites (Muñoz et al., 2000). A recent literature review concluded that older black populations tend “to present with more advanced disease at diagnosis” (Salowe et al., 2015,
___________________
21 In POAG, fluid in the anterior chamber cannot exit through the open angle between the iris and cornea, resulting in increased IOP. Acute angle-closure glaucoma occurs when the open angle between the iris and cornea is blocked, preventing drainage of fluid in the anterior chamber and resulting in suddenly increased IOP. Normal-tension or low-tension glaucoma occurs when IOP is not elevated, but the optic nerve is still damaged. Other types of glaucoma include angle-closed glaucoma, low-tension or normal-tension glaucoma, secondary glaucoma, pigmentary glaucoma, exfoliation glaucoma, and congenital or infantile glaucoma; these are not discussed in this section.
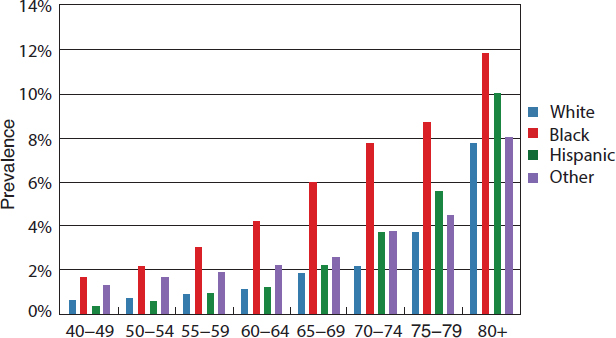
SOURCE: NEI/NIH, 2010h.
p. 3). Furthermore, race and ethnicity may interact with other risk factors to affect clinical presentation: white individuals diagnosed with glaucoma are more likely to be older yet also to have lower IOP (Fansi et al., 2009). Many studies have found that differences in surgical effectiveness vary by race and ethnicity (Taubenslag and Kammer, 2016; Wadwa and Higginbotham, 2005), although some studies have not and research is ongoing (Coleman et al., 2016a,b; Taubenslag and Kammer, 2016). More research is needed to understand the factors influencing glaucoma severity among different populations.
Common Risk Factors for Glaucoma
Certain physical and medical conditions are associated with increased risk of glaucoma. Physiological risk factors for developing glaucoma include an elevated IOP, greater cup-to-disc ratio, and thin central corneal measurement (Coleman and Miglior, 2008; Gordon et al., 2002). Neovascular glaucoma can result from poorly controlled diabetes mellitus (Kersey and Broadway, 2006; Sayin et al., 2015; Watkinson and Seewoodhary, 2008). Increased risk of glaucoma has also been associated with eye surgeries, eye injuries, and the use of steroid drugs in some people (Bojikian et al., 2015; Worley and Grimmer-Somers, 2011). Available evidence suggests there may be an association between glaucoma and obesity, diabetes, or smoking, but the evidence is inconsistent (Cheung and Wong, 2007; Chiotoroiu et al., 2013; Edwards et al., 2008; Geloneck et al., 2015; Karadag et al., 2012; Oh et al., 2005; Ramdas et al., 2011; Wang et al., 2012; Yoshida et al., 2014;
Zhao et al., 2015). Other risk factors include family history and genetic predisposition (Gordon et al., 2002; Salowe et al., 2015).
Finally, some genes or genetic mutations may pose a risk for glaucoma: according to the National Eye Institute (NEI), 15 genes have been identified as associated with glaucoma (NEI/NIH, 2016b). Investigators in the population-based Rotterdam Study reported a lifetime risk of glaucoma of 22.4 percent in patients with relatives who had glaucoma, compared to 2.3 percent among controls (Wolfs et al., 1998). Researchers have also identified genetic loci that are associated with congenital, developmental, juvenile-onset primary open-angle glaucoma, and familial normal-tension glaucoma (Fingert, 2011).
Age-Related Macular Degeneration
AMD is a progressive, chronic condition that affects the retina, with most vision loss occurring in later stages of the disease (Lim et al., 2012). In neovascular, or “wet,” AMD, damage to the macula is caused by fluid leaking from blood vessels that grow under the pigment epithelium in the retina. The extra fluid can cause the macula to bulge or lift up from its normal, flat position, thus distorting or destroying central vision. In geographical atrophy, or “dry,” AMD, damage to the macula is caused by the breakdown of light-sensitive cells in the macula and accounts for 20 to 25 percent of legal blindness from AMD (Girmens et al., 2012). AMD is usually classified as early, intermediate, or advanced. Early and intermediate forms of AMD account for 90 percent of all cases, but the remaining 10 percent of cases cause 88 percent of all AMD-related blindness (Bourla and Young, 2006). Vision-related symptoms of AMD include blurred vision, dark areas or distortion in central field of vision, and a loss of central vision, which can be severe and rapid. Although AMD affects only older populations, certain drugs and other inherited diseases can cause other forms of macular degeneration in children and adolescents such as Stargardt’s disease (DePaolis, 2014).
From 2000 to 2010, the number of U.S. adults ages 50 and older with AMD increased from 1.75 million to 2.07 million; by 2050 this number is expected to reach 5.44 million (NEI/NIH, 2010c). In 2004, when the Eye Diseases Prevalence Research Group first estimated the prevalence of AMD, it determined that 1.75 million U.S. adults ages 40 and older had “wet” AMD and another 7 million were at substantial risk of developing AMD (Friedman et al., 2004a).
Increasing age, white race, and female gender are associated with a higher risk of AMD. In the U.S. population ages 50 and older, women comprised 65 percent of the 2.1 million cases of late AMD in 2010 (NEI/NIH, 2010c). Figure 2-13 illustrates the dramatic rise in the prevalence rate
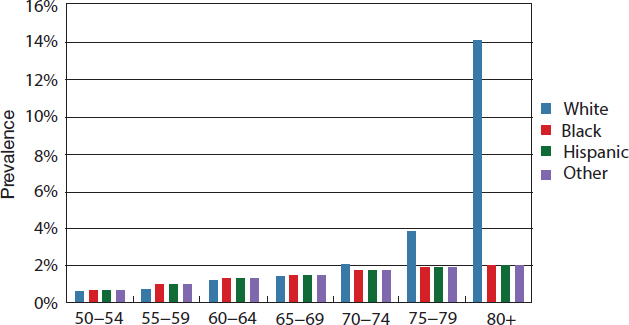
SOURCE: NEI/NIH, 2010c.
of AMD after age 75 for the white population. The NEI reports an overall AMD prevalence rate of 2.5 percent for white persons and 0.9 percent for African American, Hispanic, and other minority populations ages 50 and older (NEI/NIH, 2010c). An earlier study found advanced AMD occurring in 11.9 percent and 16.4 percent of white men and white women ages 80 and older, respectively, compared with 1.56 percent and 2.44 percent among African American men and women in the same age group (Friedman et al., 2004b). A report from LALES found a prevalence rate for advanced AMD of 0 percent among Latinos ages 40 to 49 and 8.5 percent among those ages 80 and older (Varma et al., 2004b). Another study of any type of AMD in a 75- to 84-year-old group found prevalence varying from a low of 7.4 percent in African Americans to 15.8 percent in whites and Chinese (Klein et al., 2006). A 2004 study estimated that age-related macular degeneration accounted for approximately 54.4, 14.3, and 4.4 percent of blindness in white, Hispanic, and African American persons, respectively (Congdon, 2004a).
Common Risk Factors for AMD
A number of environmental, behavioral, genetic, and other physical conditions have been associated with the risk of AMD. By definition, increased age is the most significant risk factor for AMD, but race and ethnicity and family history are also correlated with increased prevalence (NEI/NIH, 2013). Multiple genes have been identified that appear to affect
the risk of AMD development (Mousavi and Armstrong, 2013). One study found 10 different genetic loci associated with the progression of AMD from early to advanced stages of the disease (Seddon et al., 2015). In fact, recent studies have suggested that several of the genetic risk factors for AMD implicate a malfunctioning immune system (Mousavi and Armstrong, 2013; Nussblatt et al., 2014).
Smoking is one of the most consistently identified modifiable risk factors (Clemons et al., 2005; Shim et al., 2016). Less is known about the relationship between the risk of AMD and physical activity levels (Gopinath et al., 2014) or alcohol consumption (Adams et al., 2012; Chong et al., 2008). Two recent meta-analyses found a positive and inverse association between prevalent AMD and hyperopia and myopia, respectively (Lavanya et al., 2010; Pan et al., 2013). Pan and colleagues (2013) further found that no association existed between hyperopia or myopia and late AMD and called for further longitudinal research and study of the related pathophysiological mechanisms.
A few studies have found an association between obesity and AMD (AREDS Research Group, 2005; La Torre et al., 2013; Schaumberg et al., 2001). High body mass index, lens opacities, and use of some medications (i.e., antacids and thyroid hormones) are positively associated with advanced AMD, while arthritis has been associated with mild and moderate forms of AMD (Clemons et al., 2005). However, the underlying mechanisms for these associations are under investigation (Choi et al., 2013; Colak et al., 2012). Other proposed risk factors for AMD, such as hypertension and hyperlipidemia, are also associated with obesity (Cheung and Wong, 2014; Dasch et al., 2005; Feingold and Grunfeld, 2000; Hyman and Neborsky, 2002; Kyrou et al., 2000; Yu, 2014). Hypertension has been correlated with both advanced and intermediate AMD, but not early stages of the disease (AREDS Research Group, 2000). One study found synergistic effects among small groups of risk factors, such as obesity and alcohol, obesity and smoking, alcohol and high cholesterol, high cholesterol and smoking, and smoking and family history (La Torre et al., 2013).
The literature includes a number of studies examining the association between diet and the risk of AMD. Vitamins and minerals with antioxidant functions (e.g., vitamins C and E, carotenoids [lutein, zeaxanthin, β-carotene], and zinc) and compounds with anti-inflammatory properties (omega-3 fatty acids, docosahexaenoic acid) are associated with a lower risk of AMD (Rasmussen and Johnson, 2013). The association between vitamin D and A is controversial, with some studies finding a significant association between higher levels of blood 25-hydroxyvitamin D and an increased risk of AMD (Kim et al., 2014; Wu et al., 2014), and other studies finding no statistically significant association (Cougnard-Gregoire et al., 2015). One study documented a dose–response relationship between an increased prevalence
of AMD and self-reported supplementary calcium consumption (more than 800 mg/d of supplementary calcium) (Kakigi et al., 2015).
Rarer and Inherited Eye Diseases
Although this chapter has focused on the conditions that affect the greatest number of persons in the United States, many other eye diseases can severely affect the eye and vision health of smaller numbers of individuals. Genetic studies have become a major focus of research programs, including those at the National Institutes of Health (NEI/NIH, 2012d). Researchers have found that about 5 percent of the human population carries genetic mutations that can cause inherited retinal diseases (Haddrill, 2016). In inherited retinal degenerations linked to recessive genes, gene therapy could possibly be used to replace a deficient gene and restore function. In other disease states, such as neovascular age-related macular degeneration or diabetic retinopathy, gene therapy has the potential to alter the production or function of existing cell proteins, such as vascular endothelial growth factor, which trigger conditions in the eye that can lead to vision loss (Campbell et al., 2016). Continued identification of molecular markers has also allowed researchers to identify individual classes of cells in the eye and may contribute to a better understanding of cell development and fate, which in turn has implications for future treatments for all who are at risk of vision impairment (NEI/NIH, 2012d; see, e.g., Chen et al., 2013). In addition to gene therapy, the use of embryonic or resident stem cells could lead to treatments that involve re-growing diseased cells or reprogramming existing cells within the eye to restore function. Some studies have identified resident stem cells that exist in the adult eye and that could potentially be activated to replace damaged or distressed cells within the eye (Mimeault and Batra, 2008, 2012; Ramsden et al., 2013).
CHARACTERIZING VISION IMPAIRMENT FOR POPULATION HEALTH
Understanding the etiology of eye and vision health is important because it highlights which types of strategies are more likely to affect the greatest number of people over the longest time span. To this end, it can be helpful for public health professionals, clinicians, communities, and individuals to think about vision loss and impairment in terms of four categories:
- Preventable (e.g., vision impairment that can potentially be prevented, such as that from untreated amblyopia and strabismus in children, acute eye injuries, infection, and diabetic retinopathy)
- Modifiable (e.g., vision impairment from diseases and conditions for which available treatments can delay onset or slow the progression of vision loss, such as glaucoma or diabetic retinopathy)
- Correctable (e.g., vision impairment from diseases and conditions for which available treatments can eliminate or correct for existing vision impairment, such as uncorrected refractive error and cataracts)
- Uncorrectable (e.g., permanent vision impairment that cannot be improved through use of existing treatments, but whose impact on functionality, productivity, and independence can be lessened through access to vision rehabilitation services and reasonable accommodations)
Many diseases and conditions may fall into more than one category, based on the stage of a disease or condition or the severity of vision impairment. The examples provided below are meant to encourage discussions that meld public health and clinical approaches to eye and vision health and are not meant to be a comprehensive or exhaustive assessment of available treatments or their relative effectiveness. Subsequent chapters provide more in-depth discussion and specific examples of strategies to prevent, correct, and modify vision impairment.
Preventable Vision Impairment
As a general rule, prevention is the ultimate goal in a population health approach. In the case of eye and vision health, preventing injury, infection, and underlying chronic disease could have substantial effects on promoting eye and vision health before eye care is needed. Acute eye injuries may be preventable through better adherence to regulations and policies in workplace, school, and recreational settings that encourage the use of protective eyewear. Training employees to wear and properly don and doff personal protective equipment (such as eyewear), as required by the Occupational Safety and Health Administration (DOL, 2016), can prevent many eye injuries and reduce the impact on workers’ health, finances, and productivity. Similarly, the American Academy of Ophthalmology, the American Academy of Pediatrics, the American Optometric Association, and Prevent Blindness all strongly recommend protective eyewear for all participants in sports for which there is a risk of eye injury (AAP, 2011; AOA, 2016). Preventing vision problems related to TBI will require more than using protective eyewear and may involve strategies to reduce concussions, falls, and motor vehicle accidents (CDC, 2016d; Master et al., 2016). Given the number of U.S. service members who experience TBI, it is also important to
continue to follow the eye and vision health of active, reserve, and retired service members.
Preventing communicable diseases (including sexually transmitted diseases), ensuring adherence to vaccination schedules, and promoting proper hygiene can reduce the risk of vision-threatening infections. In general, prenatal screening and preventive treatment with antibiotics shortly after birth is the first line of defense against many sight-threatening infections in babies (CDC, 2016b). The risk of eye infections from contact lens can be reduced through proper hygiene (Cope et al., 2015). Noncompliance with recommended hygiene practices may account for the higher risk of corneal infiltrative and inflammatory events in the 15- to 25-year-old group (Chalmers et al., 2011). In the absence of new materials and modalities to reduce the risk of infection associated with contact lens wear, other health promotion activities to promote proper hygiene could help mitigate the risk of keratitis among contact lens wearers.
Efforts to stem the growth of non-vision-related chronic diseases can also directly and indirectly affect eye and vision health. Preventive treatment for nonproliferative diabetic retinopathy involves controlling diabetes through the maintenance of a healthy weight and the management of blood sugar, blood pressure, and blood cholesterol levels (NEI/NIH, 2012c). U.S. studies have found that tighter blood glucose control helps improve diabetic retinopathy and reduce the progression of diabetic retinopathy to the more proliferative and damaging form (ACCORDION, 2016; Klein et al., 2008). While progress has been made in improving other diabetes quality-of-care markers, improvements have not been made in access to annual dilated eye exams. According to data from the Dartmouth Atlas, 85 percent of diabetic Medicare enrollees achieved quality measures for hemoglobin A1c levels and lipid profiles in 2012, whereas only 67 percent had an eye exam (Dartmouth Atlas of Health Care, 2012).
Chronic disease can also increase the risk of complications for treatments of specific eye conditions, such as cataracts (Stein et al., 2011a). For example, among individuals with diabetes, cataract surgery can accelerate the development of diabetic retinopathy and increases the risk of macula edema (Hong et al., 2009; Pollreisz and Schmidt-Erfurth, 2010). Given that diabetes, the ultimate risk factor for developing diabetic retinopathy, is preventable, public health efforts to reduce diabetes prevalence and incidence would necessarily reduce the burden of diabetic retinopathy in the United States.
In addition to interventions that target specific forms of vision loss, the promotion of general social, environmental, and political determinants of health could also improve eye and vision health. For example, policies and interventions that promote healthy eating and reduce exposure to UV light could affect the prevalence of diabetic retinopathy, AMD, or cataracts.
Chapter 5 explores the link between multiple determinants of health and strategies to improve eye and vision health and prevent vision impairment in communities.
Modifiable and Correctable Vision Impairment
Early diagnosis and treatment can improve the trajectory of vision impairment by either slowing the progression of specific diseases or conditions or correcting the vision impairment itself. Many effective treatments exist to either modify or reverse vision loss in patients, but many of these diseases and conditions may present without symptoms in early stages. The issue is then promoting policies and conditions that enable populations most affected or at risk to access appropriate screenings, comprehensive eye examinations,22 and follow-up treatments. These topics are discussed at length in Chapters 5, 6, 7, and 8.
Correctable Vision Impairment
Vision impairment associated with uncorrected refractive error can easily be avoided by correcting the refractive error with eyeglasses, contacts, or laser surgery (when appropriate), especially to correct hyperopia and myopia. Other advances in treating myopia include special glasses and contact lenses to alter eye growth “by focusing light from distant images across the entire field of view, rather than just at the centre [sic], as standard lenses do” (Dolgin, 2015, p. 278). Pharmacological treatments (e.g., antimuscarinic medications and low-dose atropine) have been shown to slow the progression of myopia in children and adolescents (Chia et al., 2012; Walline et al., 2011), although corrective lenses may still be necessary.
The most common treatment for advanced cataracts is the removal of the opaque lens and implantation of an intra-ocular lens (IOL), and 90 percent of individuals who have their cataract lenses removed will experience improved vision (NEI/NIH, 2009). In the early stages of cataracts, the use of eyeglasses, better lighting, and magnifying glasses can help to reduce symptoms but they do not reverse or slow the progression of cataracts (NEI/NIH, 2009).
Early diagnosis and treatment of strabismus and amblyopia are essential to reducing the risk of long-term consequences. In children, the treatment of strabismus and amblyopia begins with the identification of the underlying causes or risk factors that lead to the development of the condition. For example, strabismus management varies based on the type of strabismus,
___________________
22 For this report, the committee defines a comprehensive eye examination as a dilated eye examination that may include other tests.
the frequency and magnitude of the angle of turn, the age at which the eye turn presents, and other comorbidities. Available treatments for amblyopia and strabismus include observation, optical correction, prisms, botox injections, orthoptics or vision therapy, surgery, as well as other pharmaceutical interventions (Cotter and PEDIG, 2006; Cotter et al., 2012; Holmes et al., 2003; PEDIG, 2003; Repka et al., 2014; Scheiman et al., 2008). Although contemporary treatments can effectively improve visual acuity, there can be residual acuity deficits and even the risk of reoccurrence (Birch, 2013). There is ongoing research about when to correct, what treatments to use, and how much correction is appropriate for infants and young children with amblyopia and strabismus (Cotter et al., 2014; Jones-Jordan et al., 2014; PEDIG, 2012). Increased screening for vision loss in young children can help detect strabismus and amblyopia early when more promising treatment options are available.
Modifiable Vision Impairment
Comprehensive eye exams are important to ensure early detection and treatment of many eye diseases and conditions that cause modifiable vision impairment, such as diabetic retinopathy, glaucoma, and neovascular AMD (Sloan et al., 2014). For example, studies have found that the individuals most at risk for developing diabetic retinopathy are also those least likely to receive an exam to screen for the disease (Dumser et al., 2013; Lu et al., 2016; Nsiah-Kumi et al., 2009; Shi et al., 2014). Possible factors influencing access to high-quality care are described below and in Chapters 6 and 7.
Various surgical and pharmacological treatments are used to treat diabetic retinopathy, which are often used in combination to improve patient outcomes (Faghihi et al., 2008; Ferraz et al., 2015; Park et al., 2010). Intravitreal injections of anti-VEGFs and laser photocoagulation can slow the growth of abnormal blood vessels in patients with diabetic retinopathy or AMD (Evans et al., 2014; NEI/NIH, 2012b; Solomon et al., 2014). Along with photodynamic therapy, anti-VEGFs are also used for neovascular AMD to inhibit the growth of abnormal blood vessels in the retina. A vitrectomy, where the vitreous gel in the center of the eye is removed and replaced with a clear salt solution, can treat or prevent severe bleeding (NEI/NIH, 2012b; Wormald et al., 2007). Researchers are currently investigating long-acting drug delivery systems with the goal of decreasing the frequency of intraocular injections and improving long-term outcomes for neovascular AMD (Lim et al., 2012).
Common treatments for glaucoma include medications to lower intraocular pressure, incisional therapy (or surgery), laser trabeculoplasty, or aqueous shunts (Gedde et al., 2009; NEI/NIH, 2015; Ramulu et al., 2007; Weinreb et al., 2014). Recently, minimally invasive glaucoma surgeries have
been introduced as surgical interventions to improve function and reduce various problems in glaucoma management, although several knowledge gaps persist (Richter and Coleman, 2016). High doses of vitamins C and E, lutein, zeaxanthin, and zinc have also been shown to slow the progression of intermediate AMD and late, advanced AMD that presents in a single eye (AREDS Research Group, 2001; AREDS 2 Research Group, 2013; Chew et al., 2014). Because many eye diseases and conditions that have modifiable vision impairment are chronic, repeated treatments may be necessary, which will require access to ongoing and coordinated eye care to maximize long-term benefits.
Uncorrectable Vision Impairment
Some diseases and conditions still do not have effective treatments. For example, there are no cures or treatments for some rarer diseases (e.g., AMD in children or adolescents related to Stargardt’s disease) and dry AMD, although a recent study suggests that injections of a humanized anti-factor D antibody that targets VEGF could potentially stop the progression of dry AMD (Lim et al., 2012). Two other studies found that certain dietary supplements could slow dry AMD progression (Buschini et al., 2015; Schmidl et al., 2015). Additional efforts are under way to better understand potential pathophysiological pathways, which could lead to treatments (Querques et al., 2014). Public health strategies for uncorrectable vision impairment, including reasonable accommodations and access to rehabilitation services are discussed in Chapters 5 and 8. However, it is important to note that, when left untreated, modifiable vision impairment can progress to uncorrectable vision impairment (as with glaucoma, neovascular AMD, amblyopia, and diabetic retinopathy). Thus, early access to appropriate treatment can also be relevant to uncorrectable vision impairment.
Complications Following Treatment
Treatments to correct and modify vision impairment are effective, but complications can occur. Cataract surgery is relatively safe, but it does include some rare but potential risks such as bleeding, infection, and retinal detachment and success rates vary by treatment (Chen et al., 2015; Stein et al., 2011a). Potential complications of anti-VEGF therapy include retinal detachment, endophthalmitis, elevated blood pressure, and an increased risk of hypertension, stroke, and heart attack in patients with diabetic macular edema (Etminan et al., 2016; Osaadon et al., 2014). Injecting or implanting corticosteroids in the eye can suppress diabetic macular edema, but it can also cause increased eye pressure and glaucoma (NEI/NIH,
2012b). Laser photocoagulation to treat diabetic retinopathy can damage peripheral vision, as well as color and night vision (Arden and Ramsey, 2015), and the value of laser photocoagulation as a treatment of less severe forms of diabetic retinopathy is poorly understood (Royle et al., 2015). Risks associated with vitrectomy include retinal breaks and postoperative retinal detachment (Tan et al., 2011). Thus, it is important to minimize patient risk through prevention and early diagnosis, monitoring, and treatment in at-risk populations.
ESTIMATING THE PREVENTABLE BURDEN FROM REFRACTIVE ERROR AND CATARACTS
Uncorrected vision impairment is an important measure of eye and vision health in the United States because it represents the clearest opportunity to improve eye and vision health based on current knowledge and the relative effectiveness of specific treatments. When the committee began to analyze existing data to inform its deliberations, there were no national, peer-reviewed estimates of how much vision impairment could be eliminated or improved through changes in various policies and practices. To understand the magnitude of the undiagnosed and correctable visual impairment that currently exists in the United States, the committee commissioned an analysis to establish the preventable burden of vision impairment in the United States from five conditions (diabetic retinopathy, glaucoma, refractive error, cataracts, and age-related macular degeneration). The goal was to estimate the potential preventable burden attributable to five eye diseases or conditions when undiagnosed or untreated and to explore the potential costs and savings if all undiagnosed patients with eye disease were identified and treated using currently available medical technology. The results suggest that uncorrected refractive error and cataracts account for the vast majority of preventable and correctable vision impairment within the United States.
No single database exists that can support this type of analysis. Yet it is of fundamental importance to firmly establish the need for improved eye and vision health as a national health concern, as described in Chapter 4. Consequently, the estimates are based on a variety of sources, including population surveys and compilations of population-based studies, and reflect the best available data. The analysis required the authors to make assumptions about the status of eye and vision health in the United States. Numerous data gaps required several major assumptions related to undiagnosed prevalence, the costs associated with treating a specific disease or condition, and the costs savings that would accrue if the undiagnosed conditions were treated. In each case, the committee weighed the source and instructed the paper’s authors to use the most conservative assumptions—that is, their
assumptions minimized the potential benefits or maximized the potential costs of treatment. Although such practice is routine in the field of disease modeling, it does introduce bias or error due to differences in data source design. The full paper details the authors’ methods, major assumptions, and findings including the preventable burden of each condition, the costs and savings associated with each, and the quality-adjusted life years (QALYs) saved.23
Most notably, for all causes except uncorrected refractive error, the committee relied on two data sources to calculate undiagnosed prevalence because of the limitations inherent to each data source. The first source, Vision Problems in the U.S. (VPUS), was used to estimate true prevalence, but it does not include diagnosis information.24 VPUS prevalence rates were collected from population-based, epidemiological studies providing comprehensive eye examinations in set geographical areas, with eye diseases reported on the basis of age, race and ethnicity, and gender. The rates were multiplied by the 2010 census population estimates to provide national prevalence rates. To allocate prevalence by stage and to estimate the proportion of diagnosed cases, the committee relied on the second source—NHANES data. Undiagnosed cases were identified by subtracting the total number of identified cases in NHANES from overall prevalence using VPUS. In the case of uncorrected refractive error, visual acuity tests in NHANES data were used to identify the proportion of individuals with uncorrected refractive error. The proportion of severe uncorrected refractive error in working-age adults was derived from an overall estimate that included the elderly population, because of data limitations. Population-level prevalence, using U.S. Census projections, was then calculated using these data. This approach has been used in the published literature (Vitale et al., 2008). Vision impairment attributable to each condition was allocated according to the 2004 Eye Disease Prevalence Research Group rates for uncorrectable vision impairment (including blindness) among AMD, cataracts, diabetic retinopathy, glaucoma, and other.25 The cost analysis assumes that all prevalent cases of visual impairment are treated in the first year and that incident cases are treated thereafter.
Although the authors used conservative estimates throughout their analysis, the committee only presents results related to cataracts and
___________________
23 The Wittenborn and Rein commissioned paper includes a methodology section on pages 13–30. Chapter 4 describes NHANES, MEPS, and other surveys that include a vision component.
24 These data are cited extensively by both the CDC and the NEI when characterizing the national prevalence of eye diseases and conditions (e.g., see https://nei.nih.gov/eyedata [accessed September 1, 2016]).
25 These disease allocations are based on 2004 data, which are the most current, but they do not account for effective treatments introduced during the past 12 years.
uncorrected refractive error in this report because the analyses are most robust for these conditions. Thus, it would be possible to calculate a reasonably straightforward and accurate estimate of the preventable burden of uncorrected vision impairment in the United States and to assign potential expenditures and cost savings following treatment. Both conditions, in theory, are nearly 100 percent treatable, although appropriate treatment for cataracts varies by individual symptoms. The uncertainties and assumptions required to assign stages or severity—and, therefore, costs—for diabetic retinopathy, AMD, and glaucoma were substantial enough that the committee did not feel comfortable relying on these results to inform their deliberations or support recommendations.
The results presented in this report should be considered in the context of the limitations of this analysis and the underlying data, as well as with an understanding of how these results should be interpreted. In addition to the data limitations described above, this study also used a prevalence-based approach to estimate the current and future prevalent burden of eye disorders and vision loss. This approach is simpler than an incidence-based forecast analysis and does not require simulation of disease incidence and progression over time. However, a prevalence approach cannot account for any secular trends in disease epidemiology that would change the prevalence rates by age, race and ethnicity, and gender over time. In addition, because of the limited scope of this analysis as well as the fact that VPUS prevalence rates do not include confidence interval information, it was difficult to compare data from NHANES and VPUS. All parameters in the analysis model are static. The authors of the commissioned paper conducted a univariate sensitivity analysis of six major parameter categories, including disease and vision loss prevalence rates. These results are also included in the commissioned paper. These results, which are described in the paper, should only be used to demonstrate the potential magnitude of impact that could result from policies or demonstration programs aimed at evaluating the cost-effectiveness of early treatment and the improved quality of life related to uncorrected refractive error and cataracts, and these results warrant more extensive data collection and analysis, across all causes of vision impairment.
Uncorrected Refractive Error
Vitale and colleagues (2008) wrote that “because refractive error’s impact on visual acuity can be mitigated relatively easily, it has sometimes been overlooked as an important cause of visual impairment” (p. 1117). Failure to address vision impairment in children can lead to developmental and social challenges that can have long-term, detrimental effects on educational, employment, health, and quality-of-life outcomes. Uncorrected or
undercorrected refractive error is largely treatable, which should be a spur to action rather than a reason for inaction.
Although estimates of the size of the problem vary, all available statistics suggest that millions of people are needlessly affected by uncorrected refractive error in the United States. Wittenborn and Rein (2016) calculated that uncorrected (including undiagnosed) refractive error will affect an estimated 15.9 million people ages 12 and older in the United States in 2016. The CDC estimates that of the 14 million people ages 12 and older with a visual acuity of 20/50 or worse, 11 million (about 80 percent) could have their vision improved to 20/40 or better with appropriate refractive correction (CDC, 2015). Still Varma and colleagues (2016) estimate that in 2015 only 8.2 million people have vision impairment due to uncorrected refractive error based on their aggregation of data from six population-based studies. Smaller studies have found that 70 percent of all decreased visual acuity in non-Hispanic whites and Asian preschoolers (ages 30 to 72 months) and more than 90 percent of decreased visual acuity with an identifiable cause, is related to uncorrected refractive error or amblyopia resulting from refractive error (Tarczy-Hornoch et al., 2013). Similarly, the MEPEDS study found that the prevalence of poor visual acuity or amblyopia development due to uncorrected refractive error was 4.3 percent among African American and 5.3 percent among Hispanic preschoolers (ages 30 to 72 months) (MEPEDS, 2009).
Table 2-10 presents the prevalence of uncorrected refractive error in the United States by age, gender, and race and ethnicity, as calculated by Wittenborn and Rein (2016). For purposes of this analysis, the committee
TABLE 2-10 Prevalence of Uncorrected Refractive Error in the United States by Age, Gender, and Race/Ethnicity (in percent)
| Age Group | White | Mexican American or Hispanic | Black | Other | ||||
|---|---|---|---|---|---|---|---|---|
| Male | Female | Male | Female | Male | Female | Male | Female | |
| 12–17 | 0.06 | 0.06 | 0.14 | 0.15 | 0.12 | 0.15 | 0.09 | 0.16 |
| 18–29 | 0.04 | 0.05 | 0.12 | 0.10 | 0.09 | 0.10 | 0.10 | 0.08 |
| 30–39 | 0.04 | 0.04 | 0.04 | 0.11 | 0.12 | 0.10 | 0.11 | 0.03 |
| 40–49 | 0.04 | 0.04 | 0.08 | 0.05 | 0.10 | 0.08 | 0.07 | 0.06 |
| 50–59 | 0.03 | 0.01 | 0.04 | 0.08 | 0.02 | 0.05 | 0.05 | 0.02 |
| 60–69 | 0.03 | 0.04 | 0.04 | 0.07 | 0.03 | 0.03 | 0.10 | 0.06 |
| 70–79 | 0.04 | 0.05 | 0.11 | 0.11 | 0.08 | 0.07 | 0.04 | 0.07 |
| 80+ | 0.06 | 0.08 | 0.13 | 0.013 | 0.16 | 0.06 | 0.06 | 0.07 |
SOURCE: Adapted from Wittenborn and Rein, 2016, Table URE1, p. 31.
assumed 100 percent of these uncorrected or undercorrected refractive error cases are treatable with a vision examination, lenses, and frames at an average one-time cost of $397. Assuming annual refraction correction costs for each person as calculated in MEPS data (minimum of $36 for children ages 0 to 17 and maximum of $103 for individuals ages 40 to 64), net economic savings over the next 10 years would yield an average savings of more than $87.7 billion annually in direct and indirect costs, a remarkable 40-fold return for treatment of uncorrected refractive error.
Undercorrection of refractive error is also a concern. A 2014 study using NHANES data from 2005 to 2008 found that half of study participants ages 12 and older had correctable refractive error, but that 11.7 percent were inadequately corrected (defined as undercorrected or uncorrected) (Qiu et al., 2014). The study found significantly higher odds of inadequate correction of diagnosed refractive error for Mexican Americans and non-Hispanic black children than for non-Hispanic whites across all age groups, with the greatest disparity in the 12- to 19-year-old age group (Qiu et al., 2014).
Untreated Cataracts
Estimates from Wittenborn and Rein suggest that approximately 1.2 million Americans experience unnecessary vision impairment from cataracts, including approximately 157,000 cases of blindness.26 To calculate the preventable burden, the committee assumed that 95 percent of all untreated cataracts cases were immediately treatable, at a one-time cost of $2,640 (persons ages 40 to 64) and $3,730 (persons over age 65). If all these individuals (prevalent cases) and all new (incident) cases were treated, about 300,000 QALYs would be saved, at an average net economic savings of more than $20 billion, including direct and indirect costs, over the next 10 years.
The committee was not able to find another national study estimating the preventable burden of cataracts, but other studies demonstrate the cost utility or cost-effectiveness of cataract surgery in the United States and other developed countries (Busbee et al., 2003; Sach et al., 2009). A 2013 study by Brown and colleagues examined the medical costs and associated financial return on investment and improvement in the quality of life for a 1-year cohort of patients who received cataract surgery (Brown et al., 2013). Results indicated that over a 13-year period, bilateral cataract surgery
___________________
26 NHANES data found 51.92 percent of individuals with a self-reported history of cataract surgery; this estimate was applied to the VPUS prevalence populations under the assumption that the difference was the untreated population with cataracts.
conferred approximately 2.8 QALYs per patient, and the return on investment (ROI) was $123.4 billion (Medicare, $36.4 billion; Medicaid, $3.3 billion; other insurers, $9.6 billion; patients, $48.6 billion; and national productivity, $25.4 billion) (Brown et al., 2013). Moreover, another recent study found that cataract surgery was associated with decreased all-cause mortality for a national cohort of Medicare beneficiaries, although the study’s authors identified a need for further studies to explore the causal mechanisms (Tseng et al., 2016). Studies such as these, in combination with committee estimates about the preventable burden of cataracts, suggest that it is not only possible but also practical to significantly reduce the burden of untreated vision impairment in the United States within a few years by implementing policies and programs that focus on the delivery of relatively inexpensive eyewear and treatments for these causes of vision loss.
Given the relative simplicity of treatment for refractive error and the effectiveness of surgery to correct many forms of cataracts, common sense suggests that eliminating these sources of correctable vision impairment should be achievable. Yet, the magnitude of vision impairment caused by uncorrected refractive error and cataracts suggest that barriers to access persist. Uncorrected refractive error and correctable cataracts should be a major component of any comprehensive population health approach to improving overall eye and vision health and health equity in the United States, especially among children.
KEY KNOWLEDGE AND RESEARCH GAPS
Despite the important contributions that existing literature has made to advance knowledge about eye and vision health in the United States, many key information gaps still remain. It is important to have accurate and timely estimates of the total number of individuals with vision impairment overall and with uncorrected vision impairment by disease and population characteristics because these measures provide the foundation from which to assess the need and possible impact of specific population health interventions. Future epidemiological research should attempt to better characterize disparities in terms of prevalence, incidence, and severity of disease. More research is needed to elucidate the causes and interactions that give rise to various forms and etiologies of vision loss in different populations. Box 2-1 provides a list of key knowledge and research gaps.
In efforts to advance knowledge about eye and vision health, it will be important for clinical, health care system, and social science researchers to work hand in hand with epidemiologists steeped in eye and vision health to track the impact of new knowledge on population health. As the NIH has stated in its overarching framework for guiding vision research, core principles must “use clinical, epidemiological, and statistical tools to
identify populations at risk of blinding eye diseases and visual disorders, evaluate new therapeutics, and improve functional consequences of visual loss” (NEI/NIH, 2012d, p. 3). The committee stresses that efforts to expand knowledge about the epidemiology of vision impairment should balance the more common with rarer eye diseases and conditions in any population health approach to combat the immediate and long-term impacts of vision loss.
CONCLUSION
Several major themes emerge from this review of the scientific literature on the epidemiology of eye disease and vision impairment. First, the prevalence of vision impairment and many eye diseases increases with age, and can also vary with factors including race and ethnicity, gender, family history of eye disease, socioeconomic status, and geographic location. Second, some eye diseases can be corrected, cured, or prevented. Examples include refractive error, cataracts, and amblyopia. For many other eye diseases, interventions can only delay onset or slow the progression. Examples include diabetic retinopathy, AMD, and glaucoma. Third, some risk factors for eye disease are modifiable; these include UV exposure for cataracts, smoking for AMD, and elevated IOP for glaucoma.
Chapter 5 demonstrates how knowledge of these risk and protective factors can help shape public health interventions to ensure early diagnosis and follow-up care, prevent and control eye diseases and underlying comorbid conditions, and modify lifestyle behaviors both before and after eye disease occurs. This chapter has also identified several key knowledge and research gaps.
Using the best available data and methodological approaches to explore the epidemiology in the United States, it is clear that eye health and vision impairment constitute a major public health imperative—one which can be alleviated through a better understanding of populations affected, risk factors underlying specific disorders, and barriers to care that result in an unmet need for diagnosis and treatment. Assessing the prevalence and distribution of vision impairment across populations in the United States is critical to developing effective public health policy. The committee stresses that efforts to develop public health interventions should emphasize the more common diseases in any adopted population health approach to combat the immediate and long-term health-related effects of vision loss.
REFERENCES
AAP (American Academy of Pediatrics). 2011. AAP publications reaffirmed and retired. Pediatrics 128(3):e748 (referencing Committee on Sports Medicine & Fitness. 2004. Protective eyewear for young athletes. Pediatrics 113(3):619–622).
ACCORDION (Action to Control Cardiovascular Risk in Diabetes Follow-On Eye Study Group and the Action to Control Cardiovascular Risk in Diabetes Follow-On Study Group). 2016. Persistent effective of intensive glycemic control on retinopathy in type 2 diabetes in the Action to Control Cardiovascular Risk in Diabetes (ACCORD) Follow-On Study. Diabetes Care 39(7):1089–1100.
Adams, M. K., E. W. Chong, E. Williamson, K. Z. Aung, G. A. Makeyeva, G. G. Giles, D. R. English, J. Hopper, R. H. Guymer, P. N. Baird, L. D. Robman, and J. A. Simpson. 2012. 20/20—Alcohol and age-related macular degeneration: The Melbourne Collaborative Cohort Study. American Journal of Epidemiology 176(4):289–298.
Anfossi, G., I. Russo, and M. Trovati. 2009. Platelet dysfunction in central obesity. Nutrition, Metabolism and Cardiovascular Diseases 19(6):440–449.
AOA (American Optometric Association). 2016. School-aged vision: 6 to 18 years of age. http://www.aoa.org/patients-and-public/good-vision-throughout-life/childrens-vision/school-aged-vision-6-to-18-years-of-age?sso=y (accessed July 11, 2016).
AoA (U.S. Administration on Aging). 2014. Future growth. http://www.aoa.acl.gov/Aging_Statistics/Profile/2014/4.aspx (accessed April 8, 2016).
Arden, G. B., and D. J. Ramsey. 2015. Diabetic retinopathy and a novel treatment based on the biophysics of rod photoreceptors and dark adaptation. In H. Kolb, E. Fernandez, and R. Nelson (eds.), Webvision: The organization of the retina and visual system. Salt Lake City: University of Utah Health Sciences Center.
AREDS (Age-Related Eye Disease Study) Research Group. 2000. Risk factors associated with age-related macular degeneration: A case-control study in the age-related eye disease study: Age-Related Eye Disease Study report number 3. Ophthalmology 107(12):2224–2232.
———. 2001. A randomized, placebo-controlled, clinical trial of high-dose supplementation with vitamins C and E, beta carotene, and zinc for age-related macular degeneration and vision loss: AREDS report number 8. Archives of Ophthalmology 119(10):1417–1436.
———. 2005. Risk factors for the incidence of advanced age-related macular degeneration in the Age-Related Eye Disease Study (AREDS): AREDS report number 19. Ophthalmology 112(4):533–539, e531.
AREDS 2 Research Group. 2013. Lutein + zeaxanthin and omega-3 fatty acids for age-related macular degeneration: The Age-Related Eye Disease Study 2 (AREDS2) randomized clinical trial. JAMA 309(19):2005–2015.
Atkinson, J., O. Braddick, M. Nardini, and S. Anker. 2007. Infant hyperopia: Detection, distribution, changes and correlates—outcomes from the Cambridge infant screening programs. Optometry & Vision Science 84(2):84–96.
Azari, A. A., and N. P. Barney. 2013. Conjunctivitis: A systematic review of diagnosis and treatment. JAMA 310(16):1721–1730.
Barrett, B. T., A. Bradley, and T. R. Candy. 2013. The relationship between anisometropia and amblyopia. Progress in Retinal and Eye Research 36:120–158.
Bertelsen, G., T. Peto, H. Lindekleiv, H. Schirmer, M. D. Solbu, I. Toft, A. K. Sjølie, and I. Njølstad. 2013. Tromsø eye study: Prevalence and risk factors of diabetic retinopathy. Acta Ophthalmologica 91(8):716–721.
Birch, E. E. 2013. Amblyopia and binocular vision. Progress in Retinal and Eye Research 33:67–84.
BLS (Bureau of Labor Statistics). 2012. Injuries, illnesses, and fatalities.http://www.bls.gov/iif/oshwc/osh/case/ostb3594.pdf (accessed February 16, 2016).
Bojikan, K. D., A. L. Stein, M. A. Slaubaugh, and P. P. Chan. 2015. Incidence and risk factors for traumatic intraocular pressure elevation and traumatic glaucoma after open-globe injury. Eye 29:1579–1584.
Borchert, M. S., R. Varma, S. A. Cotter, K. Tarczy-Hornoch, R. McKean-Cowdin, J. H. Lin, G. Wen, S. P. Azen, M. Torres, J. M. Tielsch, D. S. Friedman, M. X. Repka, J. Katz, J. Ibironke, L. Giordano, and the Multi-Ethnic Pediartic Eye Disease Study and the Baltimore Pediatric Eye Disease Study groups. 2011. Risk factors for hyperopia and myopia in preschool children the Multi-Ethnic Pediatric Eye Disease and Baltimore Pediatric Eye Disease studies. Ophthalmology 118(10):1966–1973.
Bourla, D. H., and T. A. Young. 2006. Age-related macular degeneration: A practical approach to a challenging disease. Journal of the American Geriatrics Society 54(7):1130–1135.
Boyle, J. P., T. J. Thompson, E. W. Gregg, L. E. Barker, and D. F. Williamson. 2010. Projection of the year 2050 burden of diabetes in the U.S. adult population: Dynamic modeling of incidence, mortality, and prediabetes prevalence. Population Health Metrics 8(1):1.
Brahm, K. D., H. M. Wilgenburg, J. Kirby, S. Ingalla, C. Y. Chang, and G. L. Goodrich. 2009. Visual impairment and dysfunction in combat-injured service members with traumatic brain injury. Optometry & Vision Sciences 86(7):817–825.
Brown, G. C., M. M. Brown, A. Menezes, B. G. Busbee, H. B. Lieske, and P. A. Lieske. 2013. Cataract surgery cost utility revisited in 2012: A new economic paradigm. Ophthalmology 120(12):2367–2376.
Busbee, B. G., M. M. Brown, G. C. Brown, and S. Sharma. 2003. Cost-utility analysis of cataract surgery in the second eye. Ophthalmology 110(12):2310–2317.
Buschini, E., A. M. Fea, C. A. Lavia, M. Nassisi, G. Pignata, M. Zola, and F. M. Grignolo. 2015. Recent developments in the management of dry age-related macular degeneration. Clinical Ophthalmology 9:563–574.
Campbell, J. P., T. J. McFarland, and J. T. Stout. 2016. Ocular gene therapy. Developments in Ophthalmology 55:317–321.
CDC (Centers for Disease Control and Prevention). 2007. Eye safety tool box talk—instructor’s guide. http://www.cdc.gov/niosh/topics/eye/toolbox-eye.html (accessed February 16, 2016).
———. 2009. The burden of vision loss. http://www.cdc.gov/visionhealth/basic_information/vision_loss_burden.htm (accessed March 24, 2016).
———. 2011a. National diabetes fact sheet: National estimates and general information on diabetes and prediabetes in the United States, 2011. Atlanta, GA: CDC. http://www.cdc.gov/diabetes/pubs/pdf/ndfs_2011.pdf (accessed September 2, 2016).
———. 2011b. The state of vision, aging, and public health in America.http://www.cdc.gov/visionhealth/pdf/vision_brief.pdf (accessed February 16, 2016).
———. 2014. National diabetes statistics report: Estimates of diabetes and its burden in the United States, 2014. Atlanta, GA: CDC.
———. 2015a. Chlamydia—CDC fact sheet (detailed). http://www.cdc.gov/std/chlamydia/stdfact-chlamydia-detailed.htm (accessed May 20, 2016).
———. 2015b. Definition of fungal eye infections. http://www.cdc.gov/fungal/diseases/fungaleye-infections/definition.html (accessed August 19, 2016).
———. 2015c. Fungal eye infection statistics. http://www.cdc.gov/fungal/diseases/fungal-eyeinfections/statistics.html (accessed August 19, 2016).
———. 2015d. National Health and Nutrition Examination Survey (NHANES). http://www.cdc.gov/visionhealth/data/systems/nhanes.htm (accessed August 19, 2016).
———. 2015e. Vision Health Initiative (VHI): National data. http://www.cdc.gov/visionhealth/data/national.htm (accessed February 12, 2016).
———. 2016a. Basic information about traumatic brain injury and concussion. http://www.cdc.gov/traumaticbraininjury/basics.html (accessed February 16, 2016).
———. 2016b. Conjunctivitis (pink eye) in newborns. http://www.cdc.gov/conjunctivitis/newborns.html (accessed July 8, 2016).
———. 2016c. Conjunctivitis (pink eye). Causes. https://www.cdc.gov/conjunctivitis/about/causes.html (accessed July 8, 2016)
———. 2016d. Diabetes latest. http://www.cdc.gov/features/diabetesfactsheet (accessed June 16, 2016).
———. 2016e. Injury prevention & control: Traumatic brain injury & concussion—TBI: Get the facts. http://www.cdc.gov/traumaticbraininjury/get_the_facts.html (accessed June 4, 2016).
Chalmers, R. L., H. Wagner, G. L. Mitchell, D. Y. Lam, B. T. Kinoshita, M. E. Jansen, K. Richdale, L. Sorbara, and T. T. McMahon. 2011. Age and other risk factors for corneal infiltrative and inflammatory events in young soft contact lens wearers from the Contact Lens Assessment in Youth (CLAY) Study. Investigative Ophthalmology & Visual Science 52(9):6690–6696.
Chang, J. R., E. Koo, E. Agron, J. Hallak, T. Clemons, D. Azar, R. D. Sperduto, F. L. Ferris, 3rd, and E. Y. Chew. 2011. Risk factors associated with incident cataracts and cataract surgery in the Age-Related Eye Disease Study (AREDS): AREDS report number 32. Ophthalmology 118(11):2113–2119.
Channa, R., S. Zafar, J. K. Canner, R. Haring, E. B. Schneider, and D. S. Friedman. 2016. Epidemiology of eye-related emergency department visits. JAMA Ophthalmology 134(3):312–319.
Chen, X., W. Xiao, S. Ye, W. Chen, and Y. Liu. 2015. Efficacy and safety of femtosecond laser-assisted cataract surgery versus conventional phacoemulsification for cataract: A meta-analysis of randomized controlled trials. Scientific Reports 5:13123.
Chen, Y. K. Huang, M. N. Nakatsu, S. X. Deng, and G. Fan. 2013. Identification of novel molecular markers thorugh transcriptomic analysis in human fetal and adult corneal endothelial cells. Human Molecular Genetics 22(7):1271–1279.
Cheung, C., and T. Wong. 2014. Is age-related macular degeneration a manifestation of systemic disease? New prospects for early intervention and treatment. Journal of Internal Medicine 276(2):140–153.
Cheung, N., and T. Y. Wong. 2007. Obesity and eye diseases. Survey of Ophthalmology 52(2):180–195.
Chew, E. Y., J. P. SanGiovanni, F. L. Ferris, W. T. Wong, E. Agron, T. E. Clemons, R. Sperduto, R. Danis, S. R. Chandra, and B. A. Blodi. 2013. Lutein/zeaxanthin for the treatment of age-related cataract: AREDS2 randomized trial report number 4. JAMA Ophthalmology 131(7):843–850.
Chew, E. Y., T. E. Clemons, S. B. Bressler, M. J. Elman, R. P. Danis, A. Domalpally, J. S. Heier, J. E. Kim, and R. Garfinkel. 2014. Randomized trial of a home monitoring system for early detection of choroidal neovascularization Home Monitoring of the Eye (HOME) study. Ophthalmology 121(2):535–544.
Chia, A., W. H. Chua, Y. B. Cheung, W. L. Wong, A. Lingham, A. Fong, and D. Tan. 2012. Atropine for the treatment of childhood myopia: Safety and efficacy of 0.5%, 0.1%, and 0.01% doses (atropine for the treatment of myopia 2). Ophthalmology 119(2):347–354.
Chia, A., X. Lin, M. Dirani, G. Gazzard, D. Ramamurthy, B.-L. Quah, B. Chang, Y. Ling, S.-W. Leo, and T.-Y. Wong. 2013. Risk factors for strabismus and amblyopia in young Singapore Chinese children. Ophthalmic Epidemiology 20(3):138–147.
Chiotoroiu, S. M., D. Pop de Popa, G. I. Stefaniu, F. A. Secureanu, and V. L. Purcarea. 2013. The importance of alcohol abuse and smoking in the evolution of glaucoma disease. Journal of Medicine and Life 6(2):226–229.
Choi, J. A., J.-U. Hwang, Y. H. Yoon, and J.-Y. Koh. 2013. Methallothionein-3 contributes to vascular endothelial growth factor induction in a mouse model of choroidal neovascularization. Metallomics 5(10):1387–1396.
Chong, E. W., A. J. Kreis, T. Y. Wong, J. A. Simpson, and R. H. Guymer. 2008. Alcohol consumption and the risk of age-related macular degeneration: A systematic review and meta-analysis. American Journal of Ophthalmology 145(4):707–715.
Chou, C. F., C. E. Sherrod, X. Zhang, L. E. Barker, K. M. Bullard, J. E. Crews, and J. B. Saaddine. 2014. Barriers to eye care among people aged 40 years and older with diagnosed diabetes, 2006–2010. Diabetes Care 37(1):180–188.
Clemons, T. E., R. C. Milton, R. Klein, J. M. Seddon, F. L. Ferris 3rd, Age-Related Eye Disease Study Research Group. 2005. Risk factors for the incidence of advanced age-related macular degeneration in the Age-Related Eye Disease Study (AREDS): AREDS report number 19. Ophthalmology 112(4):533–539.
Cockerham, G. C., G. L. Goodrich, E. D. Weichel, J. C. Orcutt, J. F. Rizzo, K. S. Bower, and R. A. Schuchard. 2009. Eye and visual function in traumatic brain injury. Journal of Rehabilitation Research & Development 46(6):811–818.
Colak, E., N. Majkic-Singh, L. Zoric, A. Radosavljevic, and N. Kosanovic-Jakovic. 2012. The role of CRP and inflammation in the pathogenesis of age-related macular degeneration. Biochemia Medica 22(1):39–48.
Coleman, A. L., and S. Miglior. 2008. Risk factors for glaucoma onset and progression. Survey of Ophthalmology 53(6):S3–S10.
Coleman, A. L., F. Yu, E. Keeler, and C. M. Mangione. 2006. Treatment of uncorrected refractive error improves vision-specific quality of life. Journal of American Geriatrics Society 54(6):883–890.
Coleman, A. L., F. C. Lum, P. Velentgas, Z. Su, R. E. Gliklich, and RiGOR Study Group. 2016a. Impact of treatment strategies for open angle glaucoma on intraocular pressure: The RiGOR Study. Journal of Comparative Effectiveness Research 5(1):87–98.
Coleman, A. L., F. C. Lum, P. Velentgas, Z. Su, R. E. Gliklich, and RiGOR Study Group. 2016b. RiGOR: A prospective observational study comparing the effectiveness of treatment strategies for open-angle glaucoma. Journal of Comparative Effectiveness Research 5(1):65–78.
Collier, S. A., M. P. Gronostaj, A. K. MacGurn, J. R. Cope, K. L. Awsumb, J. S. Yoder, and M. J. Beach. 2014. Estimated burden of keratitis—United States, 2010. Morbidity and Mortality Weekly Report 63(45):1027–1030.
Congdon, N., B. O’Colmain, C. C. Klaver, R. Klein, B. Munoz, D. S. Friedman, J. Kempen, H. R. Taylor, and P. Mitchell. 2004a. Causes and prevalence of visual impairment among adults in the United States. Archives of Ophthalmology 122(4):477–485.
Congdon, N., J. R. Vingerling, B. E. Klein, S. West, D. S. Friedman, J. Kempen, B. O’Colmain, S. Y. Wu, and H. R. Taylor. 2004b. Prevalence of cataract and pseudophakia/aphakia among adults in the United States. Archives of Ophthalmology 122(4):487–494.
Cope, J. R., S. A. Collier, M. M. Rao, R. Chalmers, G. L. Mitchell, K. Richdale, H. Wagner, B. T. Kinoshita, D. Y. Lam, and L. Sorbara. 2015. Contact lens wearer demographics and risk behaviors for contact lens-related eye infections—United States, 2014. Morbidity and Mortality Weekly Report 64:865–870.
Cotch, M. F., R. J. Klein, K. M. Brett, and A. Ryskulova. 2005 Visual impairment and use of eye-care services and protective eyewear among children—United States, 2002. Morbidity and Mortality Weekly 54(17):425–429.
Cotter, S. A., and PEDIG (Pediatric Eye Disease Investigator Group). 2006. Treatment of anisometropic amblyopia in children with refractive correction. Ophthalmology 113(6):895–903.
Cotter, S. A., R. Varma, K. Tarczy-Hornoch, R. McKean-Cowdin, J. Lin, G. Wen, J. Wei, M. Borchert, S. P. Azen, M. Torres, J. M. Tielsch, D. S. Friedman, M. X. Repka, J. Katz, J. Ibironke, L. Giordano, and the Joint Writing Committee for the Multi-Ethnic Pediatric Eye Disease Study and the Baltimore Pediatric Eye Disease Study Groups. 2011. Risk factors associated with childhood strabismus: The Multi-Ethnic Pediatric Eye Disease and Baltimore Pediatric Eye Disease studies. Ophthalmology 118(11):2251–2261.
Cotter, S. A., N. C. Foster, J. M. Holmes, B. M. Melia, D. K. Wallace, M. X. Repka, S. M. Tamkins, R. T. Kraker, R. W. Beck, D. L. Hoover, E. R. Crouch, 3rd, A. M. Miller, C. L. Morse, and D. W. Suh. 2012. Optical treatment of strabismic and combined strabismic-anisometropic amblyopia. Ophthalmology 119(1):150–158.
Cotter, S. A., B. G. Mohney, D. L. Chandler, J. M. Holmes, M. X. Repka, M. Melia, D. K. Wallace, R. W. Beck, E. E. Birch, R. T. Kraker, S. M. Tamkins, A. M. Miller, N. A. Sala, and S. R. Glaser. 2014. A randomized trial comparing part-time patching with observation for children 3 to 10 years of age with intermittent exotropia. Ophthalmology 121(12):2299–2310.
Cougnard-Gregoire, A., B. M. Merle, J. F. Korobelnik, M. B. Rougier, M. N. Delyfer, C. Feart, M. Le Goff, J. F. Dartigues, P. Barberger-Gateau, and C. Delcourt. 2015. Vitamin D deficiency in community-dwelling elderly is not associated with age-related macular degeneration. Journal of Nutrition 145(8):1865–1872.
Cumberland, P. M., J. S. Rahi, for the UK Biobank Eye and Vision Consortium. 2016. Visual function, social position, and health and life changes: The UK Biobank Study. JAMA Ophthalmology 134(9):959–966.
Cummings, S. R., M. C. Nevitt, W. S. Browner, K. Stone, K. M. Fox, K. E. Ensrud, J. Cauley, D. Black, and T. M. Vogt. 1995. Risk factors for hip fracture in white women. Study of Osteoporotic Fractures Research Group. New England Journal of Medicine 332(12):767–773.
Cusick, M., E. Y. Chew, C.-C. Chan, H. S. Kruth, R. P. Murphy, and F. L. Ferris. 2003. Histopathology and regression of retinal hard exudates in diabetic retinopathy after reduction of elevated serum lipid levels. Ophthalmology 110(11):2126–2133.
Dang, S. 2015. Eye injuries at work. http://www.aao.org/eye-health/tips-prevention/injuries-work (accessed February 16, 2016).
Dartmouth Atlas of Health Care. 2012. Percent of diabetic Medicare enrollees receiving appropriate management, by race and type of screening. http://www.dartmouthatlas.org/data/table.aspx?ind=160 (accessed May 18, 2016).
Dasch, B., A. Fuhs, T. Behrens, A. Meister, J. Wellmann, M. Fobker, D. Pauleikhoff, and H.-W. Hense. 2005. Inflammatory markers in age-related maculopathy: Cross-sectional analysis from the Muenster Aging and Retina Study. Archives of Ophthalmology 123(11):1501–1506.
Defense and Veterans Brain Injury Center. 2016. DoD worldwide numbers for TBI. http://dvbic.dcoe.mil/dod-worldwide-numbers-tbi (accessed August 14, 2016).
DePaolis, M. 2014. Macular degeneration—FAQs. http://www.allaboutvision.com/faq/amd.htm (accessed February 17, 2016).
Dirani, M., L. Tong, G. Gazzard, X. Zhang, A. Chia, T. L. Young, K. A. Rose, P. Mitchell, and S. M. Saw. 2009. Outdoor activity and myopia in Singapore teenage children. British Journal of Ophthalmology 93(8):997–1000.
DOL (U.S. Department of Labor). 2016. Updating OSHA standards based on national consensus standards: Eye and face protection. Federal Register 81:16085–16093.
Dolgin, E. 2015. The myopia boom. Nature 519(7543):276–278.
Dotan, G., B. Truong, M. Snitzer, et al. 2015. Outcomes of an inner-city vision outreach program: Give kids sight day. JAMA Ophthalmology 133(5):527–532.
Dumser, S. M., S. J. Ratcliffe, D. R. Langdon, K. M. Murphy, and T. H. Lipman. 2013. Racial disparities in screening for diabetic retinopathy in youth with type 1 diabetes. Diabetes Research and Clinical Practice 101(1):e3–e5.
Edwards, R., J. Thornton, R. Ajit, R. A. Harrison, and S. P. Kelly. 2008. Cigarette smoking and primary open angle glaucoma: A systematic review. Journal of Glaucoma 17(7):558–566.
Etminan, M., D. A. Maberley, D. W. Babiuk, and B. C. Carleton. 2016. Risk of myocardial infarction and stroke with single or repeated doses of intravitreal bevacizumab in age-related macular degeneration. American Journal of Ophthalmology 163:53–58.
Evans, J. R., M. Michelessi, and G. Virgili. 2014. Laser photocoagulation for proliferative diabetic retinopathy. Cochrane Database of Systematic Reviews 11:CD011234.
Faghihi, H., R. Roohipoor, S. Mohammadi, K. Hojat-Jalali, A. Mirshahi, A. Lashay, N. Piri, and S. Faghihi. 2008. Intravitreal bevacizumab versus combined bevacizumabtriamcinolone versus macular laser photocoagulation in diabetic macular edema. European Journal of Ophthalmology 18(6):941.
Fansi, A. A., D. G. Papamatheakis, and P. J. Harasymowycz. 2009. Racial variability of glaucoma risk factors between African Caribbeans and Caucasians in a Canadian urban screening population. Canadian Journal of Ophthalmology 44(5):576–581.
Feingold, K. R., and C. Grunfeld. 2000. Obesity and dyslipidemia. In Endotext, L. J. De Groot, P. Beck-Peccoz, G. Chrousos, K. Dungan, A. Grossman, J. M. Hershman, C. Koch, R. McLachlan, M. New, R. Rebar, F. Singer, A. Vinik and M. O. Weickert (eds.). South Dartmouth, MA: MDText.com, Inc.
Ferraz, D. A., L. M. Vasquez, R. C. Preti, A. Motta, R. Sophie, M. G. Bittencourt, Y. J. Sepah, M. L. Monteiro, Q. D. Nguyen, and W. Y. Takahashi. 2015. A randomized controlled trial of panretinal photocoagulation with and without intravitreal ranibizumab in treatment-naive eyes with non-high-risk proliferative diabetic retinopathy. Retina 35(2):280–287.
Fingert, J. H. 2011. Primary open-angle glaucoma genes. Eye (London) 25(5): 587–595.
Fitch, C. P., P. A. Rapoza, S. Owens, F. Murillo-Lopez, R. A. Johnson, T. C. Quinn, J. S. Pepose, and H. R. Taylor. 1989. Epidemiology and diagnosis of acute conjunctivitis at an inner-city hospital. Ophthalmology 96(8):1215–1220.
Flynn, J. T., and J. C. Cassady. 1978. Current trends in amblyopia therapy. Ophthalmology 85:429–459.
Fong, D. S., L. Aiello, T. W. Gardner, G. L. King, G. Blankenship, J. D. Cavallerano, F. L. Ferris, 3rd, and R. Klein. 2004. Retinopathy in diabetes. Diabetes Care 27 (Suppl 1):S84–S87.
Forlenza, G. P., and M. W. Stewart. 2012. Diabetic retinopathy in children. Pediatric Endocrinology Reviews 10(2):217–226.
Forrest, K. Y., and J. M. Cali. 2009. Epidemiology of lifetime work-related eye injuries in the U.S. population associated with one or more lost days of work. Ophthalmic Epidemiology 16(3):156–162.
Fozailoff, A., K. Tarczy-Hornoch, S. Cotter, G. Wen, J. Lin, M. Borchert, S. Azen, and R. Varma. 2011. Prevalence of astigmatism in 6- to 72-month-old African American and Hispanic children: The Multi-Ethnic Pediatric Eye Disease Study. Ophthalmology 118(2):284–293.
Friedman, D. S., B. J. O’Colmain, B. Munoz, S. C. Tomany, C. McCarty, P. T. de Jong, B. Nemesure, P. Mitchell, and J. Kempen. 2004a. Prevalence of age-related macular degeneration in the United States. Archives of Ophthalmology 122(4):564–572.
Friedman, D. S., R. C. Wolfs, B. J. O’Colmain, B. E. Klein, H. R. Taylor, S. West, M. C. Leske, P. Mitchell, N. Congdon, J. Kempen, and Eye Diseases Prevalence Research Group. 2004b. Prevalence of open-angle glaucoma among adults in the United States. Archives of Ophthalmology 122(4):532–538.
Friedman, D. S., M. X. Repka, J. Katz, L. Giordano, J. Ibironke, P. Hawse, and J. M. Tielsch. 2009. Prevalence of amblyopia and strabismus in white and African American children aged 6 through 71 months: The Baltimore Pediatric Eye Disease Study. Ophthalmology 116(11):2128–2134, e2121–e2122.
Ganz, M. L., Z. Xuan, and D. G. Hunter. 2006. Prevalence and correlates of children’s diagnosed eye and vision conditions. Ophthalmology 113(12):2298–2306.
Gedde, S. J., J. C. Schiffman, W. J. Feuer, L. W. Herndon, J. D. Brandt, and D. L. Budenz. 2009. Three-year follow-up of the tube versus trabeculectomy study. American Journal of Ophthalmology 148(5):670–684.
Geloneck, M. M., E. L. Crowell, E. B. Wilson, B. E. Synder, A. Z. Chuang, L. A. Baker, N. P. Bell, and R. M. Feldman. 2015. Correlation between intraocular pressure and body mass index in the seated and supine positions. Journal of Glaucoma 24(2):130–134.
George, A. M., A. G. Jacob, and L. Fogelfeld. 2015. Lean diabetes mellitus: An emerging entity in the era of obesity. World Journal of Diabetes 6(4):613.
Giordano, L., D. S. Friedman, M. X. Repka, J. Katz, J. Ibironke, P. Hawes, and J. M. Tielsch. 2009. Prevalence of refractive error among preschool children in an urban population: The Baltimore Pediatric Eye Disease Study. Ophthalmology 116(4):739–746.
Girmens, J.-F., J.-A. Sahel, and K. Marazova. 2012. Dry age-related macular degeneration: A currently unmet clinical need. Intractable & Rare Diseases Research 1(3):103.
Glynn, R. J., B. Rosner, and W. G. Christen. 2009. Evaluation of risk factors for cataract types in a competing risks framework. Ophthalmic Epidemiology 16(2):98–106.
Goldstein, M. H., and D. Wee. 2011. Sports injuries: An ounce of prevention and a pound of cure. Eye & Contact Lens 37(3):160–163.
Gong, Y., K. Feng, N. Yan, Y. Xu, and C. W. Pan. 2015. Different amounts of alcohol consumption and cataract: A meta-analysis. Optometry & Vision Science 92(4):471–479.
Goodrich, G. L., H. M. Flyg, J. E. Kirby, C. Y. Chang, and G. L. Martinsen. 2013. Mechanisms of TBI and visual consequences in military and veteran populations. Optometry & Vision Science 90(2):105–112.
Gopinath, B., G. Liew, G. Burlutsky, and P. Mitchell. 2014. Physical activity and the 15-year incidence of age-related macular degeneration. Investigative Ophthalmology & Visual Science 55(12):7799–7803.
Gordon, M. O., J. A. Beiser, J. D. Brandt, D. K. Heuer, E. J. Higginbotham, C. A. Johnson, J. L. Keltner, J. P. Miller, R. K. Parrish, and M. R. Wilson. 2002. The Ocular Hypertension Treatment Study: Baseline factors that predict the onset of primary open-angle glaucoma. Archives of Ophthalmology 120(6):714–720.
Haddrill, M. 2016. Stargardt’s disease (fundus flavimaculatus). http://www.allaboutvision.com/conditions/stargardts.htm (accessed May 20, 2016).
Hamm, L. M., J. Black, S. Dai, and B. Thompson. 2014. Global processing in amblyopia: A review. Frontiers in Psychology 5:1–21.
Harrison, A., and D. G. Telander. 2002. Eye injuries in the young athlete: A case-based approach. Pediatric Annals 31(1):33–40.
Haslam, D., and W. James. 2005. Obesity. Lancet 366:1197–1209.
Hatt, S. R., and L. Gnanaraj. 2013. Interventions for intermittent exotropia. Cochrane Database of Systematic Reviews 5:1–35. http://doi.org/10.1002/14651858.CD003737.pub3 (accessed September 3, 2016).
He, M., F. Xiang, Y. Zeng, et al. 2015. Effect of time spent outdoors at school on the development of myopia among children in China: A randomized clinical trial. JAMA 314(11):1142–1148.
Hellgren, K. M., K. Tornqvist, P. G. Jakobsson, P. Lundgren, B. Carlsson, K. Kallen, F. Serenius, A. Hellstrom, and G. Holmstrom. 2016. Ophthalmologic outcome of extremely preterm infants at 6.5 years of age: Extremely Preterm Infants in Sweden Study (EXPRESS). JAMA Ophthalmology.
Hiller, R., M. J. Podgor, R. D. Sperduto, L. Nowroozi, P. W. Wilson, R. B. D’Agostino, T. Colton, and T. F. E. S. Group. 1998. A longitudinal study of body mass index and lens opacities: The Framingham studies. Ophthalmology 105(7):1244–1250.
Ho, V. H., and I. R. Schwab. 2001. Social economic development in the prevention of global blindness. British Journal of Ophthalmology 85(6):653–657.
Holmes, J. M., R. T. Kraker, R. W. Beck, E. E. Birch, S. A. Cotter, D. F. Everett, R. W. Hertle, G. E. Quinn, M. X. Repka, M. M. Scheiman, and D. K. Wallace. 2003. A randomized trial of prescribed patching regimens for treatment of severe amblyopia in children. Ophthalmology 110(11):2075–2087.
Hong, T., P. Mitchell, T. de Loryn, E. Rochtchina, S. Cugati, and J. J. Wang. 2009. Development and progression of diabetic retinopathy 12 months after phacoemulsification cataract surgery. Ophthalmology 116(8):1510–1514.
Hyman, L., and R. Neborsky. 2002. Risk factors for age-related macular degeneration: An update. Current Opinion Ophthalmology 13(3):171–175.
IOM (Institute of Medicine). 2003. Unequal treatment: Confronting racial and ethnic disparities in health care. Washington, DC: The National Academies Press.
Ip, J. M., S. C. Huynh, D. Robaei, K. A. Rose, I. G. Morgan, W. Smith, A. Kifley, and P. Mitchell. 2007. Ethnic differences in the impact of parental myopia: Findings from a population-based study of 12-year-old Australian children. Investigative Ophthalmology & Visual Science 48(6):2520–2528.
Ip, J. M., S. M. Saw, K. A. Rose, I. G. Morgan, A. Kifley, J. J. Wang, and P. Mitchell. 2008. Role of near work in myopia: Findings in a sample of Australian school children. Investigative Ophthalmology & Visual Science 49(7):2903–2910.
Javitt, J. C., A. M. McBean, G. A. Nicholson, J. D. Babish, J. L. Warren, and H. Krakauer. 1991. Undertreatment of glaucoma among Black Americans. New England Journal of Medicine 325(20):1418–1422.
Jee, D., W. K. Lee, and S. Kang. 2013. Prevalence and risk factors for diabetic retinopathy: The Korea National Health and Nutrition Examination Survey, 2008–2011. Investigative Ophthalmology & Visual Science 54(10):6827–6833.
Jones-Jordan, L. A., L. T. Sinnott, R. E. Manny, S. A. Cotter, R. N. Kleinstein, D. O. Mutti, J. D. Twelker, and K. Zadnik. 2010. Early childhood refractive error and parental history of myopia as predictors of myopia. Investigative Ophthalmology & Visual Science 51(1):115–121.
Jones-Jordan, L. A., G. L. Mitchell, S. A. Cotter, R. N. Kleinstein, R. E. Manny, D. O. Mutti, J. D. Twelker, J. R. Sims, and K. Zadnik. 2011. Visual activity before and after the onset of juvenile myopia. Investigative Ophthalmology & Visual Science 52(3):1841–1850.
Jones-Jordan, L. A., L. T. Sinnott, N. D. Graham, S. A. Cotter, R. N. Kleinstein, R. E. Manny, D. O. Mutti, J. D. Twelker, and K. Zadnik. 2014. The contributions of near work and outdoor activity to the correlation between siblings in the Collaborative Longitudinal Evaluation of Ethnicity and Refractive Error (CLEERE) study. Investigative Ophthalmology & Visual Science 55(10):6333–6339.
Kakigi, C. L., K. Singh, S. Y. Wang, W. T. Enanoria, and S. C. Lin. 2015. Self-reported calcium supplementation and age-related macular degeneration. JAMA Ophthalmology 133(7):746–754.
Kanthan, G. L., P. Mitchell, G. Burlutsky, and J. J. Wang. 2010. Alcohol consumption and the long-term incidence of cataract and cataract surgery: The Blue Mountains Eye Study. American Journal of Ophthalmology 150(3):434–440, e431.
Karadag, R., Z. Arslanyilmaz, B. Aydin, and I. F. Hepsen. 2012. Effects of body mass index on intraocular pressure and ocular pulse amplitude. International Journal of Ophthalmology 5(5):605.
Kaufman, H. E. 2011. Adenovirus advances: New diagnostic and therapeutic options. Current Opinion Ophthalmology 22(4):290–293.
Kemper, A. R. Harris, T. A. Lieu, C. J. Homer, and B. L. Whitener. 2004. Screening for vision impairment in children younger than age 5 years: A systematic evidence review for the U.S. Preventive Services Task Force. No. 27. Rockville, MD: Agency for Healthcare Research and Quality.
Kersey, J. P., and D. C. Broadway. 2006. Corticosteroid-induced glaucoma: A review of the literature. Eye 20:407–416.
Kim, E. C., K. Han, and D. Jee. 2014. Inverse relationship between high blood 25-hydroxyvitamin D and late stage of age-related macular degeneration in a representative Korean population. Investigative Ophthalmology & Visual Science 55(8):4823–4831.
Kim, T., A. P. Nunes, M. J. Mello, and P. B. Greenberg. 2011. Incidence of sport-related eye injuries in the United States: 2001–2009. Graefes Archive for Clinical and Experimental Ophthalmology 249:1743–1744.
Kirtland, K. A., J. B. Saaddine, L. S. Geiss, T. J. Thompson, M. F. Cotch, and P. P. Lee. 2015. Geographic disparity of severe vision loss—United States, 2009–2013. Morbidity and Mortality Weekly Report 64(19):513–517.
Klein, B. E. K., R. Klein, K. E. Lee, and K. J. Cruickshanks. 1998. Performance-based and self-assessed measures of visual function as related to history of falls, hip fractures, and measured gait time: The Beaver Dam Eye Study. Ophthalmology 105(1):160–164.
Klein, R., B. E. K. Klein, M. D. Knudtson, T. Y. Wong, M. F. Cotch, K. Liu, G. Burke, M. F. Saad, and D. R. Jacobs, Jr. 2006. Prevalence of age-related macular degeneration in 4 racial/ethnic groups in the multi-ethnic study of atherosclerosis. Ophthalmology 113(3):373–380.
Klein, R., M. D. Knudtson, K. E. Lee, R. Gangnon, and B. E. K. Klein. 2008. The Wisconsin epidemiologic study of diabetic retinopathy xxii. The twenty-five-year progression of retinopathy in persons with type 1 diabetes. Ophthalmology 115(11):1859–1868.
Kleinstein, R. N., L. A. Jones, S. Hullett, et al. 2003. Refractive error and ethnicity in children. Archives of Ophthalmology 121(8):1141–1147.
Ko, F., S. Vitale, C. F. Chou, M. F. Cotch, J. Saaddine, and D. S. Friedman. 2012. Prevalence of nonrefractive visual impairment in US adults and associated risk factors, 1999–2002 and 2005–2008. JAMA 308(22):2361–2368.
Kodjebacheva, G., E. R. Brown, L. Estrada, F. Yu, and A. L. Coleman. 2011. Uncorrected refractive error among first-grade students of different racial/ethnic groups in Southern California: Results a year after school-mandated vision screening. Journal of Public Health Management Practice 17(6):499–505.
Kodjebacheva, G., F. Yu, and A. L. Coleman. 2016. Vision conditions among first-graders of different racial/ethnic groups a year after vision screening by school nurses in Southern California. Journal of Nursing Education and Practice 6(2):27–34.
Kovarik, J. J., A. W. Eller, L. A. Willard, J. Ding, J. M. Johnston, and E. L. Waxman. 2016. Prevalence of undiagnosed diabetic retinopathy among inpatients with diabetes: The Diabetic Retinopathy Inpatient Study (DRIPS). BMJ Open Diabetes Research & Care 4(1).
Kulp, M. T., E. Ciner, M. Maguire, B. Moore, J. Pentimonti, M. Pistilli, L. Cyert, T. R. Candy, G. Quinn, and G. S. Ying. 2016. Uncorrected hyperopia and preschool early literacy: Results of the Vision in Preschoolers–Hyperopia in Preschoolers (VIP-HIP) study. Ophthalmology 123(4):681–689.
Kyrou, I., H. S. Randeva, and M. O. Weickert. 2000. Clinical problems caused by obesity. In Endotext, L. J. De Groot, P. Beck-Peccoz, G. Chrousos, K. Dungan, A. Grossman, J. M. Hershman, C. Koch, R. McLachlan, M. New, R. Rebar, F. Singer, A. Vinik and M. O. Weickert (eds.). South Dartmouth, MA: MDText.com, Inc.
La Torre, G., E. Pacella, R. Saulle, G. Giraldi, F. Pacella, T. Lenzi, O. Mastrangelo, F. Mirra, G. Aloe, P. Turchetti, C. Brillante, G. De Paolis, A. Boccia, and R. Giustolisi. 2013. The synergistic effect of exposure to alcohol, tobacco smoke and other risk factors for age-related macular degeneration. European Journal of Epidemiology 28(5):445–446.
Lanting, L. C., I. M. Joung, J. P. Mackenbach, S. W. Lamberts, A. H. Bootsma. 2005. Ethnic differences in mortality, end-stage complications, and quality of care among diabetic patients: A review. Diabetes Care 28(9):2280–2288.
Lavanya, R., R. Kawasaki, W. T. Tay, G. C. Cheung, P. Mitchell, S. M. Saw, T. Aung, and T. Y. Wong. 2010. Hyperopic refractive error and shorter axial length are associated with age-related macular degeneration: The Singapore Malay Eye Study. Investigative Ophthalmology & Visual Science 51(12):6247–6252.
Leske, M. C., S.-Y. Wu, A. Hennis, A. M. Connell, L. Hyman, A. Schachat, and B. E. S. Group. 1999. Diabetes, hypertension, and central obesity as cataract risk factors in a black population: The Barbados Eye Study. Ophthalmology 106(1):35–41.
Li, Y., S. Xirasagar, C. Pumkam, M. Krishnaswamy, and C. L. Bennett. 2013. Vision insurance, eye care visits, and vision impairment among working-age adults in the United States. JAMA Ophthalmology 131(4):499–506.
Lim, A., J. Stewart, T. Y. Chui, M. Lin, K. Ray, T. Lietman, T. Porco, L. Jung, S. Seiff, and S. Lin. 2008. Prevalence and risk factors of diabetic retinopathy in a multi-racial underserved population. Ophthalmic Epidemiology 15(6):402–409.
Lim, L. S., P. Mitchell, J. M. Seddon, F. G. Holz, and T. Y. Wong. 2012. Age-related macular degeneration. Lancet 379(9827):1728–1738.
Lindblad, B. E., N. Håkansson, H. Svensson, B. Philipson, and A. Wolk. 2005. Intensity of smoking and smoking cessation in relation to risk of cataract extraction: A prospective study of women. American Journal of Epidemiology 162(1):73–79.
Lindblad, B. E., N. Håkansson, and A. Wolk. 2014. Smoking cessation and the risk of cataract: A prospective cohort study of cataract extraction among men. JAMA Ophthalmology 132(3):253–257.
Linetsky, M., C. T. Raghavan, K. Johar, X. Fan, V. M. Monnier, A. R. Vasavada, and R. H. Nagaraj. 2014. UVA light-excited kynurenines oxidize ascorbate and modify lens proteins through the formation of advanced glycation end products: Implications for human lens aging and cataract formation. Journal of Biological Chemistry 289(24):17111–17123.
Lu, B., N. Congdon, X. Liu, K. Choi, D. S. Lam, M. Zhang, M. Zheng, Z. Zhou, L. Li, X. Liu, A. Sharma, and Y. Song. 2009. Associations between near work, outdoor activity, and myopia among adolescent students in rural China: The Xichang Pediatric Refractive Error Study report no. 2. Archives of Ophthalmology 127(6):769–775.
Lu, Y., L. Serpas, P. Genter, C. Mehranbod, D. Campa, and E. Ipp. 2016. Disparities in diabetic retinopathy screening rates within minority populations: Differences in reported screening rates among African American and Hispanic patients. Diabetes Care 39(3):e31–e32.
Luo, H., G. L. Beckles, X. Fang, J. E. Crews, J. B. Saaddine, and X. Zhang. 2012. Socioeconomic status and lifetime risk for workplace eye injury reported by a U.S. population aged 50 years and over. Ophthalmic Epidemiology 19(2):103–110.
Maconachie, G. D., I. Gottlob, and R. J. McLean. 2013. Risk factors and genetics in common comitant strabismus: A systematic review of the literature. JAMA Ophthalmology 131(9):1179–1186.
Magone, M. T., E. Kwon, and S. Y. Shin. 2014. Chronic visual dysfunction after blast-induced mild traumatic brain injury. Journal of Rehabilitation Research & Development 51(1):71–80.
Martinez-Thompson, J. M., N. N. Diehl, J. M. Holmes, and B. G. Mohney. 2014. Incidence, types, and lifetime risk of adult-onset strabismus. Ophthalmology 121(4): 877–882.
Master, C. L., M. Scheiman, M. Gallaway, A. Goodman, R. L. Robinson, S. R. Master, and M. F. Grady. 2016. Vision diagnoses are common after concussion in adolescents. Clinical Pediatrics (Philadelphia) 55(3):260–267.
McCarty, C. A., and H. R. Taylor. 2002. A review of the epidemiologic evidence linking ultraviolet radiation and cataracts. Developments in Ophthalmology 35:21–31.
McCarty, C. A., M. B. Nanjan, and H. R. Taylor. 2001. Vision impairment predicts 5 year mortality. British Journal of Ophthalmology 85(3):322–326.
McKean-Cowdin, R., S. A. Cotter, K. Tarczy-Hornoch, G. Wen, J. Kim, M. Borchert, R. Varma, and the Multi-Ethnic Pediatric Eye Disease Study Group. 2013. Prevalence of amblyopia or strabismus in Asian and non-Hispanic white preschool children: Multi-Ethnic Pediatric Eye Disease Study. Ophthalmology 120(10):2117–2124.
MEPEDS (Multi-Ethnic Pediatric Eye Disease Study) Group. 2008. Prevalence of amblyopia and strabismus in African American and Hispanic children ages 6 to 72 months: The Multi-Ethnic Pediatric Eye Disease Study. Ophthalmology 115(7):1229–1236, e1221.
———. 2009. Prevalence and causes of visual impairment in African-American and Hispanic preschool children: The Multi-Ethnic Pediatric Eye Disease Study. Ophthalmology 116(10):1990–2000, e1991.
———. 2010. Prevalence of myopia and hyperopia in 6 to 72 months old African American and Hispanic children: The Multi-Ethnic Pediatric Eye Disease Study. Ophthalmology 117(1):140.
Mimeault, M., and S. K. Batra. 2008. Recent progress on tissue-resident adult stem cell biology and their therapeutic implications. Stem Cell Reviews 4(1). DOI:10.1007/s 12015-12008-19008-12012.
———. 2012. Great promise of tissue-resident adult stem/progenitor cells in transplantation and cancer therapies. Advances in Experimental Medicine and Biology 741:171–186.
Mishra, A., and A. K. Verma. 2012. Sports related ocular injuries. Medical Journal of Armed Forces India 68(3):260–266.
Miyazawa-Hoshimoto, S., K. Takahashi, H. Bujo, N. Hashimoto, and Y. Saito. 2003. Elevated serum vascular endothelial growth factor is associated with visceral fat accumulation in human obese subjects. Diabetologia 46(11):1483–1488.
Mousavi, M., and R. A. Armstrong. 2013. Genetic risk factors and age-rated macular degeneration. Journal of Optometry 6(4):176–184.
Mukesh, B. N., A. Le, P. N. Dimitrov, S. Ahmed, H. R. Taylor, and C. A. McCarty. 2006. Development of cataract and associated risk factors: The Visual Impairment Project. Archives of Ophthalmology 124(1):79–85.
Muñoz, B., S. K. West, G. S. Rubin, et al. 2000. Causes of blindness and visual impairment in a population of older Americans: The Salisbury Eye Evaluation Study. Archives of Ophthalmology 118(6):819–825.
NEI/NIH (National Eye Institute/National Institutes of Health). 2009. Facts about cataract. https://nei.nih.gov/health/cataract/cataract_facts (accessed April 7, 2016).
———. 2010a. 2010 U.S. age-specific prevalence rates for hyperopia by age, and race/ethnicity. https://nei.nih.gov/eyedata/hyperopia (accessed April 7, 2016).
———. 2010b. 2010 U.S. age-specific prevalence rates for myopia by age, and race/ethnicity. https://nei.nih.gov/eyedata/myopia (accessed May 20, 2016).
———. 2010c. Age-related macular degeneration (AMD). https://nei.nih.gov/eyedata/amd (accessed May 20, 2016).
———. 2010d. Cataracts. https://nei.nih.gov/eyedata/cataract (accessed April 20, 2016).
———. 2010e. Diabetic retinopathy defined. https://nei.nih.gov/eyedata/diabetic (accessed May 20, 2016).
———. 2010f. Facts about refractive errors. https://www.nei.nih.gov/health/errors (accessed February 16, 2016).
———. 2010g. Facts about astigmatism. https://nei.nih.gov/health/errors/astigmatism (accessed August 10, 2016).
———. 2010h. Glaucoma, open-angle. https://nei.nih.gov/eyedata/glaucoma (accessed September 3, 2016).
———. 2010i. Open-angle glaucoma defined tables. https://nei.nih.gov/eyedata/glaucoma/tables (accessed May 20, 2016).
———. 2010j. Prevalence of adult vision impairment and age-related eye diseases in America. https://nei.nih.gov/eyedata/adultvision_usa (accessed February 17, 2016).
———. 2012a. Drawing of the eye. https://www.flickr.com/photos/nationaleyeinstitute/7544457228 (accessed May 20, 2016).
———. 2012b. Facts about diabetic eye disease. https://www.nei.nih.gov/health/diabetic/retinopathy (accessed May 20, 2016).
———. 2012c. Facts about diabetic retinopathy. https://www.nei.nih.gov/health/diabetic/retinopathy (accessed May 20, 2016).
———. 2012d. Vision research needs, gaps, and opportunities. Bethesda, MD: NIH. https://nei.nih.gov/sites/default/files/nei-pdfs/VisionResearch2012.pdf (accessed May 20, 2016).
———. 2013. Facts about age-related macular degeneration. https://www.nei.nih.gov/health/maculardegen/armd_facts (accessed May 20, 2016).
———. 2015. Facts about glaucoma. https://nei.nih.gov/health/glaucoma/glaucoma_facts (accessed October 7, 2015).
———. 2016a. About sports eye injury and protective eyewear. https://nei.nih.gov/sports (accessed May 20, 2016).
———. 2016b. NEI news. https://nei.nih.gov (accessed May 20, 2016).
Nittala, M. G., P. A. Keane, K. Zhang, and S. R. Sadda. 2014. Risk factors for proliferative diabetic retinopathy in a Latino American population. Retina 34(8):1594–1599.
Nsiah-Kumi, P., S. R. Ortmeier, and A. E. Brown. 2009. Disparities in diabetic retinopathy screening and disease for racial and ethnic minority populations—A literature review. Journal of National Medical Association 101(5):430–437.
Nussenblatt, R. B., R. W. Lee, E. Chew, B. Liu, H. N. Sen, A. D. Dick, F. L. Ferris. 2014. American Journal of Ophthalmology 158(1):5–11.
O’Brien, T. P., B. H. Jeng, M. McDonald, and M. B. Raizman. 2009. Acute conjunctivitis: Truth and misconceptions. Current Medical Research Opinion 25(8):1953–1961.
O’Donoghue, L., V. V. Kapetanankis, J. F. McClelland, N. S. Logan, C. G. Owen, K. J. Saunders, and A. R. Rudnicka. 2015. Risk factors for childhood myopia: Findings from the NICER study. Investigative Ophthalmology & Visual Science 56(3):1524–1530.
Oh, S. W., S. Lee, C. Park, and D. J. Kim. 2005. Elevated intraocular pressure is associated with insulin resistance and metabolic syndrome. Diabetes/Metabolism Research and Reviews 21(5):434–440.
Orlansky, G., J. Wilmer, M. B. Taub, D. Rutner, E. Ciner, and J. Gryczynski. 2015. Astigmatism and early academic readiness in preschool children. Optometry and Vision Science 92(3):279–285.
Osaadon, P., X. J. Fagan, T. Lifshitz, and J. Levy. 2014. A review of anti-VEGF agents for proliferative diabetic retinopathy. Eye 28(5):510–520.
Owens, P. L., and R. Mutter. 2011. Emergency department visits related to eye injuries, 2008. http://www.hcup-us.ahrq.gov/reports/statbriefs/sb112.pdf (accessed June 17, 2016).
Owsley, C. 2011. Aging and vision. Vision Research 51(13):1610–1622.
Pan, C.-W., and Y. Lin. 2014. Overweight, obesity, and age-related cataract: A meta-analysis. Optometry and Vision Science 91(5):478–483.
Pan, C.-W., D. Ramamurthy, and S. M. Saw. 2012. Worldwide prevalence and risk factors for myopia. Ophthalmic and Physiological Optics 32(1):3–16.
Pan, C.-W., M. K. Ikram, C. Y. Cheung, H. W. Choi, C. M. Cheung, J. B. Jonas, S. M. Saw, T. Y. Wong. 2013. Refractive errors and age-related macular degeneration: A systematic review and meta-analysis. Ophthalmology 120(10):2058–2065.
Park, D. H., J. P. Shin, and S. Y. Kim. 2010. Comparison of clinical outcomes between 23-gauge and 20-gauge vitrectomy in patients with proliferative diabetic retinopathy. Retina 30(10):1662–1670.
Park, S., and E.-H. Lee. 2015. Association between metabolic syndrome and age-related cataract. International Journal of Ophthalmology 8(4):804.
Parssinen, O., M. Kauppinen, and A. Viljanen. 2014. The progression of myopia from its onset at age 8–12 to adulthood and the influence of heredity and external factors on myopic progression: A 23-year follow-up study. Acta Ophthalmologica 92(8):730–739.
Pascual, M., J. Huang, M. G. Maguire, M. T. Kulp, G. E. Quinn, E. Ciner, L. A. Cyert, D. Orel-Bixler, B. Moore, and G. S. Ying. 2014. Risk factors for amblyopia in the vision in preschoolers study. Ophthalmology 121(3):622–629, e621.
PEDIG (Pediatric Eye Disease Investigator Group). 2003. The course of moderate amblyopia treated with patching in children: Experience of the Amblyopia Treatment Study. American Journal of Ophthalmology 136(4):620–629.
———. 2006. A randomized trial to evaluate two hours of daily patching for amblyopia in children. Ophthalmology 113(6):904–912.
———. 2012. Optical treatment of strabismic and combined strabismic-anisometropic amblyopia. Ophthalmology 119(1):150–158.
Petrash, J. M. 2013. Aging and age-related diseases of the ocular lens and vitreous body. Investigative Ophthalmology & Visual Science 54(14):ORSF54–ORSF59.
Pollreisz, A., and U. Schmidt-Erfurth. 2010. Diabetic cataract—Pathogenesis, epidemiology and treatment. Journal of Ophthalmology 2010:608751.
Prevent Blindness. 2012a. Vision impairment prevalence by age. http://www.visionproblemsus.org/vision-impairment/vision-impairment-by-age.html (accessed February 12, 2016).
———. 2012b. Vision problems in the U.S. http://www.visionproblemsus.org (accessed June 5, 2016).
———. 2012c. Vision problems in the U.S.: Blindness. http://visionproblemsus.org/cgi-bin/vpus.cgi (accessed July 5, 2016).
———. 2012d. Vision problems in the U.S.: Hyperopia. http://www.visionproblemsus.org/refractive-error/hyperopia.html (accessed February 16, 2016).
———. 2012e. Vision problems in the U.S.: Methods and sources. http://www.visionproblemsus.org/introduction/methods-and-sources.html (accessed July 5, 2016).
———. 2012f. Vision problems in the U.S.: Myopia. http://www.visionproblemsus.org/refractive-error/myopia.html (accessed February 16, 2016).
———. 2012g. Vision problems in the U.S.: Refractive error. http://www.visionproblemsus.org/refractive-error.html (accessed July 5, 2016).
———. 2012h. Vision problems in the U.S.: Vision impairment. http://visionproblemsus.org/cgi-bin/vpus.cgi (accessed July 5, 2016).
Qiu, M., S. Y. Wang, K. Singh, and S. C. Lin. 2014. Racial disparities in uncorrected and undercorrected refractive error in the United States. Investigative Ophthalmology & Visual Science 55(10):6996–7005.
Querques, G., P. J. Rosenfeld, E. Cavallero, E. Borrelli, F. Corvi, L. Querques, F. M. Bandello, and M. A. Zarbin. 2014. Treatment of dry age-related macular degeneration. Ophthalmic Research 52(3):107–115.
Ramdas, W. D., R. C. Wolfs, A. Hofman, P. T. de Jong, J. R. Vingerling, and N. M. Jansonius. 2011. Lifestyle and risk of developing open-angle glaucoma: The Rotterdam Study. Archives of Ophthalmology 129(6):767–772.
Ramsden, C. M., M. B. Powner, A.-J. F. Carr, M. J. K. Smart, L. da Cruz, and P. J. Coffey. 2013. Stem cells in retinal regeneration: Past, present and future. Development (Cambridge, England) 140(12):2576–2585.
Ramulu, P. Y., K. J. Corcoran, S. L. Corcoran, and A. L. Robin. 2007. Utilization of various glaucoma surgeries and procedures in Medicare beneficiaries from 1995 to 2004. Ophthalmology 114(12):2265–2270.
Rasmussen, H. M., and E. J. Johnson. 2013. Nutrients for the aging eye. Clinical Interventions in Aging 8:741.
Repka, M. X., F. Yu, F. Lum, and A. L. Coleman. 2013. Strabismus among aged Medicare beneficiaries: Impact of health status and region. Journal of the American Association for Pediatric Ophthalmology and Strabismus 17(4):391–394.
Repka, M. X., R. T. Kraker, J. M. Holmes, A. I. Summers, S. R. Glaser, C. N. Barnhardt, and D. R. Tien, and the Pediatric Eye Disease Investigator Group. 2014. Atropine vs patching for treatment of moderate amblyopia: Follow-up at 15 years of age of a randomized clinical trial. JAMA Ophthalmology 132(7):799–805.
Richter, G. M., and A. L. Coleman. 2016. Minimally invasive glaucoma surgery: Current status and future prospects. Clinical Ophthalmology 10:189–206.
Richter, G. M., J. Chung, S. P. Azen, R. Varma, and G. Los Angeles Latino Eye Study. 2009. Prevalence of visually significant cataract and factors associated with unmet need for cataract surgery: Los Angeles Latino Eye Study. Ophthalmology 116(12): 2327–2335.
Rose, K. A., I. G. Morgan, W. Smith, G. Burlutsky, P. Mitchell, and S. M. Saw. 2008. Myopia, lifestyle, and schooling in students of Chinese ethnicity in Singapore and Sydney. Archives of Ophthalmology 126(4):527–530.
Rosner, M. S., D. L. Feinberg, J. E. Doble, and A. J. Rosner. 2016. Treatment of vertical heterophoria ameliorates persistent post-concussive symptoms: A retrospective analysis utilizing a multi-faceted assessment battery. Brain Injury 30(3):311–317.
Roy, M. S. 2000. Diabetic retinopathy in African Americans with type 1 diabetes: The New Jersey 725: II. Risk factors. Archives of Ophthalmology 118(1):105–119.
Roy, M. S., and M. Affouf. 2006. Six-year progression of retinopathy and associated risk factors in African American patients with type 1 diabetes mellitus: The New Jersey 725. Archives of Ophthalmology 124(9):1297–1306.
Royle, P., H. Mistry, P. Auguste, D. Shyangdan, K. Freeman, N. Lois, and N. Waugh. 2015. Pan-retinal photocoagulation and other forms of laser treatment and drug therapies for non-proliferative diabetic retinopathy: Systematic review and economic evaluation. Health Technology Assessment 19(51):v–xxviii, 1–247.
Rudnicka, A. R., S. Mt-Isa, C. G. Owen, D. G. Cook, and D. Ashby. 2006. Investigative Ophthalmology & Visual Science 47(10):4251–4261.
Sach, T. H., A. J. E. Foss, R. M. Gregson, A. Zaman, F. Osborn, T. Masud, and R. H. Harwood. 2009. Second-eye cataract surgery in elderly women: A cost-utility analysis conducted alongside a randomized controlled trial. Eye 24(2):276–283.
Salowe, R. J. Salina, N. H. Farbman, A. Mohammed, J. Z. Warren, A. Rhodes, A. Brucker, M. Regina, E. Miller, P. S. Sankar, A. Lehman, and J. N. O’Brien. 2015. Primary open-angle glaucoma in individuals of African descent: A review of risk factors. Journal of Clinical & Experimental Ophthalmology 6(4):1–13.
Salt, A., and J. Sargent. 2014. Common visual problems in children with disability. Archives of Disease in Childhood 99(12):1163–1168.
Salvi, S. M., S. Akhtar, and Z. Currie. 2006. Ageing changes in the eye. Postgraduate Medical Journal 82(971):581–587.
Sayin, N., N. Kara, and G. Pekel. 2015. Ocular complications of diabetes mellitus. World Journal of Diabetes 6(1):92–108.
Schaumberg, D. A., W. G. Christen, S. E. Hankinson, and R. J. Glynn. 2001. Body mass index and the incidence of visually significant age-related maculopathy in men. Archives of Ophthalmology 119(9):1259–1264.
Scheiman, M. M., R. W. Hertle, R. T. Kraker, R. W. Beck, E. E. Birch, J. Felius, J. M. Holmes, J. Kundart, D. G. Morrison, M. X. Repka, and S. M. Tamkins. 2008. Patching vs atropine to treat amblyopia in children aged 7 to 12 years: A randomized trial. Archives of Ophthalmology 126(12):1634–1642.
Schmidl, D., G. Garhöfer, and L. Schmetterer. 2015. Nutritional supplements in age-related macular degeneration. Acta Ophthalmologica 93(2):105–121.
Seddon, J. M., R. E. Silver, M. Kwong, and B. Rosner. 2015. Risk prediction for progression of macular degeneration: 10 common and rare genetic variants, demographic, environmental, and macular covariates. Investigative Ophthalmology & Visual Science 56(4):2192–2202.
Shah, J., and S. Patel. 2015. Strabismus: Symptoms, pathophysiology, management, and precautions. International Journal of Science and Research 4(7):1510–1514.
Shahbazi, S., J. Studnicki, and C. W. Warner-Hillard. 2015. A cross-sectional retrospective analysis of the racial and geographic variations in cataract surgery. PLoS ONE 10(11):e0142459.
Sharma, A., and H. B. Hindman. 2014. Aging: A predisposition to dry eyes. Journal of Ophthalmology Article ID 781683:1–8.
Shi, Q., Y. Zhao, V. Fonseca, M. Krousel-Wood, and L. Shi. 2014. Racial disparity of eye examinations among the U.S. working-age population with diabetes: 2002–2009. Diabetes Care 37(5):1321–1328.
Shields, T., and P. D. Sloane. 1990. A comparison of eye problems in primary care and ophthalmology practices. Family Medicine 23(7):544–546.
Shim, S. H., S. G. Kim, J. H. Bae, H. G. Yu and S. J. Song. 2016. Risk factors for progression of early age-related macular degeneration in Koreans. Ophthalmic Epidemiology 23(2):80–87.
Shweikh, Y., F. Ko, M. P. Y. Chan, P. J. Patel, Z. Muthy, P. T. Khaw, J. Yip, N. Strouthidis, and P. J. Foster. 2015. Measures of socioeconomic status and self-reported glaucoma in the UK Biobank Cohort. Eye 29(10):1360–1367.
Sloan, F. A., A. P. Yashkin, Y. Chen. 2014. Gaps in receipt of regular eye examinations among medicare beneficiaries diagnosed with diabetes or chronic eye diseases. Ophthalmology 121(12):2452–2460.
Smith, A. F., and C. Waycaster. 2009. Estimate of the direct and indirect annual cost of bacterial conjunctivitis in the United States. BMC Ophthalmology 9(1):1.
Solerte, S., M. Fioravanti, N. Pezza, M. Locatelli, N. Schifino, N. Cerutti, S. Severgnini, M. Rondanelli, and E. Ferrari. 1997. Hyperviscosity and microproteinuria in central obesity: Relevance to cardiovascular risk. International Journal of Obesity and Related Metabolic Disorders 21(6):417–423.
Solomon, S. D., K. Lindsley, S. S. Vedula, M. G. Krzystolik, and B. S. Hawkins. 2014. Anti-vascular endothelial growth factor for neovascular age-related macular degeneration. Cochrane Database of Systematic Reviews 8:CD005139.
Sommer, A., J. M. Tielsch, J. Katz, H. A. Quigley, J. D. Gottsch, J. C. Javitt, J. F. Martone, R. M. Royall, K. A. Witt, and S. Ezrine. 1991. Racial differences in the cause-specific prevalence of blindness in East Baltimore. New England Journal of Medicine 325(20):1412–1417.
Spanakis, E. K., and S. H. Golden. 2013. Race/ethnic difference in diabetes and diabetes complications. Current Diabetes Reports 13(6):1–18.
Stegmann, B. J., and J. C. Carey. 2002. TORCH infections. Toxoplasmosis, other (syphilis, varicella-zoster, parvovirus B19), rubella, cytomegalovirus (CMV), and herpes infections. Current Women’s Health Report 2(4):253–258.
Stein, J. D., D. S. Grossman, K. M. Mundy, A. Sugar, and F. A. Sloan. 2011a. Severe adverse events after cataract surgery among Medicare beneficiaries. Ophthalmology 118(9):1716–1723.
Stelmack, J. A., T. Frith, D. Van Koevering, S. Rinne, and T. R. Stelmack. 2009. Visual function in patients followed at a Veterans Affairs polytrauma network site: An electronic medical record review. Optometry 80(8):419–424.
Stratton, I., E. Kohner, S. Aldington, R. Turner, R. Holman, S. Manley, and D. Matthews. 2001. UKPDS 50: Risk factors for incidence and progression of retinopathy in type II diabetes over 6 years from diagnosis. Diabetologia 44(2):156–163.
Tan, H. S., M. Mura, S. Y. Lesnik Oberstein, and H. M. Bijl. 2011. Safety of vitrectomy for floaters. American Journal of Ophthalmology 151(6):995–998.
Tan, J. S., J. J. Wang, C. Younan, R. G. Cumming, E. Rochtchina, and P. Mitchell. 2008. Smoking and the long-term incidence of cataract: The Blue Mountains Eye Study. Ophthalmic Epidemiology 15(3):155–161.
Tandon, A., and A. Mulvihill. 2009. Ocular teratogens: Old acquaintances and new dangers. Science 23:1269–1274.
Tapp, R. J., J. E. Shaw, C. A. Harper, M. P. de Courten, B. Balkau, D. J. McCarty, H. R. Taylor, T. A. Welborn, and P. Z. Zimmet. 2003. The prevalence of and factors associated with diabetic retinopathy in the Australian population. Diabetes Care 26(6):1731–1737.
Tarczy-Hornoch, K., Y. Wang, S. Cotter, M. Borchert, S. Azen, R. Varma, and MEPEDS Group. 2007. ATS HOTV visual acuity test results in African-American and Hispanic children: The Multi-Ethnic Pediatric Eye Disease Study. Investigative Ophthalmology & Visual Science 48(13):4827–4827.
Tarczy-Hornoch, K., R. Varma, S. A. Cotter, R. McKean-Cowdin, J. H. Lin, M. S. Borchert, M. Torres, G. Wen, S. P. Azen, J. M. Tielsch, D. S. Friedman, M. X. Repka, J. Katz, L. Giordano, and J. Ibironke. 2010. Risk factors for astigmatism in preschool children: The Multi-Ethnic Pediatric Eye Disease and Baltimore Pediatric Eye Disease Studies. Ophthalmology 118(10):1974–1981.
Tarczy-Hornoch, K., S. A. Cotter, M. Borchert, R. McKean-Cowdin, J. Lin, G. Wen, J. Kim, and R. Varma. 2013. Prevalence and causes of visual impairment in Asian and non-Hispanic white preschool children: Multi-Ethnic Pediatric Eye Disease study. Ophthalmology 120(6):1220–1226.
Taubenslag, K. J., and J. A. Kammer. 2016. Outcomes disparities between black and white populations in the surgical management of glaucoma. Seminars in Ophthalmology 31(4):385–393,
Thompson, J. R., J. M. Gibson, and C. Jagger. 1989. The association between visual impairment and mortality in elderly people. Age and Ageing 18(2):83–88.
Tielsch, J. M., A. Sommer, J. Katz, H. Quigley, and S. Ezrine. 1991. Socioeconomic status and visual impairment among urban Americans: Baltimore Eye Survey Research Group. Archives of Ophthalmology 109(5):637–641.
Torp-Pedersen, T., H. A. Boyd, G. Poulsen, B. Haargaard, J. Wohlfahrt, J. M. Holmes, and M. Melbye. 2010. In-utero exposure to smoking, alcohol, coffee, and tea and risk of strabismus. American Journal of Epidemiology 171(8):868–875.
Tseng, V. L., F. Yu, F. Lum, and A. L. Coleman. 2016. Cataract surgery and mortality in the United States Medicare population. Ophthalmology 123(5):1019–1026.
U.S. Census Bureau. 2015. New Census Bureau report analyzes U.S. population projections. http://www.census.gov/newsroom/press-releases/2015/cb15-tps16.html (accessed August 1, 2016).
USPSTF (U.S. Preventive Services Task Force). 2011. Evidence summary: Other supporting document for visual impairment in children ages 1–5: Screening. http://www.uspreventiveservicestaskforce.org/Page/Document/evidence-summary5/visual-impairment-in-children-ages-1-5-screening (accessed August 28, 2016).
Valentine, G., L. Marquez, and M. Pammi. 2016. Zika virus-associated microencephaly and eye lesions in the newborn. Journal of the Pediatric Infectious Disease Society 5(3):323–328.
Varma, R., S. Fraser-Bell, S. Tan, R. Klein, and S. P. Azen. 2004a. Prevalence of age-related macular degeneration in Latinos: The Los Angeles Latino Eye Study. Ophthalmology 111(7):1288–1297.
Varma, R., M. Ying-Lai, R. Klein, and S. P. Azen. 2004b. Prevalence and risk indicators of visual impairment and blindness in Latinos: The Los Angeles Latino Eye Study. Ophthalmology 111(6):1132–1140.
Varma, R., M. Ying-Lai, B. A. Francis, B. B.-T. Nguyen, J. Deneen, M. R. Wilson, and S. P. Azen. 2004c. Prevalence of open-angle glaucoma and ocular hypertension in Latinos. Ophthalmology 111(8):1439–1448.
Varma, R., G. L. Macias, M. Torres, R. Klein, F. Y. Pena, S. P. Azen, Los Angeles Latino Eye Study Group. 2007. Biologic risk factors associated with diabetic retinopathy: The Los Angeles Latino Eye Study. Ophthalmology 114(7):1332–1340.
Varma, R., P. P. Lee, I. Goldberg, and S. Kotak. 2011. An assessment of the health and economic burdens of glaucoma. American Journal of Ophthalmology 152(4):515–522.
Varma, R., T. S. Vajaranant, B. Burkemper, S. Wu, M. Torres, C. Hsu, F. Choudhury, and R. McKean-Cowdin. 2016. Visual impairment and blindness in adults in the United States: Demographic and geographic variations from 2015 to 2050. JAMA Ophthalmology.
Vitale, S., L. Ellwein, M. F. Cotch, F. L. Ferris, and R. Sperduto. 2008. Prevalence of refractive error in the United States, 1999–2004. Archives of Ophthalmology 126(8):1111–1119.
Vohr, B. R., L. L. Wright, A. M. Dusick, L. Mele, J. Verter, J. J. Steichen, N. P. Simon, D. C. Wilson, S. Broyles, C. R. Bauer, V. Delaney-Black, K. A. Yolton, B. E. Fleisher, L.-A. Papile, and M. D. Kaplan. 2000. Neurodevelopmental and functional outcomes of extremely low birth weight infants in the National Institute of Child Health and Human Development neonatal research network, 1993–1994. Pediatrics 105(6):1216–1226.
von Noorden G. K., and E. C. Campos. 2002. Binocular vision and ocular motility: Theory and management of strabismus. 6. St. Louis, MO: Mosby. P. 548.
Wadwa, S. D., and E. J. Higginbotham. 2005. Ethnic differences in glaucoma: Prevalence, management, and outcome. Current Opinion Ophthalmology 16(2):1010–1016.
Walline, J. J., K. Lindsley, S. S. Vedula, S. A. Cotter, D. O. Mutti, and J. D. Twelker. 2011. Interventions to slow progression of myopia in children. Cochrane Database of Systematic Reviews (12):Cd004916.
Wang, D., Y. Huang, C. Huang, P. Wu, J. Lin, Y. Zheng, Y. Peng, Y. Liang, J.-H. Chen, and M. Zhang. 2012. Association analysis of cigarette smoking with onset of primary open-angle glaucoma and glaucoma-related biometric parameters. BMC Ophthalmology 12(1):59.
Watkinson, S., and R. Seewoodhary. 2008. Ocular complications associated with diabetes mellitus. Nursing Standard 22(27):51–57.
Weinreb, R. N., T. Aung, and F. A. Medeiros. 2014. The pathophysiology and treatment of glaucoma: A review. JAMA 311(18):1901–1911.
Wen, G., K. Tarczy-Hornoch, R. McKean-Cowdin, S. A. Cotter, M. Borchert, J. Lin, J. Kim, R. Varma, and the Multi-Ethnic Pediatric Eye Disease Study Group. 2013. Prevalence of myopia, hyperopia, and astigmatism in non-Hispanic white and Asian children. Ophthalmology 120(10):2109–2116.
West, S. K., B. Munoz, G. S. Rubin, O. D. Schein, K. Bandeen-Roche, S. Zeger, S. German, and L. P. Fried. 1997. Function and visual impairment in a population-based study of older adults: The SEE project. Investigative Ophthalmology & Visual Science 38(1):72–82.
Williams, P. T. 2009. Prospective epidemiological cohort study of reduced risk for incident cataract with vigorous physical activity and cardiorespiratory fitness during a 7-year follow-up. Investigative Ophthalmology & Visual Science 50(1):95–100.
Wittenborn, J., and D. Rein. 2016 (unpublished). The potential costs and benefits of treatment for undiagnosed eye disorders. Paper prepared for the Committee on Public Health Approaches to Reduce Vision Impairment and Promote Eye Health. http://www.nationalacademies.org/hmd/~/media/Files/Report%20Files/2016/UndiagnosedEyeDisordersCommissionedPaper.pdf (accessed September 15, 2016).
Wittenborn, J. S., X. Zhang, C. W. Feagan, W. L. Crouse, S. Shrestha, A. R. Kemper, T. J. Hoerger, and J. B. Saaddine. 2013. The economic burden of vision loss and eye disorders among the United States population younger than 40 years. Ophthalmology 120(9):1728–1735.
Wolfs, R. C., C. C. Klaver, R. S. Ramrattan, C. M. van Duijn, A. Hofman, and P. T. de Jong. 1998. Genetic risk of primary open-angle glaucoma: Population-based familial aggregation study. Archives of Ophthalmology 116(12):1640–1645.
Wong, T. Y., N. Cheung, W. T. Tay, J. J. Wang, T. Aung, S. M. Saw, S. C. Lim, E. S. Tai, and P. Mitchel. 2008. Prevalence and risk factors for diabetic retinopathy: The Singapore Malay Eye Study. Ophthalmology 115(11):1869–1875.
Worley, A., and K. Grimmer-Somers. 2011. Risk factors for glaucoma: What do they really mean? Australian Journal of Primary Health 17(3):233–239.
Wormald, R., J. Evans, L. Smeeth, and K. Henshaw. 2007. Photodynamic therapy for neovascular age-related macular degeneration. Cochrane Database of Systematic Reviews (3):CD002030.
Wu, E. W., D. A. Schaumberg, and S. K. Park. 2014. Environmental cadmium and lead exposures and age-related macular degeneration in U.S. adults: The National Health and Nutrition Examination Survey, 2005 to 2008. Environmental Research 133:178–184.
Wu, W., and R. G. Ariyasu. 1999. Cornea and external disease. In Clinical guide to comprehensive ophthalmology, edited by D. A. Lee and E. J. Higginbotham. New York: Thieme Medical Publishers. Pp. 183–264.
Xiang, H., L. Stallones, G. Chen, and G. A. Smith. 2005. Work-related eye injuries treated in hospital emergency departments in the U.S. American Journal of Industrial Medicine 48(1):57–62.
Yau, J. W., S. L. Rogers, R. Kawasaki, E. L. Lamoureux, J. W. Kowalski, T. Bek, S. J. Chen, J. M. Dekker, A. Fletcher, J. Grauslund, S. Haffner, R. F. Hamman, M. K. Ikram, T. Kayama, B. E. Klein, R. Klein, S. Krishnaiah, K. Mayurasakorn, J. P. O’Hare, T. J. Orchard, M. Porta, M. Rema, M. S. Roy, T. Sharma, J. Shaw, H. Taylor, J. M. Tielsch, R. Varma, J. J. Wang, N. Wang, S. West, L. Xu, M. Yasuda, X. Zhang, P. Mitchell, and T. Y. Wong. 2012. Global prevalence and major risk factors of diabetic retinopathy. Diabetes Care 35(3):556–564.
Ye, J., J. He, C. Wang, H. Wu, X. Shi, H. Zhang, J. Xie, and S. Y. Lee. 2012. Smoking and risk of age-related cataract: A meta-analysis. Investigative Ophthalmology & Visual Science 53(7):3885–3895.
Yip, J. L., R. Luben, S. Hayat, A. P. Khawaja, D. C. Broadway, N. Wareham, K. T. Khaw, and P. J. Foster. 2014. Area deprivation, individual socioeconomic status and low vision in the EPIC-Norfolk Eye Study. Journal of Epidemiology & Community Health 68(3):204–210.
Yoshida, M., M. Ishikawa, K. Karita, A. Kokaze, M. Harada, S. Take, and H. Ohno. 2014. Association of blood pressure and body mass index with intraocular pressure in middle-aged and older Japanese residents: A cross-sectional and longitudinal study. Acta Medica Okayama 68(1):27–34.
Yu, C-H. 2015. Origins of adolescent obesity and hypertension. Pediatrics and Neonatology 56(5):285–286.
Yu, X., D. Lyu, X. Dong, J. He, and K. Yao. 2014. Hypertension and risk of cataract: A meta-analysis. PLoS ONE 9(12):e114012.
Zadnik, K. 1997. Myopia development in childhood. Optometry and Vision Science 74(8):603–608.
Zadnik, K., W. A. Satariano, D. O. Mutti, R. I. Sholtz, and A. J. Adams. 1994. The effect of parental history of myopia on children’s eye size. JAMA 271(17):1323–1327.
Zadnik, K., L. T. Sinnott, S. A. Cotter, L. A. Jones-Jordan, R. N. Kleinstein, R. E. Manny, J. D. Twelker, D. O. Mutti, Collaborative Longitudinal Evaluation of Ethnicity and Refractive Error (SLEERE Study Group). 2015. Prediction of juvenile-onset myopia. JAMA Ophthalmology 133(6):683–689.
Zambelli-Weiner, A., J. E. Crews, and D. S. Friedman. 2012. Disparities in adult vision health in the United States. American Journal of Ophthalmology 154(6 Suppl):S23–S30, e21.
Zebardast, N., B. K. Swenor, S. W. van Landingham, R. W. Massof, B. Munoz, S. K. West, and P. Y. Ramulu. 2015. Comparing the impact of refractive and nonrefractive vision loss on functioning and disability: The Salisbury Eye Evaluation. Ophthalmology 122(6): 1102–1110.
Zetterberg, M. 2016. Age-related eye disease and gender. Maturitas 83:19–26.
Zhang, X., J. B. Saaddine, C. Chou, et al. 2010. Prevalence of diabetic retinopathy in the United States, 2005–2008. JAMA 304(6):649–656.
———. 2012. Vision health disparities in the United States by race/ethnicity, education, and economic status: Findings from two nationally representative surveys. American Journal of Ophthalmology 154(6 Suppl):S53–S62, e51.
Zhao, D., J. Cho, M. H. Kim, D. S. Friedman, and E. Guallar. 2015. Diabetes, fasting glucose, and the risk of glaucoma: A meta-analysis. Ophthalmology 122(1):72–78.
Zheng Selin, J., N. Orsini, B. Ejdervik Lindblad, and A. Wolk. 2015. Long-term physical activity and risk of age-related cataract: A population-based prospective study of male and female cohorts. Ophthalmology 122(2):274–280.
This page intentionally left blank.


