
4
The Complex U.S. System of Workforce Education and Training
Education and training take place in a variety of contexts in the United States. There is no single, formal system for training workers, and Americans are responsible for finding their own path, based on their preferences, capacities, and means. Students are encouraged to begin making these choices at the secondary school level, when they have the option to pursue both academic and technical education. After earning a high school diploma, students may enter full-time employment in a technically skilled job, continue their education and training, or do both at the same time. Americans can select from a large menu of degree- and non-degree-granting postsecondary education and training programs at any time during their work lives. Unless students receive scholarships, grants, or education benefits from public or private sources, they are ultimately responsible for paying all the costs associated with their education and training by drawing on savings or current earnings or by incurring debt.
The federal, state, and local governments provide resources that support education and training both directly and indirectly. In addition, although the incentives for employers to support education and training for workers are highly variable, many employers either provide education and training directly to workers on the job or subsidize their employees’ education and training through reimbursement programs. But whether employees are using these programs to their greatest advantage and to what extent employers are contributing to the development of a skilled technical workforce remain unclear.
This chapter describes the complexities of workforce development in the United States and the components of this system that are particularly relevant for preparing skilled technical workers. Section 4.1 introduces the quasi-public characteristic of education and training. Section 4.2 describes the primary components of workforce development, including career and technical education (CTE) and degree-granting postsecondary education and training programs. Section 4.3 examines other postsecondary education and training programs, including apprenticeship, certificate, and certification programs, that do not
confer a degree. Section 4.4 reviews key funding sources for skilled technical workforce education and training, including federal, state, and employer sources. Section 4.5 presents conclusions.
4.1 EDUCATION AND TRAINING AS A QUASI-PUBLIC GOOD
Education and training are examples of a quasi-public good, having characteristics of both private and public goods. Society as a whole is better off when all of its members are able to develop their innate capacities. Education and training also can potentially serve public purposes by ensuring the availability of a pool of workers who can contribute to economic growth. At the same time, the benefits of private investments in education and training potentially accrue to individuals in the form of opportunities and wages. Hence both society and individuals have a role to play with respect to investment in education and training.1
Given that both the costs and benefits associated with investments in education and training affect individuals, employers, and the broader society, it can be difficult to separate, measure, and allocate returns on these investments.2 For example, by observing others, their way of doing things, and the knowledge products they produce, one can educate and train oneself. In other words, knowledge and learning spill over to others, and it is difficult to fully recover the costs of production and distribution. Moreover, because some of the benefits accrue to society as a whole, individuals may undervalue and underinvest in education and training, suggesting a role for public provision or subsidies (Cornes and Sandler, 1996).
Americans have a long history of pursuing and publicly supporting elementary and secondary education and training. The colonists began to establish public schools in the early 1600s; Boston Latin School was established in 1635. By the time of the Revolution, some colonies, such as Georgia, were partially funding grammar schools (Education News, 2013). By 1918, attendance in elementary school was compulsory in all states, and by 1920
__________________
1 Several theories aim to explain why individuals invest in education and training. For example, Becker (1964, 1993) conceptualizes the set of marketable skills of workers as a form of capital in which workers make a variety of investments to obtain better opportunities and wages. Alternatively, Spence (1973, 2002) conceptualizes education and training as a way for individuals to signal the nature of their abilities to prospective employers and thereby gain above-average wages. Theoretical perspectives are potentially important in understanding investment incentives and the structure of wages and earnings. However, exploring the range of theories and the evidence that supports them is beyond the scope of this study.
2 For a more detailed explanation and the theoretical underpinnings of this analysis, see Cornes and Sandler (1996).
roughly one-third of Americans aged 14-17 had attended some form of secondary school. During the period 1940-2014, the percentage of U.S. adults with a high school degree increased from 24.1 to 88.3 percent (Ryan and Bauman, 2016, Table A-1).
In contrast with many other countries that are members of the Organisation for Economic Co-operation and Development (OECD), however, most federal- and state-level policies in the United States treat postsecondary education more like a private good than a public or quasi-public good. These policies often assume that workers will capture all of the returns on their investments in education and training and that no one else in society will benefit from those investments. Yet despite this fundamental misalignment of incentives, education is valued by an increasing proportion of the population. During the period 1967-2013, the percentage of Americans who completed high school and then enrolled in either a 2- or 4-year degree-granting institution increased from 25.5 to 68.4 percent (BLS, 2016a). Moreover, approximately 44 percent of individuals aged 16 or older participate in some form of formal adult education, such as basic skills training, apprenticeships, work-related courses, personal-interest courses, English as a second language classes, part-time college, or university degree programs (NCES, 2007).
Seeking to further invigorate commitment to workforce development, the OECD secretary general argued in a 2012 report that skills have become the “global currency” of 21st-century economies. Reflecting on the results of a survey conducted by the Programme for the International Assessment of Adult Competencies, he urged member countries to find ways to improve skill levels and invest continuously in the identification and acquisition of new skills so these countries can effectively organize and compete in the 21st century (OECD, 2012a).
4.2 THE PRIMARY COMPONENTS OF WORKFORCE DEVELOPMENT
As in many other aspects of public life, the United States does not have a single, formal system for educating and training workers. Americans who wish to develop technical skills and prepare themselves for success in skilled technical occupations have a wide range of education and training options that depend on several factors, including their access to funding, their social networks, the availability of programs in their geographic location, and their interests.
These specifics aside, in general Americans have the range of formal options for skilled technical education and training depicted in Figure 4-1, which they may pursue simultaneously, sequentially, or in idiosyncratic order. Beginning with secondary education, students may choose to take advantage of
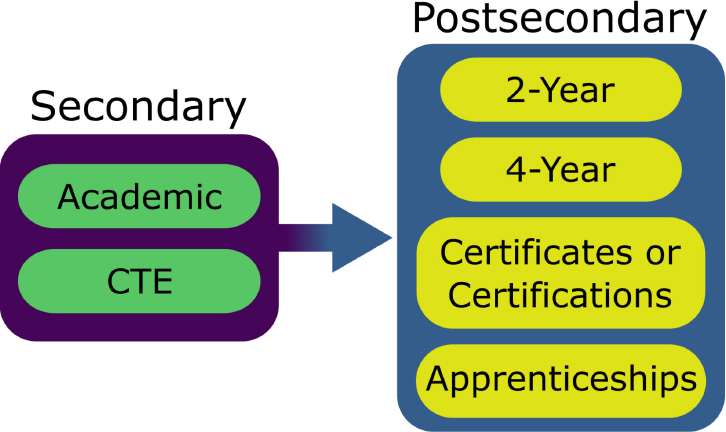
NOTE: CTE = career and technical education.
CTE programs offered, often in conjunction with cooperative work experience programs, in comprehensive high schools, full-time CTE schools, and area or regional CTE centers. CTE students can take work-related courses in subjects related to skilled technical occupations, acquire hands-on work experience, and prepare to enter full-time employment upon obtaining their high school diploma. Some proponents argue that secondary CTE is valuable because it serves as pedagogy for science, technology, engineering, and mathematics (STEM) subjects. Because many students learn better with a hands-on approach and skilled technical CTE requires some level of STEM proficiency, secondary CTE provides a way to reinforce and integrate academic education and technical training. Moreover, if CTE programs are overseen by effective committees whose members come from business and industry, they can advise CTE educators, administrators, and education board members on employment needs and requirements.
Concurrent with secondary studies or upon graduation from high school, a student may prepare for a skilled technical occupation through programs in an institution of higher education; an organization that certifies skill competencies, such as an industry association or professional society; or an apprenticeship. Finally, youth and adults may enroll in skilled technical job training through
various programs funded by the Workforce Innovation and Opportunity Act (WIOA) through the American Job Centers or community-based organizations.3
To inform understanding of the education and training decisions being made by students and workers, the following subsections review enrollment and other salient quantitative data for formal skilled technical education and training programs.4
4.2.1 Secondary Career and Technical Education
The U.S. Department of Education reports that from 1990 to 2009, the average number of CTE credits earned by U.S. public high school graduates declined from 4.2 to 3.6, while the average number of credits earned in other subject areas increased. By contrast, average credits earned in core academic fields (i.e., English, mathematics, science, and social studies) rose during this same period. Also in this period, the percentage of graduates who reportedly earned credit in any occupational CTE area declined from 88 to 85 percent (NCES, 2013b). Within occupational CTE, however, the direction and magnitude of change differed by specific occupational area. Occupational areas with declining participation were business, manufacturing, computer and information sciences, engineering technologies, repair, and transportation. Occupational areas with increasing participation were communications and design, health care, public services, and consumer and culinary services, with communications and design being the area of greatest increase.
In the review of work-related education in high schools commissioned for this study, Stern (2015) found that CTE programs are provided in about 9,500 comprehensive high schools in the United States. In addition, he found that about 1,000 technical high schools offer both CTE and academic subjects, and about 800 area or regional technical schools offer only CTE courses.
Looking at trends in enrollment, Stern found that the percentage of high school graduates who concentrated in an occupational area by taking three or more CTE credits in the same area fell from 33 percent in 1982 to 19 percent in 2009. Overall, the percentages of CTE concentrators among high school graduates decreased among all socioeconomic, racial, and ethnic groups over the same period and are no longer skewed toward less-affluent students. As Table 4-1 shows, however, in the aggregate, CTE programs still enroll relatively large proportions of students from low-income families. Many CTE students
__________________
3 These programs are relatively small in scale. See Figure 3-2 in Chapter 3.
4 In addition to formal education and training options, some workers may elect to engage in self-study programs or to participate in employer-sponsored on-the-job training. However, it is difficult to find data on informal choices; hence, the analysis here is limited to formal programs.
| Group | Percentage in 2004 |
|---|---|
| Lowest socioeconomic quartile | 21 |
| Middle socioeconomic quartiles | 19 |
| Highest socioeconomic quartile | 12 |
| Black | 18 |
| Hispanic | 13 |
| White | 19 |
SOURCE: Compiled based on Stern (2015).
also have lower levels of prior academic performance. While these aggregate data may differ at the local and state levels, they suggest the need to raise awareness about the value of skilled technical work and the opportunities associated with CTE preparation. In addition, curricula need to address career awareness, exploration, and preparation in elementary as well as secondary school, and younger children need to have the opportunity to develop skills and explore technical work.
Looking at the percentage of CTE concentrators in 12th grade who state their expected level of education, Stern found that 54 percent aim to obtain a bachelor’s degree or higher, and another 28 percent expect to attend some college. Stern concludes that preparing students for immediate entry into full-time employment after high school is no longer a widely espoused goal: most students who take work-related courses in high school now also complete sufficient academic coursework to enter some form of postsecondary education.
4.2.2 Postsecondary Degree-Granting Institutions
The U.S. Department of Education reports that there were 4,207 degree-granting institutions—2,603 4-year and 1,604 2-year—in the United States in 2014-2015 (NCES, 2016c, Chapter 4). Figure 4-2 shows the number of degree-granting institutions with first-year undergraduates in the academic years 2000-2001 and 2014-2015 by level (4- or 2-year) and type (public, private nonprofit, or private for-profit) of institution. Most 2-year institutions were public (919), whereas most 4-year institutions were private nonprofit (1,283). One interesting change pertains to the total number of private for-profit institutions, which almost doubled from 687 in 2000-2001 to 1,258 in 2014-2015. However, most of this growth occurred in 4-year institutions, whose number more than tripled from 207 to 656, compared with an increase in 2-year institutions from 480 to 602.
Public, private nonprofit, and private for-profit institutions are regulated in different ways. These regulations may have consequences for innovation, scale, quality, cost-effectiveness, and other factors. Investigating regulatory differences is beyond the scope of this study; however, it may be useful for policy makers to examine these differences in detail in local contexts.
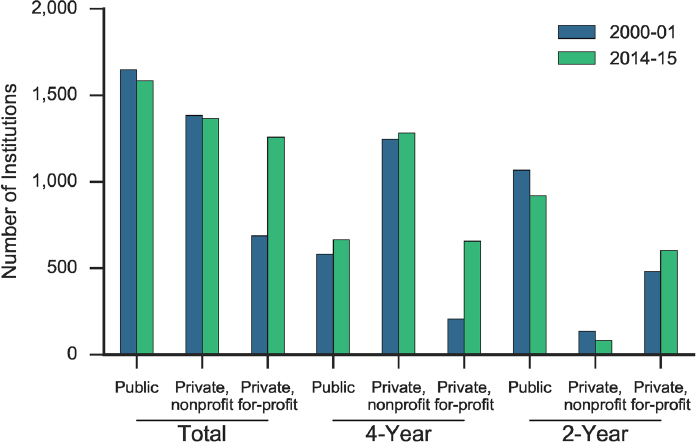
SOURCE: NCES, 2016c.
Degree-granting postsecondary institutions vary in many ways, but two dimensions in particular are frequently noted: admissions policies and completion rates.
In academic year 2014-2015, 29 percent of all 4-year institutions had open admissions policies (accepted all applicants). In that same year, a higher percentage of private for-profit 4-year institutions (66 percent) than private nonprofit (15 percent) and public (19 percent) 4-year institutions had open admissions policies. By contrast, the majority of 2-year institutions (91 percent) had open admissions policies. Open admissions policies were in operation at 98 percent of public 2-year institutions and 84 percent of private for-profit 2-year institutions, compared with 56 percent of private nonprofit 2-year institutions (NCES, 2016c).
Looking at completion rates, the majority (60 percent) of all first-time full-time undergraduates enrolled in 4-year institutions graduate within 6 years (NCES, 2016c). Private nonprofit institutions have the highest completion rates (65 percent), followed by public institutions (58 percent) and private for-profit institutions (just 27 percent). By contrast, only 28 percent of all first-time full-time undergraduates enrolled in 2-year institutions graduate within 150 percent of the normal time, and these statistics are skewed by low rates of completion in
public institutions, where just 20 percent of students graduate at all.5 The majority of students at private institutions graduate within 150 percent of the normal time, and students at for-profit institutions graduate at higher rates than those at nonprofit institutions (59 versus 51 percent).
4.2.3 Student Enrollment
In fall 2014, 17.3 million Americans were enrolled in a degree-granting institution (NCES, 2016c). Most of these students were enrolled in 4-year institutions (10.6 million), and the remainder in 2-year institutions (6.7 million). Students in 4-year institutions typically enroll full-time (76 percent), whereas students in 2-year institutions typically enroll part-time (70.4 percent). Data show rather modest participation in distance education. Students who do participate in this form of education appear to prefer combining it with residential learning: about 28 percent of students enroll in some distance education, whereas just 12 percent pursue all of their education and training through this modality (NCES, 2016c).
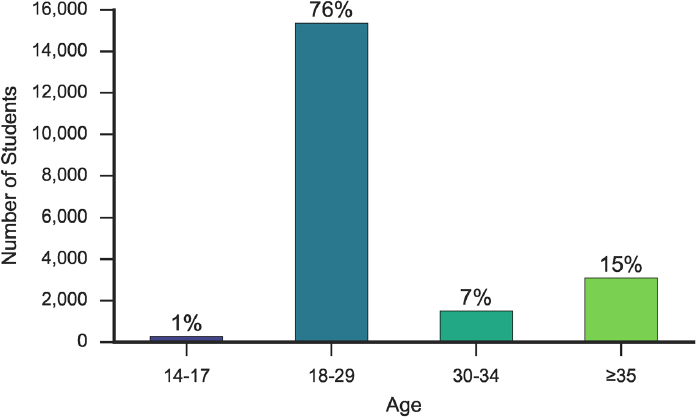
As Figure 4-3 shows, U.S. Department of Education statistics indicate that although most students of degree-granting institutions are young and in the early stages of their work life, a significant portion (22 percent) are age 30 or older. In contrast, just 1 percent of these students are under age 18. These data suggest that to support the achievement of skilled technical workforce objectives, institutions need to develop adept curriculum designs, pedagogy, and support services that are appropriate for students of a wide range of ages and experience levels. And given that young students will have different needs, options, and incentives from those of their older adult counterparts, policies and programs need to be designed to create incentives for both youth and older cohorts to invest in skilled technical education at all stages of their work lives.
4.2.4 Community Colleges
Most 2-year degree-granting institutions are community colleges, which are Title IV institutions that provide affordable postsecondary education and a potential pathway to a 4-year degree.6 Community colleges are a key component
__________________
5 Low completion rates impact the return on postsecondary vocational degrees and certificates. Chapter 5 reviews the evidence that the return is associated with receipt of the degree (the so-called “sheepskin effect”), not with the training alone.
6 Title IV of the Higher Education Act of 1965 (HEA) covers the administration of the U.S. federal student financial aid programs. American colleges and universities are generally classified with regard to their inclusion under Title IV, such as under U.S. Department of Education statistics.
SOURCE: Compiled based on NCES (2014a, Table 303.40).
of skilled technical workforce development in local economies. The American Association of Community Colleges (AACC) reports that 1,108 U.S. community colleges enroll approximately 12.3 million students, or about 45 percent of all undergraduate students in the United States (AACC, 2016).
The mission of community colleges is to provide education to all individuals in a local area, and as noted above, most have an open-access admissions policy. Community colleges offer a comprehensive range of education and training to support lifelong learning that includes both credit and noncredit programs. For example, community colleges typically offer associate’s degrees that are transferrable to 4-year degree programs, terminal associate’s degrees, certificates, certification, apprenticeships, and contract or custom training on a noncredit basis. According to AACC, most community college students (60 percent) are enrolled in credit programs on a part-time basis (AACC, 2016). In addition, most work while they attend school: 73 percent of part-time and 62 percent of full-time students work either part- or full-time. Most community college students also receive some form of financial assistance. The U.S. Department of Education reports that 78 percent of first-time 2-year degree-/certificate-seeking students receive financial assistance to meet the costs of tuition, books, and other educational expenses (NCES, 2016c).
Aggregate data suggest that public funds, particularly state and local funds, are crucial sources of revenue for community college operations. Table 4-2 shows that most community college revenues come from tuition (29.5 percent) and from state (29.8 percent) and local (18.1 percent) sources. AACC data for
TABLE 4-2 Community College Revenues by Source (2013-2014)
| Source | Revenue | % |
|---|---|---|
| Tuition | $17,242,025,437 | 29.5 |
| Federal | 8,264,032,954 | 14.1 |
| State | 17,442,989,183 | 29.8 |
| Local | 10,568,296,830 | 18.1 |
| Other | 4,929,830,599 | 8.4 |
| Total | $58,447,175,003 | 100.0 |
SOURCE: AACC, 2016.
academic year 2011-2012 reveal that although most student financial aid was received from federal sources, state and institutional aid were also important (AACC, 2016).7 In addition, in 2013-2014, community colleges received federal aid in the form of Pell Grants, Federal Supplemental Educational Opportunity Grants, and Federal Work-Study programs.
Researchers at Columbia University Teacher’s College report that 80 percent of community college students intend to earn a bachelor’s degree, but only one-quarter of them transfer to a 4-year institution within 5 years (Jenkins and Fink, 2015). However, AACC (2015) data indicate that community college students who earn an associate’s degree as a first credential are more likely to transfer to a 4-year institution to earn a bachelor’s degree: 41 percent of college students who earned an associate’s degree in 2008-2009 as a first credential subsequently earned a bachelor’s degree within 6 years. Community College Research Center analysts have shown that the completion outcomes of community college transfer students vary depending on the type of institution to which they transfer, as well as the number of credits accepted by the receiving institution (Jenkins and Fink, 2015). The analysis shows that approximately 72 percent of community college students who transferred went to public 4-year institutions. Data on bachelor’s degree completion 6 years after transfer show that 65 percent of students who transferred to a public 4-year college/university earned a bachelor’s degree.
4.3 OTHER POSTSECONDARY EDUCATION AND TRAINING PROGRAMS
Skilled technical workforce development encompasses education and training programs that complement degree-granting programs, including apprenticeships, work-related courses, certificate programs, and certification
__________________
7 AACC analysis for the year 2011-2012 reveals that of students who received financial aid, 38 percent received federal grants, 19 percent received federal loans, 12 percent received state aid, and 13 percent received institutional aid.
programs. In many cases, students pursue both types of education and training either simultaneously or sequentially.
The National Center for Education Statistics (NCES) collects data on adult education that include participation in apprenticeships and work-related courses.8 It reports that participation in all forms of adult education “among individuals aged 16 or older increased from 40 percent in 1995 to 46 percent in 2001 and then declined to 44 percent in 2005….In 2005, among the various types of adult education activities, individuals aged 16 or older participated most in work-related courses (27 percent), followed by personal interest courses (21 percent), part-time college or university degree programs (5 percent), and other activities (3 percent)” (NCES, 2007, Indicator 10).
Table 4-3 summarizes the 2005 NCES data (the most recent data) relevant to overall worker participation in skilled technical workforce development. These data suggest that aggregate participation rates vary by sex, age, and occupation: participation is higher for women than for men, for those aged 30-65 relative to other age groups, and for those working in health-related occupations relative to those working in other skilled technical occupations, although these data may vary by location.
The most common types of worker education and training programs that do not confer degrees and are particularly relevant to skilled technical workforce development are apprenticeships, certificate programs, and certification programs. Students and workers who wish to participate in such programs and earn a degree must concurrently enroll in a degree-granting program in an accredited secondary or postsecondary institution. An overview of these programs is provided below.
4.3.1 Apprenticeships
Apprenticeships are formally structured work training programs in which workers are employed in a job and earn wages while receiving on-the-job training and job-related technical instruction. In the United States, registered apprenticeship programs must meet national standards: the U.S. Department of Labor and the states’ apprenticeship agencies register and administer formal apprenticeship programs. At the conclusion of the apprenticeship, the worker earns a nationally recognized credential.
The U.S. Department of Labor estimates that the U.S. registered apprenticeship network currently includes 150,000 employers and more than
__________________
8 For background and links to data, see NCES (2007).
TABLE 4-3 Participation in Job-Related Courses and Apprenticeship Programs in 2005
| Characteristic of Employed Persons | 2005 | |||||
|---|---|---|---|---|---|---|
| No. of Employed Persons (in thousands) | Percent Participating | |||||
| In Career- or Job-Related Courses | In Apprenticeship Programs | |||||
| Total | 133,386 | (1,508.1) | 38.8 | (0.83) | 1.4 | (0.24) |
| Sex | ||||||
| Male | 71,754 | (934.7) | 31.7 | (1.22) | 2.0 | (0.37) |
| Female | 61,632 | (1,219.3) | 47.1 | (1.43) | 0.8 | (0.23) |
| Age | ||||||
| 17-24 | 15,027 | (1,030.4) | 26.4 | (3.01) | 3.0a | (1.03) |
| 25-29 | 14,555 | (918.4) | 36.1 | (2.94) | 3.1a | (1.12) |
| 30-34 | 15,250 | (977.2) | 41.0 | (3.06) | 2.7a | (1.10) |
| 35-39 | 15,286 | (922.4) | 41.7 | (4.16) | 1.0a | (0.46) |
| 40-44 | 18,141 | (946.3) | 39.8 | (2.73) | b | (c) |
| 45-49 | 18,149 | (842.5) | 45.0 | (2.15) | 0.7a | (0.29) |
| 50-54 | 14,624 | (732.1) | 42.6 | (2.49) | 0.7a | (0.32) |
| 55-59 | 10,522 | (676.0) | 44.7 | (2.98) | b | (c) |
| 60-64 | 6,021 | (498.8) | 38.9 | (3.97) | b | (c) |
| 65 and over | 5,812 | (493.3) | 21.6 | (3.48) | d | (c) |
| 65-69 | 3,385 | (415.5) | 19.1 | (4.05) | d | (c) |
| 70 and over | 2,427 | (282.3) | 25.1 | (5.81) | d | (c) |
| Occupation | ||||||
|
Health diagnosing and treating practitioners |
978 | (208.8) | 78.9 | (7.10) | b | (c) |
|
Registered nurses, pharmacists, dieticians, therapists, and physician assistants |
2,794 | (238.8) | 79.7 | (4.60) | b | (c) |
|
Health technologists and technicians |
3,060 | (436.7) | 70.6 | (7.31) | b | (c) |
|
Technologists and technicians, except health |
1,774 | (336.5) | 29.4 | (8.10) | b | (c) |
|
Mechanics and repairers |
5,241 | (521.6) | 28.3 | (4.47) | 4.0a | (1.44) |
|
Construction and extractive occupations |
6,827 | (647.1) | 12.4 | (3.04) | 5.3a | (2.26) |
| Characteristic of Employed Persons | 2005 | |||||
|---|---|---|---|---|---|---|
| No. of Employed Persons (in thousands) | Percent Participating | |||||
|
Precision production |
10,483 | (839.3) | 23.5 | (3.79) | b | (c) |
|
Production workers |
e | (c) | e | (c) | e | (c) |
|
Miscellaneous occupations |
801 | (189.4) | 17.2 | (6.87) | b | (c) |
NOTES: Standard errors appear in parentheses. Neither this table nor the National Center for Education Statistics (NCES) data on which it is based are all-inclusive or represent a comprehensive study. The table indicates potential areas of further analysis and research.
SOURCE: Based on NCES (2014b, Table 507.30).
1,000 occupations (see DOL, n.d.).9 Included in this total is the United Services Military Apprenticeship Program (USMAP), which accounted for nearly one in four registered apprenticeships in the United States in 2013 (Lerman et al., 2015).10 However, NCES data (Table 4-3) suggest that fewer than 2 percent of all U.S. workers participate in apprenticeship programs. More detailed analyses of participation would likely reveal differences across groups and locations.
In a survey of apprenticeship theory and practice, Wolter and Ryan (2011) find that apprenticeships vary greatly across countries in terms of the numbers of workers who are trained and the skill content of the training.11 Apprenticeship
__________________
9 Not all registered programs are active. Interested researchers need to adopt innovative methods and tools to analyze the dynamics of U.S. apprenticeship programs and the policy implications of these dynamics.
10 USMAP is a formal military training program implemented by the Center for Personal and Professional Development that provides active duty Coast Guard, Marine Corps, and Navy service members with the opportunity to improve their job skills and to complete their civilian apprenticeship requirements while on active duty. The U.S. Department of Labor provides the nationally recognized “Certificate of Completion” upon program completion. See Chapter 5 for further detail.
11 For example, in a recent survey of European work-based education and apprenticeship systems, Lerman and Rein (2015) find that only one-quarter of Europe’s enterprises with more than 10 staff take on apprentices. The reasons for this may be related to the costs associated with administration, apprentices’ time away from the workplace, and employees’ time spent training. For a comprehensive analysis of the economic issues and evidence, see Wolter and Ryan (2011).
practices also vary across sectors and occupations within countries, as do the ways in which the programs are provided and financed by employers and other stakeholders. The authors observe that no “general theory” as yet explains the full range of practices within, let alone among, countries.
Wolter and Ryan (2011) also report variation in program performance and cost. While some apprenticeships produce superior labor market outcomes, others may be poorly integrated into their local economy. Apprenticeships also are not costless, and their costs may not be symmetrically distributed.12 If educators do not provide the appropriate curriculum to complement on-the-job training, for example, employers may end up bearing more of the apprenticeship costs, which they may or may not be able to recover. Box 4-1 reviews some of the challenges of setting up apprenticeship programs in the United States.
Despite the challenges described in Box 4-1, however, the potential benefits of apprenticeship have attracted the interest of policy makers, educators, and employers. Apprentices may produce benefits for firms that are not reflected in the value of their wages or other benefits. For program participants, benefits include the cognitive and motivational effects of combining academic learning and practice with skill learning, better integration of the content of skill learning with occupational requirements, increased youth employment rates, and better school-to-work transitions.13
Indeed, the past decade has seen a growing interest in apprenticeship programs in the United States. In a paper commissioned for this study, Messing-Mathie (2015) finds that interest in developing apprenticeship models in the United States is oriented around the “dual-education (or dual-study)” model, which is common in Germany, Austria, and Switzerland. This model combines classroom education in a postsecondary program of study with a direct relationship with an employer through a multiyear apprenticeship. Students apply to apprentice directly with a firm. The firm has an agreement with an institution of higher education, which in the United States is typically a community college, to provide the academic portion of the training.
U.S. apprenticeships have traditionally been limited to such sectors as construction, maintenance and repair, manufacturing, and service occupations. However, Messing-Mathie reports that since 2004, the United States has seen a
__________________
12Wolter and Ryan (2011) find that empirical observations show not only that there is a large degree of heterogeneity in the training costs that firms share but also that many firms reap net benefits even during the training of apprentices.
13 In addition to the Wolter and Ryan (2011) survey of the literature, see Backes-Gellner (2014); Bolli and Hof (2014); Bolli and Renold (2015); Eggenberger et al. (2015); Muehlemann and Wolter (2014); Rupietta and Backes-Gellner (2015); Wolter and Muehlemann (2015); Ferm (2008); and Rosenfeld et al. (2014).
rise in the registration of new apprenticeship programs in such high-growth industries as health care, advanced manufacturing, information technology, and biotechnology, and that these programs—including the Kentucky Federation for Advanced Manufacturing Education (KYFAME), Apprenticeship Carolina, and the Michigan Advanced Technician Training Program (MAT2)—take a hybrid approach that deviates from the European dual-education model (Messing-Mathie, 2015).14 Observing that apprenticeships are situated in specific social, economic, and regulatory contexts, she argues that such programs should be designed to allow for flexible responses to local requirements.
4.3.2 Alternative Credentials
Recognizing that education credentials other than academic degrees have potential labor market value, some researchers have begun to consider the role of these alternative credentials in education and training related to skilled technical workforce development (see, e.g., Carnevale et al., 2012; Kleiner and Krueger, 2010). A coordinated federal government effort to develop a better understanding of alternative credentials is currently under way as well. The Interagency Working Group on Expanded Measures of Enrollment and Attainment (GEMEnA) is developing and validating national measures of credentialing for work and is building government-wide consensus for the adoption of these measures in key federal data collections.15Box 4-2 lists GEMEnA’s working definitions of alternative credentials. The following subsections provide an overview of issues related to educational certificates and certifications in skilled technical workforce development. Issues related to occupational licensing are described in Chapter 3.
Educational Certificates
Many postsecondary institutions offer certificate programs, which are stand-alone programs of specialized study or training that award a certificate
__________________
14 See Chapter 6 for a discussion of the role of these intermediaries. In this hybrid approach, the educational organization acts in partnership with the employer to provide a dual-training model of apprenticeship learning, but the primary relationship is between the student (i.e., employee) and the employer (Messing-Mathie, 2015).
15 GEMEnA consists of staff from the following federal offices: Bureau of the Census, Department of Commerce; Bureau of Labor Statistics, Department of Labor; Council of Economic Advisers; National Center for Education Statistics, Department of Education; National Center for Science and Engineering Statistics, National Science Foundation; Office of Statistical and Science Policy, Office of Management and Budget; and Office of the Under Secretary, Department of Education. To ensure the relevance of its work, GEMEnA also meets regularly with a panel of experts and collaborates with a wide range of partners and stakeholders (NCES, n.d.).
rather than a degree to students who complete the program satisfactorily. Certificate programs may be offered on a credit or noncredit basis, and usually take more than 1 month but less than 1 year to complete. NCES (2016c) estimate that public and private postsecondary institutions awarded a total of 969,353 certificates in 2013-2014. In a review of the literature commissioned for this study, Karp (2015a) defines a certificate as “a credential awarded by a postsecondary institution, recognizing completion of coursework in a discipline.”16 In general, Karp finds that individuals with a certificate are likely to earn more money in the labor market than individuals with only a high school degree or some college. Positive returns range from 7 to 24 percent after controlling for individuals’ preexisting skills and abilities. However, Karp notes that recent research indicates that the return on investment for a certificate varies considerably depending on length of study, occupation, geographic region, gender, race, and ethnicity.
__________________
16Karp’s (2015a) paper focuses on Title IV community colleges. For additional perspective and data on certificate and certification holders, see Ewert and Kominski (2014).
Karp found no studies examining the extent to which certificate holders subsequently earn an associate’s degree. Her own analysis suggests that only 7 percent of first-time students who earned a certificate went on to earn an associate’s degree. She also found evidence that it is uncommon for certificate completers to transfer to a 4-year institution. She concludes that the existing evidence indicates that certificates do not generally serve as pathways to degree-granting education programs, despite the aspirations expressed in the career pathways literature.
Certifications
Industry groups, professional organizations, and employers award certifications to individuals who meet program standards for knowledge, skills, and abilities. In a report for the Lumina Foundation, Ewert and Kominski (2014) estimate that more than 4,000 entities offer certifications in the United States. Governments are the most common certifying entities (71.4 percent), followed by professional associations (10.5 percent) and industries (10.3 percent) (Ewert and Kominski, 2014, Table 7). Certifications appear to be most common in health-related occupations. In one survey, the majority of individuals with certifications (76 percent) indicated that certification was required for their job, that they attended courses to prepare for certification (93 percent), and that continuing education units were required to maintain their certification (66 percent) (Ewert and Kominski, 2014).
Defining a certification as “[an award] to individuals who pass an assessment, usually sponsored by an industry or firm,” Karp (2015a) finds that although the research on certifications is growing, existing studies show great variability in the involvement of community colleges in preparing students for certifications. Approaches range from aligning curricula with certification exams, to creating certification exam preparation programs, to becoming a certification-testing center. Preparation activities can include credit or noncredit courses.
4.3.3 Challenges in Assessing the Impact of Certificates and Certifications
Karp (2015a) concludes that the large volume of certification programs, the high degree of program variation, and a lack of accountability and comprehensive data make it difficult to assess the value or impact of completing these programs.
In conducting her review, Karp was unable to identify comprehensive listings of certificates or certifications in the United States or a system that collects outcome data for these programs. National datasets, for example, record certificates in very broad occupational areas, such as health and technical trades, thus precluding the more fine-grained analyses needed for large-scale workforce development initiatives. Likewise, state databases usually do not record the
occupation in which certificate holders are employed; hence there is little research examining certificates as a component of workforce development programs and systems. Karp notes that the existing research also does not examine the employer perspective. These deficits make it difficult to account for all stakeholders in skilled technical workforce development and to address basic questions such as the following:
- How many certificate and certification programs exist?
- Who is in the process of acquiring a certificate or certification?
- Who has acquired a certificate or certification, and how is it associated with career trajectories and outcomes?
- What is the return on investment for certificates and certifications?
As a first step in addressing data requirements, GEMEnA is developing survey items for use in assessing (1) the attainment of nondegree credentials, including industry-recognized certifications, occupational licenses, and educational certificates; and (2) enrollment in education and training that prepare people for work. GEMEnA member NCES plans to field an in-depth survey of U.S. adults (the Credentials for Work Survey [CWS]) to provide detailed cross-sectional time series data beginning in 2016. NCES also is incorporating survey items on nondegree credentials into its post–high school longitudinal studies. Other GEMEnA agencies have started to deploy survey items on certifications and licenses in their own surveys of households and individuals, including the redesigned Survey of Income and Program Participation (Census Bureau), the National Survey of College Graduates (National Science Foundation), and the Current Population Survey (CPS) (Bureau of Labor Statistics [BLS]).
BLS recently released new data on certifications and licenses from the CPS based on the GEMEnA-developed survey items. In January 2015, questions were added to the CPS to identify persons with professional certifications and licenses. A highlight from these data is that 17.8 percent of the civilian noninstitutionalized population aged 16 and over held a currently active certification or license.17 In addition, consistent with Karp’s (2015a) analysis, the data show that certifications and licenses were more prevalent in some occupations than others: more than three-fourths of workers in health care and technical occupations held these credentials, compared with fewer than 1 of 10 in building and grounds cleaning and maintenance occupations (BLS, 2016b, Table 5).
Although promising, these data collection efforts need to be expanded, accelerated, and aligned at the local, state, and federal levels so that stakeholders
__________________
17 The report and data table are available in BLS (2016a).
have the information necessary to make better choices about skilled technical workforce investments.
4.4 FUNDING FOR SKILLED TECHNICAL WORKFORCE EDUCATION AND TRAINING
In the United States, the costs of producing and providing postsecondary skilled technical workforce development are financed by students and workers, employers, labor unions, governments, and philanthropic organizations. In addition to investing time and effort, most Americans who wish to develop technical skills pay tuition and fees, as well as other associated costs, such as those for books, supplies, transportation, and child care, as well as opportunity costs, such as lost wages. If they are not prepared by virtue of their previous education, training, or experience, they must also invest in acquiring prerequisite skills, such as relevant STEM proficiency, or in completing a specific series of courses to qualify for admittance to a program or accreditation in the program.
On the supply side, student tuition and fees rarely cover the entire cost of building and maintaining effective skilled technical education and training centers. The remainder is supported by public revenues from federal, state, and local sources; employers; and civic-minded philanthropists.
Although co-production and co-provision are widely used strategies in the United States, they result in complex public service delivery systems that make it difficult to identify causal relations and outcomes, assign responsibility, and assess performance. “Co-production” refers to public–private partnerships to produce public goods and services, while “co-provision” refers to public–private partnerships to finance or distribute public goods and services. Education and training are examples of public goods that are co-produced and co-provided by students and their families, educators, employers, governments, and the civic sector (Davis and Ostrom, 1991). The implications of these approaches to skilled technical workforce development are discussed in more detail in Chapter 5. The following subsections describe the main components of these systems.
4.4.1 Public Funding Sources
Public sources of funding for skilled technical workforce development include federal, state, and local revenues collected from a wide range of sources. The 2016 Condition of Education report estimates that elementary and secondary public school revenues, which support academic and CTE programs, totaled $618 billion in academic year 2012-2013 (NCES, 2016c). Similarly, as described in more detail in Chapter 3 and the following sections of this chapter, public funding sources offset a significant portion of the costs of employment and training services, as well as postsecondary degree-granting institutions. For
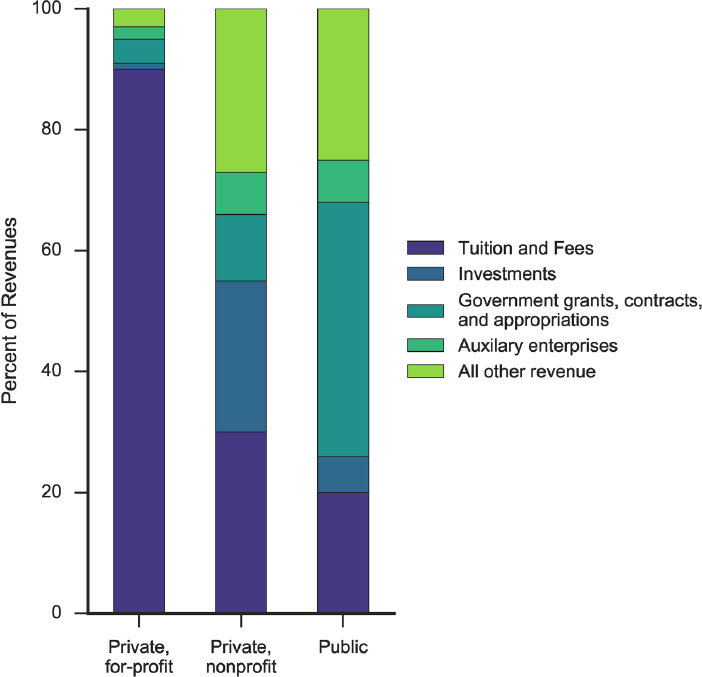
SOURCE: NCES, 2016c.
example, Figure 4-4 shows the sources of revenue for all postsecondary institutions in 2013-2014. The primary sources of revenue for all institutions were tuition and fees, investments and government grants, contracts and appropriations, and other unspecified sources. However, the percentage shares differed significantly by type of institution. At public institutions, the largest percentage of revenue (42 percent) was from government sources, which include federal, state, and local government grants, contracts, and appropriations. At private nonprofit institutions and private for-profit institutions, by contrast, student tuition and fees constituted the largest percentage of total revenues (30 and 90 percent, respectively).18
__________________
18 Note that Pell Grants are included in the federal grant revenues at public institutions but tend to be included in tuition and fees and auxiliary enterprise revenues at private
The sources of and formulas for allocating public revenues in education and training create incentives that can affect outcomes for stakeholders and society more generally.19 However, calculating and accounting for the myriad public expenditures and the rules that govern their use in a large polycentric workforce development system such as that of the United States is a painstaking process that to the committee’s knowledge has yet to be undertaken, one that also is beyond the scope of this study. To obtain a general sense of the issues, the committee focused on the largest aggregate funding sources at the federal, state, and local levels.
Federal Funding Sources
As described in more detail in Chapter 3, the federal government provides two general types of funding that are potentially relevant to skilled technical workforce development: funding for employment and training services, which is relatively small and administered principally at the local level; and funding for education assistance, which is considerable and administered through programs authorized under the Higher Education Act (HEA), the Post-9/11 Veterans Educational Assistance Act, WIOA, the Carl D. Perkins Career and Technical Education Act (Perkins Act), and the Trade Adjustment Assistance Act.20
Federal funds for employment and training services are provided through competitive grants, formula grants, and contracted programs, and they are subject to directives issued by the Office of Management and Budget. The majority of funding for federal employment and training services is distributed by formula grant programs that allocate the funds to state and local entities based on established noncompetitive criteria such as population, unemployment rates, or other economic conditions. In addition, greater than 90 percent of the funds appropriated under Perkins IV, which are important for skilled technical workforce development, are used to provide Basic State Grants that supplement state and local funding of CTE (Dortch, 2014a).21 States use these funds to make
__________________
nonprofit and private for-profit institutions. Thus, some categories of revenue data are not directly comparable across public, nonprofit, and for-profit institutions (NCES, 2016c).
19 This issue arose in nearly every panel discussion at the committee’s 2015 symposium but was particularly prevalent in Panel 3, on “High School Pathways”; Panel 4, on “Community College Pathways”; and Panel 7, on “Federally-funded Workforce Development.” Papers, presentations, and a webcast of the symposium are available at http://nas.edu/SkilledTechnicalWorkforce (accessed March 19, 2017).
20 The Government Accountability Office (GAO) identified 47 federal employment and training services programs in fiscal year 2009, which together provided $18 billion for workforce development. The College Board estimates that the federal government funded $145 billion in postsecondary education assistance in 2013. See the section on federal policy in Chapter 3 for more detail and citations.
21 Note that Basic State Grants are formula grants.
grants that support CTE activities at the secondary and postsecondary levels in local education agencies, CTE schools, community colleges, and American Job Centers. The funds are used to develop the career and technical skills of students, acquire instructional materials and equipment, provide professional development, offer career and academic counseling, develop CTE curriculum, and assess CTE programs.
The U.S. Department of Education estimates that 85 percent of all first-time 4-year undergraduate students and 78 percent of all first-time 2-year undergraduate students receive financial assistance from federal, state, and local governments; institutions; or private sources (NCES, 2016c). Grants and loans are the major forms of federal financial aid for undergraduates. Most of the federal funding for undergraduate education and training is authorized under Title IV of HEA and the Post-9/11 Veterans Educational Assistance Act.22 The largest federal grant program available to undergraduates is the Pell Grant program. To qualify for a Pell Grant, a student must demonstrate financial need. Federal loans, on the other hand, are available to all students.
Although federal legislation regulates eligibility for and disbursement and repayment of financial assistance to students, it is the student-recipients who determine how they will invest in education and training. The implication is that if policy makers wish to encourage increased investment in skilled technical education and training, they need to persuade students as well as educators and employers of the potential benefits of making this investment.
Local and State Government Funding Sources
Local and state governments provide two general types of funding that are relevant to skilled technical workforce development: public education in grades K-12 and a portion of postsecondary education. On average, the states allocate about a third of their direct general expenditures to education. Most of these funds are spent on elementary education, which is intended to build the foundation for success in secondary and postsecondary academic and career and technical education, work, and life.
For example, the U.S. Department of Education reports that from 2010 to 2011, direct general expenditures of state and local governments for education averaged $2,764 per capita, or 33.3 percent of all functions (NCES, 2013c, Table 106.50). Expenditures for elementary education averaged $1,813 per capita, or 21.9 percent of all functions; $810 per capita for colleges and universities, or 9.8 percent of all functions; and $141 per capita for other types
__________________
22 Using the GAO and College Board estimates cited in Chapter 3, total federal funding for all education and training is approximately $163 billion annually. The total amount of education assistance under HEA and the Post-9/11 Veterans Educational Assistance Act is approximately $141 billion annually.
of education, or 1.7 percent of all functions. The data show considerable variability in education expenditures across the states. Per capita spending on education ranged from $1,975 in Idaho, where education expenditures represented 29.9 percent of all functions, to $4,672 in Alaska, where these expenditures represented 26.4 percent of all functions.
As described in more detail in Chapter 3 and earlier sections of this chapter, in addition to funding public K-12 education and training programs, local and state governments play an important role in funding postsecondary education and training, particularly in community colleges. State and local sources provide about 48 percent of community college revenues (see Table 4-2). The implication is that state and local policy makers can use this funding as a means of exercising considerable influence over skilled technical workforce development programs offered by community colleges.
4.4.2 Private Funding Sources
Private sources of funds for skilled technical workforce development potentially include the income of students, workers, and their families and friends; the income of employers; and the income of churches, civic associations, labor unions, trade associations, and philanthropies. The latter organizations tend to fill funding gaps in the production and provision of public goods based on their specific missions and interests. In this sense, their incentives align directly with the individuals they serve and only indirectly with public policy functions. Hence, the three groups that appear to be most directly involved in producing skilled technical workers are the workers, employers, and the public (of which they are a part) in their sphere of activity.
As discussed in preceding sections of this report, U.S. policy frameworks generally place the burden of funding postsecondary education and training on individuals, who potentially earn returns on their investments in the form of increased wages, promotions, and other forms of social recognition and achievement. If properly aligned with contemporary conditions, these returns can create incentives for continual, lifelong individual development.
Recognizing that public benefits can be derived from individual education and training activities, governments subsidize individual investments by funding public schools and providing various forms of grants and financing on generous terms. However, employers also benefit from workers’ self-development, as well as public subsidies for these efforts. Skilled technical workers potentially contribute to innovation, increased output, productivity, and profitability. Public policies recognize this linkage by allowing employers to deduct the cost of employee education and training from their taxable income, thereby subsidizing employer investments in workforce development.
The remainder of this section explores joint labor–management programs that support workers’ participation in skilled technical workforce development and provides an overview of U.S. employers’ workforce development strategies.
Joint Labor–Management Programs
Unions have historically leveraged member dues to work with employers in helping workers from a wide range of career fields develop and maintain skills to meet local needs. The AFL-CIO reports that joint labor–management skill training programs currently contribute about $1.5 billion to the American economy each year (AFL-CIO, n.d.).23 These programs potentially offer opportunities for a diverse group of workers in skilled technical occupations in such fields as health care, building and construction, manufacturing, hospitality, and aerospace. In the building and construction industry, thousands of local Joint Apprenticeship and Training Committee (JATC) groups oversee apprenticeship and journey-level skills upgrade training in such growing occupations as energy conservation and alternative energy. The committee sees the need for additional research on the role of unions in skilled technical workforce development and on the effectiveness of joint labor–management programs.
The AFL-CIO reports that national joint training programs currently exist in the automotive, telecommunications, steel, rubber, health care, hospitality, and aerospace industries, as well as in the public sector. In the steel and rubber industries alone, 72 local joint committees in 24 states have started to offer courses in renewable energy systems and energy-efficiency technologies. The AFL-CIO estimates that there also exist 18 consortia of unions, management, universities, and health and safety organizations. Box 4-3 describes a 30-year alliance originally created through collective bargaining between the Communication Workers of America and AT&T. Additional examples of labor–management training partnerships include
- the International Association of Machinists and Aerospace Workers and Boeing,24
- the United Auto Workers (UAW) and Ford and UAW and GM,25
- the United Steelworkers,26 and
- the Kaiser Labor Management Partnership.27
__________________
23 An AFL-CIO program description can be found at http://www.aflcio.org/Learn-About-Unions/Training-and-Apprenticeships/Labor-Management-Partnerships (accessed March 19, 2017).
24 See http://www.iam-boeing.com (accessed March 19, 2017).
25 For information on the UAW-Ford partnership, see http://uawford.org (accessed March 19, 2017). For information on the UAW-GM partnership, see https://www.uawgmjas.org (accessed March 19, 2017).
26 See http://icdlearning.org (accessed March 19, 2017).
27 See http://www.kaiserpermanentejobs.org/labor-management-partnership.aspx (accessed March 19, 2017).
Employer Funding
Economists who study innovation and growth observe that labor and the STEM knowledge and skills it embodies are among the key drivers of economic growth and development.28 The nation cannot innovate and compete without
__________________
28 Contemporary theories of economic growth are based on Solow (1956), who argued that sustained economic growth requires capital, labor, and a residual factor associated with innovation and technological progress. North (1990) expanded on Solow’s work, arguing that institutions—the rules that determine who participates in the economy and their property rights and duties—and location are additional factors. Romer (1994) further elaborated, emphasizing the endogenous role of knowledge in the standard economic production function. For a survey of the economic literature related to employer-financed skills training, see the paper by Lerman (2015) commissioned for this study. For an extensive survey of theory and evidence on apprenticeship, see Wolter and Ryan (2011).
technical skills, and if it cannot compete effectively, it will not enjoy long-term economic prosperity.
Innovation means different things to different people. In this report, the committee uses the OECD Oslo Manual definition (OECD and Eurostat, 2005):
An innovation is the implementation of a new or significantly improved product (good or service) or process, a new marketing method, or a new organizational method in business practices, workplace organization or external relations.
The logic chain that relates innovation and workforce development suggests that employers who prioritize innovation and rely on technical skills have strong incentives to contribute to the development of a skilled technical workforce. Taking specific institutional and locational differences into account, for example, Rupietta and Backes-Gellner (2015) find that firms in developed countries that train apprentices through a combination of school- and work-based learning (a dual-education or vocational education and training [VET] approach) are more innovative than firms that do not. As discussed in Chapter 2, however, Capelli (2004, 2012, 2015) argues that employer training has declined over time, shifting the burden of skill development to individuals and governments. He attributes this trend to declining job tenure, which limits the ability of firms and workers to earn an adequate return on their training investments.
Surveying the literature on the role of employers in developing and training skilled technical workers, Lerman (2015) argues that the evidence is mixed. He finds that although employer-led training is effective for workers and firms and is widespread in the United States, data limitations make it difficult to determine the scale of training with any rigor. And as Table 4-4 shows, the survey data that have been collected vary widely. Lerman finds, for example, that government survey data provide a dated and very mixed picture of such training. Among individuals aged 25-64, the Survey of Income and Program Participation shows a decrease in employer-led training from 32.8 percent in 1996 to 21.6 percent in 2008, while the National Household Education Survey shows an increase from 31 percent in 1999 to 42.4 percent in 2005. The National Assessment of Adult Literacy survey, which reports on the incidence of training for 2003, indicates that 56.9 percent of workers in this age group were involved in employer-led training in the previous 12 months.
Employers support skilled technical workforce development in several ways, including by providing on-the-job training and apprenticeships, supporting certification and recertification, and offering tuition reimbursement programs. The Society for Human Resource Management (SHRM) (2015) estimates that 84 percent of U.S. employers provided some form of workforce development benefit in 2015, while 78 percent supported certification and
| Group | Government Survey | ||||||
|---|---|---|---|---|---|---|---|
| Survey of Income and Program Participation | National Assessment of Adult Literacy | National Household Education Survey | |||||
| 1996 | 2001 | 2004 | 2008 | 2003 | 1999 | 2005 | |
| Total | 32.8 | 27.9 | 21.8 | 21.6 | 56.9 | 31.0 | 42.4 |
| Male | 30.4 | 25.3 | 19.7 | 20.5 | 53.6 | 29.4 | 31.8 |
| Female | 35.7 | 31.0 | 24.2 | 22.7 | 60.6 | 21.8 | 46.0 |
SOURCE: Lerman, 2015, Table 1.
recertification (SHRM, 2015). Yet SHRM’s analysis suggests that it is not clear whether employees are fully utilizing these benefits, and if not, why not (SHRM, 2015). SHRM notes, for example, that 30 percent of employees in large companies but only 1 percent of those in small companies use the benefits. SHRM speculates that employers may create more and less supportive cultures for using education and training benefits, or that the staffing requirements of some organizations make it difficult or expensive to use the benefits. More research is needed to better understand benefit utilization.
A more nuanced view emerges from examining results of a large and continuing private survey of employer training. The Association for Talent Development (ATD) regularly surveys employers about their training and development activities. ATD’s 2014 State of the Industry report indicates that employers spent an average of $1,208 per employee on training and development in 2013, or about $167.5 billion.29 This spending has been relatively stable over time, ranging from $1,040 per employee in 2006 to a high of $1,228 in 2010. These numbers support the idea that employees may not be fully utilizing employer-provided opportunities, such as tuition reimbursement programs, to develop their skills and credentials.
ATD finds that the average cost of workforce development typically varies according to an organization’s size. In 2013, small organizations with fewer than 500 employees spent on average $1,888 per employee, whereas midsized organizations with 500 to 9,999 employees and large organizations with 10,000
__________________
29 The ATD study is based on a survey of 340 organizations of various sizes, industries, and locations. In 2013, ATD reported that employers spent $164.2 billion on training in 2012; the committee’s estimate of total spending in 2013 is based on ATD’s report in 2014 that spending increased by 1 percent over the previous year. For an overview of the 2014 study, see Miller (2014).
or more employees spent about $838. The number of learning hours per year per employee also varies across the size of organizations. Although the average across all organizations in 2013 was 31.5 hours, large organizations on average reported that their employees received 36 hours of training, or approximately 4.5 days, whereas the comparable figures for midsized organizations were 27 hours, or approximately 3.5 days (Miller, 2014).
ATD also finds differences in training across industries. In 2013, for example, manufacturing organizations, which are typically large organizations in ATD’s survey, reported on average spending $535 and providing 27 hours of training per employee, compared with $1,392 and 24 hours for health care and pharmaceutical organizations and $1,107 and 33 hours for the combined group of finance, insurance, and real estate organizations.
ATD finds further that organizations provide employee training in different ways, including by developing and producing courses internally, contracting with other organizations to provide the training, and reimbursing employees for tuition. ATD estimates that 10 percent of training expenses in 2013 went to tuition reimbursement programs in which employees select courses to study, subject to approval by their managers, and are reimbursed for all or some portion of their tuition costs upon demonstrating successful completion.
Finally, ATD estimates that about one-third of employer-selected training content is focused on managerial and supervisory skills, mandatory and compliance training, and profession- or industry-specific training. The remaining two-thirds of content covers such topics as processes and procedures, customer service, sales training, and executive development (Miller, 2014).
4.5 CONCLUSIONS
Skilled technical workforce development is a quasi-public good with potential benefits for individuals, employers, and society as a whole. Americans have a long-standing commitment to education and training that predates independence and the creation of a federal republic.
Mirroring the U.S. policy-making structure, the U.S. workforce development enterprise is a very large, complex system of systems: there is no single, centralized system for developing a skilled technical workforce, and the structure of the existing system cannot easily be conceptualized in terms of pathways, pipelines, or production functions or operated in this manner. Education and training programs are co-produced and co-provided by students, workers, employers, governments, and civic society. The largest funding sources for skilled technical workforce development are state and local public revenues and tuition paid by students and workers for postsecondary degree-granting programs. WIOA encourages policy makers to better integrate and align these expenditures and programs at the local level. However, assessment of the
performance of systems based on polycentric co-production and co-provision is quite difficult and must be undertaken at the local level.
Americans who wish to prepare themselves for success in skilled technical occupations have a wide range of education and training options that depend on several factors, including their own socioeconomic means, the availability of programs in their preferred geographic location, and the occupation of interest. The primary vehicles for skilled technical education and training in the United States are CTE in secondary and postsecondary institutions, community college programs, and apprenticeships. However, enrollment trends indicate that while Americans may aspire to acquire career-related education and training throughout their lives, they are less likely to pursue skilled technical education and training today than they have been in the past.
Employers that wish to innovate and compete successfully also have a stake in developing a skilled technical workforce. Public tax policy subsidizes employer expenditures to encourage economic growth and development. However, data on employer-funded skilled technical workforce development are sparse, and the evidence that exists is mixed.
With this review of the highly complex U.S. system of workforce education and training as context, the next chapter examines the challenges associated with the development of a skilled technical workforce.


