
Chapter 3
Restoration Project Monitoring
Effective restoration monitoring and evaluation depend on understanding how monitoring results can be used to address management questions for a given restoration project and/or program levels and developing appropriate monitoring designs that address those questions with sufficient statistical rigor, i.e., with acceptable confidence in decisions (Michener, 1997; Lindenmayer and Likens, 2010; Groves and Game 2015).1 In this chapter, the committee addresses a major part of the its charge “to identify best practices . . . for monitoring” and describes “current, effective approaches for developing monitoring goals and methods” as well as “approaches for determining baseline data needs.” To address this task, this chapter presents general principles for developing a project-level monitoring design. Chapter 4 discusses needs for monitoring beyond the project scale, and Chapter 5 introduces guidance for data stewardship and sharing. Chapters 6 and 7 discuss how synthesis and assessment of monitoring data can inform project and program management. Part II of this report discusses good practices for monitoring specific restoration project types.
PURPOSES OF RESTORATION MONITORING
Monitoring and evaluation efforts that are conducted for different restoration management needs often require different approaches (Stem et al., 2004). Restoration project monitoring involves systematic collection of data for three primary purposes: (1) to determine whether a particular project was completed as specified in the restoration plan (construction monitoring); (2) to evaluate the performance of a restoration project relative to the project objectives (performance monitoring); and (3) to learn from the restoration effort in structured ways to enhance the effectiveness of restoration efforts over the long-term (monitoring to support adaptive management; see also Chapter 7). These three project-level monitoring purposes are most readily associated with an individual project site but can also apply at larger scales (e.g., across multiple sites within a larger project or across multiple projects within a watershed or region). The committee recognizes that data are required to assess the need for restoration; however, it does not consider collection of those data to be part of the purview of this study. In some cases, programs may require additional monitoring to address specific project or program-level information needs. Each of the three primary purposes of monitoring is discussed in general below, as well as in terms of species- and habitat-specific restoration in Part II of this report.
Construction monitoring, performance monitoring, and monitoring to support adaptive management are not specific types of monitoring, as much as the purposes behind the development of specific monitoring designs. Similar metrics may or may not apply to all three purposes, but the monitoring designs appropriate for each purpose are likely to vary depending on the questions being addressed.
Construction Monitoring
Restoration typically involves an intentional manipulation of the physical and biological “environment” to achieve an intended ecological result. Construction monitoring provides the data necessary to aid in the determination of whether a project was constructed or implemented as designed and in accordance with applicable regulations and is, therefore, essential for all restoration projects (Hutto and Belote, 2013) also referred to as “Implementation Monitoring”. Projects that do not involve construction will still require monitoring to assess whether projects were implemented as designed. Many projects entail structural changes to the ecosystem (e.g., building islands, grading to appropriate elevations, planting native vegetation) that set the stage for the interplay of physical, chemical, and biological processes intended for restoration (Powers and Boyer, 2014). Construction monitoring in such cases could include monitoring before (as part of the site-selection process), during, and immediately following construction to ensure that design specifications
___________________
1 For a more complete definition of scientific rigor, please see: http://atlasti.com/rigor-social-scienceresearch.
are met, any structures and machinery are functioning as expected, and activities comply with the Endangered Species Act, Coastal Zone Management Act, and other relevant statutes.2
Monitoring the manipulation to ensure that it is implemented and functioning as intended is critical because the initial design and related construction (restoration or creation) phase is often the main component of the environmental manipulation (Thayer et al., 2003) and involves the majority of the restoration funds to be expended. Careful oversight and related monitoring will go a long way to ensuring a positive outcome (e.g., Weinstein et al., 1997, 2014; NRC, 2003a; Clewell et al., 2005; Palmer et al., 2005, 2011; Clewell and Aronson, 2013). Construction monitoring may also provide useful information for elucidating critical uncertainties related to the implementation and interpretation of the results of the related ecological performance monitoring (Downs and Kondolf, 2002).
Monitoring in advance of the restoration project implementation can inform the restoration site-selection (also for BACI designs) and provide critical baseline and historical information. Careful site-selection will enhance the likelihood for restoration objectives to be achieved. For example, salinity is an important factor for oyster restoration and selecting an oyster restoration site(s) in a suitable salinity range can improve restoration outcomes (Pollack et al., 2012; Baggett et al., 2014). In addition, the best understanding of the biology and ecology of a given site(s) and/or species involved in the restoration effort needs to be analyzed in a timely fashion to be able to inform early on project design choices (e.g., Mitsch, 2014).
Construction monitoring also enables critical learning about the manipulation itself, creating a knowledge base for future improvements. For example, as part of the Biscayne Bay Coastal Wetlands Project, the South Florida Water Management District constructed 4 of 10 planned culverts in the L-31 E Canal to divert water to the east, towards Biscayne Bay to rehydrate coastal wetlands. The goal of these four culverts was to divert 4% of water available for diversion every year. Post-construction monitoring revealed that this design criterion was not always met for several reasons. Remedial actions were taken to retrofit the culverts that included re-establishing downstream sump depths to design criteria and installing debris barriers to prevent clogging on the upstream side. In a second phase of this project, plans called for the installation of a pump to move water into the L-31 E Canal from an adjacent but unconnected canal. Monitoring of the remedial actions indicated that pumping maintained water at an optimal stage for delivery through the culverts to the east (Charkhian et al., 2015). Thus, ultimately the restoration project pump design was verified and culverts adjusted based on the post-construction monitoring. Further examples of good practices for construction monitoring of several restoration types are discussed in Part II of this report. Information gathered from construction monitoring can be an element of performance monitoring and is required for monitoring for adaptive management.
Given the large investment in restoration and the invaluable benefits to improving outcomes of restoration, the committee concludes that construction monitoring should be required for every project.
Performance Monitoring
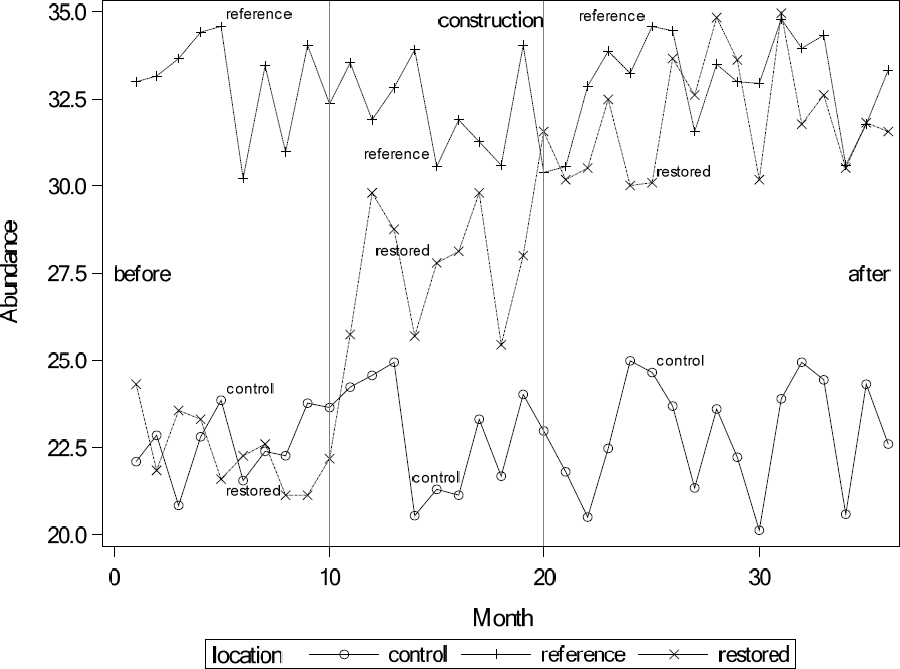
Performance monitoring provides the information necessary to assess whether a project (or set of projects) as built or implemented has achieved its stated objectives in terms of desired biological and the larger ecosystem structure, composition, and/or ecosystem services provided (see also Hutto and Belote, 2013). Performance monitoring and evaluation inform the public and funding agencies of benefits realized from the restoration investments and provide accountability. As such, performance monitoring is also essential for all restoration projects. As discussed in Chapter 2, clear restoration objectives are needed to determine performance and to identify an appropriate monitoring program. The preferred approach to assessing restoration performance involves monitoring of pre-project baseline conditions at a restoration site and appropriate reference and/or control sites (see Box 3.1), so that restoration-related responses can be distinguished from other environmental factors (see Figure 3.1). Development of effective performance monitoring requires consideration at both temporal and spatial scales because the ecological interactions that are needed for habitat development and restoration of associated ecosystem services may take a very long time to develop (decades in some instances), and depend on environmental drivers operating at scales well beyond the project boundaries and duration. For a description of drivers of coastal change used by
___________________
2 All restoration projects will require an environmental compliance review—see also http://www.gulfspillrestoration.noaa.gov/environmental-compliance.
the Louisiana System-wide Assessment and Monitoring Program,3 see Hijuelos et al. (2013).
With appropriate and timely data management and synthesis described in subsequent chapters, analysis of the performance monitoring data at the project and program level can inform project managers about the progress toward the restoration objectives. Baseline and existing and new historical information are critical for the purpose of performance monitoring.
For example, performance monitoring of a coastal marsh restoration with the objective of providing enhanced wildlife habitat would likely include measuring metrics such as marsh elevation, soil organic matter content, native and invasive plant distribution, and targeted wildlife abundance, density, and biodiversity (see Table II.3 in Part II for details). These monitoring data would be collected both before and for several years after restoration and compared to similar sampling at carefully selected control and/or reference sites (discussed in more detail later in this chapter). Performance monitoring of a restoration effort to enhance resident marsh bird populations would likely build on many of those marsh habitat metrics and also include nest success, fecundity, and survivorship (see Table II.4 in Part II for details).
The synthesis or simple aggregation of performance monitoring data across restoration projects and across a region can also inform restoration program managers about the overall progress toward programmatic goals (see also Chapter 5). For example, with consistent monitoring of oyster restoration projects and proper data stewardship, a program review could aggregate the areal extent of oyster reef restored across the Gulf of Mexico coastline and compare it to programmatic objectives such as the RESTORE Trustee Council’s goal “to restore and conserve habitat.”
Without the performance monitoring, it would not be possible to conclude whether the investment in restoration resulted in the desired outcomes and whether the intended objectives were achieved. Therefore, the committee concludes that performance monitoring, as in construction monitoring, should be a requirement for each restoration project.
___________________
3 The System-Wide Assessment and Monitoring Program (SWAMP) ensures a comprehensive network of coastal data collection activities to support coastal protection and restoration across Louisiana: http://cims.coastal.louisiana.gov/RecordDetail.aspx?Root=0andsid=11471.
Monitoring to Support Adaptive Management
The third restoration monitoring purpose—monitoring for adaptive management—provides the greatest potential to improve the performance of a given restoration project or programs and to increase the effectiveness and longevity of that restoration project. The principles of adaptive management (see also Box 1.3), its potential benefits to Gulf restoration, and steps necessary to implement adaptive management effectively in the Gulf are discussed in detail in Chapter 7.
Monitoring in support of adaptive management is deliberately designed to address well-defined restoration management questions and uncertainties (see the Glossary for definition of uncertainty). The results of this monitoring (and subsequent evaluation efforts) are intended to inform and enhance restoration decision-making by identifying weaknesses in the planning, implementation, and/or monitoring phases of restoration that can be improved upon in the future (Nilsson et al., 2016). The findings from monitoring for adaptive management could potentially trigger adjustments to a restoration project to improve the likelihood of achieving its objectives, and they could inform the design of other similar projects (Thom, 2000; Simenstad et al., 2006; LoSchiavo et al., 2013; RECOVER, 2015). The committee distinguishes this monitoring effort from performance monitoring by the fact that it aims to not only assess performance but also inform critical uncertainties of a restoration project that might hinder it from achieving its objectives. For example, this monitoring effort might be applied to resolve why a certain objective was not achieved or how restoration effectiveness could be enhanced. In contrast, performance monitoring aims to understand only what the restoration outcomes are and whether stated restoration objectives were reached.
Restoration uncertainties addressed through monitoring in support of adaptive management are uncertainties of knowledge—in contrast to statistical uncertainties about whether a response can be detected amidst natural variability—and
can stem from several sources. For example, there may be uncertainty related to which of several restoration designs produces the largest ecosystem benefits or the extent to which restoration site selection influences performance. (See Chapter 7, Box 7.2 for an example of an adaptive management program to identify the optimal oyster cultch quantity for reef restoration efforts in the Gulf.)
Monitoring in support of adaptive management also improves the understanding of the causes of restoration outcomes and project performance thereby improving ongoing as well as future restoration planning and decision making. How such monitoring improves restoration effectiveness through the adaptive management process is discussed in Chapter 7. For example, in a tidal marsh restoration, test plots could be designed and monitored to assess the impact of soil surface elevation in the restored marsh on native and invasive plant distribution; wildlife abundance, density, and diversity; and ecosystem resilience in the face of storm events. This information could be used to enhance the design of future marsh wetland restoration projects in the Gulf or change the emphasis of restoration at the programmatic level. Monitoring may also support the development of predictive models to aid management actions. For example, models may be used to predict the effect of different management actions on shorebird nesting success. A monitoring program may be designed to reduce uncertainty associated with model predictions. See Part II for additional examples of monitoring to support adaptive management.
PROJECT-LEVEL MONITORING PLAN
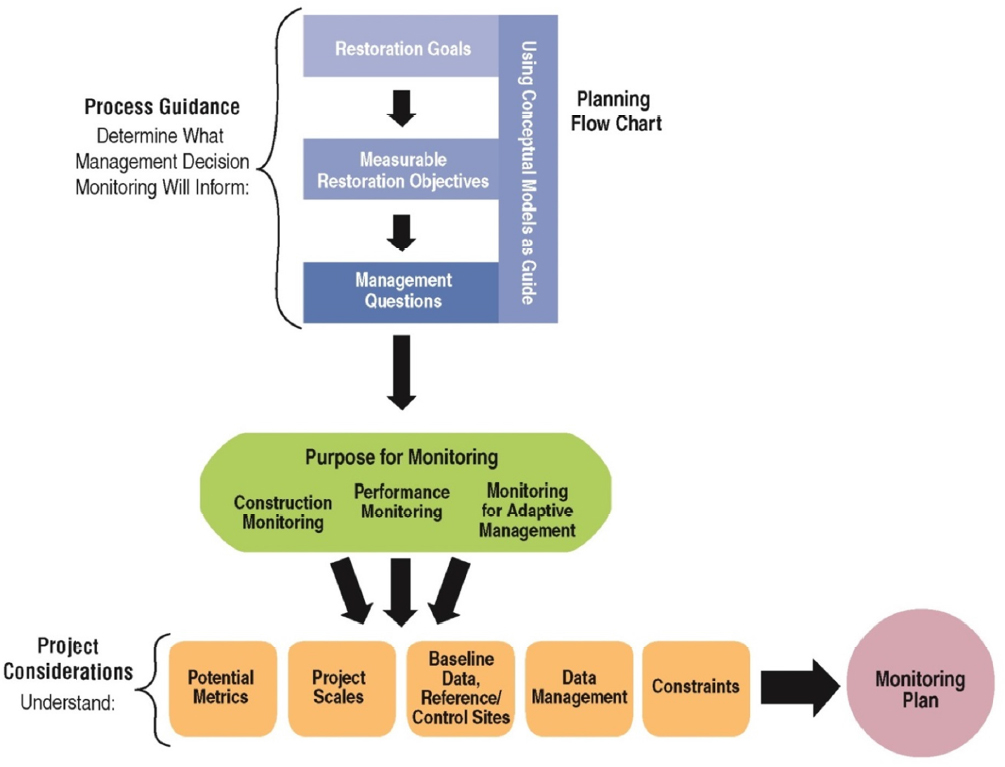
This section provides an overview of key inputs and design decisions to be made in the development of a project-level monitoring plan (Figure 3.2). A variety of literature is also available on the design and analysis of restoration monitoring activities (Michner, 1997; Block et al., 2001; Thom and Wellman, 1996; Roni et al., 2005) and habitat- and species-specific considerations in the development of a monitoring plan are provided in Part II.
Overarching Considerations for the Development of a Project-Level Monitoring Plan
In the development of a monitoring plan, there are overarching inputs that may apply to all Gulf restoration efforts of a particular type (see Figure 3.2). These include a conceptual model for a given habitat type or species being restored, associated restoration objectives, and management questions to be addressed by the monitoring program. In the Gulf restoration, these are likely to be developed at the program level, prior to the design and implementation of the monitoring plan. However, if these elements have not already been developed, they will need to be established to support the design of an appropriate and effective monitoring program.
Conceptual Models
A conceptual model provides a visual and/or narrative framework that connects key environmental and social factors to ecosystem structure and processes (Thom 2000). Conceptual models can be used for a range of problem-solving situations and take a variety of forms (Argent et al., 2016). On this range of application for conceptual models the committee refers to two types of models that serve somewhat distinct needs in restoration planning and management:
- Systems models, which are used in initial stages of restoration planning to understand better the current socio-ecological context for restoration
- Causal models, which are related and used in later stages of planning and implementation to document how planned restoration actions are expected to change specific targeted socio-ecological elements of the system
Conceptual systems models. Conceptual systems models show known or assumed causal linkages that occur at a broad scale between different biophysical, ecological, social, and economic elements of a given system. These models needs to represent the best understanding of the systems biological, chemical, physical, social, cultural, and economic elements and processes. This broad conceptual systems model helps ensure that restoration planners have the most complete view possible of the system, including where restoration project manipulations might impact or be impacted by ecosystem processes. The model may be a simple verbal description, a simple box and arrow conceptual diagram, or a visual representation of a detailed numerical model (Williams et al., 2009; Tallis et al., 2010).
Conceptual models can be produced through various means, including situation analysis (Foundations of Success, 2009); application of the
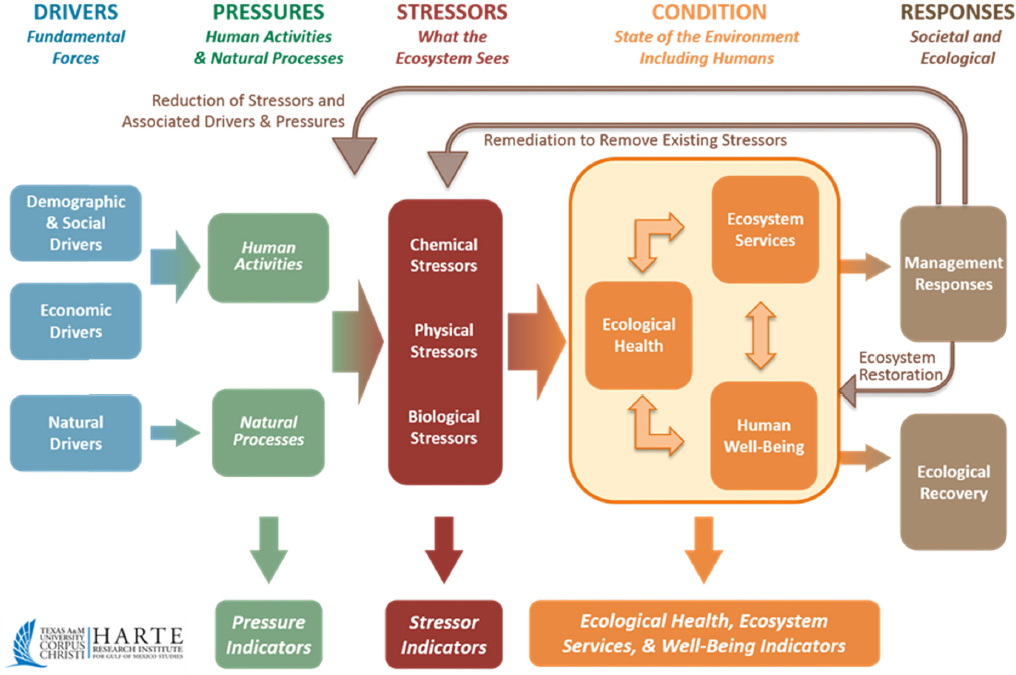
driver, pressure, state, impact, and response (DPSIR) framework (Mateus and Campuzano, 2008; Tapio and Willamo, 2008; Tscherning et al., 2012), or use of the press-pulse dynamics framework (Collins et al., 2010). Figure 3.3 shows a generic representation of the DPSIR framework, which depicts hypothesized linkages between drivers of environmental change, specific stressors that are foci of societal concern, ecological and societal responses to those drivers and stressors, and endpoints that can be measured to provide information on ecosystem state and responses to restoration and management activities (Gentile et al., 2001; Harwell et al., 2015). The framework shown in Figure 3.3 is being adopted and further developed as part of the Gulf of Mexico Report Card initiative.4 Conceptual models have been widely applied to wetland restoration efforts in the Gulf region and elsewhere (e.g., Barnes, 2005; Ogden et al., 2005; Kelble et al., 2013). System-specific and regional models served an important role in identifying indicators in the Comprehensive Everglades Restoration Plan (LoSchiavo et al., 2013). Similarly, conceptual ecological models were integral to development of an integrated modeling and monitoring system for Louisiana’s Coastwide Reference Monitoring System for Wetlands5 (Twilley, 2003; Steyer et al., 2006).
___________________
4 Gulf of Mexico Report Card initiative:http://harteresearchinstitute.org/newsletter/docs/gulfofmexico_reportcard_brochure.pdf
5Louisiana: Coastwide Reference Monitoring System (CRMS) http://lacoast.gov/crms2/Home.aspx.
Conceptual models (both systems and causal models) can be used to identify and highlight key uncertainties that inform monitoring design choices and adaptive management planning, and linkages with weak evidence can be probed through experimental implementation (Schreiber et al., 2004; Ogden et al., 2005; see also Chapter 7). Conceptual models can also identify indicators used to assess the outcome of restoration activities and the metrics that best quantify the response of the indicator to management intervention and/or stressors (Bormann et al., 1999; Rumpff et al., 2011). They also serve to communicate the science underpinnings of restoration to a broader audience.
Conceptual models both inform and are informed by the development and application of process-based, quantitative ecological models (Swannack et al., 2012). Some conceptual models simply show linkages without indicating the sign or strength of the relationships, whereas more complex models may include the hypothesized direction and shape and/or strength of the relationship between stressor and response variable (e.g., linear, nonlinear, threshold-like) (Suding and Hobbs, 2009). Both conceptual and numerical models can be revised over time as new information becomes available.
Conceptual systems models developed for ecological restoration commonly focus on the biophysical and ecological elements of a system without including connections to specific social and economic systems beyond immediate drivers of change (sometimes called “threats”) (e.g., Davis et al., 2005; Montagna et al., 2013; Fischenich and Barnes, 2014; White et al., 2014; Wingard and Lorenz, 2014; Tempest et al., 2015; Vasslides and Jensen, 2016). Because several restoration programs in the Gulf have explicit restoration objectives that include socioeconomic outcomes, for those restoration projects that include socioeconomic objectives broader socioeconomic conceptual models that capture these additional elements and processes within the system need to be built (e.g. Grant and Griffin, 1979; Olander et al., 2015; Tomlinson et al., 2015; Nair et al., 2016).
Causal models. Once the broad system being targeted for restoration is captured in a systems model, the causal model focuses on a subset of the overall system to show how a specific
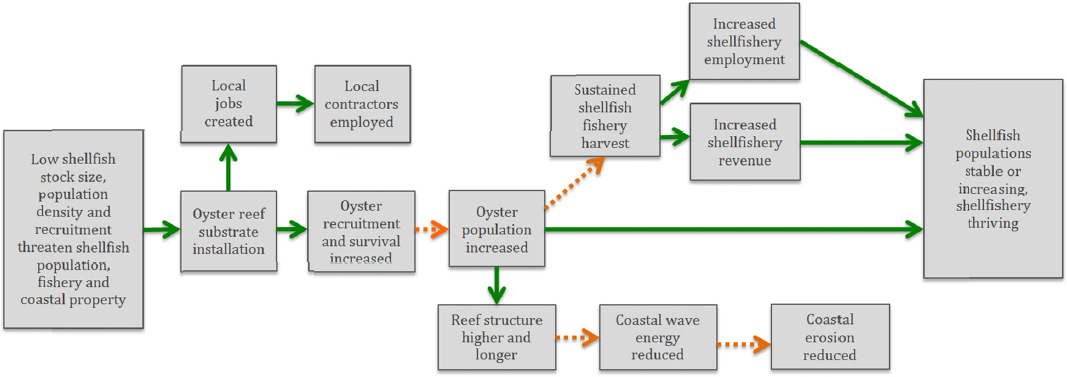
restoration action is expected to improve the system. Generally, such conceptual models start with a description of an undesirable state and detail the causal pathway by which a specific restoration action is expected to lead to a desired restoration objective. This type of conceptual model may be called a causal model, results chain, theory of change, or logic model (for example, see Foundations of Success, 2009; Thorne et al., 2015). Such causal models are often developed as part of alternative management strategy evaluations, where different possible management actions are considered and compared. Simply put, these models show how a system is expected to change in response to a given restoration action or set of actions. Figure 3.4 provides a simplified example of a causal model for a hypothetical oyster reef restoration project, showing the expected effects on environmental conditions, oyster populations, and associated ecological and economic outcomes. As with systems’ conceptual models, the strength of evidence can be summarized and included in the model, as is shown in Figure 3.4.
Both positive and negative potential ‘non-target’ outcomes are typically included in the causal model to reflect plausible risks and co-benefits. Even when a restoration project does not have social or economic objectives, consideration of unintended social and economic outcomes ought to be included. Expanding the causal model to capture non-restoration drivers that are likely to affect the desired outcome(s) is a common way to identify risks. Consideration of these drivers is especially important in larger scale restoration projects where the restoration action is likely to be only one of many forces acting on the focal system at a time (LoSchaivo et al., 2013; Rose et al., 2015). The system conceptual model can be very helpful in identifying these other drivers. In the oyster reef example, high shellfish harvest rates could counteract the potential benefits of adding more oyster substrate. These additional factors can also be reflected directly in the causal model (e.g. drawn in as additional boxes in Figure 3.4).
Restoration Objectives
As discussed in Chapter 2, restoration programs are often driven by management goals that are broad and non-specific. At a project or subregional (i.e., watershed) level, these broad goals need to be translated into specific, measurable objectives so that project performance can be quantitatively assessed relative to its objectives (Palmer et al., 2007; Kennedy et al., 2011). For example, an oyster restoration project objective may be to increase adult oyster populations twofold to improve oyster harvests through enhancement, or to
stabilize shorelines (see Part II: Oyster Reef Restoration Objectives). In situations where there are multiple objectives, for example to restore a number of bird species, objectives may be dynamic because species co-occurrence can change as a restored habitat undergoes succession (Tulloch et al., 2016).
Objectives may be expressed as basic physical or structural design conditions for a site, such as a specific elevation profile and the desired grain size distribution for an island restoration, and/or functional characteristics, such as population size. Quantitative objectives (also termed restoration targets; see Glossary) are often determined, where feasible, using historical data (prior to particular disturbances) or data from reference sites (undisturbed habitats that are similar to restoration objective conditions). The rationale for using reference sites to define a restoration target is that a location being restored will be affected by both the restoration action(s) and natural environmental conditions that change during and after restoration effort occurs (see Figure 3.1 and Box 3.1). Therefore, reference sites can help determine how much of the changes detected via monitoring in one or more restored area(s) are due to restoration action(s) rather than natural changes or effects from other (non-restoration) actions. Setting biodiversity-based targets is often a challenge due to ecological data gaps, as well as to social, economic, political, legal, and ethical considerations. These elements elevate target setting for populations (i.e., articulating how much restoration is enough) beyond a purely scientific exercise by expressing acceptable risk (Wilhere, 2008); guidance exists for setting restoration targets and alternative methods of conservation and restoration (e.g., Tear et al., 2005; Sanderson, 2006; Carwardine et al., 2009).
A helpful concept borrowed from systematic conservation planning is complementarity, or using multiple management areas to protect the target values of a set of biodiversity features together as a network (Margules and Pressey, 2000; Ardron et al., 2010). Applied to restoration practice, this idea suggests that targets can be achieved across a network of project sites in a coordinated and complementary fashion, rather than attempting to meet all project objectives within one restoration site, by one entity, or by independently implementing multiple ad hoc sites (Manning et al., 2006; Ikin et al., 2016). Because areas with individually high species richness may not maximize diversity on a landscape scale, setting targets for complementary attributes such as age, size, shape, species structure, and landscape context over a set of sites may achieve restoration objectives in a more cost-effective manner and with less of an overall footprint than site-specific target setting. For example, Ikin et al. (2006) realized higher landscape-scale bird diversity by planting complementary sets of species assemblages than planting to maximize local biodiversity at each restoration site.
Causal models (e.g., Figure 3.4) can also help guide the selection of quantitative restoration objectives. Evidence synthesis (see Chapter 6) can indicate not only how much support there is for a given link, but how large a change can be expected through a given pathway. For example, a project may have a restoration objective to triple local harvestable oyster abundance over 5 years, but review of available science shows that the largest increase the proposed action has caused in other cases is a doubling of abundance, and a 30% population increase over the same time period is the median result. This information can inform restoration design, indicating that additional actions are needed if the 300% increase is to be achieved, or that a much lower restoration objective ought to be set. Modeling can also be used to establish quantitative restoration targets and help include considerations for how the social and political context may influence the choice of targets (Eden and Tunstall, 2006; Baker and Eckerberg, 2013).
Questions to Be Resolved
Ultimately, monitoring provides information that informs future restoration decisions, and therefore, key questions to be addressed are important overarching inputs to monitoring designs. Restoration program managers’ questions could include
- Was the project constructed adequately and as designed?
- Did the restoration project meet its stated objectives?
- What realized ecological benefits and/or costs were derived from the project?
- What are the potential impacts, including benefits and costs, to society (e.g., jobs, ecosystem services)?
- What design elements could or should be adjusted in the future (or in other projects) to improve performance and efficiency in terms of overall cost?
- How will project monitoring data and information be managed and communicated?
Monitoring can also help improve a conceptual model and resolve the relative importance of various stressors (e.g., salinity, water quality, hydrologic conditions) on ecological response at a restoration site. In a monitoring design, restoration managers’ questions need to be developed into testable questions, or statements that may be evaluated based on appropriate monitoring data. Questions that are clear, testable, limited in scope, and consistent with available information are more likely to lead to sound monitoring, analysis, learning, and restoration decisions (Thom and Wellman, 1996; Keeney and Gregory, 2005; Kennedy et al., 2011; Moore and Runge, 2012).
Project-Related Inputs to Monitoring Design
When moving from the broad conceptual model and restoration objectives to a projectlevel monitoring design, specific project-related factors need to be explicitly defined. These include potential metrics, temporal and spatial scales, the availability and appropriateness of baseline or reference site data, and other constraints.
Potential Metrics
Metrics are measureable parameters that can be used to evaluate testable hypotheses and address restoration managers’ questions (as discussed in the previous section). Metrics might involve a single directly measurable quantity, such as animal or plant abundance, or a derived quantity based on multiple measures, such as a specific indicator of biodiversity. Metrics can also act as surrogates by representing other parameters that are either too numerous, challenging, or expensive to measure; for example, monitoring just a few species of birds can provide an indication of a plethora of co-occurring species (e.g., Tulloch et al., 2016). Metrics may also measure specific ecological processes, services, or functions (Short et al., 2000; Wortley et al., 2013; Palmer et al., 2014).
The suite of potential metrics for a given project and other parameters with the ability to affect those metrics can be identified from conceptual models or from existing guidance documents (e.g., Conway, 2011; Roman and Burdick, 2012; Baggett et al., 2014; Neckles et al., 2015; see also Part II). For example, a conceptual model for restoration of sea turtle populations may suggest reducing beach predation as a means of achieving the objective of increasing the survival of hatching sea turtles (see Figure II.5 in Part II). The numbers of nesting females, hatchlings produced, and predators controlled (or predator-exclusion corrals constructed) could be measured across a suite of beaches during relevant time periods compared to reference or control sites (see Box 3.1). Other related metrics potentially affecting survival might also be important to consider, especially for causative modeling, and may require different sampling regimes depending on the type of predator (terrestrial versus aquatic) or other stressors of interest. For example, artificial lighting that could cause hatchling disorientation may also need to be measured, which requires sampling at different temporal and spatial scales than sampling for predation intensity. See Part II for further discussion of metrics for different habitats and species restoration efforts.
Temporal and Spatial Scales Necessary to Address Questions
Restoration monitoring can occur at multiple spatial scales including at the individual projectlevel; over multiple projects within a hydrologic basin; or at the landscape or regional level to evaluate cumulative restoration effects (see also discussion on scaling in Chapter 6). Spatial scale is especially important for restoration projects that have widely ranging species, such as projects with the objective of improving the health and abundance of coastal bird populations or marine mammals (see Chapter 6). The design of a project-level monitoring plan needs to consider the spatial scale that it aims to inform and whether aggregation across multiple projects or even across subregions is intended. The appropriate scale needs to be evident in the management questions to be addressed, and monitoring needs to occur at the spatial scale(s) at which relevant metric(s) operate.
The spatial extent of a monitoring plan may influence selection of specific metrics and associated model to assess restoration progress (Palmer et al., 2005). A regional monitoring program might use a landscape-level metric, such as connectivity, that would not be informative at the local scale. Spatial extent may also limit the ability to make inferences about the influence of naturally varying environmental factors. For example, abundance of a desired plant species might naturally vary widely over the entire Gulf of Mexico due to estuary scale factors such as salinity and nutrients but may not naturally change much over smaller areas if these factors are relatively constant. Hence monitoring these
factors may not be necessary at a local scale but may be important at a regional scale.
Temporal scales of restoration responses and the time scales of other stressors are important considerations when developing a monitoring plan and prioritizing restoration objectives. When monitoring to determine the performance of a restoration project, a considerable amount of time may be required before progress toward some objectives can be observed (e.g., carbon storage, marine mammal population change, density of oysters), and their assessment will require a variety of measurements over appropriate spatial and temporal scales. Restoration objectives would ideally include measuring ecosystem attributes that respond within short to moderate time scales to provide near-term indications of restoration performance and to reduce long-term monitoring costs. In this case, too, monitoring needs to occur at the temporal scale at which relevant metrics operate.
Availability of Baseline Data and Reference and/or Control Sites
The availability of historical information that is collected prior to restoration and possibly prior to a disturbance prompting restoration can provide valuable information for evaluations of restoration performance (e.g., Coen et al., 2004; Burrows et al., 2005). For example, the condition measured at the site in need of restoration, but prior to initiating the restoration project, provides a measure of the baseline conditions against which to assess restoration progress (see Figure 3.1 and definitions in Box 3.1). In addition, historical information at or near a given restoration project site may provide quantitative targets for restoration in the absence of available reference sites. Therefore, it is important to determine the availability of baseline monitoring data at a restoration site and assess the value of the data for evaluating restoration performance. If existing baseline data are lacking, additional pre-project data collection will likely be needed.
Baseline data collected prior to restoration may be insufficient for a rigorous evaluation of restoration performance because natural variability and unanticipated environmental effects may confound measures of restoration response. Comparative methods using reference and control sites can help address this concern especially when matched to the restoration project site (Nichols and Williams, 2006; Stoddard et al., 2006; Hiers et al., 2012). Different strata within a restoration site may also provide information to guide and evaluate restoration actions (Nichols and Williams, 2006). It is important to note, however, that no two locations are truly identical, and there is no guarantee that progress in restoration will result in a restored site matching a reference site, especially over long time periods (Palmer et al., 2013; Mebane et al., 2015;). The availability of appropriate reference sites may be limited, and sites along a gradient of impacted conditions may be appropriate.
In some locations, control sites (sites that are similarly degraded but are not being restored; see Box 3.1) offer the only source of data on comparative environmental responses. As an example, with subtidal oyster reef restoration in the Chesapeake Bay (or elsewhere), all similar habitats to the restoration site are significantly degraded and no suitable reference sites exist (Coen and Luckenbach, 2000).
The state of Louisiana and the U.S. Geological Survey began developing the Coastwide Reference Monitoring System in 2003 to encourage consistent monitoring parameters and facilitate the comparisons between restored and reference or control sites. The program developed 390 reference sites along a range of ecological conditions in Louisiana coastal wetlands, providing hydrologic, vegetation, and soil data for each site (USGS, 2010; Hijuelos et al., 2013). This system-wide view was developed to help track changes over time and attribute change to natural variability vs. restoration given the large scale of restoration planned for the coast of Louisiana. Chapter 4 further discusses the benefits of such a system-wide view to enable an assessment of restoration progress at a larger scale.
Components and Design Decisions of a Project-Level Monitoring Plan
The inputs discussed above inform decisions and choices associated with sampling and monitoring designs. These decisions include identifying targets, criteria, and hypotheses that may be quantitatively evaluated to address management questions, metric selection, identifying specific sampling design elements such as sample size and the timing and extent of sampling, identifying sampling and analysis protocols, and determining strategies for data analysis evaluated with a formal test or predetermined decision rule. Quantitative analysis focuses on supporting management decisions through hypothesis testing and predictive modeling. From a statistical perspective, two approaches have emerged that are useful in restoration monitoring. The first approach is
based on specifying a target through a statistical hypothesis that is then evaluated with a formal test. The second relies on using a model or multiple models for evaluating data and hypotheses and using information theory and predictive analysis for addressing decisions and uncertainty (Anderson et al., 2000, Stephens et al., 2007).
Identifying Quantitative Questions
Management questions need to be translated into specific, testable hypotheses or measurable questions that can be addressed in a quantitative manner through a data collection process. In the case of oyster reef restoration, managers may want to know whether the project objective for increased abundance was obtained. To evaluate this objective quantitatively would require the selection of a target related to abundance, the time period for evaluation, and when the decision criteria is reached or exceeded. One hypothesis might be that the difference in abundance relative to a pristine reference site is greater in the period before restoration than in the period after restoration. A more specific hypothesis ties restoration outcome to a criterion associated with a numerical quantity in a specified time period (e.g., that the average abundance of oysters exceeds 100 oysters per m2 by the end of 5 years). In monitoring project performance, careful science-based evaluation requires defining restoration progress and choosing metrics and targets well-connected to that definition. In adaptive management, questions may focus on hypothesis evaluation or involve testing of predictive models. For example, causal models are used to embed hypotheses about the system behaviors and enables managers to predict and test for the impacts of their activities. Monitoring then focuses on testing these hypotheses or the predictive models, which provides the basis for learning and adaptive management. For example, human disturbance is known to be a factor affecting shorebird survival and abundance. If human activity can be controlled at various restoration sites, modeling might be useful to address when and by how much activity ought to be reduced to improve shorebird survival (Williams et al., 2009).
Selecting Metrics
Selecting the appropriate metrics to monitor is critical to rigorous assessment of restoration projects and management actions. Several factors influence the choice of the best metrics for a given restoration effort. Foremost, metrics need to provide data necessary to resolve the identified hypotheses, questions, and objectives (Coen et al., 2004; Kennedy et al., 2011; Baggett et al., 2014). For example, for performance monitoring, metrics need to facilitate an evaluation of progress toward the project objectives. A wetland restoration project with the primary objective of restoring native plant habitat may be assessed by distinctly different metrics than a project with an objective of land-building to counter sea-level rise (see Part II of this report for examples of objective-metric linkages). Restoration is often expected to develop along a path, termed a restoration trajectory (Zedler and Callaway, 1999), and different components may progress toward the intended target along different trajectories and require different timeframes, necessitating monitoring of several different structural and functional metrics (Burdick et al., 1997; Craft et al., 2003; Thayer et al., 2005). For example, some marsh fish species have been shown to return almost immediately after restoration (Simenstad and Thom, 1996; Dionne et al., 1999) and others repopulate within a year (Dibble and Meyerson, 2012). Vegetation typically requires several years to regrow, with fast-growing seagrasses coming back relatively quickly, followed by higher-altitude marsh grasses, and eventually mangrove forests (Short et al., 2000). Longer still, development of marsh nutrient and carbon pools and cycling processes can take over 20 years to reestablish (Craft et al., 2003). Restoration performance indices are sometimes used to integrate a number of structural and functional metrics into one assessment score that is comparable across projects (Chmura et al., 2012). Additional detail and examples of such metrics for different restoration contexts are described in Part II of this report.
Project-specific conceptual or causal models (see Figures 3.3 and 3.4) can help identify the most appropriate metrics (Bormann et al., 1999; Ogden et al., 2005; Rumpff et al., 2011). Any metrics that correspond to an element or assumption along the causal pathway will be useful in understanding whether a restoration project is producing the expected impact(s). The more specific the causal model, the easier metric selection becomes. For example, the oyster case shown in Figure 3.4 has identified specific elements of the oyster population known to be important for long-term population viability—oyster recruitment and post-settlement survival rates. Extensive monitoring on natural and restored subtidal (e.g., Puckett and Eggleston,
2012; Soniat et al., 2012) and intertidal (e.g., Bartol and Mann, 1997; Harding et al., 2012) reefs has shown that oyster recruitment rates can be quite variable both spatially and temporally (Roegner and Mann, 1995; Coen and Humphries, 2016; Hanley et al., 2016). These elements suggest specific metrics to track such as rates of recruitment, post-settlement survival, and density. The specificity of the model rules out other metrics such as oyster reef area or oyster percent cover when assessing long-term population viability. Additional measures would be needed to track benefits for erosion reduction, the most direct measure being adjacent shoreline erosion rates. Olander et al. (2015) provide detailed guidance on how to use causal models to derive benefit relevant indicators that capture the connection between ecological elements or processes and people that use or enjoy those elements.
Although it is difficult to identify the ideal set of metrics, criteria for good metrics include responsiveness to restoration, measurement variability (signal-to-noise ratio), ability to directly measure desired endpoints that are in a conceptual model, cost effectiveness, and ease of measurement (Neckles et al., 2013; Schlacher et al., 2014). The choice of metric also requires information about constraints and existing baseline data, and there are a variety of documents suggesting selection procedures. Schlacher et al. (2014) used a ratings-based approach to select metrics based on specific criteria. Neckles et al. (2013) describe a structured decision-making approach to aid in designing a monitoring program for salt marsh restoration that is based on reducing the number of metrics by eliminating redundant metrics, organizing management decisions, and evaluating the power of metrics to address management questions (i.e., through a priori statistical power analysis). Such activities are extremely valuable as they bring together different groups and lead to consistent, scientifically sound approaches to metric selection. Although it is best to connect metrics with conceptual models and restoration objectives, a variety of sources provide lists of recommended metrics for different restoration projects. For example, Baggett et al. (2014) provide a list of reef, environmental, and service-related metrics to consider for oyster restoration; Palmer et al. (2011) provide a list to consider for non-tidal wetland restoration monitoring. Part II of this report provides a committee-synthesized set of potential metrics that can guide monitoring according to example objectives that pertain to oyster reef, tidal wetland, seagrass, bird, sea turtle, and marine mammal restoration (see Tables II.1-II.6).
Spatial and temporal factors may impact the restoration metric effect size and the choice of metrics. The restoration metric effect size is a statistical (numerical) measure of change in the metric that is viewed as significant from a scientific or restoration perspective. For example, consider a marsh restoration with a performance objective of a 20% increase in the relative abundance of a particular species compared to the baseline. Given information about the variability in the metric, it is then possible to evaluate if this amount of change may be detected given the sample size, monitoring design, and evaluation criteria. Spatial and temporal scales are important, as the variability in a metric might change with scale. Standardized effect size (i.e., change relative to the variability) might increase over time for some metrics if the variability due to restoration decreases. Hence the expected change in a metric, as well as expected variability and timeframe, become important considerations in the choice of metric.
Careful selection of the metric(s) to be used in restoration monitoring is critical so that monitoring funds will be used efficiently (Kondolf et al., 2007; Lindenmayer and Likens, 2009, 2010). It is important to recognize that a long list of metrics is not required for many programs and need to be discouraged unless there is sufficient justification. As noted by Thom and Wellman (1996), “The primary function of the monitoring program is to assess progress and to indicate the steps required to fix a system that is not meeting expectations. Hence, it is not necessary to develop a large number of complex measures if a small, simple set of measures will suffice.”
One of the common problems with metric selection is selecting too many metrics only to find that the monitoring program cannot sustain the level of monitoring required to measure them all. For example, in the case of the Comprehensive Everglades Restoration Plan,1 the number of “performance measures” was originally about 150 and was eventually reduced to 53 (NRC, 2012). However, even after this optimization of the monitoring plan, sharp budget cuts caused further cuts to system-wide monitoring. Such problems occur when there is a lack of long-term planning and commitment of funding for monitoring and the lack of prioritization to develop limited suites of objectives and metrics. Therefore, it is critical to monitor only what is to answer the most critical
___________________
1 Comprehensive Everglades Restoration Plan: http://www.nps.gov/ever/learn/nature/cerp.htm.
management questions and knowledge uncertainties.
Determining the Sampling Design to Provide the Desired Statistical Power or Certainty
Once the testable hypotheses are defined, design inputs determined, and the metrics selected, an appropriate monitoring design can be identified, including details on sampling locations, sampling timing and frequency, and sample size appropriate for the desired statistical power or level of certainty in the results (Caughlan and Oakley, 2001; Sanderlin et al., 2014). The overall monitoring design needs to be selected to produce reliable estimates of the metrics and to be able to draw strong inference based on the monitoring data collected. The choice of a specific design also depends on other inputs (e.g., costs and other constraints, availability of suitable reference/control sites) and other design decisions (e.g., the metrics selected, the statistical approach associated with the analysis of the monitoring data).
Sampling locations and reference sites. Decisions on sampling location involve selecting reference and/or control sites (see Box 3.1), as well as selecting sampling locations within sites. Careful selection of reference and control sites is critical for assessing the progress of restoration actions relative to natural variation, as reference sites provide the target from which performance criteria can be derived and control sites provide the comparison against which progress towards targets can be measured (Underwood, 1991, 1994; Thom and Wellman, 1993; Coen and Luckenbach, 2000; Powers and Boyer, 2014). The decision of what to use for reference and control sites is partly philosophical, as there are often several valid alternatives, although there may be practical constraints based on the availability of data or physical access to the site (Baggett et al., 2014). Environmental conditions are continually changing in the Gulf of Mexico, and thus it is often not straightforward to select a reference or control site where metrics will respond in the same way as the restored site over the time period of assessment. Given that natural events occurring over the long term will likely alter the course of restoration, the use of a single reference or control site is likely to create difficulties with evaluation of progress. Multiple reference sites may better capture the natural variability in the ecosystem and in response to other stressors (Chapman and Underwood, 2000; Block et al., 2001; Maccherni et al., 2014).
Additionally, sampling control and/or reference sites at the same frequency and intensity as restoration site(s) will aid performance assessment (Shaw and Mitchell-Olds, 1993; Schwarz, 2015). Historically, many types of sampling occurred only during daylight hours, on weekdays, in suitable weather, or at an insufficient frequency. Real-time deployed sensors can help assess environmental impacts by gathering data during atypical events, and reporting these data in near real-time allows for appropriate responses to events soon after they occur. Importantly, one needs to sample monitoring parameters at sufficiently high frequencies that are biologically as well as environmentally relevant, and that are appropriate given the significant parameter variability, regardless of project objective(s). One way to enhance sampling frequency through existing efforts is to incorporate requirements for DWH restoration efforts into the Gulf of Mexico Coastal Ocean Observing System (GCOOS).2 See Tables II.1-II.6 for details on recommended sampling parameters such as temperature (often inexpensively logged near continuously), salinity, dissolved oxygen, etc. Monitoring a set of these parameters will be invaluable for assessing ocean acidification and related problems for shell-forming marine organisms like plankton, mollusks, echinoderms, and corals (Doney et al., 2009, 2012; Waldbusser and Salisbury, 2014).
When determining the sampling locations within a restored site, probabilistic selection of sampling sites is often recommended as part of the design because it has the potential to reduce bias from site selection (Gilbert, 1987; Baggett et al., 2014). The basic probabilistic approach uses simple random sampling or stratified random sampling design based on known criteria (e.g., depth, slope, proximity to other habitats, etc.). Variation in sampling design occurs based on known biological attributes (e.g., mobile or sessile organisms), the habitat or species being restored or sampled (birds, vegetation, etc.), gradients, or confounding properties of the physical units. Other sampling strategies may result from a desire to reduce variability in population estimates (see for example, Exxon Valdez Oil Spill Trustee Council, 1993; Thayer et al., 2005; Baggett et al., 2014). Simulation modeling, a method of quantitatively or computationally evaluating the
___________________
2 Gulf of Mexico Coastal Ocean Observing System (GCOOS) is one of a series of Regional Coastal Ocean Observing Systems that are part of the U.S. Integrated Ocean Observing System (US IOOS). GCOOS portal: http://data.gcoos.org. See also http://gcoos.tamu.edu/products/index.php/oil-gas/oil-spill.
behavior or performance of a system over time and/or under different conditions using a simplified representation of the system (see below), can also aid in sample site selection (Newbold, 2005; Steyer, 2010). See the recent review by Widis et al. (2015) and report by the Louisiana Coastal Protection and Restoration Authority (Hijuelos and Hemmerling, 2015) for further details on site selection.
Sample timing and frequency. Temporal sampling is often not selected randomly but is typically set at regular intervals (e.g., annual or quarterly) because of seasonal or interannual variability. The temporal spacing of sampling is important, so that factors affecting restoration performance (the signal) are captured, whereas the noise associated with temporal variability is avoided (Block et al., 2001).3 For example, in the case of oyster restoration, Baggett et al. (2014) suggest that for important metrics related to oyster populations (mean density, size, size frequency), sampling needs to be tied to the end of the maximum oyster recruitment or growth (e.g., autumn; high and low temperatures significantly impact growth rates at temperate or subtropical sites). Various methods exist for determining the spatial and temporal scale for sampling units (Hill et al., 2005; Krebs, 2009). Spatial and temporal sampling considerations are discussed in Part II for specific restoration types.
The duration of project-level monitoring is also an important consideration, and is best determined by taking into account the metrics to be used, level of relevant uncertainties, sampling frequency, constraints, and other relevant factors described in this chapter. For some Gulf restoration projects, short-term monitoring (over the duration of a particular project) may be adequate to evaluate performance. However, substantially longer-term monitoring may be required to adequately determine progress toward some objectives (although sampling frequency may decrease over time) and responses to stochastic events (e.g., storms) or longer-term drivers (e.g., sea-level rise). This need raises important questions regarding the responsibility, feasibility, and cost-effective approaches for monitoring once the implementation and funding duration of a project ends. These challenges are further discussed in Chapter 4. For example, Konisky et al. (2006) found that in salt marshes physical factors rebounded rapidly with increased flooding and salinity levels after about one year, especially for culvert projects, but biological responses were less definitive and occurred over longer timeframes. This suggests that some metrics might be removed after a certain time period or monitored with lesser frequency. In long-term monitoring efforts, the integrity of the time-series data collected is important (Lindenmayer and Likens, 2009, 2010). If there is information on how a metric might change over time or space, sampling frequency might be adapted to better measure that change. One strategy might be to sample frequently over one season and less frequently over others (Underwood, 1993). Alternatively, projects might require a long-term monitoring plan and associated funding that lasts well past the project’s construction or implementation phase.
Sample size. Quantitative design choices, such as sample size, are usually linked with data variability, which is expressed as statistical uncertainty or as statistical power. Uncertainty in an estimated parameter is described by the confidence interval, which provides a range of values over which the true value of the parameter is expected to occur at a stated degree of confidence. A power analysis is a statistical procedure that provides information on the adequacy of sample size in testing or comparative situations. The goal of the exercise is not just to determine a sample size but also to determine if the sampling and decision process is feasible. For example, in evaluating coastal wetland restoration, it is common to assess whether a performance metric is “approach[ing] reference conditions” (Palmer et al., 2011). When the variability is high or the sample size is small (or both), the restored site and the reference site comparison might result in the incorrect conclusion that there is no difference (i.e., the non-rejection of the null hypothesis of) due to the high natural variability. Therefore, sample size evaluation and study design selection become critical because the metric selection and monitoring plan ought to be designed to avoid the decision error of “not rejecting” a hypothesis test due to inadequate sample size or high variability (Block et al., 2001). Sample size estimates may be based on exact or simulation methods (Hijuelos and Hemmerling, 2015). Power analysis programs are available from standard statistical packages (e.g., Benedetti-Cecchi, 2001; Schwarz, 2015).
The power analysis approach is useful for hypothesis-based approaches to restoration evaluation when there is a specific numerical
___________________
3 Understanding the temporal cycles in data is critical in sampling temporal data to avoid problems associated with aliasing (i.e., if a signal is undersampled, the signal that is estimated from the sample has a pattern that is different than the original signal) and may result in false trend determination (Mudelsee, 2014).
target or a comparison with a reference/control (Hijuelos and Hemmerling, 2015). In other cases, where the emphasis is on the use of more complex models and the focus is prediction, a simulation-based approach is required (e.g., Sanderlin et al., 2014). Where predictive modeling is more of a focus, it is necessary to establish that candidate models and associated model parameters will have sufficient certainty to decide amongst competing models. Without attention to sample size and design, monitoring may not produce useful information and there is the potential for an excess of model uncertainty, resulting in weak inference.
Basic monitoring study designs to assess restoration performance. Depending on the historical conditions and reference data available and management questions to be resolved, several basic designs are available for restoration monitoring. The design that is recommended as the “gold standard” is the “before-after-control-impact” (BACI) design, where data are collected before and after restoration (Figure 3.1) at the restoration site and at a matched reference site (or multiple reference sites) (Stewart-Oaten et al., 1986, 1996). Such an approach has been recommended for oyster restoration projects, comparing relatively healthy unharvested natural reefs with the restored oyster reef (Coen et al., 1999; Baggett et al., 2014) as well as tidal wetlands (Konisky et al., 2006). The design requires pre- and post-construction monitoring at both reference and restored sites that is sufficient to detect performance toward structural and functional restoration objectives. The BACI design assumes that the sampling is done on the same frequency, and if different frequencies are used, there may be loss of statistical power (and hence ability to make strong inference based on the data). It is also valuable to have data on one or more matched control sites—sites that are similar to the restoration project site but still requiring restoration. These sites provide a means to compare how much progress a restoration project has made.
A second simpler but less powerful approach is to monitor specific metrics at a project site before and after restoration, and compare pre-restoration baseline data with the trajectory of a site after restoration action(s) (a “before-after” design; Michener, 1997). This approach essentially ignores the effects of non-restoration factors, which may be appropriate in some situations when the effects of these other factors are small compared to the effects of the restoration action. An example could be a large diversion event, which would be expected to dominate short-term responses on the local area. In some situations, other data or models can be used to adjust for the effects of other factors after the restoration action (Michener, 1997). Another variation would only use post-construction data (when there is little or no information about the site prior to restoration). This approach might also be feasible for restoration projects that create new habitat rather than restore existing habitat. However, these approaches may result in less defensible conclusions.
A third approach relies heavily on modeling of complex systems to analyze the performance of a restoration project, in light of many influencing factors that may vary over time. Simulation modeling can be used to predict the direction of restoration, and when combined with monitoring data, can be used to estimate the probability that a restored site is converging to the project objectives (Roman et al., 1995; Lirman and Miller, 2003). With simulation modeling, a monitoring design would be intended to provide data to help refine a model, better understand the effects of various factors and provide data to compare actual measurements against model predictions (SAIC, 1996; Meselhe et al., 2015). For example, an assessment of bird population responses needs to consider many complex factors in addition to restoration projects underway. Linked ecological and hydrological models can be used to interpret monitoring results in light of other factors, such as river flooding and climate variability, that may influence population numbers. Progress in these cases is measured by comparing future scenarios with and without restoration. Monitoring data are used to reduce uncertainty in future predictions, which can help evaluate the effects of management actions and facilitate adaptive management.
Coordination of monitoring strategies. In creating a monitoring design, it is important to recognize how the information that is collected might be used in other decision processes to balance practical with statistical and quantitative considerations. Monitoring information might not only be used for local but also for regional assessments. This consideration suggests it is important for different agencies to collaborate on prioritizing metrics, sampling frequencies, sampling and analysis protocols, and establishing and maintaining reference and control sites across multiple restoration projects. The efficiency gain for restoration funding agencies through enhanced data consistency and usability of such collaboration is potentially huge. For example, if data are collected at a restored site by one agency and at a reference site by a second agency, there
needs to be collaboration on the monitoring design and timing of sampling. Uniformity of design will lead to better opportunities for combining information into regional decision making and analysis, improved quality of data, and quicker release of information to stakeholders. Enhanced collaboration could also reduce sampling redundancies for commonly sampled parameters.
Identifying Sampling and Analysis Protocols
Protocols are documents that detail the data collection and measurement process. The purpose of the protocol is to reduce uncertainty associated with data collection by providing specific information about sampling methods, transportation, and laboratory analysis processes. Such factors affect the bias and variance of the measurements and hence the accuracy and sensitivity of the metric. Establishing a uniform approach to sampling reduces the decisions that need to be made by personnel and laboratories and can help ensure consistency across projects and changes in personnel. If different laboratories are used, there needs to be comparison with spiked samples (samples with known concentrations) to evaluate differences between laboratories. If different sampling methods are used, there may be the need for calibration of measurements. Monitoring program pilot studies can prove useful in certain restoration projects to better understand how different choices affect data variability, to evaluate the protocols, and assess the ability to make conclusions based on the probable results.
Protocols are commonly used in many monitoring programs such as bird programs or marsh monitoring programs (Conway. 2011; Folse et al., 2014). Protocols are especially important with citizen monitoring and have been successfully implemented for various restoration projects (Drociak and Bottitta, 2005).
Given that restoration projects and monitoring will be implemented by multiple agencies, it is important that some standardization of protocols be considered, developed in a coordinated fashion, and documented. The lack of a consistent protocol (sometimes at least partially due to a lack of documentation) makes it difficult to make coherent regional evaluations of multiple restoration projects. Konisky et al. (2006) note that effective regional assessments require common ecological data sets that are collected using a standardized approach. For the Gulf, this implies a need to use interagency teams with representatives from multiple disciplines and backgrounds collaborate in the development and evaluation of protocols.
Protocols ought to also be treated as information and considered part of metadata that are collected in the monitoring process (see also Chapter 5 as it relates to data stewardship). Experience shows that protocols can change over time for a variety of reasons. Results from other restoration projects may lead to protocol revisions to improve future restoration evaluations. New technologies may render existing protocols obsolete. When protocols change, how they changed needs to be documented. Ideally this documentation includes an experimental inter-comparison of the new protocol with the other to allow a quantitative interconversion. Adequately documenting changes in protocols is part of metadata and is critical for reducing uncertainty associated with these changes.
Data Analysis and Assessment
The process for assessing the data from restoration monitoring follows from the chosen questions or hypotheses and the sampling design. The three general approaches are the comparative approach, the trend approach, and predictive modeling assessment.
In the comparative approach, data collected at a restored site is compared statistically or graphically with data associated with the target. In the case of construction monitoring, the comparison may be with a fixed target (a numerical value) while in the case of restoration progress, the comparison may be with data collected before and after restoration (see previous discussions of basic monitoring designs). In case a BACI design was chosen for progress monitoring, monitoring data at the restored site can be compared to conditions at the reference site. Similarly, assessing progress toward mobile species restoration often use the comparative approach against a pre determined restoration target.
The second assessment approach is based on trend or changes in parameter estimates through time. While not ideal, such approaches often occur when there are not matched reference sites available for comparison. For example, with mobile animals such as fish or marine mammals, a restoration objective might be to increase abundances or densities of species, and there might not be reference areas for comparison (Dias and Garrison, 2015). In these cases, with sufficient temporal information, a trend can be evaluated after a restoration project is implemented and compared to trends during a pre-project period. Trend analysis is highly
dependent on the temporal scale of measurement and requires a sufficient timeframe to measure performance, as well as an understanding of the temporal cycles to assess outcome. Long-term monitoring (10 years or more) may be required for some ecological and environmental metrics. Evaluating trends in long-lived populations such as marine mammals, birds, and turtles will require a multi-decadal timeframe for evaluation given their lifespan.
Both frequentist and Bayesian methods may be useful for the above analysis. Bayesian methods treat parameters (e.g., means, slopes) as random, and model these parameters with distributions. The Bayesian approach starts with prior distributions representing prior knowledge of parameters and updates these distributions based on the data and associated statistical likelihood. The Bayesian approach has advantages as it is typically simulation based and effective with more complex models (Duncan and Vesk, 2013; Scheuerell et al., 2015).
A third evaluation approach occurs when the focus is on model predictions, and monitoring data collection is used to inform a more complex model. For example, the Louisiana Coastal Protection and Restoration Authority relies on “Future Without Action” predictions to provide a baseline for decision making (e.g., to minimize coastal flooding damage), considering modeled future project outcomes.4 This approach is often necessary for assessing large-scale restoration progress amidst many other complex influences, particularly if there are no good reference sites for comparison. Future conditions are simulated without the restoration project, but with anticipated changes in other factors and including the effects of other projects. Then the model is rerun with all conditions repeated but with the project of interest included. Thus, the difference between results is the anticipated effects of the restoration, after accounting for likely changes in non-restoration factors and other projects that could influence the effects. For example, the model LaVegMod (Visser et al., 2013) uses Louisiana Coastwide Reference Monitoring System data selected using probabilistic sampling and simulation to estimate the degree to which objectives are achieved for wetland vegetation restorations at spatial sites given information on hydrology, salinity, subsidence, sea-level rise, and nutrients over a 50-year time frame.
It is important to note that restoration projects usually fall into a statistical category called “quasi-experiments” (Eberhardt and Thomas, 1991). The restoration project site and the reference site act as treatments; however, these are treatments that have not been randomized as would be expected in a manipulative experiment (i.e., there is only one replicate of the treatment). Results, therefore, are project-specific and apply to the specific location and time but may not be generalizable to other locations and times (Green, 1979; Hurlburt, 1984; Block et al., 2001). Nevertheless, conclusions from such monitoring efforts can inform passive adaptive management. Classical experimentation requires replication of experimental units (i.e., sites that are restored)—not repeated sampling of a single experimental unit. A test that compares reference and restored sites actually is comparing the single restored site with the single reference site. Hence it is to be expected that if more measurements are made, small differences that may not be ecologically significant can become statistically significant. It is therefore important that both statistical as well as management criteria be used for the evaluation of progress (Johnson, 1999).
In adaptive management, it is sometimes possible to use a randomized control design. This design would use random allocation of a potential restoration treatment(s) to sites or spatial units and use a control site (no treatment or standard treatment) to evaluate effects of the treatments and possibly determine “best” restoration methods. With replication, such a design would be considered a true experiment and would provide strong evidence for selection of restoration methods. This approach would enable active adaptive management (see Chapter 7 for additional discussion on active adaptive management) and provide important opportunity to learn about restoration efficacy and impacts.
Analysis of monitoring data may require comparison of multiple models that change as new data are collected or information is gained. Such comparisons often involve information criteria and predictive approaches for evaluation. Multiple models may be used to gain an overall predictive analysis (Anderson et al., 2000), and the use of classical statistical hypothesis tests may not be useful (for discussion, see Lukacs et al., 2007; Stephens et al., 2007).
What is critical to understand from the management perspective is that the strength of a statement about restoration progress, regardless of the inference method, depends on the quality of the data from the monitoring design, the certainty in the underlying statistical or computational model, and the connections among the design, model, and cause and effect. Monitoring design affects the strength of inference from the analysis
___________________
4 Louisiana Coastal Protection and Restoration Authority Future Without Action: http://coastal.la.gov/whats-at-stake/fwoa.
of monitoring data regarding a specific restoration result. What can be stated about restoration and the strength of the statements is linked to the information from the monitoring program.
VALUE OF INFORMATION: LINKING MONITORING DESIGN WITH RIGOR OF ASSESSMENT CONCLUSIONS
When designing the monitoring effort, the plan needs to consider: how much the conclusions will be valued; and how important the strength of the conclusions will be (Table 3.1). The target audience or the decision-maker determines the statistical rigor and confidence needed to answer the management questions. Thus, the rigor of the statistical monitoring design determines the strength of the conclusion (statistical inference). The strength of the conclusion needs to be reflected in the reporting of restoration results. This assures that credit for restoration progress is allocated based on projects with rigorous monitoring, and that statements of progress are appropriately cautious for those with only anecdotal data or poorly designed monitoring programs. For example, most of the 62 biodiversity monitoring efforts analyzed by Kleijn and Sutherland (2003) were too poorly designed to determine whether projects had met their objectives, often lacking statistical analysis and unbiased methodology. Table 3.1 lists examples of possible conclusions and related strength of inference that can be associated with different types of monitoring designs: Conclusions associated with the strongest inference stem from the BACI and “before-after-control-reference-impact” (BACRI) designs, which yield the most certain findings, including attribution to specific restoration actions. Conclusions from sites with pre- and post-restoration monitoring (without a control or reference site) cannot provide attribution as the restoration results observed could be due to many, uncontrolled factors. It is important to recognize that while most restoration projects will have varying degrees of uncertainty associated with the outcome, it is possible to reduce some of that uncertainty through proper design of monitoring. Through this approach, stronger statements about the progress and value of restoration projects are possible.
When formulating a restoration monitoring plan it is important to consider all constraints that limit the ability of carrying out the restoration monitoring plan over the duration specified in the monitoring plan. As discussed in Box 1.2, constraints are usually associated with cost, societal, political, organizational, monitoring design, or ecosystem complexity. In addition, there may be constraints associated with the sampling process such as restrictions on when and where samples can be taken, spatial restrictions (e.g., site access), equipment and/or resource restrictions, and personnel limitations. Understanding the boundaries associated with a given restoration project are critical in refining the scope of potential monitoring decisions such that the monitoring plan is practical and can be implemented and sustained over the required time-frame. Ultimately, deliberate decisions need to be made to meet the decision maker’s need for information and degree of confidence in the conclusion. It is also important to recognize that constraints are sometimes controllable through advanced planning.
The cost of conducting a monitoring program can be substantial and one of the most difficult elements of a restoration program to estimate. An assessment of restoration projects conducted through the early 1990s showed that monitoring cost averaged 13% of the total project cost, but ranged from 3% to 67% (Shreffler et al. 1995). Recently, the San Francisco Bay Shoreline Study, which covers an area of 15,100 acres of restoration of salt ponds and tidal marsh, estimated that it would require $8.7M for adaptive management monitoring over a 10-year period.5 The Glen Canyon Adaptive Management Program ($11M per year), Sacramento-San Joaquin River Delta Plan ($11M per year), and Columbia Estuary Ecosystem Restoration Program ($4M per year) provide examples of the level of effort devoted to monitoring in larger systems. These costs can include focused uncertainties research (Thom et al., 2016).
Larger restoration programs with federal support, especially by the Corps of Engineers, have provided guidance regarding monitoring costs and duration (Thom et al., 2004). The following describes the guidance for monitoring within the Comprehensive Everglades Restoration Plan (CERP): “Monitoring and assessment activities prior to and during construction should include costs for sampling, project (contract) management and associated [quality assurance/quality control] costs, analysis, documentation, reporting, and entry of data into approved data storage. Any cost of monitoring performed during the period of construction shall be included in project construction costs and any
___________________
TABLE 3.1 Level of Confidence Possible from Statistical Conclusions, Based on Statistical Rigor of the Chosen Monitoring Design.
| Strength of the Conclusion and Required Monitoring Design | |||
|---|---|---|---|
| Level of confidence possible | Sample Statement Possible from Chosen Monitoring Design | Monitoring Designs | Caveats |
| Certain (high rigor, experimental testing, causal link) |
|
|
|
| Somewhat certain (medium rigor. correlation) |
|
|
|
| Cautious (low rigor, anecdotal) |
|
|
|
cost of monitoring performed after the period of construction shall be included in project Operations, Maintenance, Repair, Replacement and Rehabilitation (OMRRandR) costs . . . Monitoring costs for ecosystem restoration cannot be cost-shared longer than 10 years post-construction of a particular component. If required to be maintained beyond 10 years for a particular component, it will be 100% non-Federal.” (CERP, 2012a, page 5).
Costs for monitoring include a wide array of tasks, some tasks of which may not be adequately funded. Caughlan and Oakley (2001) concluded that the majority of costs for long term ecological monitoring are often allocated to data collection, while critical aspects such as scientific oversight, training, data management, quality assurance and reporting are often neglected. Thus budgeting for all program costs is a key factor in a program’s longevity. They also found a close relationship between statistical issues and cost. For example, estimating costs associated with sampling design, replication and power, and comparing those costs for various alternative designs was a way to streamline the work and develop a well-planned and realistic monitoring budget.
As discussed above, a “value of information” framework (Paulsen, 1995) could be operationalized in the context of monitoring the effectiveness of restoration actions (Thom and Wellman 1996). Here, the incremental improvement in information gain relative to questions central to the monitoring program can be weighed against cost. Decisions can then be
made regarding the value of that increment on decisions. The most common evaluative approach is to use some form of a cost-effectiveness model (Orth, 1994). This approach facilitates the comparison among alternative monitoring methods or levels of monitoring effort, and allows decision-makers to build a set of cost-effective actions that highlight the higher marginal costs associated with conducting additional sampling.
The assessment of cost for monitoring restoration projects is affected by complexity and duration of the project. Thom and Wellman (1996) suggested that, in order to make a decision on what to include or exclude in a monitoring program, the overall requirements of the program needs to be kept in mind. The monitoring program needs to accomplish the following:
- Be cost effective.
- Target restoration project goals and performance criteria.
- Develop defensible information and data.
- Facilitate decisions on midcourse corrections.
Hence, the elements included in the monitoring program are best assessed against these requirements by: (1) prioritizing these requirements; (2) listing potential monitoring components and a rough estimate of cost; and, (3) trimming down the list based upon the prioritize-ation of the requirements. A critical element of refining costs is developing clear linkages between factors that will be changed by the action to the factors that control the development of the ecological response factor. Conceptual models and numerical models can be essential tools in ascertaining these linkages.
CONCLUSIONS AND RECOMMENDATIONS
To provide assurance to funders and the public of the benefits derived from restoration investments, monitoring should be viewed as an integral part of restoration, and detailed monitoring plans should be required by restoration programs at the time of restoration proposal submission. Therefore, the committee recommends that all restoration—administered by the RESTORE Council, NFWF’s Gulf Environmental Benefit Fund, and NRDA Trustee Council, and the Gulf states—be accompanied by a strategic monitoring effort, described in a monitoring plan.
Project-level monitoring is required to assess restoration progress toward individual project objectives. To assess restoration progress at the program level and Gulf wide, a strategic monitoring effort is required that can aggregate and synthesize across projects (see Chapters 4-6 for detailed guidance). Effective construction monitoring ensures that a given project was completed in accordance with its design and applicable regulations and allows construction problems to be corrected quickly. Performance monitoring provides the information necessary to assess whether the restoration project has achieved its biological and ecological objectives. Performance monitoring requires careful design so that site level restoration-related responses can be distinguished from natural variability and changes associated with other environmental factors. Project-level monitoring may also provide support for structured learning and adaptive management.
Informative, cost-effective restoration monitoring can be challenging to design and requires thoughtful planning and execution. The restoration programs might consider providing guidance, training, and/or expertise to the grantees with regard to developing the appropriate monitoring plan including a review team with expertise in monitoring, formal evaluation, and statistics. At a minimum, all restoration projects should include construction and performance monitoring, which includes an in-depth assessment to determine whether a given project was constructed or implemented as planned and has met its stated objective(s). The committee recommends that monitoring plans be considered a prerequisite for any restoration funding and that those plans contain the following essential elements, at minimum:
- Clearly articulated measurable restoration objectives (from the project plan);
- Identification of well articulated management questions that monitoring and evaluation seek to address using conceptual system models and causal models that link ecological and socioeconomic drivers and stressors with both biophysical and ecological processes to outcomes such as populations, habitats, ecosystem, ecosystem service, and human well-being (as appropriate) (derived from a given project plan);
- Explicit identification of appropriate metrics, targets, and criteria for addressing the management questions, such as measuring ecological and, where appropriate, social and economic restoration outcomes;
- Evaluation of available baseline data appropriate to a given project objectives and/or plans to collect new baseline data if needed;
- Appropriate sampling and analysis designs, including consideration of reference and/or control site(s), sampling locations, timing, frequency, and sample size;
- Well-documented and, where possible, standardized sampling protocols;
- Rigorous data management plan (see Chapter 5 for details);
- Anticipated methods for data analysis and associated evaluation;
- Realistic project budgets and staffing to support the appropriate level of monitoring, study design, data acquisition via monitoring, data analyses, modeling, scientific oversight, training, data management, quality assurance, and reporting, etc.; and
- Monitoring program management plan (including reporting and communication plan) to assure that the applied monitoring program is efficient, accountable and transparent at all phases of a given effort.
Careful planning of a monitoring design is needed to ensure that monitoring addresses key management questions with sufficient statistical rigor. A monitoring design should be informed by overarching program-level input from the conceptual socio-ecological model, restoration objectives, and management questions and by site-level considerations including project scales, available baseline and reference sites, and potential constraints. These inputs are essential considerations to the monitoring design decisions. Decisions on testable hypotheses; metrics; sampling locations, timing, and frequency; sample size; and basic design all affect the statistical power or level of uncertainty of the results. Modeling tools are available to test the impacts of various monitoring designs to determine if they are adequate for evaluation of restoration performance with known confidence. Once data are collected and analyzed, communicating the results and associated level of confidence should accurately reflect the rigor of the monitoring program.
Lack of consistency in sampling methods, design, and analysis can significantly diminish the usefulness of the data for assessing restoration performance. Consistent monitoring designs and standardized protocols enhance consistency and usability of the data both within and across projects, increase opportunities for combining information for regional analysis, and improve the quality of data collected (see additional discussion in Chapters 5, 6, and Part II). Gulf restoration funding agencies should work together to ensure that monitoring data are as consistent and comparable as possible across the Gulf by assembling teams with expertise in restoration science, statistics, program management, monitoring and evaluation, and restoration practice that will identify critical subsets of metrics and protocols that should be standardized for a given restoration type. As much as is feasible, restoration funding agencies should also strive to create standardized metrics and protocols across all restoration types to facilitate the aggregation and synthesis of restoration data collected from distinct but interconnected restoration projects across Gulf ecosystems (see additional guidance in Chapters 4 and 6). Although standardized sampling protocols may pose challenges, especially in states where long-term data sets may exist using other protocols, there is likely a critical subset where the benefits of consistent data at a program scale justify the costs. All protocols should be well documented in the metadata reported in the monitoring process.


