
2
The Scope of the Problem
Although attention to bullying has increased markedly among researchers, policy makers, and the media since the late 1990s, bullying and cyberbullying research is underdeveloped and uneven. Despite a growing literature on bullying in the United States, a reliable estimate for the number of children who are bullied in the United States today still eludes the field (Kowalski et al., 2012; Olweus, 2013). Estimates of bullying prevalence vary greatly, and there is little consensus on the value and accuracy of existing estimates.
This chapter describes the current state of research focused on estimating rates of bullying and cyberbullying in the United States and based on the findings from four major, federally funded, nationally representative samples. The committee considers overall trends in these prevalence estimates, as well as areas of inconsistencies and potential reasons for these discrepancies across the particular studies. The committee also draws upon other large-scale studies to provide insight into various demographic factors—such as gender, age, and ethnicity—as potential risk or protective factors for youth involvement in bullying. Although perceptions and interpretations of communications may be different in digital communities, the committee decided to address cyberbullying within a shared bullying framework rather than treating cyberbullying and traditional bullying as separate entities because there are shared risk factors, shared negative consequences, and interventions that work on both cyberbullying and traditional bullying. However, there are differences between these behaviors that have been noted in previous research, such as different power differentials, different perceptions of communication, and questions of how best to approach
the issue of repetition in an online context. These differences suggest that although the Centers for Disease Control and Prevention (CDC) definition, developed in the context of traditional bullying, may not apply in a blanket fashion to cyberbullying, these two forms are not separate species. This chapter offers insights into the complexities and limitations of current estimates and underscores the challenges faced by policy makers, practitioners, advocates, and researchers.1 Although exact estimates are challenging to identify and require more comprehensive measurement of bullying that addresses the current prevalence research limitations, it is clear that a sizable portion of youth is exposed to bullying.
NATIONALLY REPRESENTATIVE STUDIES OF BULLYING IN THE UNITED STATES
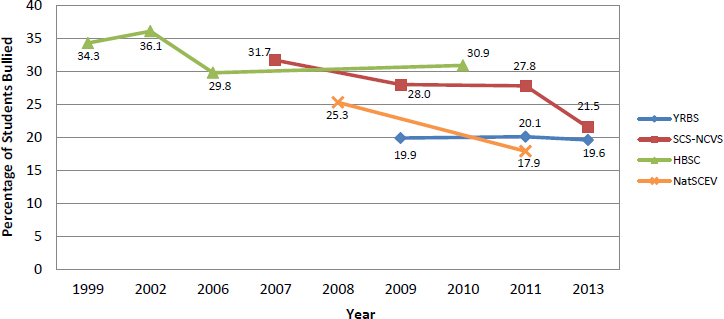
Several national surveys provide insight into the prevalence of bullying and cyberbullying in the United States. In this section, the committee focuses specifically on the School Crime Supplement (SCS) of the National Crime Victimization Survey (NCVS), the National School-Based Youth Risk Behavior Survey (YRBS), the Health Behaviour in School-Aged Children (HBSC) survey, and the National Survey of Children’s Exposure to Violence (NatSCEV) because their samples of youth are nationally representative and epidemiologically defined. The committee notes that there are a number of methodological differences in the samples and measurement across the four studies. The prevalence of bullying behavior at school ranged from 17.9 percent to 30.9 percent, whereas the prevalence of cyberbullying ranged from 6.9 percent to 14.8 percent of youth (Centers for Disease Control and Prevention, 2014b; Finkelhor et al., 2015; Iannotti, 2013; U.S. Department of Education, 2015; see Table 2-1 for a summary of these nationally representative surveys and Appendix C for detailed results from these surveys). The discussion below considers in greater detail the strengths
___________________
1 Additional information about strategies for overcoming these limitations can be found in Chapter 7.
| NCVS | YRBS | HBSC | NatSCEV II | |
|---|---|---|---|---|
| Year of most recent report release | 2015 release (data 2012-2013 school year) | 2013 | 2010 (data 2009-2010 school year) | 2013 |
| Funding organization | U.S. Department of Education | CDC and state and large urban school district school-based YRBSs conducted by state and local education health agencies | World Health Organization (WHO-Euro) | U.S. Department of Justice and CDC |
| Estimate of school bullying from most recent report | 21.5% | 19.6% | 30.9% | 17.9% (for assault by a non-sibling peer) |
| Estimate of electronic bullying from most recent report | 06.9% | 14.8% | 14.8% | 06.0% (for Internet / cell phone harassment) |
| Past years of survey that included bullying | 2013, 2011, 2009, 2007, 2005, 2003, 2001, 1999 |
2015 will be released 6/2016 2013 2011 2009 |
2009-2010 2005-2006 2001-2002 1997-1998 |
2011 2008 |
| Purpose of study | To show the relationship between bullying and cyber-bullying victimization and other crime-related variables. | To monitor priority health-risk behaviors that contribute to the leading causes of morbidity and mortality among youth and adults. | To increase understanding of health behavior, lifestyles, and their context in young people. | To support a more regular and systematic national assessment of children’s exposure to violence, crime, and abuse. |
| Sample size | 6,500 participants (for SCS - larger for NCVS) | 13,583 participants | 12,642 participants | 4,503 participants |
| Age of participants | Age 12 - Age 18 | Age 14 – Age 18 | Age 10 –Age 16 | 1 month to Age 17 (parent report for children under 10 years old) |
| Geographic coverage | Nationally representative | Nationally representative | Nationally representative | Nationally representative |
| NCVS | YRBS | HBSC | NatSCEV II | |
|---|---|---|---|---|
| Study method | Randomly selected students are administered face-to-face or telephone interviews using computer-assisted personal interviewing. | Randomly selected students are administered a self-report questionnaire regarding health-risk behaviors plus obesity, overweight, and asthma. | Randomly selected students are administered a self-report questionnaire about nutrition, physical activity, violence, bullying, relationships, perceptions of school, and alcohol and drug use. | After a short interview is conducted with an adult caregiver for family demographic information, randomly selected students are administered a telephone questionnaire on sexual assault, child maltreatment, conventional crime, Internet victimization, peer and sibling victimization, and witnessing indirect victimization. |
NOTES: NCVS = National Crime Victimization Survey; YRBS = National School-Based Youth Risk Behavior Survey; HBSC = Health Behaviour in School-Aged Children Survey; NatSCEV = National Survey of Children’s Exposure to Violence.
SOURCES: Centers for Disease Control and Prevention (2010, 2012, 2014b), DeVoe et al. (2010, 2011), Finkelhor et al. (2012, 2015), Iannotti (2012, 2013), U.S. Department of Education (2013, 2015), U.S. Department of Health and Human Services (2008), World Health Organization (2003).
and weaknesses of the methods employed by each of these surveys, in an effort to elucidate factors that may contribute to the variation in reported prevalence rates.
School Crime Supplement of the National Crime Victimization Survey
The SCS is a national survey of 4,942 students ages 12 through 18 in U.S. public and private elementary, middle, and high schools as well as home-schooled youth (U.S. Department of Education, 2015). Created as a supplement to the NCVS and co-designed by the Department of Education, National Center for Education Statistics, and Bureau of Justice Statistics, the SCS survey collects information about victimization, crime, and safety at school (U.S. Department of Education, 2015). The survey was designed to assist policy makers as well as academic researchers and practitioners at the federal, state, and local levels so they can make informed decisions concerning crime in schools. NCVS crime data come from surveys administered by field representatives to a representative sample of households in the United States throughout the year in person and over the phone (U.S.
Department of Education, 2015).2 In 2015, the SCS administration tested two different ways of asking about bullying to better align with the CDC definition of bullying.
The SCS asked students a number of key questions about their experiences with and perceptions of crime and violence that occurred inside their school, on school grounds, on a school bus, or on the way to or from school.3 Additional questions not included in the NCVS were added to the SCS, such as students’ self-reports of being bullied and perceived rejection at school. This survey’s approach to bullying and cyberbullying is far more intensive than the other national surveys; however, it is limited by its focus exclusively on reports of being bullied (being a target of bullying behavior), with no information on perpetration. Additional information is also available regarding differences in rates of being bullied and cyberbullied by student characteristics such as gender, race and ethnicity, school and grade level, school enrollment, geographic region, eligibility for reduced-price lunch, household income, and student-teacher ratio. Other characteristics of the events assessed include whether or not an adult was notified of the bullying incident, injury, frequency of bullying, form of bullying, and location of the bullying (U.S. Department of Education, 2015). The SCS data showed that in 2013, 21.5 percent of students ages 12-18 were bullied on school property and 6.9 percent of students were cyberbullied anywhere (U.S. Department of Education, 2015; see Appendix C, Tables C-1 through C-3).4
Although the SCS provides the most recent and in-depth assessment of bullying and cyberbullying prevalence in the United States, it has several major limitations. The questions about being bullied or cyberbullied are only included in the SCS, a supplement to the NCVS; therefore, its sample size is only a fraction of that of the larger NCVS.5 The SCS and NCVS data, similar to the other national datasets, are voluntary self-report surveys. These surveys focused on students ages 12-18 and on their experience be-
___________________
2 Households are selected through a stratified, multistage, cluster sampling process. Households in the sample are designed to be representative of all households as well as noninstitutionalized individuals ages 12 or older.
3 For the SCS, being “bullied” includes students being made fun of, called names, or insulted; being the subject of rumors; being threatened with harm; being pushed, shoved, tripped, or spit on; being pressured into doing things they did not want to do; being excluded from activities on purpose; and having property destroyed on purpose. “At school” includes the school building, school property, school bus, or going to and from school. Missing data are not shown for household income.
4 In 1995 and 1999, “at school” was defined for respondents as in the school building, on the school grounds, or on a school bus. In 2001, the definition for “at school” was changed to mean in the school building, on school property, on a school bus, or going to and from school.
5 The NCVS has a nationally representative sample of about 90,000 households comprising nearly 160,000 persons, whereas the sample size of the SCS is just 4,942 students.
ing bullied; data are not available from younger children and from children who have bullied others or children who have witnessed bullying instances. The survey also fails to address rates of bullying among various subpopulations of youth, such as groups differentiated by their sexual orientation or gender identity, by weight status, or by religious minorities.
School-Based Youth Risk Behavior Survey
The YRBS is one component of the Youth Risk Behavior Surveillance System (YRBSS), an epidemiological surveillance system developed by the CDC to monitor the prevalence of youth behaviors that most influence health (Centers for Disease Control and Prevention, 2014b). The YRBS is conducted biennially and focuses on priority health-risk behavior established during youth (grades 9-12) that result in the most significant mortality, morbidity, disability, and social problems during both youth and adulthood.6 State and local education and health agencies are permitted to supplement the national survey to meet their individual needs.
National YRBS
Bullying and cyberbullying estimates include responses by student characteristics, such as gender, race and ethnicity, grade level, and urbanicity of the school.7,8 The data showed that 19.6 percent of children ages 14-18 were bullied on school property and 14.8 percent of children ages 14-18 were electronically bullied (Centers for Disease Control and Prevention, 2014b; see Appendix C, Table C-4). The data captured by the national YRBS reflect self-report surveys from students enrolled in grades 9-12 at public or private schools. As with the other nationally representative samples, it does not identify many subpopulations that are at increased risk for bullying such as lesbian, gay, bisexual, and transgender (LGBT) youth and overweight children. The YRBS gathers information from adolescents approximately ages 14-17; but it offers no nationally representative information on younger children (Centers for Disease Control and Prevention, 2014b). The survey gathers information on Hispanic, black, and white students but does not identify other races and ethnicities.
___________________
6 The YRBS uses a cluster sampling design to produce a nationally representative sample of the students in grades 9-12 of all public and private school students in the 50 states and the District of Columbia.
7 The 2014 YRBS does not clarify whether this includes school events held off campus or the children’s journey to and from school.
8 Electronically bullied includes being bullied through e-mail, chat rooms, instant messaging, Websites, or texting.
State and Local YRBS
The YRBSS is the only surveillance system designed to monitor a wide range of priority health risk behavior among representative samples of high school students at the state and local levels as well as the national level (Centers for Disease Control and Prevention, 2014b).9 There is a smaller sample of middle school youth that is included in various state YRBS results, but national-level estimates are not available. The 2014 CDC report includes state- and local-level surveys conducted by 42 states and 21 large urban school districts. Of the 42 states that conducted their own YRBS survey, 26 asked questions about bullying and cyberbullying.10 The state-specific results for bullying prevalence ranged from a high of 26.3 percent in Montana to a low of 15.7 percent in Florida (Centers for Disease Control and Prevention, 2014b). Whereas this state-level high is relatively similar to the prevalence of 19.6 percent reported by the national YRBS, the state-level low is less than a third of the national prevalence. For cyberbullying, the state results ranged from a high of 20.6 percent in Maine to a low of 11.9 percent in Mississippi. The national YRBS cyberbullying prevalence of 14.8 percent is about in the middle of these extremes (Centers for Disease Control and Prevention, 2014b).
At this time, the available state and local data are highly variable due to major limitations caused by self-reports, variable definitions of bullying, and the limited age range of students, making it difficult to gauge differences in bullying prevalence among states and in comparison to national estimates.
The Health Behaviour in School-Aged Children Survey
The HBSC survey is an international study that generally addresses youth well-being, health behavior, and their social context (Iannotti, 2013). This research is conducted in collaboration with the World Health Organization Regional Office for Europe, and the survey is administered every 4 years in 43 countries and regions across Europe and North America. The HBSC survey collects data on a wide range of health behaviors, health indicators, and factors that may influence them. These factors are primarily characteristics of the children themselves, such as their psychological attributes and personal circumstances, and characteristics of their perceived social environment, including their family relationships, peer-group associations, school climate, and perceived socioeconomic status (Iannotti, 2013).
___________________
9 Each state-based and local-school-based YRBS employs a two-stage, cluster sample design to produce representative samples of students in grades 9-12 in the survey’s jurisdiction.
10 States and cities could modify the national YRBS questionnaire for their own surveys to meet their needs.
The most recent survey focused solely on the United States was conducted in the 2009-2010 school year. The 2009-2010 HBSC survey included questions about nutrition; physical activity; violence; bullying; relationships with family and friends; perceptions of school as a supportive environment; and use of alcohol, tobacco, marijuana, and other drugs (Iannotti, 2013).11,12 Regarding bullying and cyberbullying, the HBSC asked questions only about the frequency with which children were bullied in the “past couple of months,” with follow-up questions about the frequency of a certain type of bullying a student experienced (called names or teased, left out of things, kicked or pushed, etc.). The survey found that 30.9 percent of children ages 10-16 were bullied at school and 14.8 percent of children ages 10-16 were bullied using a computer or e-mail (Iannotti, 2013; see Appendix C, Tables C-6 and C-7).13 The survey is the only nationally representative survey that asked students how often they bullied another student and the type of bullying they carried out. It found that 31.8 percent of students bullied others and 14.0 percent of students cyberbullied other children (Iannotti, 2013). It is the only national survey that asked students to report on the reason they thought they were bullied (e.g., how often were you bullied for your race/color?; how often were you bullied for your religion?). (For additional detail, see Appendix C, Tables C-6 and C-7). Nevertheless, like the other surveys reviewed here, the HBSC survey is limited by the nature of self-reported and voluntary data from minors, as well as by its decision to limit questions only to frequency of incidents.
National Survey of Children’s Exposure to Violence
The National Survey of Children’s Exposure to Violence II (NatSCEV II) was designed to obtain up-to-date incidence and prevalence estimates for a wide range of childhood victimizations (Finkelhor et al., 2015). The first such assessment, the National Survey of Children’s Exposure to Violence I (NatSCEV I), was conducted in 2008. This updated assessment, conducted in 2011, asked students to report on 54 forms of offenses against them. The offenses include sexual assault, child maltreatment, conventional crime, Internet victimization, peer and sibling victimization, witnessing victimiza-
___________________
11 The student survey was administered in a regular classroom setting to participating students by a school representative (e.g., teacher, nurse, guidance counselor, etc.).
12 Three versions of the self-report questionnaire were administered: one for fifth and sixth graders; one for students in seventh, eighth, and ninth grade; and one for students in tenth grade. The tenth grade questionnaire contained the complete set of questions asked.
13 This is the highest prevalence rate for both bullying and cyberbullying reports among the four national surveys.
tion, and indirect victimization (Finkelhor et al., 2015).14 While this survey asked questions regarding bullying-type incidents, many of the questions referred to the offenses as “assault” rather than bullying, which typically includes a wider scope of victimization. It addressed these offenses by age and gender of the child who was bullied. NatSCEV II found that 17.9 percent of children ages 1 month to age 17 had experienced an assault by a nonsibling peer, 1.8 percent of children had experienced a bias assault, and 6.0 percent experienced Internet/cell phone harassment (Finkelhor et al., 2015; see Appendix C, Table C-5). It is not clear whether Internet or cell phone harassment meets the CDC definition of bullying.
Trends over Time
Although attention to bullying and cyberbullying has increased, the extent to which rates of bullying have changed in recent years is unclear (Figures 2-1 and 2-2) (Kowalski et al., 2012; Limber, 2014). As illustrated in Figure 2-1, data from the SCS-NCVS indicate a sharp reduction in the percentage of 12-18 year olds who reported being bullied at school—from 27.8 percent to 21.5 percent in just 2 years (U.S. Department of Education, 2015).
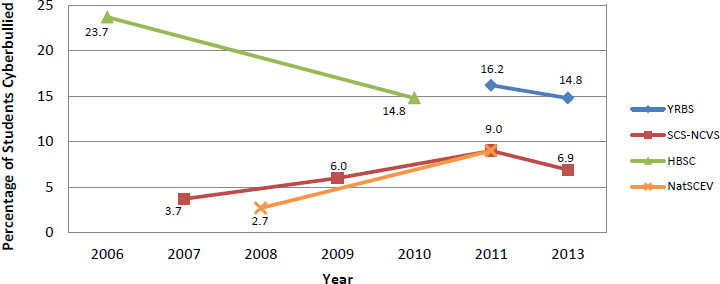
While the YRBS and NatSCEV mirror this decline, neither found so large a change (Finkelhor et al., 2015; Centers for Disease Control and Prevention, 2014b; see Figure 2-1). Findings from the HBSC survey show an increase in bullying among 11-, 13-, and 15-year-old youth in the United States of about 1 percentage point between 2006 and 2010 (Iannotti, 2013). As illustrated in Figure 2-2, the trend in cyberbullying over time is even less clear. According to the SCS-NCVS data, the percentage of students ages 12-18 who were cyberbullied doubled between 2001 and 2007 but declined by 2 percentage points between 2011 and 2013 (U.S. Department of Education, 2015).15 While the HBSC survey and the YRBS also showed a decline in the percentage of students who have been cyberbullied, the NatSCEV showed an increase in the percentage of students who experienced Internet and/or cell phone harassment (see Figure 2-2).
Because the available national trend data are limited in the range of years for which data are available and because findings vary somewhat
___________________
14 For NatSCEV II, data were collected by telephone interview on 4,503 children and youth ages 1 month to 17 years. If the respondent was between the ages of 10-17, the main telephone interview was conducted with the child. If the respondent was younger than age 10, the interview was conducted with the child’s primary caregiver.
15 The statistical standard for referring to “trends” is at least three data points in the same direction. In the SCS, the decrease from 2011 to 2013 is one data point, and conclusions should not be drawn at this point in time.
NOTES: HBSC = Health Behaviour in School-Aged Children; NatSCEV = National Survey of Children’s Exposure to Violence, NCVS = National Crime Victimization Survey; SCS = School Crime Supplement of the NCVS, YRBS = National School-Based Youth Risk Behavior Survey.
SOURCES: Centers for Disease Control and Prevention (2010, 2012, 2014b), DeVoe et al. (2010, 2011), Finkelhor et al. (2012, 2015), Iannotti (2012, 2013), U.S. Department of Education (2013, 2015), U.S. Department of Health and Human Services (2008), World Health Organization (2003).
among the major national samples, it is difficult to gauge the extent to which bullying may have increased or decreased in recent years. Additional data points will be necessary to determine national trends in the prevalence rates for children and youth who are bullied.
EXISTING ESTIMATES OF BULLYING IN THE UNITED STATES BY SUBPOPULATION
In an effort to understand the nature and extent of bullying in the United States, some studies have examined specific subpopulations or subsets of children involved in bullying incidents. Because the major national surveys that include bullying do not uniformly or fully address the bullying experience of subpopulations of interest,16 in this section the committee also draws upon findings from meta-analyses and independent large-scale research. Although these studies are limited by inconsistent definitions, survey data based on self-reports, differing age ranges, and a lack of questions seeking responses from children who have bullied or have witnessed bullying incidents, they do provide valuable insight into particular risk factors or protective factors for involvement in bullying, insights that are generally not available from the surveys of nationally representative samples. The committee expands on risk and protective factors in Chapter 3.
Prevalence of Bullying by Age
A majority of bullying research has shown that children’s experiences with bullying vary significantly according to their age. Decreases with age in rates of being bullied were reported in the SCS.
As reported by Limber (2014), a meta-analysis by Cook and colleagues (2010) found that the likelihood of both being bullied and perpetrating bullying behavior peaked in the early adolescent years (ages 12-14) before decreasing slightly in later adolescence (Limber, 2014). Decreases with increasing grade level in rates of being bullied were also reported in the SCS-NCVS.
For example, whereas 27.8 percent of sixth graders reported being bullied at school in 2013, 23.0 percent of ninth graders and 14.1 percent of twelfth graders said they had been bullied (U.S. Department of Education, 2015; see Figure 2-3). Although these data suggest that the overall chances
___________________
16 The committee’s Statement of Task (see Box 1-1) requested “a particular focus on children who are most at risk of peer victimization—i.e., those with high-risk factors in combination with few protective factors . . .” At-risk subpopulations specifically named in the Statement of Task were “children with disabilities,” poly-victims, LGBT youth, and children living in poverty . . .”
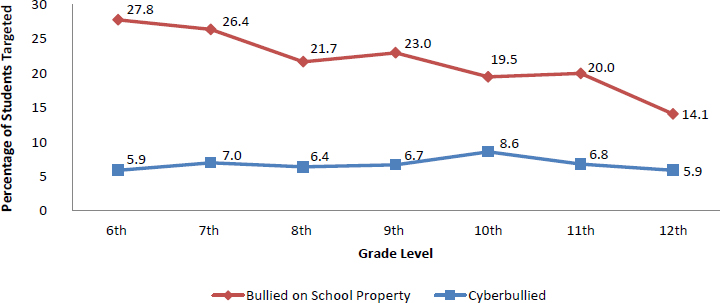
SOURCE: Data from U.S. Department of Education (2015).
of being bullied are particularly likely in middle childhood, children are more or less likely to be involved in specific forms of bullying at different ages, depending on their verbal, cognitive, and social development (Limber, 2014).
Reports of being bullied through an electronic context appear to peak later than reports of being bullied by a more traditional context; the SCS, for example, reported a peak for cyberbullying in tenth grade (U.S. Department of Education, 2015). According to a 2015 overview of teen’s social media and technology use, the Pew Research Center found that 68 percent of teens ages 13-14 had access to a smartphone and 84 percent had access to a desktop or laptop computer, whereas 76 percent of teens ages 15-17 had access to a smartphone and 90 percent had access to a desktop or laptop computer (Lenhart et al., 2015). Today’s youth are often referred to as “digital natives” due to their upbringing immersed in technological tools including smartphones and social media, while adults are often referred to as “digital immigrants.” This report found that approximately three-fourths of teens ages 13-17 reported access to a cell phone and 94 percent of teens reported going online daily, including 24 percent who said they go online “almost constantly” (Lenhart et al., 2015). Owning a mobile phone allows for ongoing access to the Internet, including social media and other communication tools that may foster opportunities for bullying. Approximately one-quarter of teens surveyed described themselves as “constantly connected” to the Internet (Lenhart et al., 2015). Among teens 13-17 years old, most reported using several forms of social media including Facebook,
Instagram, Snapchat, and Twitter (see Figure 2-4). A previous study found that older adolescents viewed Facebook as a powerful source of influence through four major processes: connection to others, comparison with peers, building an online identity, and an immersive multimedia experience (Moreno et al., 2013).
This increasing access to and use of technologies with age may help explain rising rates of cyberbullying as adolescents age. An older study of 10-17 year olds found an “online harassment” prevalence of approximately 9 percent (Wolak et al., 2007). However, a more recent study, which focused on middle school adolescents, found a lower prevalence of cyberbullying: 5 percent reported being a perpetrator of cyberbullying, and 6.6 percent reported being a target of cyberbullying (Rice et al., 2015).
Smith and colleagues (2008) found rates of cyberbullying to be lower than rates of traditional bullying, but appreciable, and reported higher cyberbullying prevalence outside of school than inside. It is possible that reported cyberbullying rates are lower than traditional bullying rates because
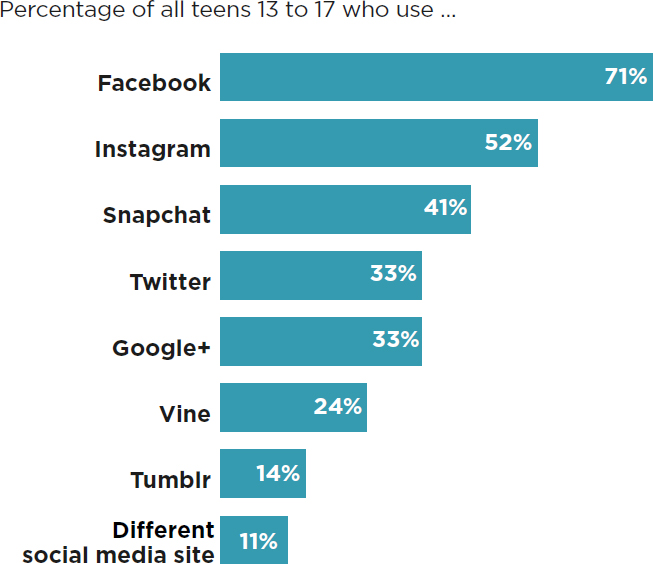
SOURCE: Adapted from Lenhart (2015, p. 2)
much of technology use occurs outside of school and current approaches to measuring bullying are designed mostly to assess rates of traditional bullying in school (Smith et al., 2008). Previous work has suggested that increased Internet use is associated with increased risk for cyberbullying (Juvonen and Gross, 2008).
Although research has suggested that the prevalence of bullying among older adolescents is lower than that of younger adolescents, researchers have proposed that cyberbullying among older students may represent a continuation of behaviors from previous grades but with a focus on technological tools for more subtle bullying techniques (Cowie et al., 2013).
Prevalence of Bullying by Gender
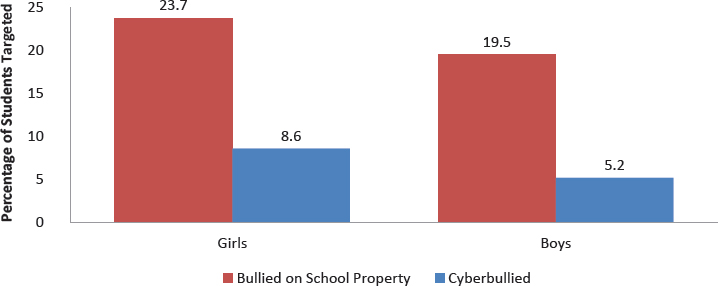
Research has confirmed that there are gender differences in the frequency with which children and youth are involved in bullying. A recent meta-analysis found that although boys and girls experienced relatively similar rates of being bullied, boys were more likely to bully others, or to bully others and be bullied, than girls were (Cook et al., 2010; Limber, 2014). Research has suggested that there are gender differences in the frequency with which children and youth are involved in bullying. The SCS, YRBS, and NatSCEV found that rates for self-reports of being bullied range from 19.5 to 22.8 percent for boys and from 12.8 to 23.7 percent for girls (Centers for Disease Control and Prevention, 2014b; Finkelhor et al., 2015; U.S. Department of Education, 2015). All three of these national surveys found that girls were more likely to report being bullied than were boys (see Figure 2-5 for SCS data).
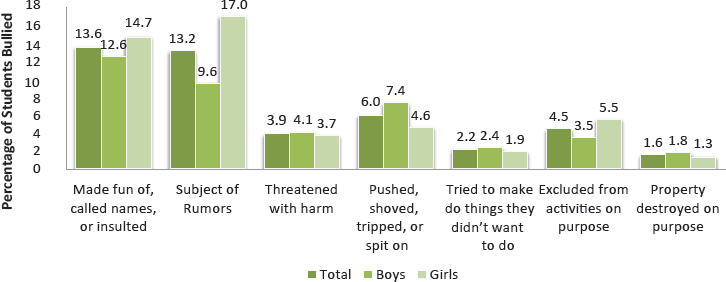
Research has suggested similarities and differences, beyond just overall frequency, in how often boys and girls experience different forms of bullying (Felix and Green, 2010). As noted in Chapter 1, there are two modes of bullying (direct and indirect) as well as different types of bullying (physical, verbal, relational, and damage to property). As illustrated in Figure 2-6, being made fun of or called names and being the subject of rumors are the two most common forms of bullying experienced by children and youth, and both are much more frequently experienced than physical bullying (Iannotti, 2013; Limber, 2014; U.S. Department of Education, 2015). For example, the 2013 SCS found that 13.2 percent of youth ages 12-18 reported being the subject of rumors and 13.6 percent said they had been made fun of, called names, or insulted, compared with 6.0 percent who reported being pushed, shoved, tripped, or spit on (U.S. Department of Education, 2015; see Figure 2-6). Notions of gendered forms of bullying are common because physical aggression has been regularly associated with boys, whereas relational aggression has been considered to be the domain
SOURCE: Data from U.S. Department of Education (2015).
SOURCE: Data from U.S. Department of Education (2015).
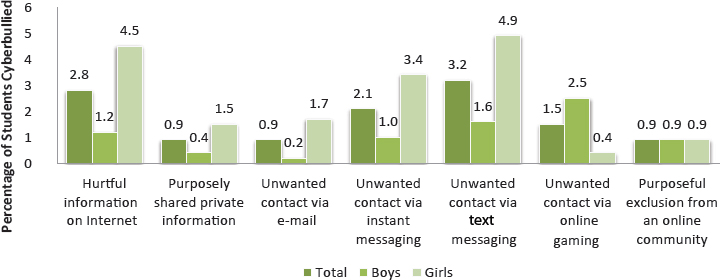
of girls (Oppliger, 2013). For example, studies have shown that indirect aggression is normative for both genders, while boys are more strongly represented in physical and verbal aggression (see review by Card et. al., 2008). As for differences in different forms of cyberbullying, according to the 2013 SCS, girls experienced a higher prevalence of being bullied in nearly all types, except for receiving unwanted contact while playing online games and facing purposeful exclusion from an online community (Limber, 2014; U.S. Department of Education, 2015; see Figure 2-7). However, because there is not yet a common definition of cyberbullying, there is no agreement on what forms of online harassment fall under the umbrella term of “cyberbullying.”
SOURCE: Data from U.S. Department of Education (2015).
Limber and colleagues (2013) observed that age trends for self-reports of bullying others varied for boys and girls. Among boys, bullying others increased from grades 3 through 12, but among girls, rates of bullying others peaked in eighth grade (Limber et al., 2013). Among older adolescents and college students, cyberbullying may be more common than traditional bullying. Prevalence rates of cyberbullying among young adults and college students have been estimated to be around 10-15 percent (Kraft and Wang, 2010; Schenk and Fremouw, 2012; Wensley and Campbell, 2012).
Prevalence of Bullying by Race and Ethnicity
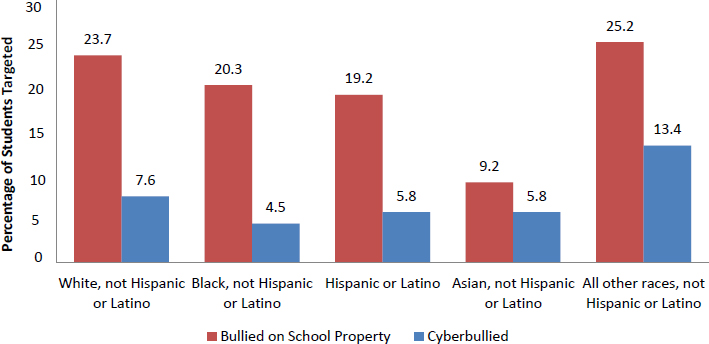
There has been only limited research on the roles that race and ethnicity may play in bullying (Larochette et al., 2010; Peskin et al., 2006; Spriggs et al., 2007).17 Data from the SCS indicate that the percentage of students who reported being bullied at school in 2013 was highest for white students (23.7%) and lowest for Asian students (9.2%), with rates for black students (20.3%) and Hispanic students (19.2%) falling between (see Figure 2-8; data from U.S. Department of Education, 2015). Data from the national YRBS were highest for white students (21.8%), next highest for Hispanic students (17.8%), and lowest for black students (12.7%) (Centers for Disease Control and Prevention, 2014b). The YRBS data did not include any other ethnicities/races.
It is challenging to interpret the percentages of children and youth who are bullied across different racial and ethnic groups, due to the limited
___________________
SOURCE: Data from U.S. Department of Education (2015).
information currently available on racial and ethnic differences in definitions of bullying and on whether and how bullying may vary according to the racial/ethnic diversity and density of schools and communities. See Chapter 3 for a discussion of contextual factors, including the school and community contexts, and their modulation of the relations between individual characteristics and prevalence of involvement in and consequences of bullying by race/ethnicity.
DISPARITIES IN BULLYING PREVALENCE IN THE UNITED STATES AMONG VULNERABLE GROUPS
In addition to exploring standard demographic differences in bullying (i.e., gender, age, race/ethnicity), researchers have identified specific populations that are at increased risk for being bullied. This section reviews the research on groups for which there is consistent epidemiologic evidence of disparities in being the target of bullying, including LGBT youth, overweight/obese youth, and youth with disabilities. The committee also identified groups for which the evidence of increased risk is not currently consistent and which therefore warrant greater research attention (U.S. Government Accountability Office, 2012). In this chapter, we report descriptive data on prevalence rates; see Chapter 3 for a discussion of factors that contribute to these disparities in rates of bullying (e.g., stigma) as well as research evidence on specific forms of bullying (e.g., bias-based bullying) that are more likely to occur among some of the groups covered in this section.
Differences in Bullying by Sexual Orientation and Gender Identity
LGBT youth, youth questioning their sexuality, and youth who do not conform to gender stereotypes frequently face bullying by their peers (Eisenberg and Aalsma, 2005; Espelage et al., 2008; Garofalo et al., 1998; Rivers, 2001; Russell et al., 2014). The prevalence of bullying of lesbian, gay, and bisexual (LGB) males and females ranges from 25.6 percent to 43.6 percent (Berlan et al., 2010).
Most research on bullying related to sexual orientation and gender identity comes from nonprobability samples. For example, the 2003 Massachusetts Youth Risk Behavior Survey found that 42.0 percent of sexual-minority youth reported being bullied in the 12 months prior to survey administration (Hanlon, 2004). Similarly, the cross-sectional analysis of the 2001 questionnaire from the Growing Up Today study, a national longitudinal study involving 7,559 youths (ages 14-22) who were children of nurses participating in the Nurses’ Health study found that the prevalence of bullying victimization was lowest in heterosexual female respondents (15.9%) and highest in gay male respondents (43.6%) (Berlan et al., 2010). Girls identifying as “mostly heterosexual” and “mostly bisexual” were at increased risk for perpetrating bullying compared to heterosexual girls, while boys identifying as gay were less likely to perpetrate bullying than were heterosexual boys (Berlan et al., 2010).
A growing body of research has aimed to assess the experiences of transgender youth specifically. The existing quantitative research suggests that most transgender youth experience regular bullying and harassment at school (Grant et al., 2011; Kosciw et al., 2012; McGuire et al., 2010). For instance, in a sample of 5,542 adolescents sampled online, 82 percent of the transgender or gender nonconforming youth reported any bullying experience in the past 12 months, compared to 57 percent among cisgender boys and girls (Reisner et al., 2015).18
Measures of sexual orientation—including sexual attraction, sexual behavior, and sexual identity—have been recently incorporated into large surveillance systems, such as some state and local versions of the YRBSS, which have provided population-based estimates of bullying among LGB youth. Two of CDC’s large surveillance systems—School Health Profiles and the School Health Policies and Practices studies—assess school health policies and practices relevant to LGB students including the prohibition of harassment and bullying (Centers for Disease Control and Prevention, 2014a). The results from these sources provide a means to assess sexual-orientation differences in bullying perpetration and victimization among
___________________
18Reisner and colleagues (2015, p. 1) define cisgender youth as youth “whose gender identity or expression matches one’s sex assigned at birth.”
youth by location within the United States (Centers for Disease Control and Prevention, 2014a).19 Recent analyses by Olsen and colleagues (2014) were conducted by creating two datasets: one that combined 2009-2011 YRBS data from 10 states (Connecticut, Delaware, Hawaii, Illinois, Maine, Massachusetts, North Dakota, Rhode Island, Vermont, and Wisconsin) and the other that combined YRBS data from 10 school districts (Boston, Chicago, District of Columbia, Houston, Los Angeles, Milwaukee, New York City, San Diego, San Francisco, and Seattle). Adjusted prevalence rates for being bullied on school property were lowest for both heterosexual boys and girls (18.3% and 19.9%, respectively, based on the state dataset; 11.4% and 11.8%, respectively, based on the district dataset) and highest among gay boys (43.1% and 25.7%, respectively, based on the state and district datasets) and bisexual boys (35.2% and 33.2%, respectively, based on the state and district datasets) (Olsen et al., 2014). Rates of being bullied on school property were intermediate for the lesbian girls (29.5% in the state dataset, and 14.0% in the district dataset) and bisexual girls (35.3% in the state dataset, and 18.8% in the district dataset).
Given the absence of measures of gender identity disaggregated from sex in these large state and local datasets, population-based estimates of the prevalence of bullying among transgender youth are not currently available. However, recent research has conducted cognitive testing to determine the most reliable and valid way of assessing gender identity among both adults (GenIUSS Group, 2013) and youth (e.g., Conron et al., 2008). Further, population-based datasets have very recently begun to include measures of gender identity among youth (e.g., the 2013-2014 California Healthy Kids Survey), which will enable researchers to examine gender identity–related disparities in bullying using representative samples of youth.
Using data from the first wave (1994-1995 school year) of the National Longitudinal Study of Adolescent Health, which included 10,587 youth between 13 and 18, Russell and colleagues (2002) examined differences in experiencing, witnessing, and perpetrating violence, depending on the respondent’s self-reported category of romantic attraction (same-sex, both-sex, or other-sex), a measure of sexual orientation. Youth who reported same-sex or both-sex attraction were more likely to experience and perpetrate the most dangerous forms of violence (e.g., pulling a gun or knife on someone, shooting or stabbing someone) and to witness violence (Russell et al., 2002). These findings were not disaggregated by sex or gender identity.
___________________
19 The National YRBS data available at the time of publication did not include questions about sexual identity and sex of sexual contacts, but these topics are included in the YRBS report released in June 2016.
Differences in Bullying Among Youth with Disabilities
Much of the existing data suggests that students with disabilities are overrepresented within the bullying dynamic (McLaughlin et al., 2010; Rose, 2015; Rose et al., 2010), whether as children who have bullied (Rose et al., 2009), children who have been bullied (Blake et al., 2012; Son et al., 2012), or children who have both bullied and have been bullied (Farmer et al., 2012).20 Specifically, national prevalence data suggest that students with disabilities, as a whole, are up to 1.5 times more likely to be bullied than youth without disabilities (Blake et al., 2012); this disproportionate bullying begins in preschool (Son et al., 2012) and continues through adolescence (Blake et al., 2012; Rose, 2015).
However, variability exists in reported prevalence rates of involvement for various subgroups of youth with disabilities. For example, Rose and colleagues (2015) conducted a prevalence study of a large sample of youth with and without disabilities in middle and high school (n = 14,508) and determined that 35.3 percent of students with emotional and behavioral disorders, 33.9 percent of students with autism spectrum disorders, 24.3 percent of students with intellectual disabilities, 20.8 percent of students with another health impairment, and 19.0 percent of students with specific learning disabilities experienced high levels of victimization. In addition, 15.3 percent of youth with emotional and behavioral disorders, 19.4 percent of youth with autism spectrum disorders, 24.1 percent of youth with intellectual disabilities, 16.9 percent of youth with other health impairment, and 14.4 percent of youth with specific learning disabilities perpetrated bullying behavior. These estimates are in contrast to 14.5 percent of youth without disabilities who experienced high rates of being bullied and 13.5 percent who engaged in high rates of perpetration. The authors of this study acknowledge that the study has a number of limitations—mainly self-report, cross-sectional data, and data that were examined at the group level.
This literature on bullying and disabilities has several inconsistencies, which stem from differences in three basic factors: (1) measurement and definition, (2) disability identification, and (3) comparative groups. For instance, separating subclasses of youth with specific typographies of learning disabilities proves difficult, resulting in the general assessment of a combined class of specific learning disabilities (Rose, 2015). This confounding factor leads to conflicting measures of bullying involvement, with some studies suggesting that rates of bullying perpetration are relatively comparable among youth with and without disabilities (Rose et al., 2015), while others found that students with specific learning disabilities were almost six
___________________
20 This section is adapted from a study (Rose, 2015) commissioned by the committee for this report.
times more likely to engage in bully perpetration than their peers without disabilities (Twyman et al., 2010). These conflicting results suggest further assessment or disaggregation of subgroups of youth with specific learning disabilities may be necessary to better understand bullying involvement among this subpopulation of youth.
Differences in Bullying by Weight Status
Weight status, specifically being overweight or obese, can be a factor in bullying among children and youth (Puhl and Latner, 2007). The CDC defines childhood overweight as a body mass index (BMI) at or above the 85th percentile and below the 95th percentile of a CDC-defined reference population of the same age and sex. It defines childhood obesity as a BMI at or above the 95th percentile of this reference population for the same age and sex (Centers for Disease Control and Prevention, 2015b).
In 2012, 31.8 percent of U.S. children and youth 6 to 19 years of age were overweight or obese, using the CDC weight status categories. Eighteen percent of children 6 to 11 and 21 percent of youth 12 to 19 years of age were obese (Centers for Disease Control and Prevention, 2015a). Although the 2012 National Health and Nutrition Examination Survey (NHANES) data showed a decrease in obesity rates for children 2 to 5 years of age, the obesity rates for 2-19-year olds between 2003-2004 and 2011-2012 remained unchanged at 31.8 percent (Ogden et al., 2014). Thus, weight-based bullying can affect a substantial number of youth.
In 2007, Puhl and Latner reviewed the growing literature on social marginalization and stigmatization of obesity in children and adolescents, paying attention to the nature and extent of weight bias toward overweight youth and the primary sources of stigma in their lives, including peers.21 The researchers found that existing studies on weight stigma suggest that experiences with various forms of bullying is a common experience for overweight and obese youth; however, determining specific prevalence rates of bias is difficult because various assessment methods are used across the literature (Puhl and Latner, 2007). For example, Neumark-Sztainer and colleagues (2002) examined the prevalence of weight-based teasing among middle and high school students (n = 4,746) and found that 63 percent of girls at or above the 95th percentile for BMI and 58 percent of boys at or above the 95th percentile for BMI experienced “weight-based teasing.” However, in a recent longitudinal study of weight-based teasing (n = 8,210),
___________________
21 In this review, weight stigma included “verbal teasing (e.g., name calling, derogatory remarks, being made fun of), physical bullying (e.g., hitting, kicking, pushing, shoving), and relational victimization (e.g., social exclusion, being ignored or avoided, the target of rumors”) (Puhl and Latner, 2007, p. 558).
Griffiths and colleagues (2006) found that 34 percent of girls at or above the 95th percentile for BMI and 36 percent of boys at or above the 95th percentile for BMI reported being victims of “weight-based teasing and various forms of bullying” (Griffiths et al., 2006). Griffiths and colleagues (2006) found that obese boys and girls were more likely to be victims of overt bullying one year later.
Janssen and colleagues (2004) found that among 5,749 children, ages 11-16, girls with a higher BMI were more likely to be targets of bullying behavior than their average-weight peers. They found that the likelihood of these girls being targeted in verbal, physical, and relational bullying incidents only increased as BMI rose. Among boys, however, the researchers found no significant associations between BMI and physical victimization. When they looked at the older portion of the sample, they found that among 15-16-year-old boys and girls, BMI was positively associated with being the perpetrator of bullying behavior compared with BMI among average-weight children (Puhl and Latner, 2007). In this sample of 15 and 16 year olds, girls still faced an increased likelihood of both being bullied and being a perpetrator of bullying (Puhl and Latner, 2007).
In their review of the literature on peer victimization and pediatric obesity, Gray and colleagues (2009) summarized evidence since 1960 on stigmatization, marginalization, and peer victimization of obese children. They concluded that obesity in children and youth places them at risk for harmful physical, emotional, and psychosocial effects of bullying and similar types of peer mistreatment. They also noted that “over time, a cyclical relationship may emerge between obese individuals and victimization such that children who are victimized are less likely to be active, which in turn leads to increased weight gain and a greater likelihood of experiencing weight-based victimization” (Gray et al., 2009, p. 722).
In summary, although numerous studies indicate that overweight and obese youth are at increased risk of being bullied, it can be difficult to attribute weight-based bullying to a single physical attribute, given that being overweight or obese often co-exists with other factors (see also the subsection below on “Youth with Intersectional Identities”). Additional research is needed to identify the relative importance of weight as a reason for being bullied or being a perpetrator of bullying among children and youth.
Other Disparity Groups Requiring More Research
Although most research on groups that are at disproportionate risk for bullying has focused on LGBT youth, overweight/obese youth, or youth with disabilities, some recent research has begun to identify other groups
that may be at heightened risk.22 Because this research is in its early stages, the evidence is not yet compelling on whether these groups do experience disparities in perpetrating or being targeted by bullying behavior. Consequently, the committee highlights the following groups as warranting further study to establish their risk status.
Socioeconomic Status
The literature on socioeconomic status and bullying contains conflicting results. Higher socioeconomic status has been associated with higher levels of perpetration (Barboza et al., 2009; Shetgiri et al., 2012) but so has lower socioeconomic status (Christie-Mizell et al., 2011; Garner and Hinton, 2010; Glew et al., 2005; Jansen et al., 2011, 2012; Nordhagen et al., 2005; Pereira et al., 2004; Schwartz et al., 1997). Other studies found that socioeconomic status was not associated with perpetration (Flouri and Buchanan, 2003; Zimmerman et al., 2005).
The evidence for an association between socioeconomic status and being bullied is similarly inconsistent. Specifically, some studies found that neither economic deprivation (Wilson et al., 2012), family income (Garner and Hinton, 2010), nor general socioeconomic status (Magklara et al., 2012) predicted greater risk of being targeted by bullying behavior. Other studies found that insufficient parental income (Lemstra et al., 2012) and low social class (Pereira et al., 2004) predicted increased rates of being the target in bullying incidents. These conflicting results may be due in part to different measures and conceptualizations of socioeconomic status. In addition, other environmental or social–ecological factors that are often not included in evaluative models may account for the differences in these findings. For example, Barboza and colleagues (2009) argued that perpetration emerges as a function of social climate deficits, where social supports may mediate perpetration regardless of demographic characteristics, including socioeconomic status. Thus, further research is warranted on the mediating and moderating variables in the association between socioeconomic status and either bullying perpetration or being targeted for bullying. (See Chapter 3 for a more detailed discussion of moderation.)
Immigration Status
The results to date from research on the association between immigration status and bullying involvement are inconsistent. For example, Lim and Hoot (2015) investigated the bullying involvement of third and sixth
___________________
22 This section is adapted from a study (Rose, 2015) commissioned by the committee for this report.
grade students who were immigrants, refugees, or native born. The majority of these students who were refugees or immigrants came from Burma, Burundi, Iraq, Somalia, Thailand, and Yemen. The refugees and immigrants did not report higher levels of being bullied than the native-born American students. However, qualitative data suggested that youth with refugee status responded as “nonpassive victims,” meaning they would try to defend themselves when physically attacked, whereas immigrants and native-born youth who were bullied responded to bullying more passively. The inconsistencies in the results may be associated with age of the respondents, total sample size, nationality of the immigrants/refugees, or other environmental or social–ecological factors (Hong et al., 2014), all of which require greater attention in future studies.
Minority Religious Affiliations
Few studies have specifically investigated the bullying involvement of youth from minority religious groups. However, evidence from other areas of violence suggests that youth from religious minorities may experience higher rates of being bullied than those who identify as Christians. For instance, the percentage of hate crimes in the United States that are grounded in religious affiliation has increased from 10 percent in 2004 to 28 percent in 2012 (Wilson, 2014). Since schools are reflective of society as a whole, and bullying involvement is grounded in a social–ecological context that includes community and societal factors (Hong and Espelage, 2012), this targeting of religious minorities may carry over into the school environment. However, this hypothesis requires empirical documentation.
Youth with Intersectional Identities
As noted in the earlier discussion of weight status as a factor in bullying, “intersectionality” refers to individuals with multiple stigmatized statuses (e.g., black lesbian youth). The majority of studies on bullying perpetration and targeting have examined identity groups in isolation, but there is increasing acknowledgement that multiple intersecting identities can exacerbate or attenuate health outcomes (e.g., Bowleg, 2008; McCall, 2005). An exception is the study by Garnett and colleagues (2014), which analyzed the intersectionality of weight-related bullying with bullying for other reasons. Among 965 Boston youth sampled in the 2006 Boston Youth Survey, participants had been discriminated against or bullied (or assaulted) for any of four attributes (race or ethnicity, immigration status, perceived sexual orientation, and weight). Participants who were bullied for their race and weight had higher rates of being targeted for bullying behavior, compared with students who had two or more of the other characteristics
(Garnett et al., 2014). As discussed earlier, the extent to which intersecting identities affect the prevalence of bullying perpetration and targeting remains largely unknown and therefore represents an important area for future study.
Children and adolescents have mostly stated that the differences in their physical appearance contribute to the possibility of their being bullied (Lunde et al., 2007). There is concern that students with characteristics, such as obesity, disabilities, food allergies, and gender issues could put them directly in the path of being more likely to be bullied (Schuster and Bogart, 2013). These categories may intersect at the micro level of individual experience to reflect multiple interlocking systems of privilege and oppression at the macro, social-structural level (Bowleg, 2012).
Urbanicity
Is bullying more prevalent in urban schools than in suburban or rural schools? Because large-city urban schools are often located in inner-city areas of concentrated poverty and exposure to violence, theories of social disorganization suggest that bullying might be more common in such contexts (Bradshaw et al., 2009). However, there is not much research in support of this hypothesis. Rural students have self-reported at least as much bullying in their schools as did urban youth (Dulmus et al., 2004; Stockdale et al., 2002). Moreover, data from large national studies in the United States indicate that students in rural schools report somewhat more bullying than those in urban and suburban schools (Nansel et al., 2001; Robers et al., 2013). In particular Robers and colleagues (2013) found, using 2011 National Center for Education Statistics data, that 25 percent of students in urban schools reported some bullying, compared with 29 percent in suburban schools and 30 percent in rural schools. One reason that has been suggested for this difference is that smaller rural schools, some of which have fewer school transitions (e.g., lacking a separate middle school between elementary and high school grades), may typically consolidate social reputations and provide fewer opportunities for targeted youth to redefine how they are perceived by peers (Farmer et al., 2011).
What may differ by urbanicity of schools are the reasons for targeting certain individuals in a pattern of bullying behavior. For example, Goldweber and colleagues (2013) documented that urban African American youth were more likely to report race-based bullying by peers than were rural or suburban youth. As noted above in the section on “Prevalence of Bullying by Race and Ethnicity,” the connection between experiences of peer bullying and racial discrimination merits further study.
ISSUES IN DEVELOPING ESTIMATES OF BULLYING IN THE UNITED STATES
Current efforts to estimate prevalence of bullying and cyberbullying behavior are characterized by disagreement and confusion. This chapter has pointed out the major challenges associated with generating accurate and reliable estimates of bullying and cyberbullying rates in the United States. The issues to be addressed are summarized here in terms of definitional issues and issues of measurement and sampling.
Definitional Issues
As attention to bullying behavior has grown in recent years, concerns have been raised that efforts to characterize bullying vary considerably and that a lack of a consistent definition “hinders our ability to understand the true magnitude, scope, and impact of bullying and track trends over time” (Gladden et al., 2014, p. 1). One such approach to measuring bullying includes providing an explicit definition or explanation of what is meant by bullying to study participants. In contrast, some approaches simply use the word “bullying” but do not define it, whereas others list specific behaviors that constitute bullying without using the term “bullying” (Gladden et al., 2014; Sawyer et al., 2008). Even if the definition is provided, researchers must assume that respondents (who are often children) fully understand the broad and difficult concept of bullying—including its elements of hostile intent, repetition, and power imbalance and its various forms—when answering. However, research has shown that this level of comprehension might not be uniformly present for children of all age groups and cultures (Monks and Smith, 2006; Smith et al., 2002; Strohmeier and Toda, 2008; Vaillancourt et al., 2008). For instance, 8-year-old children consider fewer negative behavior options to be bullying than do 14-year-old adolescents (Smith et al., 2002). Furthermore, children hold very different definitions of bullying from those held by researchers. Bullying may also be understood and defined differently in different languages and cultures (Arora, 1996). Smith and colleagues (2002) showed that terms used in different cultures differed remarkably in their meanings. For example, some terms captured verbal aggression, while others were connected instead with physically aggressive acts or with social exclusion. These definitional issues are also relevant to cyberbullying, as there is no uniform definition used across studies.
Measurement and Sampling Issues
Measuring bullying and cyberbullying is very difficult. The variability in prevalence rates reflects a number of measurement and sampling issues. First, studies reporting prevalence rates of bullying problems may rely on different data sources, such as peer versus teacher nominations or ratings, observations by researchers, or self-report questionnaires. Particularly with children, the self-report strategy poses a unique problem in regard to possible underreporting or overreporting (Solberg, 2003). Some children who bully other students will choose not to respond honestly on the relevant questionnaire items for fear of retribution from adults. To date, a majority of information is gathered via self-reports, which have limitations; however, the committee does not believe that official reports are necessarily a better or more reliable source of information. The committee also acknowledges that for studies examining the prevalence of bullying by a certain demographic category, such as obesity or sexual orientation, it is not possible to say who is the “most bullied” by comparing students with one set of demographic characteristics with other students with different demographic characteristics.
Second, research suggests that the approach to measuring bullying does affect the pattern of responses and in turn may influence the prevalence rates. For example, a study of over 24,000 elementary, middle, and high school age youth found significantly higher prevalence rates for bullying when it was assessed using a behavior-based approach (i.e., asking about the experience of specific forms and acts of bullying) than when it was measured using a definition-based approach (Sawyer et al., 2008). A
similar pattern occurs for cyberbullying, For example, one study used a definition that read “repeatedly [trying] to hurt you or make you feel bad by e-mailing/e-messaging you or posting a blog about you on the Internet (MySpace).” This study found the prevalence of cybervictimization to be 9 percent (Selkie et al., 2015). Another study asked about “the use of the Internet, cell phones and other technologies to bully, harass, threaten or embarrass someone” and found cybervictimization prevalence to be 31 percent (Pergolizzi et al., 2011).
Third, studies may differ with regard to the reference period used in measuring bullying. For example, a question may refer to a whole school year or one school term, the past couple of months, or over a lifetime. Response and rating categories may vary in both number and specificity as well. Such categories may consist of a simple yes or no dichotomy; of various applicability categories such as “does not apply at all” and “applies perfectly”; or of relatively vague frequency alternatives ranging from “seldom” to “very often” or from “not at all in the past couple of months” to “several times a week.”
Fourth, some studies use different criteria for differentiating students who have been bullied and students who have not, as well as students who have and have not bullied others. This variation in identification makes prevalence rates difficult to compare (Solberg, 2003). A majority of studies do not ask questions about children who have bullied or children who have been bystanders, instead focusing on children who have been bullied. Taken together, these findings suggest that researchers need to be cautious about interpreting their findings in light of their measurement approach.
SUMMARY
Estimates of bullying inform an evidence-based understanding about the extent of the problem and bring attention to the need to address the problem and allocate the funding to do so. Prevalence estimates provide information for policy makers, identify where education is needed, identify vulnerable populations, and help direct assistance and resources. As this chapter has explained, generating reliable estimates for the number of children who have bullied and the number who have been bullied is not an easy task. In some cases, the task is extraordinarily difficult. For example, existing research suggests disparities in rates of bullying by a variety of characteristics, including sexual orientation, disability, and obesity, mostly due to the lack of nationally representative data on these and other vulnerable groups. Bullying must be understood as a social problem characterized by numerous challenges to estimating its prevalence and the conditions associated with it. In summary, based on its review of the available evidence, the committee maintains that, despite the current imperfect estimates, bully-
ing and cyberbullying in the United States is clearly prevalent and therefore worthy of attention.
FINDINGS AND CONCLUSIONS
Findings
Finding 2.1: Estimates of bullying and cyberbullying prevalence reported by national surveys vary greatly, ranging from 17.9 percent to 30.9 percent of school-age children for the prevalence of bullying behavior at school and from 6.9 percent to 14.8 percent for the prevalence of cyberbullying. The prevalence of bullying among some groups of youth is even higher. For instance, the prevalence of bullying of lesbian, gay, bisexual, and transgender youth is approximately double that of heterosexual and cisgender youth.
Finding 2.2: The extent to which rates of bullying and cyberbullying have changed in recent years is unclear.
Finding 2.3: The four major national surveys that include bullying do not uniformly address all age groups and school levels.
Finding 2.4: A majority of prevalence data collection is done through self-reports or observation.
Finding 2.5: A majority of national studies do not ask questions about children who have bullied or children who have been bystanders.
Finding 2.6: Many studies differ with regard to the reference period used in measuring bullying behavior (e.g., last month versus last 12 months).
Finding 2.7: Studies use different definitional criteria for differentiating students who have been bullied and cyberbullied and students who have not, as well as students who bully and cyberbully and students who do not.
Finding 2.8: Existing research suggests that there are disparities in rates of bullying by a variety of characteristics, including sexual orientation, disability, and obesity. However, there is a lack of nationally representative data on these and other vulnerable groups. Future research is therefore needed to generate representative estimates of bullying,
including bias-based and discriminatory bullying, to accurately identify disparity groups.
Conclusions
Conclusion 2.1: Definitional and measurement inconsistencies lead to a variation in estimates of bullying prevalence, especially across disparate samples of youth. Although there is a variation in numbers, the national surveys show bullying behavior is a real problem that affects a large number of youth.
Conclusion 2.2: The national datasets on the prevalence of bullying focus predominantly on the children who are bullied. Considerably less is known about perpetrators, and nothing is known about bystanders in that national data.
Conclusion 2.3: Cyberbullying should be considered within the context of bullying rather than as a separate entity. The Centers for Disease Control and Prevention definition should be evaluated for its application to cyberbullying. Although cyberbullying may already be included, it is not perceived that way by the public or by the youth population.
Conclusion 2.4: Different types of bullying behaviors—physical, relational, cyber—may emerge or be more salient at different stages of the developmental life course.
Conclusion 2.5: The online context where cyberbullying takes place is nearly universally accessed by adolescents. Social media sites are used by the majority of teens and are an influential and immersive medium in which cyberbullying occurs.
REFERENCES
Arora, C.M. (1996). Defining bullying towards a clearer general understanding and more effective intervention strategies. School Psychology International, 17(4), 317-329.
Barboza, G.E., Schiamberg, L.B., Oehmke, J., Korzeniewski, S.J., Post, L.A., and Heraux, C.G. (2009). Individual characteristics and the multiple contexts of adolescent bullying: An ecological perspective. Journal of Youth and Adolescence, 38(1), 101-121.
Berlan, E.D., Corliss, H.L., Field, A.E., Goodman, E., and Austin, S.B. (2010). Sexual orientation and bullying among adolescents in the Growing Up Today study. Journal of Adolescent Health, 46(4), 366-371.
Blake, J.J., Lund, E.M., Zhou, Q., Kwok, O.-m., and Benz, M.R. (2012). National prevalence rates of bully victimization among students with disabilities in the United States. School Psychology Quarterly, 27(4), 210.
Bowleg, L. (2008). When black + lesbian + woman ≠ black lesbian woman: The methodological challenges of qualitative and quantitative intersectionality research. Sex Roles, 59(5-6), 312-325.
Bowleg, L. (2012). The problem with the phrase women and minorities: Intersectionality—an important theoretical framework for public health. American Journal of Public Health, 102(7), 1267-1273.
Bradshaw, C.P., Sawyer, A.L., and O’Brennan, L.M. (2009). A social disorganization perspective on bullying-related attitudes and behaviors: The influence of school context. American Journal of Community Psychology, 43(3-4), 204-220.
Card, N.A., Stucky, B.D., Sawalani, G.M., and Little, T.D. (2008). Direct and indirect aggression during childhood and adolescence: A meta-analytic review of gender differences, intercorrelations, and relations to maladjustment. Child Development, 79(5), 1185-1229.
Centers for Disease Control and Prevention. (2010). Youth Risk Behavior Surveillance—United States, 2009. Morbidity and Mortality Weekly Report, 59(SS-5), 1-142.
Centers for Disease Control and Prevention. (2012). Youth Risk Behavior Surveillance—United States, 2009. Morbidity and Mortality Weekly Report, 61(4), 1-162.
Centers for Disease Control and Prevention. (2014a). LGBTQ Youth Programs at a Glance. Available: http://www.cdc.gov/lgbthealth/youth-programs.htm [December 2015].
Centers for Disease Control and Prevention. (2014b). Youth Risk Behavior Surveillance—United States Morbidity and Mortality Weekly Report, 63(4), 1-169.
Centers for Disease Control and Prevention. (2015a). Childhood Obesity Facts. Available: http://www.cdc.gov/healthyschools/obesity/facts.htm [November 2015].
Centers for Disease Control and Prevention. (2015b). Defining Childhood Obesity. Available: http://www.cdc.gov/obesity/childhood/defining.html [November 2015].
Christie-Mizell, C.A., Keil, J.M., Laske, M.T., and Stewart, J. (2011). Bullying behavior, parents’ work hours, and early adolescents’ perceptions of time spent with parents. Youth & Society, 43(4), 1570-1595.
Conron, K.J., Scout, N., and Austin, S.B. (2008). “Everyone has a right to, like, check their box”: Findings on a measure of gender identity from a cognitive testing study with adolescents. Journal of LGBT Health Research, 4(1), 1-9. doi: 10.1080/15574090802412572.
Cook, C.R., Williams, K.R., Guerra, N.G., and Kim, T. (2010). Variability in the prevalence of bullying and victimization. In S.R. Jimerson, S.M. Swearer, and D.L. Espelage (Eds.), Handbook of Bullying in Schools: An International Perspective (pp. 347-362). New York: Routledge.
Cowie, H., Bauman, S., Coyne, I., Myers, C., Pörhölä, M., and Almeida, A. (2013). Cyberbullying amongst university students. In P.K. Smither and G. Steffgen (Eds.), Cyberbullying Through the New Media: Findings from an International Network (pp. 165-177). London, UK: Psychology Press.
DeVoe, J.F., and Bauer, L. (2010). Student Victimization in U.S. Schools: Results from the 2007 School Crime Supplement to the National Crime Victimization Survey (NCES 2010-319). Washington, DC: U.S. Government Printing Office.
DeVoe, J.F., and Bauer, L. (2011). Student Victimization in U.S. Schools: Results from the 2009 School Crime Supplement to the National Crime Victimization Survey. Washington, DC: U.S. Government Printing Office.
Dulmus, C.N., Theriot, M.T., Sowers, K.M., and Blackburn, J.A. (2004). Student reports of peer bullying victimization in a rural school. Stress, Trauma, and Crisis, 7(1), 1-16.
Eisenberg, M.E., and Aalsma, M.C. (2005). Bullying and peer victimization: Position paper of the Society for Adolescent Medicine. Journal of Adolescent Health, 36(1), 88-91.
Espelage, D.L., Aragon, S.R., Birkett, M., and Koenig, B.W. (2008). Homophobic teasing, psychological outcomes, and sexual orientation among high school students: What influence do parents and schools have? School Psychology Review 37(2), 202-216.
Farmer, T.W., Hamm, J.V., Leung, M.-C., Lambert, K., and Gravelle, M. (2011). Early adolescent peer ecologies in rural communities: Bullying in schools that do and do not have a transition during the middle grades. Journal of Youth and Adolescence, 40(9), 1106-1117.
Farmer, T.W., Petrin, R., Brooks, D.S., Hamm, J.V., Lambert, K., and Gravelle, M. (2012). Bullying involvement and the school adjustment of rural students with and without disabilities. Journal of Emotional and Behavioral Disorders, 20(1), 19-37.
Felix, E.D., and Green, J.G. (2010). Popular girls and brawny boys. In S.R. Jimerson, S.M. Swearer, and D.L. Espelage (Eds.), Handbook of Bullying in Schools. An International Perspective (pp. 173-185). New York: Routledge.
Finkelhor, D., Turner, H., Ormrod, R., Hamby, S., and Kracke, K. (2012). Children’s Exposure to Violence: A Comprehensive Survey. U.S. Department of Justice, Office of Justice Programs, Office of Juvenile Justice and Delinquency Prevention. Available: https://www.ncjrs.gov/pdffiles1/ojjdp/grants/248444.pdf [June 2016].
Finkelhor, D., Turner, H.A., Shattuck, A., and Hamby, S.L. (2015). Violence, Crime, and Abuse Exposure in a National Sample of Children and Youth: An Update. U.S. Department of Justice, Office of Justice Programs, Office of Juvenile Justice and Delinquency Prevention. Available: http://www.ojjdp.gov/pubs/248547.pdf [June 2016].
Flouri, E., and Buchanan, A. (2003). The role of mother involvement and father involvement in adolescent bullying behavior. Journal of Interpersonal Violence, 18(6), 634-644.
Garner, P.W., and Hinton, T.S. (2010). Emotional display rules and emotion self-regulation: Associations with bullying and victimization in community-based after school programs. Journal of Community & Applied Social Psychology, 20(6), 480-496.
Garnett, B.R., Masyn, K.E., Austin, S.B., Miller, M., Williams, D.R., and Viswanath, K. (2014). The intersectionality of discrimination attributes and bullying among youth: An applied latent class analysis. Journal of Youth and Adolescence, 43(8), 1225-1239.
Garofalo, R., Wolf, R.C., Kessel, S., Palfrey, J., and DuRant, R.H. (1998). The association between health risk behaviors and sexual orientation among a school-based sample of adolescents. Pediatrics, 101(5), 895-902.
GenIUSS Group. (2013). Gender-Related Measures Overview. The Williams Institute. Available: http://williamsinstitute.law.ucla.edu/wp-content/uploads/GenIUSS-Gender-relatedQuestion-Overview.pdf [April 2016].
Gladden, R.M., Vivolo-Kantor, A.M., Hamburger, M.E., and Lumpkin, C.D. (2014). Bullying Surveillance among Youths: Uniform Definitions for Public Health and Recommended Data Elements, Version 1.0. Atlanta, GA: Centers for Disease Control and Prevention and U.S. Department of Education.
Glew, G.M., Fan, M.-Y., Katon, W., Rivara, F.P., and Kernic, M.A. (2005). Bullying, psychosocial adjustment, and academic performance in elementary school. Archives of Pediatrics & Adolescent Medicine, 159(11), 1026-1031.
Goldweber, A., Waasdorp, T.E., and Bradshaw, C.P. (2013). Examining associations between race, urbanicity, and patterns of bullying involvement. Journal of Youth and Adolescence, 42(2), 206-219.
Grant, J.M., Mottet, L., Tanis, J.E., Harrison, J., Herman, J., and Keisling, M. (2011). Injustice at Every Turn: A Report of the National Transgender Discrimination Survey. National Center for Transgender Equality. Available: http://www.thetaskforce.org/static_html/downloads/reports/reports/ntds_full.pdf [October 2015].
Gray, W.N., Kahhan, N.A., and Janicke, D.M. (2009). Peer victimization and pediatric obesity: A review of the literature. Psychology in the Schools, 46(8), 720-727.
Griffiths, L.J., Wolke, D., Page, A.S., and Horwood, J. (2006). Obesity and bullying: Different effects for boys and girls. Archives of Disease in Childhood, 91(2), 121-125.
Hanlon, B.M. (2004). 2003 Massachusetts Youth Risk Behavior Survey Results. Malden: Massachusetts Department of Education.
Hong, J.S., and Espelage, D.L. (2012). A review of research on bullying and peer victimization in school: An ecological system analysis. Aggression and Violent Behavior, 17(4), 311-322.
Hong, J.S., Peguero, A.A., Choi, S., Lanesskog, D., Espelage, D.L., and Lee, N.Y. (2014). Social ecology of bullying and peer victimization of Latino and Asian youth in the United States: A review of the literature. Journal of School Violence, 13(3), 315-338.
Iannotti, R.J. (2012). Health Behavior in School-Aged Children (HBSC), 2005-2006. Ann Arbor, MI: Inter-university Consortium for Political and Social Research.
Iannotti, R.J. (2013). Health Behavior in School-Aged Children (HBSC), 2009-2010. Ann Arbor, MI: Inter-university Consortium for Political and Social Research.
Jansen, D.E., Veenstra, R., Ormel, J., Verhulst, F.C., and Reijneveld, S.A. (2011). Early risk factors for being a bully, victim, or bully/victim in late elementary and early secondary education. The Longitudinal Trails Study. BMC Public Health, 11(1), 1-7.
Jansen, P.W., Verlinden, M., Dommisse-van Berkel, A., Mieloo, C., van der Ende, J., Veenstra, R., Verhulst, F.C., Jansen, W., and Tiemeier, H. (2012). Prevalence of bullying and victimization among children in early elementary school: Do family and school neighbourhood socioeconomic status matter? BMC Public Health, 12(1), 1-10.
Janssen, I., Craig, W.M., Boyce, W.F., and Pickett, W. (2004). Associations between overweight and obesity with bullying behaviors in school-aged children. Pediatrics, 113(5), 1187-1194.
Juvonen, J., and Gross, E.F. (2008). Extending the school grounds?—Bullying experiences in cyberspace. Journal of School Health, 78(9), 496-505.
Kosciw, J.G., Greytak, E.A., Bartkiewicz, M.J., Boesen, M.J., and Palmer, N.A. (2012). The 2011 National School Climate Survey: The Experiences of Lesbian, Gay, Bisexual, and Transgender Youth in Our Nation’s School. Washington, DC: Education Resources Information Center, Institute of Education Sciences, U.S. Department of Education.
Kowalski, R.M., Limber, S.P., and Agatston, P.W. (2012). Cyberbullying: Bullying in the Digital Age. West Sussex, UK: Wiley-Blackwell.
Kraft, E., and Wang, J. (2010). An exploratory study of the cyberbullying and cyberstalking experiences and factors related to victimization of students at a public liberal arts college. International Journal of Technoethics, 1(4), 74-91.
Larochette, A.-C., Murphy, A.N., and Craig, W.M. (2010). Racial bullying and victimization in Canadian school-age children: Individual and school level effects. School Psychology International, 31(4), 389-408.
Lemstra, M.E., Nielsen, G., Rogers, M.R., Thompson, A.T., and Moraros, J.S. (2012). Risk indicators and outcomes associated with bullying in youth aged 9-15 years. Canadian Journal of Public Health/Revue Canadienne de Santé Publique, 103(1), 9-13.
Lenhart, A., Duggan, M., Perrin, A., Stepler, R., Rainie, H., and Parker, K. (2015). Teens, Social Media & Technology Overview 2015. Available: http://www.pewinternet.org/files/2015/04/PI_TeensandTech_Update2015_0409151.pdf [September 2015].
Lim, S.J.J., and Hoot, J.L. (2015). Bullying in an increasingly diverse school population: A socioecological model analysis. School Psychology International. doi: 0143034315571158.
Limber, S.B. (2014). Bullying Among Children and Youth. Unpublished manuscript of a study commissioned by the Planning Committee on Increasing Capacity for Reducing Bullying and Its Impact on the Lifecourse of Youth Involved. Department of Psychology and Institute on Family and Neighborhood Life, Clemson University, SC.
Limber, S.B, Olweus, D., and Luxenberg, H. (2013). Bullying in U.S. Schools, 2012 Status Report. Center City, MN: Hazelden Foundation.
Lunde, C., Frisén, A., and Hwang, C.P. (2007). Ten-year-old girls’ and boys’ body composition and peer victimization experiences: Prospective associations with body satisfaction. Body Image, 4(1), 11-28.
Magklara, K., Skapinakis, P., Gkatsa, T., Bellos, S., Araya, R., Stylianidis, S., and Mavreas, V. (2012). Bullying behaviour in schools, socioeconomic position, and psychiatric morbidity: A cross-sectional study in late adolescents in Greece. Child and Adolescent Psychiatry and Mental Health, 6(8), 2-13.
McCall, L. (2005). The complexity of intersectionality. Signs: Journal of Women in Culture and Society. 30(3), 1771-1800.
McGuire, J.K., Anderson, C.R., Toomey, R.B., and Russell, S.T. (2010). School climate for transgender youth: A mixed-method investigation of student experiences and school responses. Journal of Youth and Adolescence, 39(10), 1175-1188.
McLaughlin, C., Byers, R., and Vaughn, R. (2010). Responding to Bullying among Children with Special Educational Needs and/or Disabilities. London, UK: Anti-Bullying Alliance.
Monks, C.P., and Smith, P.K. (2006). Definitions of bullying: Age differences in understanding of the term and the role of experience. British Journal of Developmental Psychology, 24(4), 801-821.
Moreno, M.A., Kota, R., Schoohs, S., and Whitehill, J.M. (2013). The Facebook influence model: A concept mapping approach. Cyberpsychology, Behavior, and Social Networking, 16(7), 504-511.
Nansel, T.R., Overpeck, M., Pilla, R.S., Ruan, W.J., Simons-Morton, B., and Scheidt, P. (2001). Bullying behaviors among U.S. youth: Prevalence and association with psychosocial adjustment. Journal of the American Medical Association, 285(16), 2094-2100.
Neumark-Sztainer, D., Falner, N., Story, M., Perry, C., Hannan, P.J., and Mulert, S. (2002). Weight-teasing among adolescents: Correlations with weight status and disordered eating behaviors. International Journal of Obesity and Related Metabolic Disorders. 26(1), 123-131.
Nordhagen, R., Nielsen, A., Stigum, H., and Köhler, L. (2005). Parental reported bullying among Nordic children: A population-based study. Child: Care, Health and Development, 31(6), 693-701.
Ogden, C.L., Carroll, M.D., Kit, B.K., and Flegal, K.M. (2014). Prevalence of childhood and adult obesity in the United States, 2011-2012. Journal of the American Medical Association, 311(8), 806-814.
Olsen, E.O.M., Kann, L., Vivolo-Kantor, A., Kinchen, S., and McManus, T. (2014). School violence and bullying among sexual minority high school students, 2009-2011. Journal of Adolescent Health, 55(3), 432-438.
Olweus, D. (2013). School bullying: Development and some important challenges. Annual Review of Clinical Psychology, 9, 751-780.
Oppliger, P.A. (2013). Bullies and Mean Girls in Popular Culture. Jefferson, NC: McFarland & Company.
Pereira, B., Mendonca, D., Neto, C., Valente, L., and Smith, P.K. (2004). Bullying in Portuguese schools. School Psychology International, 25(2), 241-254.
Pergolizzi, F., Pergolizzi, J., Gan, Z., Macario, S., Pergolizzi, J.V., Ewin, T., and Gan, T.J. (2011). Bullying in middle school: Results from a 2008 survey. International Journal of Adolescent Medicine and Health, 23(1), 11-18.
Peskin, M., Tortolero, S.R., and Markham, C.M. (2006). Bullying and victimization among black and Hispanic adolescents. Adolescence, 41, 467-484.
Puhl, R.M., and Latner, J.D. (2007). Stigma, obesity, and the health of the nation’s children. Psychological Bulletin, 133(4), 557.
Reisner, S.L., Greytak, E.A., Parsons, J.T., and Ybarra, M.L. (2015). Gender minority social stress in adolescence: Disparities in adolescent bullying and substance use by gender identity. Journal of Sex Research, 52(3), 243-256.
Rice, E., Petering, R., Rhoades, H., Winetrobe, H., Goldbach, J., Plant, A., Montoya, J., and Kordic, T. (2015). Cyberbullying perpetration and victimization among middle school students. American Journal of Public Health, 105(3), e66-e72.
Rivers, I. (2001). The bullying of sexual minorities at school: Its nature and long-term correlates. Educational and Child Psychology, 18(1), 32-46.
Robers, S., Kemp, J., and Truman, J. (2013). Indicators of School Crime and Safety: 2012. NCES 2013-036/NCJ 241446. Washington, DC: National Center for Education Statistics, U.S. Department of Education.
Rose, C.A. (2015). Bullying and Vulnerable Populations: Exploring Predictive and Protective Factors Associated with Disproportionate Representation. Unpublished manuscript of a study commissioned by the Committee on the Biological and Psychosocial Effects of Peer Victimization: Lessons for Bullying Prevention. Department of Special Education, University of Missouri, Columbia.
Rose, C.A., Espelage, D.L., and Monda-Amaya, L.E. (2009). Bullying and victimisation rates among students in general and special education: A comparative analysis. Educational Psychology, 29(7), 761-776.
Rose, C.A., Monda-Amaya, L.E., and Espelage, D.L. (2010). Bullying perpetration and victimization in special education: A review of the literature. Remedial and Special Education, 32, 114-130.
Rose, C.A., Simpson, C.G., and Moss, A. (2015). The bullying dynamic: Prevalence of involvement among a large-scale sample of middle and high school youth with and without disabilities. Psychology in the Schools, 52(5), 515-531.
Russell, S.T., Driscoll, A.K., and Truong, N. (2002). Adolescent same-sex romantic attractions and relationships: Implications for substance use and abuse. American Journal of Public Health, 92(2), 198-202.
Russell, S.T., Everett, B.G., Rosario, M., and Birkett, M. (2014). Indicators of victimization and sexual orientation among adolescents: Analyses from Youth Risk Behavior Surveys. American Journal of Public Health, 104(2), 255-261.
Sawyer, A.L., Bradshaw, C.P., and O’Brennan, L.M. (2008). Examining ethnic, gender, and developmental differences in the way children report being a victim of “bullying” on self-report measures. Journal of Adolescent Health, 43, 106-114. doi:10.1016/j. jadohealth.2007.12.011.
Schenk, A.M., and Fremouw, W.J. (2012). Prevalence, psychological impact, and coping of cyberbully victims among college students. Journal of School Violence, 11(1), 21-37.
Schuster, M.A., and Bogart, L.M. (2013). Did the ugly duckling have PTSD? Bullying, its effects, and the role of pediatricians. Pediatrics, 131(1), e288-e291.
Schwartz, D., Dodge, K.A., Pettit, G.S., and Bates, J.E. (1997). The early socialization of aggressive victims of bullying. Child Development, 68(4), 665-675.
Selkie, E.M., Fales, J.L., and Moreno, M.A. (2015). Cyberbullying prevalence among U.S. middle and high school age adolescents: A systematic review and quality assessment. Journal of Adolescent Health, 58(2), 125-133.
Shetgiri, R., Lin, H., and Flores, G. (2012). Identifying children at risk for being bullies in the United States. Academic Pediatrics, 12(6), 509-522.
Smith, P.K., Cowie, H., Olafsson, R.F., Liefooghe, A.P., Almeida, A., Araki, H., del Barrio, C., Costabile, A., Dekleva, B., and Houndoumadi, A. (2002). Definitions of bullying: A comparison of terms used, and age and gender differences, in a fourteen-country international comparison. Child Development, 73(4), 1119-1133.
Smith, P.K., Mahdavi, J., Carvalho, M., Fisher, S., Russell, S., and Tippett, N. (2008). Cyberbullying: Its nature and impact in secondary school pupils. Journal of Child Psychology and Psychiatry, 49(4), 376-385.
Solberg, M.E. (2003). Prevalence estimation of school bullying with the Olweus bully/victim questionnaire. Aggressive Behavior, 29(3), 239-268.
Son, E., Parish, S.L., and Peterson, N.A. (2012). National prevalence of peer victimization among young children with disabilities in the United States. Children and Youth Services Review, 34(8), 1540-1545.
Spriggs, A.L., Iannotti, R.J., Nansel, T.R., and Haynie, D.L. (2007). Adolescent bullying involvement and perceived family, peer, and school relations: Commonalities and differences across race/ethnicity. Journal of Adolescent Health, 41(3), 283-293.
Stockdale, M.S., Hangaduambo, S., Duys, D., Larson, K., and Sarvela, P.D. (2002). Rural elementary students’, parents’, and teachers’ perceptions of bullying. American Journal of Health Behavior, 26(4), 266-277.
Strohmeier, D., and Toda, Y. (2008). Cross-National Similarities and Differences. The Extent to Which Bullying and Victimisation Are Similar, or Show Differences, Across Cultures, Especially Western and Eastern Cultures. Paper presented at the preconference “Victimisation in Children and Youth,” 20th Biennial Meeting of the International Society for the Study of Behavioural Development, July, Wurzburg, Germany.
Twyman, K.A., Saylor, C.F., Saia, D., Macias, M.M., Taylor, L.A., and Spratt, E. (2010). Bullying and ostracism experiences in children with special health care needs. Journal of Developmental & Behavioral Pediatrics, 31(1), 1-8.
U.S. Department of Education. (2013). Student Reports of Bullying and Cyber-Bullying: Results from the 2011 School Crime Supplement to the National Crime Victimization Survey. Washington DC: Author.
U.S. Department of Education. (2015). Student Reports of Bullying and Cyber-Bullying: Results from the 2013 School Crime Supplement to the National Crime Victimization Survey. Washington DC: Author. Available: http://nces.ed.gov/pubs2015/2015056.pdf [April 2015].
U.S. Department of Health and Human Services. (2008). Health Behavior in School-Aged Children (HBSC), 2001-2002. Health Resources and Services Administration. Maternal and Child Health Bureau. Ann Arbor, MI: Inter-university Consortium for Political and Social Research.
U.S. Government Accountability Office. (2012). School Bullying-Extent of Legal Protections for Vulnerable Groups Needs to Be More Fully Assessed. Washington, DC: Author.
Vaillancourt, T., McDougall, P., Hymel, S., Krygsman, A., Miller, J., Stiver, K., and Davis, C. (2008). Bullying: Are researchers and children/youth talking about the same thing? International Journal of Behavioral Development, 32(6), 486-495.
Wensley, K., and Campbell, M. (2012). Heterosexual and nonheterosexual young university students’ involvement in traditional and cyber forms of bullying. Cyberpsychology, Behavior, and Social Networking, 15(12), 649-654.
Wilson, M.L., Bovet, P., Viswanathan, B., and Suris, J.-C. (2012). Bullying among adolescents in a sub-Saharan middle-income setting. Journal of Adolescent Health, 51(1), 96-98.
Wilson, M.M. (2014). Hate Crime Victimization 2004-2012 Statistics. Washington, DC: U.S. Department of Justice. Available: http://www.bjs.gov/content/pub/pdf/hcv0412st.pdf [November 2015].
Wolak, J., Mitchell, K.J., and Finkelhor, D. (2007). Does online harassment constitute bullying? An exploration of online harassment by known peers and online-only contacts. Journal of Adolescent Health, 41(6), S51-S58.
World Health Organization. (2003). Health Behavior in School-Aged Children (HBSC), 1997-1998. Ann Arbor, MI: Inter-university Consortium for Political and Social Research.
Zimmerman, F.J., Glew, G.M., Christakis, D.A., and Katon, W. (2005). Early cognitive stimulation, emotional support, and television watching as predictors of subsequent bullying among grade-school children. Archives of Pediatrics & Adolescent Medicine, 159(4), 384-388.


