
2
Sources of Indoor Particulate Matter
In the workshop’s first session, three panelists described some of the major sources of indoor PM. Brent Stephens of the Illinois Institute of Technology discussed outdoor air and non-combustion appliances as important source of indoor PM, Lynn M. Hildemann of Stanford University reviewed the indoor sources of airborne allergens and smoke, and Brandon E. Boor of Purdue University discussed the importance of particle resuspension as a source of indoor airborne PM. An open discussion moderated by William Nazaroff followed the three presentations.
INDOOR EXPOSURES TO OUTDOOR PARTICULATE MATTER1
The documented adverse health effects of exposure to outdoor PM include stroke, heart disease, lung cancer, and chronic and acute respiratory diseases, including asthma, reduced lung function, and mortality (EPA, 2009), said Brent Stephens as an introduction to his presentation. These effects, he added, are associated in varying degrees with the three broad classes of PM that Nazaroff described in his introductory remarks to the workshop—PM10, PM2.5, and UFPs—as well as with various chemical components of PM.
A substantial body of evidence shows that exposure to PM2.5, both
___________________
1 This section is based on the presentation by Brent Stephens, assistant professor of civil, architectural, and environmental engineering at Illinois Institute of Technology, and the statements are not endorsed or verified by the National Academies of Sciences, Engineering, and Medicine.
short-term and long-term, is of particular concern with regard to adverse health effects (Shi et al., 2016). The strength of the underlying science varies, though: some of the links between PM and adverse health effects are well established, Stephens said, while suggestive evidence exists for others. A 2012 study by EPA researchers estimated that there were some 130,000 premature deaths per year of exposure that are attributable to elevated outdoor PM2.5 levels (Fann et al., 2012). Most Americans, however, spend nearly 90 percent of their time indoors and about 70 percent of their day at home (Klepeis et al., 2001), so indoor exposure to PM is likely to be an important contributor to the adverse health effects caused by PM exposure. Indeed, Stephens said, outdoor PM enters into buildings at varying efficiencies, becoming indoor PM. Several studies have documented the extent to which human exposure to outdoor PM occurs indoors, including at home (Kearney et al., 2011; MacNeill et al., 2012, 2014; Meng et al., 2004; Wallace and Ott, 2011). Outdoor PM enters buildings by infiltrating through cracks and gaps in the building envelope as well as via natural ventilation and mechanical ventilation (Chen and Zhao, 2011). Mechanical ventilation is likely to be a bigger source of outdoor PM in commercial buildings than in homes. Important indoor sources of PM include combustion, candles, and cooking (Isaxon et al., 2015).
A 2011 review of 77 studies covering more than 4,000 homes found that the average ratio of indoor PM to outdoor PM—where the indoor PM includes contributions from both indoor and outdoor sources—is approximately 1.0 for PM2.5 and approximately 0.8 for PM10 and UFPs (Chen and Zhao, 2011) (see Figure 2-1). “On average in most buildings, the indoor concentration of PM2.5 is roughly the same as outdoors, but there is significant variability,” Stephens said. This same review also looked at the infiltration factor (Finf)—the ratio of indoor to outdoor PM considering outdoor sources only—and found a mean value from about 1,000 homes in the United States and 150 homes in Europe of 0.55 for PM2.5 (see Figure 2-2). The mean infiltration factors for PM10 and UFPs were approximately 0.3, though again there was significant variability from home to home for all three classes of PM. In fact, studies of homes in Canada (Kearney et al., 2011, 2014) (see Figure 2-3) and the United States (Allen et al., 2012) (see Figure 2-4) have shown that the fraction of outdoor PM that infiltrates and persists as indoor PM can range from less than 10 percent to almost 100 percent, depending on the home, the season, and the location.
Several key factors drive this variability in infiltration factors (Allen et al., 2012; Chen et al., 2012; El Orch et al., 2014; MacNeill et al., 2012, 2014; Williams et al., 2003). Stephens mentioned that these include ventilation, either through infiltration, mechanical ventilation, or natural ventilation, and the magnitude of the air exchange rate (AER), which is driven in part by meteorological conditions. The airtightness and other characteristics of the
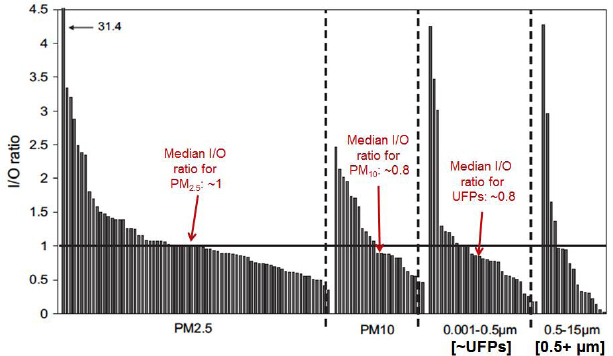
SOURCES: Stephens slide 7, adapted from Chen and Zhao (2011) Figure 2; reprinted with permission from Elsevier.
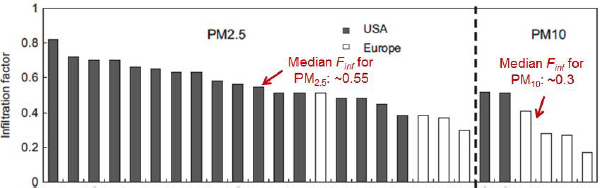
SOURCES: Stephens slide 8, adapted from Chen and Zhao (2011) Figures 3 and 4; reprinted with permission from Elsevier.
building, as well as the design and operation of the heating, ventilating, and air conditioning (HVAC) system, contribute to variability, too. Human behavior is an important contributor—some people open their windows more frequently than others, for example—and variability also depends on the sizes and even components of PM. Stephens said there is a need for more data to fully understand the relative importance of these drivers of infiltration factor variability.
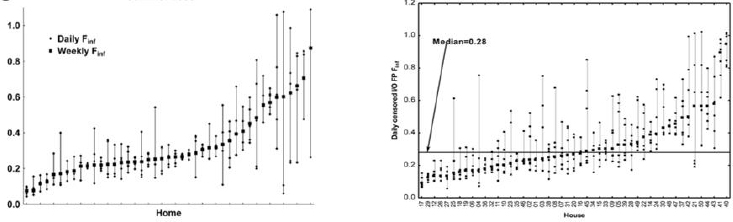
SOURCES: Stephens slide 9, from Kearney et al. (2011) Figure 6c (left) and Kearney et al. (2014) Figure 2 (right). Left figure reprinted with permission from Elsevier.
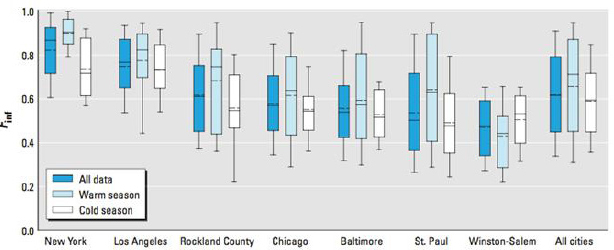
SOURCE: Stephens slide 9, from Allen et al. (2012) Figure 1; reprinted with permission from Environmental Health Perspectives.
Stephens then addressed areas in which less is known about indoor exposures to outdoor PM, starting with how infiltration factor variability contributes to health effect estimates from epidemiology studies. One modeling study (Chen et al., 2012) constructed a PM10 exposure coefficient that tried to account for the likely variations in AERs across different U.S. regions based on housing characteristics, climate conditions, seasons, window opening behaviors, and HVAC runtime. This coefficient—which represents the change in total PM10 exposure per unit change in outdoor PM10 exposure—correlated reasonably well with estimates of the increase
in short-term mortality associated with a given increase in the concentration of PM10 (PM10 mortality coefficients) derived from epidemiology studies, Stephens said. “If you try to account for the underlying indoor exposure to outdoor PM based on some key drivers of variability, you can explain many of the differences in mortality coefficients.”
A 2013 study by Hodas and colleagues took a similar approach in order to relate indoor levels of outdoor PM2.5 with acute myocardial infarction based on a ranking of AERs derived from housing characteristics. These investigators found a higher odds ratio in homes with higher AERs, which, Stephens said, would have higher indoor levels of outdoor PM (Hodas et al., 2013). Another study (Sarnat et al., 2013) that examined the relationship between AERs, exposure to PM2.5, and emergency department visits in Atlanta, Georgia, found that higher AERs were correlated to some extent with the relative risks of PM2.5 exposure and emergency department visits.
What Stephens called the elephant in the room is the impact on AERs of how often people open their windows. “You could not ask a simpler question, but we do not have much data on this,” he said. Some investigators have conducted pilot studies (El Orch et al., 2014; Johnson and Long, 2004; Price and Sherman, 2006) in which they asked people how often they opened their windows, but Stephens said these data are limited and somewhat suspect. Nevertheless, his group and others have tried to use these data to model what the distributions of window opening might be and to estimate how AERs vary with open windows (Chen et al., 2012; El Orch et al., 2014; Johnson and Long, 2004; Marr et al., 2012). The rule of thumb from these analyses is that AERs are approximately two to four times higher when windows are open, but Stephens said that these exchange rates will depend on how open a window is, the difference between the indoor and outdoor temperatures, and meteorological driving conditions such as wind speed and direction.
More data are also needed to better understand the underlying mechanisms governing infiltration factors for outdoor particles, Stephens said. There are other factors that affect infiltration, such as the penetration factor (P), which describes how effective the building envelope is at preventing particle infiltration. When windows and doors are closed, and absent mechanical ventilation, the penetration factor multiplied by the AER equals the rate at which outdoor PM is delivered indoors. Particles are removed from indoor air by a combination of air exchange and a variety of loss mechanisms which include deposition to surfaces, phase changes, and control by filters and air cleaners. For conditions in which air exchange only occurs through infiltration, the particle infiltration factor equals the product of the AER and the penetration factor divided by the sum of the AER plus and the other loss mechanisms:
![]()
Modeling work (Liu and Nazaroff, 2001) has defined some of the physical parameters, such as particle size, that influence the penetration factor. Subsequent studies have measured the relationship between particle size and penetration (Rim et al., 2010; Stephens and Siegel, 2012) and have shown that mid-size particles, around 0.3 microns in diameter, tend to penetrate more efficiently than larger and smaller particles. Stephens cautioned, though, that these data are highly variable and that they come from fewer than 50 homes. In the case of PM2.5, the penetration factor has been estimated in hundreds of homes but seldom, if ever, actually measured. He said that the technology for measuring particle penetration is challenging to use—one approach developed to measure UFP penetration, for example, takes 2 days to complete a measurement in an unoccupied house (Rim et al., 2010).
Other unknowns, Stephens said, include the associations between infiltration or penetration factors and building characteristics, though there are some data for the association between air conditioner usage, year of construction, and envelope tightness (Allen et al., 2012; MacNeill et al., 2012; Stephens and Siegel, 2012). His research group is currently trying to measure how the penetration factor changes after buildings undergo retrofitting. Little is known about how chemical transformations, such as evaporative losses, affect infiltration factors, and data are lacking concerning the spatial and temporal resolution of outdoor PM size distributions and outdoor size-resolved aerosol composition.
Summarizing research needs in the area of outdoor PM transport to indoors, Stephens said that there is a need for more integration between epidemiologists and exposure scientists, building scientists, and indoor air scientists. This would help address exposure misclassification and improve health effect estimates. He added that more data are needed on window opening frequencies and their impact on air exchange rates. And, more field measurements are needed for UFP and PM2.5 penetration factors and how they are associated with building design characteristics.
Turning briefly to the subject of indoor sources of PM, Stephens said that there are several non-combustion sources that emit mostly UFPs, including vacuum cleaner bags, steam irons, laser printers, and desktop 3D printers. Recently, researchers found that semivolatile organic compounds (SVOCs) can be deposited on cooking pans and other surfaces, which when heated will produce UFPs (Wallace et al., 2015). While it is good to know the sources of indoor PM, it is more important to know the rates at which these various sources emit PM, and a number of investigators (Afshari et
TABLE 2-1 Selected Indoor UFP Emission Rates for Combustion and Non-Combustion Sources in Homes
| UFP Emitting Device | Size Range (nm) | Emission Rate (#/min) | Reference |
|---|---|---|---|
| Flat iron with steam | 20-1,000 | 6.0×10⁹ | Afshari et al. (2005) |
| Electric frying pan | 10-400 | 1.1-2.7×10¹⁰ | Buonnano et al. (2009) |
| 3D printer w/PLA | 10-100 | ~2.0×10¹⁰ | Stephens et al. (2013) |
| Vacuum cleaner | 20-1,000 | 3.5×10¹⁰ | Afshari et al. (2005) |
| Scented candles | 20-1,000 | 8.8×10¹⁰ | Afshari et al. (2005) |
| Gas stove | 20-1,000 | 1.3×10¹¹ | Afshari et al. (2005) |
| 3D printer w/ABS | 10-100 | ~1.9×10¹¹ | Stephens et al. (2013) |
| Cigarette | 20-1,000 | 3.8×10¹¹ | Afshari et al. (2005) |
| Electric stove | 20-1,000 | 6.8×10¹¹ | Afshari et al. (2005) |
| Frying meat | 20-1,000 | 8.3×10¹¹ | Afshari et al. (2005) |
| Radiator | 20-1,000 | 8.9×10¹¹ | Afshari et al. (2005) |
| Desktop 3D printers | 10-100 | ~108 – ~1012 | Azimi et al. (2016) |
| Laser printers | 6-3,000 | 4.3×10⁹ – 3.3×10¹² | He et al. (2010) |
| Cooking on a gas stove | 10-400 | 1.1-3.4×10¹² | Buonnano et al. (2009) |
NOTES: Highlighted items are combustion-related; all other items are non-combustion sources. PLA and ABS are thermoplastics used as 3D printer feedstock.
SOURCE: Stephens slide 21.
al., 2005; Buonanno et al., 2009; He et al., 2010) have measured emission rates (see Table 2-1). For example, Stephens and his colleagues recently measured the rate of PM and volatile organic compound emissions from desktop 3D printers and found UFP emission rates of between 108 and 1012 particles per minute (Azimi et al., 2016).
In closing, Stephens said that researchers continue to find new sources of indoor PM and that it is essential to continue to gather emission rate data, including size-resolved emission rate data, for these and other sources. In the future, it will also be important for the field to continue to explore source control and strategies for mitigating exposure to indoor sources of PM.
INDOOR SOURCES OF AIRBORNE ALLERGENS AND SMOKE2
Combustion is a major source of indoor PM, Lynn Hildemann said, and the vast majority of combustion PM is submicron in size and includes a substantial number of UFPs. Combustion PM consists of a wide variety of organic compounds along with varying amounts of soot, depending on the combustion process and source. Hildemann noted that the physical and chemical characteristics of some sources of indoor PM—including cigarette smoke (Fernandez et al., 2015), incense burning (Wang et al., 2006), and wood combustion in stoves and fireplaces (Heringa et al., 2011)—have been well characterized.
The combustion and heating sources of indoor PM that need more study include cooking, natural gas stoves and ovens, and electronic cigarettes. The indoor PM emission rate from cooking, for example, depends greatly on the food being cooked, the cooking method (whether the food is being grilled, fried, baked, or sautéed and the type of cooking oil being used, for example), and the type of ventilation. Hildemann said that only a fraction of the people who have ventilation fans above their stoves actually turn them on in a consistent manner. She added that burning food can very quickly introduce large quantities of PM into the indoor environment. Natural gas stoves and ovens emit mainly UFPs, but how long they persist in indoor air is unclear, and their chemical composition is not well characterized (Minutolo et al., 2008).
Electronic cigarettes are a relatively new source of indoor PM, and it is clear from the literature, Hildemann said, that UFPs can form from the condensation of the organic chemicals in electronic cigarette emissions (Blair et al., 2015; Fernandez et al., 2015). The sizes and re-evaporation rates of these particles depend on the dilution conditions, she said. One shortcoming of available studies is that the measurements have been made under controlled laboratory conditions. “I don’t think there is information out there that I yet trust that reflects what might be seen if you were indoors with someone smoking an electronic cigarette,” Hildemann said.
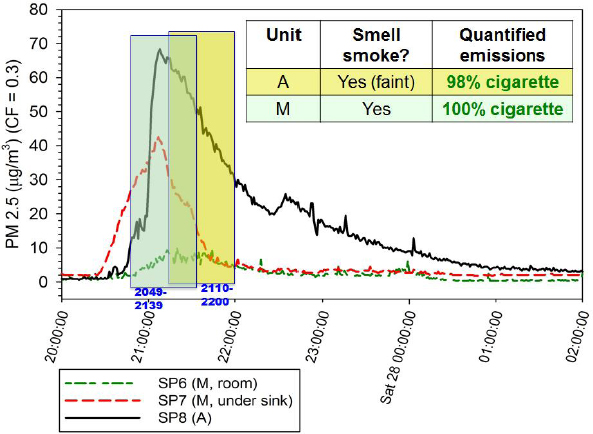
Secondhand smoke can be a significant source of indoor PM in multiunit housing, she said. “If you live in an apartment or condominium and you have neighbors next door or underneath you who smoke, infiltration of secondhand smoke into your unit can be quite substantial,” Hildemann said. She explained that secondhand smoke can infiltrate from outdoor areas, such balconies, patios, and open windows; through walls and ducts; and via ducts that can move air from one residence to the next. For example, in one study she and her colleagues collected PM from two units before,
___________________
2 This section is based on the presentation by Lynn Hildemann, a professor of civil and environmental engineering at Stanford University, and the statements are not endorsed or verified by the National Academies of Sciences, Engineering, and Medicine.
during, and after someone a floor below had smoked a cigarette (Dacunto et al., 2013), and they were able to demonstrate that 98 to 100 percent of the elevated PM2.5 was from secondhand smoke (see Figure 2-5).
One area that needs more study, Hildemann said, is the relationship between exposure to combustion emissions and the proximity to the source. When indoor combustion is occurring under conditions of natural ventilation, PM will not disperse immediately throughout the indoor environment, she explained. The question is, How bad is it to be close to an active combustion source? One experiment found that exposure to PM within 1 meter of the source can be 10- to 20-fold higher under normal conditions than what the exposure would be in a well-mixed environment (Acevedo-Bolton et al., 2012). Moreover, while the average concentration indoors is lower with higher ventilation rates, the proximity enhancement is higher because ventilation decreases the well-mixed average concentration of PM but has a smaller effect on the cloud of emissions close to the combustion source.
SOURCE: Hildemann slide 5, adapted from Dacunto et al. (2013) Figure 2; reprinted with permission from Elsevier.
The proximity effect is particularly important, Hildemann said, for short-duration sources, in cases where emissions consist mainly of large PM that quickly settles out of the air before it can be transported, and with UFP emissions, which are removed rapidly through coagulation. One implication of these physical phenomena, she said, is that standing close to a stove in use will result in higher exposures to stovetop PM emissions than would be the case for room-average conditions.
The indoor environment can also be a rich source of allergens, Hildemann said. Pets can be a significant source of shed skin flakes, or dander, which by itself can be an allergen because of its dog or cat saliva content. Dander also contains bacteria that can be allergenic. Various components of house dust, such as mold spores, bacteria, mite proteins, and cockroach proteins, can be allergenic, and dust is readily resuspended by vacuuming and other human activities. Damp surfaces can harbor molds and bacteria that can be resuspended, and, Hildemann noted, the levels of certain molds and fungi, such as those belonging to the genera Aspergillus and Penicillium, tend to be higher indoors than outdoors.
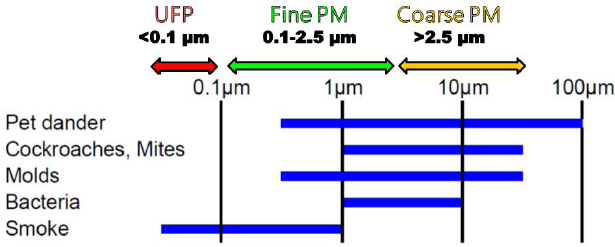
Compared to smoke particles, airborne allergens span a large range of sizes (see Figure 2-6). Mite allergen particles, for example, can come from mite feces or pieces of molted exoskeleton. What this size variation means as a practical matter, Hildemann explained, is that there will be a wide range of airborne residence times for indoor allergens, and there will be variability in terms of where these allergens deposit in human lungs. PM10, she said, clears from the lungs in hours, whereas PM2.5 and UFPs can take weeks to clear.
SOURCE: Hildemann slide 10.
House dust is an important source of PM, Hildemann said, and vacuuming is good way to increase exposure to PM2.5. Unpublished work from her laboratory found that PM2.5 levels increase two- to five-fold during vacuuming, with the variation resulting largely from how well the exhaust filter fits in the filter frame.
Addressing areas that need further research, Hildemann said that little is known about the factors affecting the emission rates of bacteria and fungi from damp surfaces. Airflow, vibration, and material type are thought to play some role in determining the rate at which these organisms become airborne from damp surface, but the main challenge in learning more about these processes, she said, is that researchers are still not sure how to accurately estimate emission rates from damp surfaces. Additional studies would be useful to understanding how individual activity patterns and gender influence exposure to allergens.
As a final thought, Hildemann said she wondered what the impact of global climate change would be on indoor PM exposures. One concern she has is that more homes will be sealed tightly to reduce the cost of air conditioning, which would lower the AER and allow indoor PM emissions to build up to higher levels. Homes that are more tightly sealed will also have higher humidity levels, creating more hospitable conditions for molds, some bacteria, and mites.
PARTICLE RESUSPENSION IN INDOOR ENVIRONMENTS3
Every person is surrounded by a cloud of particles, Brandon Boor said, and the fundamental process for creating that cloud is resuspension. Particles resuspend when they detach from surfaces; are exposed to various removal forces, such as aerodynamic lift and drag, surface vibration forces, and electrostatic forces; and then become airborne. Human-induced particle resuspension, he said, is associated with various activity patterns and different types of movements—walking and crawling across a carpeted floor will resuspend particles, as will turning over in bed—and the concentration of resuspended particles is linked to the number of people in a room and how much they move around. Occupants can be exposed to resuspended particles as a result of resuspension they themselves cause or by resuspension induced by others in their workplace or home.
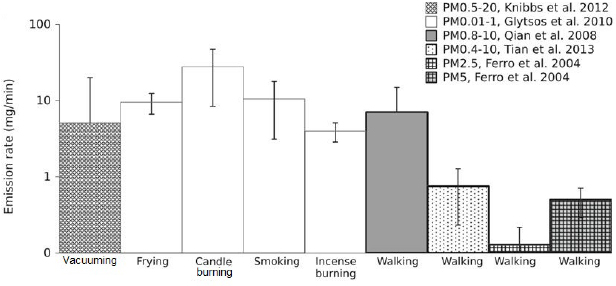
Particle resuspension from walking is an important indoor source of PM, with PM10 emission rates ranging from 1 to 10 milligrams per minute (Qian et al., 2014) (see Figure 2-7). To put that into perspective, Boor
___________________
3 This section is based on the presentation by Brandon E. Boor, assistant professor of civil engineering at Purdue University, and the statements are not endorsed or verified by the National Academies of Sciences, Engineering, and Medicine.
SOURCES: Boor slide 4, from Qian et al. (2014) Figure 1 [references in original publication]; reprinted with permission from Elsevier.
estimated that, based on typical activity patterns, a typical person would resuspend 10 to 100 kilograms of dust (PM10) over a lifetime. House dust, as Hildemann discussed, is a significant source of various allergens, but it is also a reservoir for many SVOCs, such as phthalates and organophosphates. One area of concern that Boor mentioned was the exposure of infants to PM in the near-floor environment as they crawl and play on carpeted surfaces.
Boor said that seminal studies on particle resuspension over the past 20 years, including work by Thatcher and Layton (1995) and Qian and Ferro (2008), have used a material-balance model to mechanistically evaluate particle resuspension from indoor surfaces. Resuspension rates and fractions can be determined by measuring the size-resolved concentration of particles in the air and on a surface as well as the frequency of movement. Resuspension is then linked to exposure through airborne particle transport processes and airflow patterns that create some concentration of PM in the breathing zone.
With regard to dust, Boor said that there are many studies in which various sources of household dust have been collected and analyzed for its microorganism content (Adams et al., 2015; Barberán et al., 2015) and SVOC content (Blanchard et al., 2014; Dodson et al., 2015; Weschler and Nazaroff, 2010). Some of these studies have calculated dust loads on indoor surfaces, which can range from light dust loads of less than 0.1 gram per square meter of surface from a mattress to as high as 100 grams per square meter from carpeting or ventilation ducts. Few studies, however, charac-
terize the size distribution, either by number, volume, or mass fraction, of settled dust particles—something that Boor said needs to be addressed by future research to improve our mechanistic understanding of resuspension.
Collecting dust is not as simple as it sounds, Boor said. Dust often consists of fragile agglomerates of smaller particles that can fall apart during collection, which would shift the observed size distribution. Other aspects of research on dust are also challenging. “The structure of dust is complex and something we know little about,” Boor said. Dust deposits, he added, can be compact or fluffy, depending at least in part on how they are deposited on a surface and how they are altered by compression or cleaning activities. They can also agglomerate in myriad ways to form a variety of shapes. Biological particles—such as single bacterial cells and aggregates of bacterial cells, pollen grains and fragments, fungal spores and fungal fragments, and abiotic particles (for example, mineral dust) with attached microbes—come in a spectrum of shapes and sizes (aerodynamic diameter), with complex surface features and varying electrostatic charge, Boor said.
Dust adhesion plays an important role in resuspension, yet most studies have been narrowly focused on spherical particles adhering to flat surfaces, and neither spherical particles nor flat surfaces reflect the indoor reality. “Indoors, we have non-spherical particles and complex surfaces such as fabric fibers, clothing, bedding material, and carpet fibers, and there are very few data on particle adhesion to different types of fabric fibers,” Boor said. Fabric fibers, for example, come in intimate contact with the human body and accumulate moisture and skin lipids, which may affect particle adhesion over time. Particles may become embedded to varying degrees in different kinds of fibers, and little is known about the role that process would play in resuspension. The loosely bound fibers of a shirt or pillow cover also behave differently when exposed to movement, which may affect resuspension processes in ways that are still largely unknown.
There is a better understanding of how different human activities affect resuspension, Boor said. One study of walking, for example, used a mechanical foot in a small test chamber to measure resuspension from different types of flooring materials (Tian et al., 2014) and found that for particles greater than 1 micron, more particles come off of carpet than from hard flooring. Boor participated in a study that looked at the human-induced resuspension of mattress dust particles as a function of dust load, ventilation rates, and type and intensity of movement (Boor et al., 2015). Movement on a bed stirs up dust, he said, and the breathing zone concentration of dust particles remains elevated throughout the duration of the movement and decays slowly, leading to exposures that last beyond the period of movement—for example, as one falls asleep and lies still in bed. He and his colleagues also found that the resuspension rate increases with particle size, which he attributes to the increase in the magnitude of detach-
ment forces, such as aerodynamic lift and drag and surface vibration, that accompanies an increase in particle size. The body mass of the volunteers who participated in study had little effect on resuspension rates, though the intensity of the movement, as characterized by surface vibrations, did have a large effect on the resuspension rate.
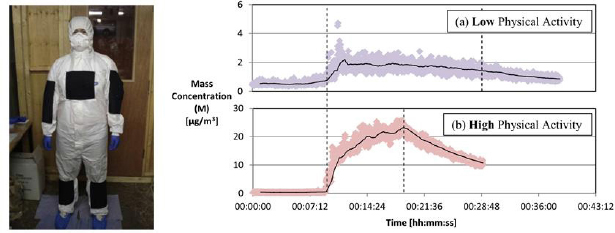
Another route of exposure to dust is dust becoming detached from clothing. One study found that as much as 25 percent of the particles deposited on a cleanroom suit detached while a volunteer was dancing to an Irish reel, which was considered a high-level of physical activity (McDonagh and Byrne, 2014a). Particle detachment was some 10-fold lower when the volunteer was engaged in a low-level physical activity (see Figure 2-8). Larger particles were displaced more than smaller particles (McDonagh and Byrne, 2014b).
As Boor had mentioned earlier, the effect of an infant crawling on the near-floor microenvironment is not well characterized, so in a recently completed study he and colleagues in Finland built a simplified mechanical crawling infant and used it to measure airborne particle concentrations as it scuttled across 12 area carpets borrowed from Helsinki residents. Boor also sent samples of the collected real-world dust that had been resuspended from these carpets to a microbiologist, Martin Täubel, for analysis using quantitative polymerase chain reaction (qPCR) and next-generation genome sequencing. Optical measurements showed large bursts of particles across the range of particle sizes (UFPs, PM2.5, and PM10) and indicated that the particles remained suspended in the air for a significant amount of time. The qPCR data revealed a large variation in the microbial concentra-
SOURCES: Boor slide 22, from McDonagh and Byrne (2014a) Figures 1 and 2; reprinted with permission from Elsevier.
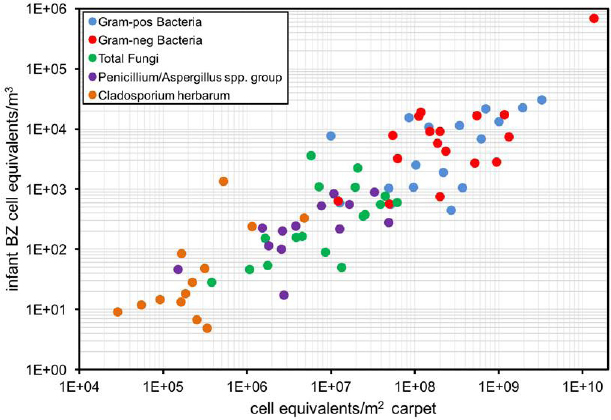
SOURCE: Boor slide 26.
tions and composition in the infant breathing zone (see Figure 2-9). Boor proposed that there be more focus in characterizing this kind of cloud of particles and microbes around infants as they crawl.
While qPCR data are useful, it requires hours of dust collection on a filter to accumulate detectable amounts of microbial DNA. Another useful technique, which has been applied in Nazaroff’s laboratory, is using laser-induced fluorescence to characterize bioaerosol concentrations and size distributions in real time. Boor and his colleagues in Finland used this technique to show that both crawling and walking triggered a burst of resuspended fluorescent particles from carpeting but that particle decay occurred more quickly in the infant breathing zone after crawling than in the adult breathing zone after walking. Boor mentioned some recent work using fluorescent and optical signatures to distinguish among bacteria, fungi, and pollen in real time (Hernandez et al., 2016) and said he thought it would be interesting to conduct that type of analysis on particles resuspended by human activity. He also proposed using high-speed imaging to follow the trajectories taken by individual dust particles as they are
dislodged by human activity from various indoor surfaces—something that has been done with micrometer spherical glass beads (Kassab et al., 2013).
This type of work, Boor said, proves the importance of looking not just at resuspension, but also as the transport of particles to the breathing zone. As his work and that of others (Shalat et al., 2011) have shown, concentrations of PM are much greater near the floor than they are at the level of the typical stationary monitoring site used in indoor field measurements. Boor also cited the results of a modeling study showing that, while walking, shorter people will be exposed to more influenza virus particles in dust resuspended into their breathing zones than will taller people (Khare and Marr, 2015). What is needed to create a full, holistic picture of particle resuspension, Boor said in closing, are integrated measurements of particle resuspension to the breathing zone across all scales, from small-scale wind tunnel and chamber studies to full-scale controlled chamber studies and field measurements in offices and homes.
DISCUSSION
Nazaroff started the discussion by asking the panelists to offer their opinions on what they see as the biggest gaps in two areas: the gap between what is known and what needs to be known, and the gap between what experts in the field know and what they actually do in practice. Hildemann responded that she would like to see more attention paid to the roles that building design in general and ventilation in particular play in influencing indoor air quality. Stephens said he believes that more information is needed to understand how real-life exposures to PM relate to the epidemiology of health effects in order to better inform practice and regulation. Other priorities, he said, should be to develop approaches for reducing exposures to PM within the nation’s large existing building stock and to create a labeling scheme for devices—he specifically mentioned desktop 3D printers—that would inform consumers what these devices are emitting into the indoor environment. “There are ways that government and industry consortia could help improve public knowledge,” Stephens said.
Boor agreed that translating research results into useful information for the public is something the field needs to address, particularly with regard to helping parents limit exposure of infants to PM and to various gaseous species such as SVOCs. Barbara Turpin from the University of North Carolina singled out the need for better advice for the public on when to increase versus decrease ventilation in order to decrease PM exposure. Hildemann added that the same could be said of vacuuming, and she said that one question consumers could have is whether to vacuum more to reduce the resuspension of particles between vacuuming or to vacuum less because of the exposure to high concentrations of particles during vacuuming.
However, she said, the real solution would be to not have carpeting in the home because hardwood and tiled floors are more efficiently cleaned and the resuspension rates from walking on such flooring are much lower than from walking on carpeting. Boor said that he had examined the effect of vacuuming on particle resuspension in his mechanical infant crawling study and found that vacuuming prior to crawling had little effect on particle concentrations in the infant breathing zone.
Tiina Reponen from the University of Cincinnati, commenting on the work on bioaerosols that Hildemann and Boor had discussed, reiterated that bioaerosols are an important component of both indoor and outdoor PM. She then said that there are studies of bioaerosols emitted from damp surfaces showing that microbes are released more readily into dry air than into humid air and that increased airflow and vibration increase microbial release from surface. More importantly, she said, these studies have shown that small fragments of microbes are also released, so it is important to look for biological components in the smaller size fractions of PM as well as in the large fractions.
Howard Kipen from Rutgers University noted that while EPA regulates outdoor PM levels based on a substantial and sustained epidemiologic database linking outdoor PM levels with a wide range of adverse health effects, there needs to be work done to determine the health consequences of outdoor PM translated to indoor exposures, given that Americans spend 90 percent of their time indoors and that 50 percent of indoor PM comes from outdoor sources. “We need to do that to be able to decide whether the interventions we can demonstrate are going to protect health,” Kipen said. Charles Weschler from Rutgers University said he would argue that since the bulk of exposure to outdoor PM particles occurs indoors, more is known about the risk of indoor exposure to outdoor PM than is known about the risk of outdoor exposure to outdoor PM or indoor exposure to PM of indoor origin. Kipen replied that he agreed with Weschler but that that fact is not actualized in regulation.
Boor, also responding to Kipen’s remarks, said that one opportunity to get better data on indoor PM2.5 and UFPs would be to explore the use of commercially available, relatively low-cost particle sensors on a broad scale. Today, he said, relatively inexpensive optical monitors can detect larger particles accurately, but work still remains to test the accuracy of devices in measuring PM2.5 and UFPs and to develop portable devices that could be used to create sampling networks in multiple environments. “If we push in that direction,” he said, “we could build large-scale databases of size-resolved PM levels.”
Joe Hughes from IAQ Radio said that from his perspective one of the biggest gaps of knowledge concerns the value of mechanical systems cleaning. He noted that the information being used to advise consumers on
whether to have their air ducts cleaned relies on a 1997 EPA report. Hughes also supported Boor’s call to develop inexpensive ultrafine particle counters that could be deployed in the field. William Fisk from the Lawrence Berkeley National Laboratory remarked that panelists had not addressed three categories of indoor PM sources that need further study: the outdoor air as a source of allergens and inflammatory agents; the wetted surfaces in HVAC systems; and episodic outdoors sources such as wood combustion and wildfires.
An online participant asked the panelists if there were data on the contribution that cleaning product residues make to indoor PM and whether these residues alter the resuspension of other particles. Boor said he did not know of any studies looking at cleaning residues, and Hildemann said she thought that more work is needed to answer those questions. She did say that some proportion of the droplets produced by spray cleaning products do not reach a surface and that as the carrier solvents evaporate, they leave behind airborne particles of wax and other substances. She also explained that the enzymes in laundry detergents can be detected in active form in dryer lint after clothes have been washed and dried. As a result, in addition to dust coming off of clothing, there may also be some allergenic material in the form of active enzymes. Kipen added that one of the most interesting findings in occupational asthma epidemiology research over the past decade has been that people who do indoor cleaning for a living have increased rates of asthma. He noted, too, that there are suggestions that this finding extends to people who are non-occupational users of cleaning products. Stephens said that the challenge is going to be to develop a connection between knowledge of physics, chemistry, and biology and the epidemiology pointing to adverse health effects.


