
4
Characterizing Indoor Exposure Levels
The workshop’s third session focused on exposure levels from indoor PM, including approaches for measuring exposure and some of the factors that determine exposure levels. Barbara Turpin of the University of North Carolina Gillings School of Global Public Health discussed how characterizing indoor air can provide insights into the sources of indoor PM and the transformations that these particles can undergo. Roy Harrison of the University of Birmingham addressed some of the determinants of and exposure to indoor PM. Gary Adamkiewicz of the Harvard T.H. Chan School of Public Health reviewed the socioeconomic factors that can influence indoor PM exposures. An open discussion moderated by Terry Brennan followed the three presentations.
PM2.5 EXPOSURE CHARACTERIZATION PROVIDES INSIGHTS INTO SOURCES AND TRANSFORMATIONS1
As had been discussed in earlier workshop sessions, Barbara Turpin said, indoor PM2.5 concentrations represent a balance between sources and sinks, and the sources include indoor emissions of particles and outdoor-to-indoor transport of particles. The sinks include the deposition of particles on indoor surfaces, filtration by HVAC systems, and exfiltration of
___________________
1 This section is based on the presentation by Barbara Turpin, a professor of environmental sciences and engineering at the University of North Carolina Gillings School of Global Public Health, and the statements are not endorsed or verified by the National Academies of Sciences, Engineering, and Medicine.
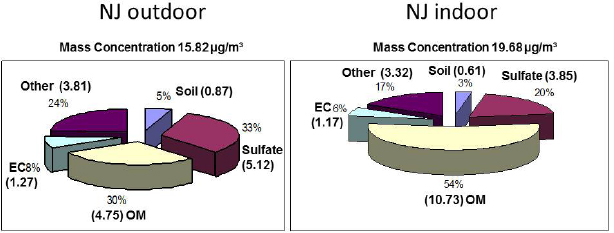
NOTE: EC = elemental carbon; OM = organic matter.
SOURCE: Turpin slide 3, Reprinted by permission from Macmillan Publishers Ltd.: Journal of Exposure Science and Environmental Epidemiology (Polidori et al., 2006), adapted from Figure 3.
particles. Chemistry and partitioning also affect indoor PM2.5 concentration because of the changes that particles may undergo when moving from the temperature and humidity conditions outdoors to different conditions indoors.
Data from the RIOPA study, which was undertaken to evaluate the contribution of outdoor sources of air pollutants to indoor concentrations and personal exposures (Weisel et al., 2005), found that the mass of organic matter in indoor household PM2.5 was more than twice the organic matter in PM2.5 collected outside of the same house at the same time (see Figure 4-1), while the masses of sulfates, elemental carbon, and soil material were lower indoors. The additional organic matter in indoor PM has to be coming from an indoor source, Turpin said, either emitted as PM or produced via a phase change or a chemical reaction. She and her colleagues measured the amount of particulate organic matter indoors versus outdoors and calculated that, on average, 71 to 76 percent of the organic carbon in indoor PM2.5 comes from indoor sources, with a lower bound estimate of 41 percent (Polidori et al., 2006).
Data from another study using an unoccupied home near Fresno, California, showed that it is difficult to get particulate nitrate from outdoors to indoors (Lunden et al., 2003), a finding that Turpin said makes sense because nitrate is semivolatile and exists in equilibrium with the gaseous nitric acid. When a nitrate-bearing particle and the equilibrium-associated nitric acid gas moves from outdoors to indoors, Turpin explained, the nitric
acid is scrubbed from the air, either because it cannot pass through the building envelope or because it sticks to interior walls once it has made it inside the building. Once the nitric acid is removed, the ammonium nitrate has to re-equilibrate and it does so by turning into gaseous nitric acid. Calculations using data collected in southern California show that at a typical indoor air exchange rate, only approximately 12 percent of the outdoor particulate nitrate is found indoors.
The degree to which the components of outdoor PM2.5 penetrate and persist indoors vary broadly, from 4 percent for soil components to 78 percent for sulfate (Lunden et al., 2008; Meng et al., 2007; Polidori et al., 2006). The observed differences are a function of the size distribution of the diverse aerosol components within PM2.5 and changes in the gas–particle partitioning of the components as the aerosol encounters indoor conditions. “The fraction of outdoor PM that you find in indoor air varies significantly depending on the PM species,” Turpin said. “In addition, the composition of that PM changes when you bring outdoor PM indoors.” She also noted that the composition of indoor PM of indoor origin is mostly organic (see Figure 4-2).
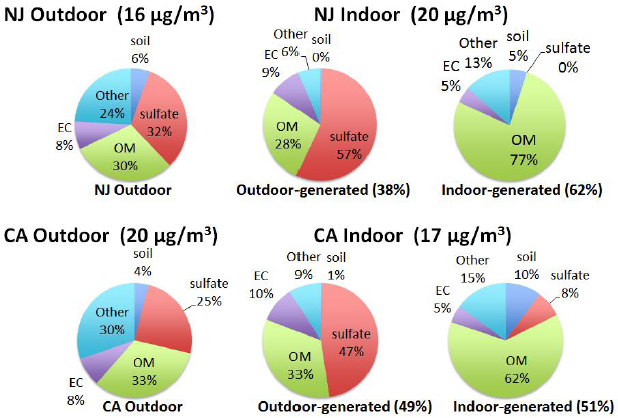
NOTE: EC = elemental carbon; OM = organic matter.
SOURCE: Turpin slide 9.
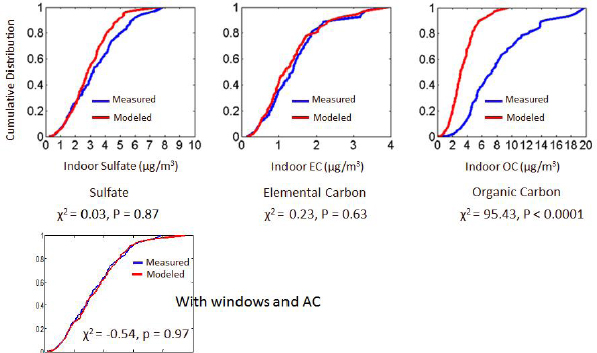
It is also possible to use a mass balance model to calculate the fraction of indoor PM2.5 that are of outdoor origin. This calculation entails accounting for the species-resolved size distribution, for whether the windows in the home were open or closed, and for what the losses from air conditioning and filtration would be as well as taking into account measured variations in AERs and the day-to-day particle composition (Hodas et al., 2014). For elemental carbon and sulfate, the agreement between calculated and measured values was good, Turpin said, but it was not good for organic carbon (see Figure 4-3). That latter result was not surprising, she said, given that there is so much organic carbon generated indoors and that these modeled values exclude indoor sources.
Turpin and her colleagues have used this model to take outdoor PM2.5 measurements and predict what would happen to these particles when they transited indoors (see Figure 4-4). For a home near a major roadway in the northeastern United States, at an AER that is typical of low-income homes (0.90 per hour), the fraction of outdoor PM2.5 that makes it indoors and remains suspended was estimated to be 62 percent, while in a southwestern suburban home that is not near a roadway and has an AER typical of a median-income home (0.45 per hour), that fraction would be 36 percent.
SOURCE: Turpin slide 11, from Hodas et al. (2014) Figure 1; reprinted with permission from Elsevier.
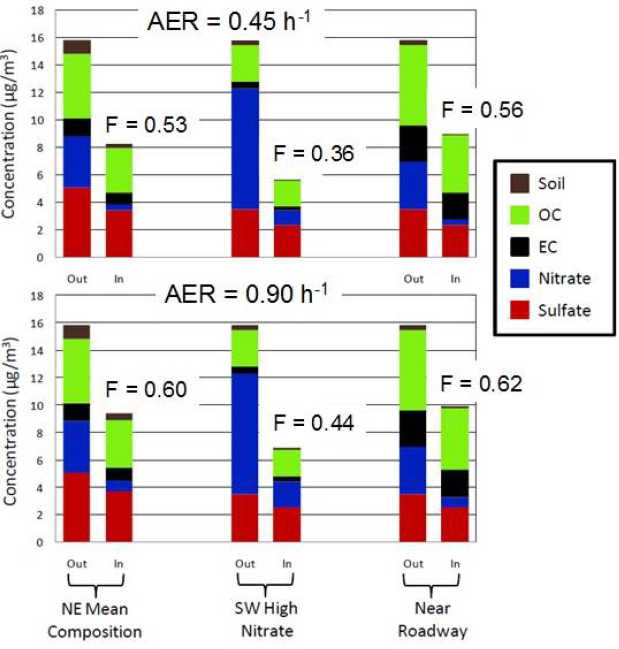
The infiltration factors reported here were calculated from a model that considers the particle size-dependence of the infiltration factor, the various particle size distributions of different chemical components of outdoor PM2.5 and the air exchange rate for a typical [AER = 0.45 h–1] and low-income [AER = 0.90 h–1] U.S. residence. NOTE: AER = air exchange rate; EC = elemental carbon; NE = Northeast; SW = Southwest.
SOURCE: Turpin slide 12; reprinted by permission from Macmillan Publishers Ltd.: Journal of Exposure Science and Environmental Epidemiology (Hodas et al., 2012), adapted from Figure 3.
Turpin’s conclusion from this study is that there is “quite a bit of geographic and seasonal variability in the fraction of outdoor PM that makes it indoors.”
As an aside, Turpin noted that there is also large variability in the health effect estimates for outdoor PM2.5, and she cited studies (Bell et al., 2009; Peng et al., 2009) showing that the increase in respiratory hospital admissions per 10 microgram per m3 increase in PM2.5 was smaller in the southwestern United States than in the Northeast. “Some of that difference could be because the composition of aerosol is different in the southwest than in the northeast,” Turpin said, “but some could be from exposure error given that we are not measuring PM2.5 levels indoors where people are spending most of their time and the fraction of PM that gets indoors is different in different places.” In fact, a study conducted in China that accounted for the fraction of outdoor PM that becomes indoor PM produced larger effect estimates, less inter-city heterogeneity, and a better fit between daily mortality figures and model prediction (Chen et al., 2013).
To support the idea that gas-particle partitioning changes as particles move from outdoors to indoors, Turpin used gas and particle phase polycyclic aromatic hydrocarbon (PAH) measurements from the RIOPA study. A significant amount of variability in the PAH gas-particle partitioning was associated with changes in temperature going from indoors to outdoors, which would affect the volatility of these compounds (Naumova et al., 2003). Subsequent modeling studies for a more complex mixture of organic compounds yielded similar results which correlated geographic differences in temperature gradients, air conditioning and heating use, and indoor organic matter emissions to indoor organic PM composition (Hodas and Turpin, 2014).
More recently, Turpin and her colleagues have been measuring levels of oxidized volatile organic compounds in both outdoor and indoor air. Measurements from 13 homes show the indoor levels of water-soluble organic compounds, which are presumed to be oxidized, are more than an order of magnitude higher than the outdoor levels. Turpin and her colleagues are currently working to determine the identity of those compounds. Exposures to oxidized volatile organic compounds are poorly characterized, and Turpin predicted that these compounds participate in further chemistry on indoor surfaces in damp homes (for example, via hydrolysis, oxidation, acid-catalyzed, or nucleophilic chemistry on walls, skin and wet aerosol particles).
SOME DETERMINANTS OF INDOOR PM CONCENTRATIONS AND EXPOSURE2
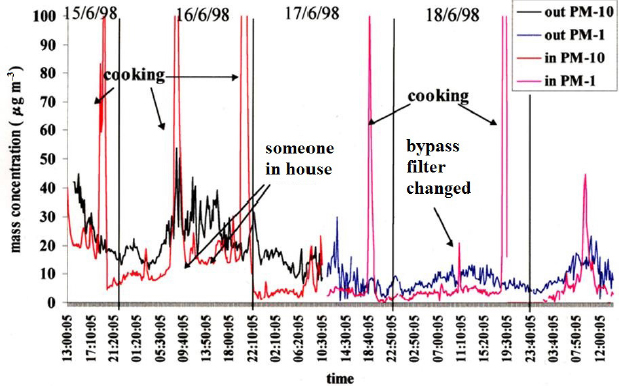
Over a decade ago, Roy Harrison and his colleagues measured the flow of air pollutants from a busy road in London into an empty office and found substantial wind-dependent penetration of pollutants indoors, particularly PM2.5 (Riain et al., 2003). As Harrison told the workshop audience, a detailed analysis of similar data from an empty office at the University of Westminster showed that there was a lag of approximately 20 minutes between changes in the outdoor PM2.5 levels and indoor levels. Measurements of PM10 and PM less than 1 micron in diameter (PM1) in an occupied house found substantial reductions of both PM10 and PM1 indoors compared to roadside measurements, except when the occupants were cooking or when someone entered the house (see Figure 4-5).
When the analysis focused on particle number instead of particle mass, the results showed similar spikes for indoor-emitted PM reflecting human activity. After accounting for the spikes, there was good correlation between indoor and outdoor particle number levels, though there was a much bigger attenuation of the indoor concentrations for particle number than there is for particle mass. “We see a substantial reduction in indoor particle numbers compared to outdoors when we look solely at the penetration of outdoor particles to the indoor environment,” Harrison said.
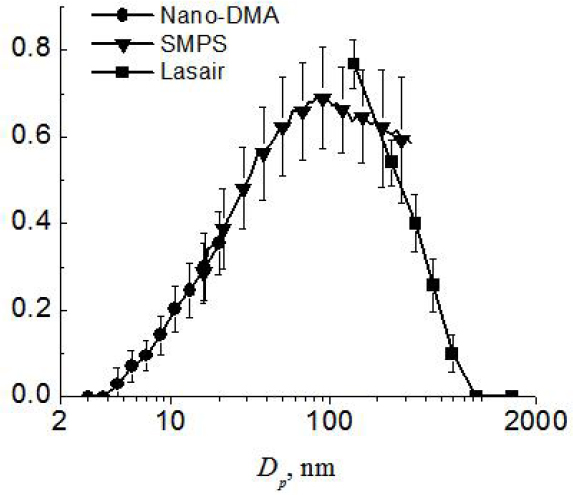
In another study, Harrison and his colleagues measured particle size distributions both in an unoccupied, sealed walkway with little ventilation above a busy highway and from the nearby roadside. When they plotted the ratio of indoor to outdoor numbers by particle size, the results, as Harrison recounted, were surprising in that there was a rapid decline in indoor-to-outdoor ratio at larger diameters (see Figure 4-6). He said that he would not expect such a large drop-off if the buildings were better ventilated, and he did not expect these results to be typical of all buildings.
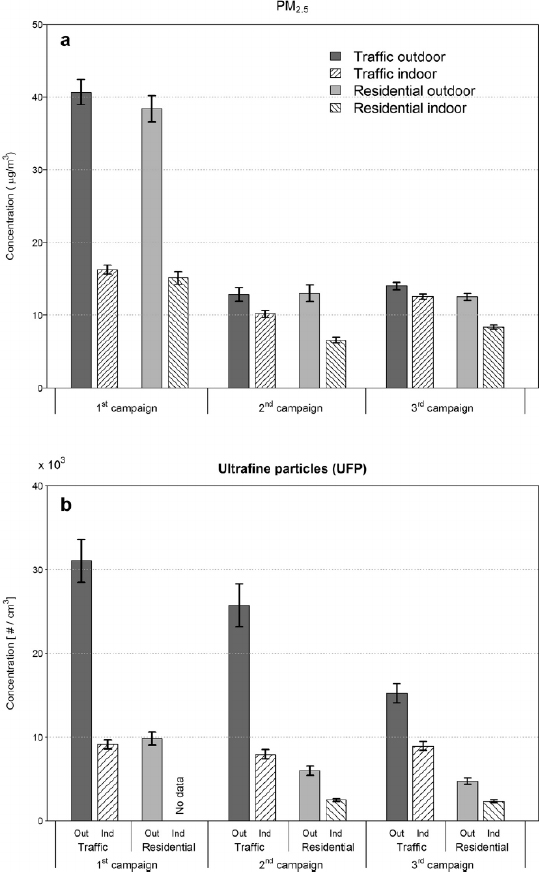
Harrison then discussed the results of a study conducted in Bologna, Italy (Zauli Sajani et al., 2015) in which outdoor air was pumped into two unoccupied rooms, one near a heavily trafficked location, the other in a residential neighborhood, to look specifically at particle sinks (see Figure 4-7). This study found that there was a more substantial loss of UFPs than of PM2.5 when moving from outdoors to indoors. An analysis of the chemical composition of the particles showed that approximately 95 percent of the nitrate was lost moving from outdoors to indoors, with much smaller losses of sulfate and organic carbon. Measurements showed there was rel-
___________________
2 This section is based on the presentation by Roy Harrison, the Queen Elizabeth II Birmingham Centenary Professor of Environmental Health at the University of Birmingham, and the statements are not endorsed or verified by the National Academies of Sciences, Engineering, and Medicine.
SOURCES: Harrison slide 5; underlying research discussed in Jones et al., 2000.
atively little loss between outdoors and indoors for PM2.5 mass, but there was a substantial loss of ultrafine particle numbers, which Harrison noted was especially pronounced for rooms near road traffic.
There are many possible explanations for the heavy loss of UFPs, Harrison said. One is that their deposition velocities are higher than for larger particles. Modeling results suggest that coagulation of particles in the 30- to 50-nanometer range is likely to be rapid and that it may be a factor when the concentration of particles is high. Evaporation of UFPs is a possible third mechanism, one Harrison believes to be important because the walls of the unoccupied room were likely to serve as a sink for the SVOCs that dominate the composition of traffic-generated UFPs.
Another study, also conducted in Bologna, measured indoor and outdoor PM at the front and back of two buildings—one on a heavily trafficked street and a second on a low-traffic residential street—during hot and cold seasons (Zauli Sajani et al., 2016). During the summer, there was little difference in the PM2.5 levels at analogous measurement locations. In winter, however, there was a significant difference between outdoors and indoors at both the front and rear measurement locations, which Harrison believes arose because outdoor PM2.5 in the winter is likely to have a higher nitrate content than outdoor PM2.5 in summer. The data from
SOURCE: Harrison slide 11.
this study also showed a substantial loss of smaller particles when moving from outdoors to indoors, particularly for particles collected at the front of the building. A study conducted in Prague named cooking and cleaning materials as the largest contributors to indoor-generated PM. Incense burning, vacuuming, and smoking were other important sources of indoor PM identified in this study, Harrison said.
Harrison then addressed the subject of exposure and, in particular, the difference between measurements of personal exposure to PM versus the results from static indoor monitoring. Data from one study showed that personal exposure to carbon monoxide and nitrogen dioxide was well reflected by a static room monitor, but the personal measurement for PM10 was always higher than that determined from the static measurement (Kim et al., 2002). Harrison said that the larger personal exposure levels likely resulted from a “personal cloud” of shed skin cells and dust from clothing.
SOURCES: Harrison slide 13, from Zauli Sajani et al. (2015) Figure 1; reprinted with permission from Elsevier.
While the difference between the personal measurements and the static room monitor for PM2.5 was smaller, Harrison said that the exposures to these particles can also be significantly higher than would be reflected by measured indoor concentrations because of this personal cloud effect.
Reflecting on the meaning of these findings with respect to health risk, Harrison said that they point to a number of unresolved issues, starting with the differential toxicity of particles from various sources or of those with different compositions and sizes. He wondered if particles from indoor origins such as cooking and resuspended house dust are as toxic as the outdoor pollutant mixtures measured in most epidemiological studies and if the elemental carbon component of diesel particles is comparable in toxicity to the organic component, which is largely from lubricating oil. He also wondered if the fact that buildings are very protective for UFPs, SVOCs, and nitrates matters in terms of health risk and what the determinants and significance of the personal cloud of particles is for health.
SOCIOECONOMIC DETERMINANTS OF INDOOR PM EXPOSURE3
Gary Adamkiewicz began his presentation by stressing two points: there are potential disparities in the exposure of individuals and communities to high levels of PM, and there are many instances where people are exposed to high levels of indoor pollutants known to cause adverse health effects, yet these issues have been largely ignored by policymakers. As an example, he cited cooking and ventilation and said that there are certainly disparities with regard to the type, age, and condition of ventilation equipment installed in kitchens. He observed, though, that even if everyone in the United States had the same stove and ventilation equipment, there would still be disparities as a result of differences in the homes people live in. His research has focused on public and low-income housing, where an open kitchen and living room often form one primary living space. In such homes, a family’s exposures to PM generated during cooking is likely to be higher than in a middle- or upper-class home with a separate kitchen. But even if everyone American lived in the same type of home, he added, there would be disparities in exposures due to different levels of outdoor PM. “All of this is to say that we need to take a multilevel view of the determinants of exposure to indoor pollutants,” Adamkiewicz said. “We have to look at how a household embeds within a building that embeds within a neighborhood.”
___________________
3 This section is based on the presentation by Gary Adamkiewicz, an assistant professor of environmental health and exposure disparities at the Harvard T.H. Chan School of Public Health, and the statements are not endorsed or verified by the National Academies of Sciences, Engineering, and Medicine.
TABLE 4-1 Drivers of Exposure Disparities in Indoor Environments
| Sources | Indoor Sources |
|
|
|
| Settings | Outdoor Sources |
|
|
|
| Structure | Physical Structure |
|
|
|
| Behavior | Source Use Patterns |
|
|
|
| Activity Patterns |
|
|
||
SOURCE: Adapted from Adamkiewicz slide 4.
There are so many drivers of disparities—including different sources of indoor PM, the settings in which people are exposed, the structures in which they live and work, and individual behaviors and activity patterns (see Table 4-1)—that eliminating or at least reducing the disparities can seem intractable, Adamkiewicz said. Nonetheless, he continued, it is possible to approach them mechanistically and to identify the most important ones that can be addressed using what is already known about buildings and sources. One issue that he identified, though, is that these drivers are not considered in most studies of exposure. For example, the multifamily dwellings that house low-income families often have many deferred maintenance issues, including ventilation systems that do not function properly, so standard assumptions about AERs may not apply to those residences. There are many instances, too, where stoves are used not only for cooking but also as a source of supplemental heat in low-income households, which would potentially increase exposures to nitrogen oxides and PM beyond what might be included in typical models of indoor exposure. Adamkiewicz presented data for some of these housing-related variables (see Table 4-2).
Leakage and AER are two variables that are important to exposure and that differ by socioeconomic status (Chan et al., 2005). Data from single-family homes show, for example, that low-income homes have higher normalized rates of leakage, which would be expected to decrease PM concentrations because of the important influence of indoor sources. However, low-income homes are typically much smaller than middle- and upper-class homes, and the smaller volume of low-income homes would be expected to increase indoor PM concentrations, Adamkiewicz explained. “We need a framework to understand how these different factors work together mechanistically,” he said, referring to the fact that multiple determinants of indoor air quality can add up in complex ways that affect exposures and cumulative risk. He also emphasized the importance of considering PM originating from both indoor and outdoor sources.
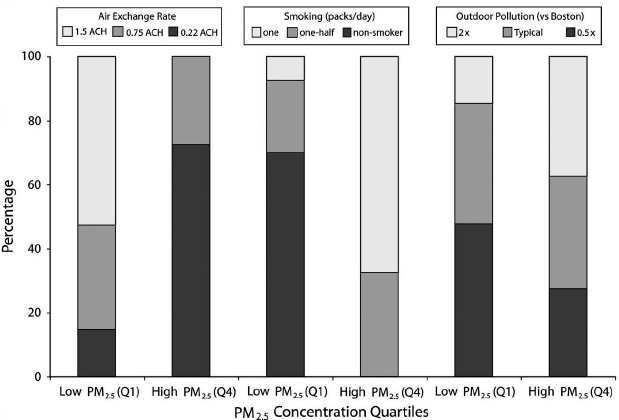
In a modeling study, Adamkiewicz and colleagues examined how various inputs might affect indoor air quality (Adamkiewicz et al., 2011). They started by taking 10 years of Boston outdoor air quality data, varied AERs, sources, and ambient concentrations, and then took the ensemble of results and divided the individual elements into quartiles of PM2.5 exposure level (see Figure 4-8). As expected, Adamkiewicz said, they found that many factors contributed to indoor PM levels, with air exchange and smoking having the biggest effects. The most important finding, he said, was that there were many more indoor factors than the outdoor pollution level that affected indoor PM levels. “Even at very high outdoor air pollution levels and high air exchange rates, the biggest impacts were from indoor factors,” he said.
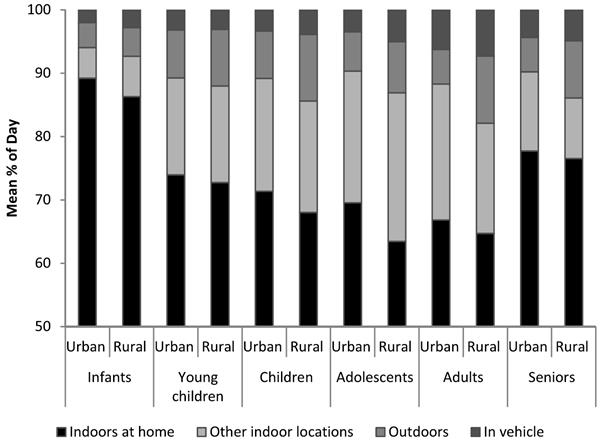
Time-activity patterns are another variable that can map onto socioeconomic status (see Figure 4-9), which Adamkiewicz said points to the importance of understanding the make-up of a community and how its members conduct their daily activities when thinking about exposure disparities. A community with a large number of low-income seniors, for example, would likely have relatively high exposures to indoor PM. “If you think about the chain of events leading to health effects that we should care about, these are important microenvironments to focus on,” Adamkiewicz said.
Numerous studies have shown that smoking, which is linked to socioeconomic status, can be a major contributor to indoor PM2.5 (Frey et al., 2014; Russo et al., 2015). Adamkiewicz and colleagues, for example, looked at PM2.5 and nicotine levels in common areas in multifamily housing in Boston and found differences related to resident characteristics, smoking policy, and season (Arku et al., 2015). The highest levels of PM2.5 and nicotine were found in winter, in units housing the elderly and disabled, and in buildings without smoke-free policies, suggesting that even elderly nonsmokers may be exposed to elevated levels of PM2.5 produced by smokers.
| Income Category | ||
|---|---|---|
| Housing Variable | < $30 K/Year (n = 25,647) |
$30 < $60 K/Year (n = 25,840) |
| Built before 1980 (%) | 71.56 | 65.72 |
| Area of peeling paint larger than 8 × 11 in (%) | 3.11 | 2.04 |
| Any inside water leaks in past 12 mo (%) | 9.14 | 8.67 |
| Neighborhood with heavy street noise or traffic (%) | 28.19 | 25.42 |
| Industry or factory within half block (%) | 6.90 | 5.50 |
| Unit uncomfortably cold for ≥ 24 h (%) | 10.70 | 9.67 |
| Evidence of rodents in unit (%) | 17.77 | 16.81 |
| Mean floor area of unit (ft2) | 1,524.00 | 1,762.00 |
| Mean occupant density (no./1000 ft2) | 2.78 | 2.59 |
| Homes with cracks in floor, wall, or ceiling (%) | 7.13 | 5.10 |
| Homes with holes in floor (%) | 1.85 | 1.03 |
SOURCE: Adapted from Adamkiewicz et al. (2011) Table 1; reprinted with permission from The Sheridan Press.
Adamkiewicz noted that in most federally subsidized public housing, units are divided typically into family housing and elderly/disabled housing.
The importance of smoking as a contributor to indoor PM2.5 was also demonstrated in the Centers for Disease Control and Prevention (CDC) Green Housing Study (Coombs et al., 2016). For families enrolled in the Cincinnati study site, the investigators found that indoor levels of PM2.5 were not markedly lower in the renovated units than in control units. A closer examination of the data showed that the green units happened to have had a higher prevalence of smokers and use of air fresheners in the home, which, Adamkiewicz said, sends an important message. “It is not just about the buildings, but it is about the activity in the buildings, and fixing buildings is not necessarily going to lower exposures,” he said.
As an example of the type of analysis he would like to see more of, Adamkiewicz cited an effort that used American Housing Survey and census data, combined with data on activities and smoking prevalence, to model indoor PM2.5 concentrations (Chahine et al., 2011). Among the results of this effort were predictions that the highest levels of exposure would occur in the South and Midwest, among rural populations, and in
| $60 < $100 K/Year (n = 24,000) |
≥ $100 K/Year (n = 22,842) |
Associated Exposure and Hazards |
|---|---|---|
| 57.77 | 48.63 | Lead paint; structural integrity |
| 1.41 | 0.99 | Lead paint |
| 8.24 | 7.98 | Mold and moisture; structural integrity |
| 21.95 | 16.69 | Outdoor air sources—mobile |
| 3.54 | 1.74 | Outdoor air sources—stationary |
| 7.33 | 6.71 | Supplemental heating; comfort |
| 16.98 | 16.26 | Allergen exposure; pesticide exposure |
| 2,098.00 | 2,853.00 | Exposure to indoor air pollutants |
| 2.31 | 1.82 | Indoor source strength—various |
| 3.88 | 3.31 | Allergen exposure (pests) |
| 0.58 | 0.37 | Allergen exposure (pests) |
low-income households. While there are many caveats concerning the use of this model, Adamkiewicz said that it does provide the ability to try various what-if scenarios and start to develop an understanding of how exposures may vary at a population level.
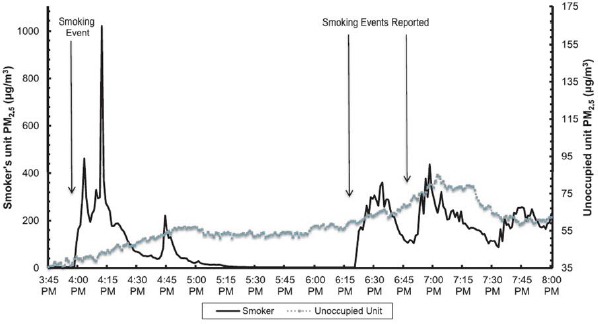
As a final example of research on the role that smoking plays in determining indoor PM levels, Adamkiewicz described a study he and his colleagues have been conducting using real-time data from in-unit public housing sites (Russo et al., 2015). These data were collected from apartments, adjoining hallways, and outdoors. In this study, which compares PM2.5 levels in a smoker’s apartment with PM2.5 levels in an adjacent unoccupied apartment, the smokers record every smoking event so that the investigators can see the real-time effect that those events have on the air quality in the neighboring apartment (see Figure 4-10). Such measurements showed that the levels of PM2.5 in a neighboring apartment rise significantly during and after recorded smoking events.
Adamkiewicz said that there are many studies that, like this one, measure indoor and personal levels of PM2.5 but that do not have disparities as a primary or even a recognized focus of the research. However, embed-
NOTE: ACH = air changes per hour.
SOURCE: Adamkiewicz et al. (2011) Figure 2b; reprinted with permission from The Sheridan Press.
ded in many of these studies are data relevant to the issue that can be mined with some effort to provide insights on disparities. He also said that addressing the disparities that lead to increased levels of exposure is going to require thinking not just about places, but about people, places, and policies together. As an example, Adamkiewicz cited a green housing intervention that he and his colleagues studied (Colton et al., 2014; Russo et al., 2015) that combined better ventilation and a tighter building shell with mandatory smoke-free policies. The interventions resulted in reductions in PM2.5 and nitrogen dioxide levels as well as a 47 percent reduction in respiratory symptoms. This study also found that within a small geographic area there was significant between-household variability in PM2.5 levels that depended on household behaviors and building age and design.
As a concluding thought, Adamkiewicz said he would like to see more work aimed at understanding how household activities affect indoor PM levels and how exposure disparities are related to conditions or activities
SOURCES: Adamkiewicz slide 11, from Matz et al. (2015) Figure 1; reprinted from Environmental Health, published by BioMed Central.
SOURCES: Adamkiewicz slide 18, from Russo et al. (2015) Figure 2; reprinted with permission from Oxford University Press.
that can be mitigated. There are needs, he said, to better understand the links among energy, housing, and health; to recognize the importance of subpopulations—rural versus urban, the elderly, and those in managed or public housing, for example; and to take environmental justice into account when designing studies to assess exposure to indoor PM. He added that he believes a proposal from the U.S. Department of Housing and Urban Development calling for all public housing in the United States to be smoke-free4 would be the biggest indoor PM2.5 intervention possible.
DISCUSSION
Richard Corsi asked Adamkiewicz if any comparisons are being made between new conventional housing and new green housing because, he said, in his mind it is not a fair comparison to pit new green housing against existing housing. Adamkiewicz acknowledged Corsi’s point and said that the only counter to that question is whether all new public housing should be green. “I feel that green new construction is not going to be the answer for all public housing in the United States, but that there are things we can learn about the effect of green elements,” he said.
William Nazaroff asked the panelists to comment on the somewhat conflicting evidence he had heard in the day’s presentations about whether increasing ventilation was good or bad. Harrison responded that there is no simple answer to this question given that good ventilation will increase the amount of outdoor PM that gets indoors but will also decrease the amount of indoor PM that remains in the house when there are significant indoor sources of PM. Turpin added that ventilation itself will not address concerns about indoor PM and PM precursors. The better answer, she said, is to reduce indoor and outdoor emissions of PM. Jeffrey Siegel commented that not all ventilation is equal and that the benefits of ventilation depend on the pathway it takes in a building and whether a ventilation system takes advantage of opportunities to mitigate PM levels. “I think it is more a question of how we do ventilation rather than assessing whether ventilation is good or bad,” Siegel said.
___________________
4 Docket FR 5597-P-02 Instituting Smoke-Free Public Housing, 180 FR 71762 (November 17, 2015).


