
5
Effects of the Population Pedigree on Genetic Signatures of Historical Demographic Events
JOHN WAKELEY,*†LÉANDRA KING,* AND PETER R. WILTON*
Genetic variation among loci in the genomes of diploid biparental organisms is the result of mutation and genetic transmission through the genealogy, or population pedigree, of the species. We explore the consequences of this for patterns of variation at unlinked loci for two kinds of demographic events: the occurrence of a very large family or a strong selective sweep that occurred in the recent past. The results indicate that only rather extreme versions of such events can be expected to structure population pedigrees in such a way that unlinked loci will show deviations from the standard predictions of population genetics, which average over population pedigrees. The results also suggest that large samples of individuals and loci increase the chance of picking up signatures of these events, and that very large families may have a unique signature in terms of sample distributions of mutant alleles.
The degree to which a sample may be considered representative of a population is a fundamental question in any application of statistics. In the complicated world of evolutionary and population genetics, where it is sometimes not even clear which aspects of ancestry or data should be modeled as random processes, questions of this sort
__________________
* Department of Organismic and Evolutionary Biology, Harvard University, Cambridge, MA 02138. †To whom correspondence should be addressed. Email: wakeley@fas.harvard.edu.
assume greater significance still, and simple mistakes can have drastic effects on inference. These issues are brought to the fore in the field of phylogeography, which was first developed by Avise and colleagues in the 1980s after the introduction of genotyping technologies into evolutionary biology and which takes as its starting point the fact that hierarchical patterns of genetic variation contain information about the locations of populations and species in the past, as well as their relative population sizes and other factors of biological interest (Avise, 2000).
The core debate about randomness in the subsequent development of phylogeography was about whether individual gene genealogies should be treated as outcomes of highly variable random processes, which need to be modeled, or as simple observations from which conclusions about the past may be drawn more or less directly (Knowles and Maddison, 2002; Hey and Machado, 2003; Templeton, 2008, 2009; Nielsen and Beaumont, 2009). There will be cases in which the size and shape of a single gene genealogy contain substantial information about population-level or intraspecific ancestry but, as noted in a recent review (Bloomquist et al., 2010), this debate has come down on the side of modeling. The reasons for this are that gene genealogies are in fact the results of random processes, likely at the population level but certainly at the level of Mendelian genetic transmission, and that it is not known a priori whether a given set of data comes from one of those cases in which gene genealogies are individually informative (Ewens, 1990; Hudson, 1990; Rosenberg and Nordborg, 2002). Although this particular issue may be considered settled, debates about the proper application of random models in phylogeography continue to arise (Lemey et al., 2009; De Maio et al., 2015).
We consider an additional question about the application of random models that has received comparatively little attention either in phylogeography or population genetics. Namely, what is the extent to which genealogies in the family sense—also known as organismal pedigrees (Ball et al., 1990) or population pedigrees (Wakeley et al., 2012)—constrain gene genealogies and thus genetic variation? Two points distinguish this question from the initial core debate about randomness in phylogeography.
First, whereas in phylogeography the focus has been on the undesirable effects of making inferences conditional on a single gene genealogy estimated from data, here it is on the validity of inferences based on standard population-genetic models that average over population pedigrees when in fact there is only one. It turns out that in relatively large well-mixed populations with constant demography over time, the predictions of standard models are generally quite accurate even though they involve this conceptual error (Ball et al., 1990; Wakeley et al., 2012). The second point is that the variation we are interested in here is variation among loci for a set of sampled individuals. Even though the population pedigree
may itself be the outcome of a random process, all loci in the genome share the same pedigree. The population pedigree should thus be considered a given, fixed quantity because peculiarities of genetic variation among loci in the genome may be due to peculiarities in the pedigree.
Work on the effects of population pedigrees began in 1990 with Ball et al. (1990), who made the fundamental observation that standard-model predictions for a single well-mixed population fit the distributions of pairwise measures of diversity among independent loci on a given pedigree surprisingly well. Follow-up work on subdivided populations came to similar conclusions but also illustrated that sampling small numbers of transmission pathways through a pedigree can give results quite different from corresponding standard-model predictions (Wollenberg and Avise, 1998) and that pedigrees can substantially affect the probabilities of gene-tree topologies in isolation-by-distance migration models (Kuo and Avise, 2008). These works used simulations to generate pedigrees and to model genetic transmission within each pedigree.
Chang (1999) explored two key aspects of ancestry within population pedigrees analytically, proving for a population of N individuals that (i) the most recent common ancestor of all present-day individuals in the pedigree sense (i.e., an individual through which all present-day individuals are cousins) will typically be observed at log2 (N) generations in the past, and (ii) by about 1.77 log2 (N) generations in the past, the ancestries of all present-day individuals overlap completely. Underlying these results is the key fact that the number of pedigree ancestors of an individual grows by a factor of two each generation. Rohde et al. (2004) used simulations and analysis of human population structure and history to suggest that our ancestries overlap in these same ways only a few thousand years ago. The log2 (N)-generation timescale for pedigree ancestry is dramatically shorter than the N-generation timescale for common ancestry in the genetic sense (Hudson, 1990), which for humans corresponds to hundreds of thousands of years (e.g., Schiffels and Durbin, 2014).
Subsequent work using both analysis and simulations has emphasized the rapid approach to equilibrium of shared ancestry in pedigrees. Reproductive values of individuals across the population (Fisher, 1930), which are proportional to the probabilities that a genetic lineage sampled randomly today traces back to each individual in a given past generation, reach a stationary distribution on this same log2 (N) timescale (Derrida et al., 2000; Barton and Etheridge, 2011). Correspondingly, deviations from the predictions of standard population-genetic models, in particular those of coalescent theory, are evident for distributions of times to common ancestry within the recent log2 (N) generations but disappear as lineages are traced into the more distant past (Wakeley et al., 2012).
Pedigrees are, of course, a mainstay of medical genetics, where they allow powerful inferences about the genetics of human disease (Thompson, 1975). These are not population pedigrees, which cover entire populations or species for all times, but partial recent pedigrees of sampled individuals. Pedigree analyses of this sort are being applied to a growing number of natural populations, ones for which patterns of reproductive relationship are known, to disentangle the genetics of complex traits and understand patterns and consequences of inbreeding (Pemberton, 2008). Observed partial pedigrees have also been used to make inferences about recent historical demography—for example, the French settlement of Quebec (Moreau et al., 2011)—directly from pedigree shape without genetics.
Population pedigrees have less frequently made their way into the models of population genetics. Beyond the examples above (Ball et al., 1990; Wollenberg and Avise, 1998; Derrida et al., 2000; Kuo and Avise, 2008; Barton and Etheridge, 2011; Wakeley et al., 2012), they have been invoked to study the length distribution of admixture tracts in a descendant population (Liang and Nielsen, 2014) as well as to describe the ways in which ancestors in the pedigree sense are numerous, whereas the genetic ancestors among them are comparatively few (Matsen and Evans, 2008; Gravel and Steel, 2015).
Here, we use simulations to assess the potential for two kinds of demographic events to alter the shape of population pedigrees so dramatically that they have marked signatures on genetic variation across the genome, specifically among independently segregating loci without intralocus recombination. We begin by emphasizing the assumptions of standard population-genetic models, which determine how they should be applied, and the resulting conceptual error involved in using standard models to explain variation across the genome in diploid biparental organisms. The first kind of demographic event we consider is the case of a very large family at some generation in the past. The second is the introduction and sweep through the population of a strongly advantageous mutant allele. In both cases, we ask whether data from unlinked loci will deviate from standard predictions for the same demographies without these special events. We restrict our attention to well-mixed populations. This provides a baseline set of results against which subsequent work (e.g., on geographically structured populations) may be compared.
TWO CONCEPTUALLY DIFFERENT RANDOM EXPERIMENTS
One of the most familiar results of population genetics is the probability there will be j copies of an allele in the next generation given there are currently i copies of it in a population of N individuals,
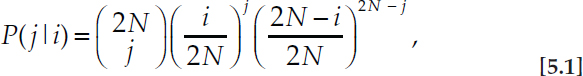
which is derived from the diploid monecious Wright–Fisher model (Fisher, 1930; Wright, 1931) with the possibility of selfing as a result of random mating or random union of gametes (Watterson, 1970). There is no reference to the specific outcome of reproduction among the N individuals (i.e., to what could be called the single-generation pedigree) because Eq. 5.1 is an average over all possible outcomes of reproduction. Using the theory of Markov processes or diffusion approximations for large N, predictions over longer periods of time can be derived from Eq. 5.1 (Ewens, 2004). Such predictions about the probabilities of outcomes of evolution from a given starting point can be compared directly to the results of laboratory experiments, in which allele frequencies are measured but pedigrees typically are not.
The classic experiments of Buri (1956), in which the entire evolutionary process was repeated independently a large number of times,
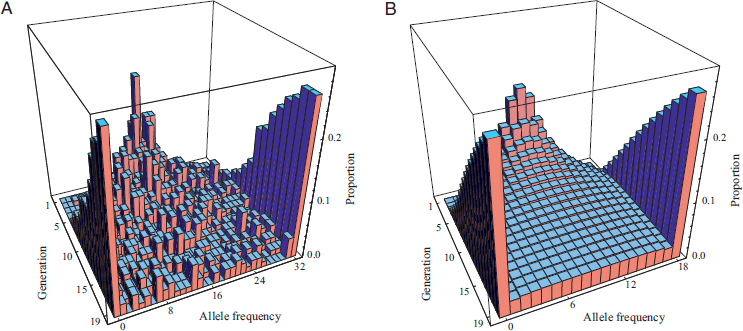
provide the appropriate sort of data. In one experiment, Buri recorded allele frequencies of a selectively neutral mutation (bw75) at the brown (eye-color) locus in Drosophila melanogaster over 19 generations in 107 replicate laboratory populations. Populations were founded each generation by a random sample of eight male and eight female offspring of the adult flies of the previous generation. Every population began with a relative frequency of 0.5, or 16 copies of the mutant allele out of a total of 2N = 32. The results are displayed in Fig. 5.1A, with corresponding predictions providing a fit to the data shown in Fig. 5.1B. Over the course of the 19 generations, each population’s allele frequency drifted randomly. Some populations became fixed for and others lost the bw75 allele. By the end of the experiment, roughly 54% of the populations were monomorphic and the remainder were distributed more or less evenly among the polymorphic allele frequencies.
Now consider another standard population-genetic prediction, in this case for the distribution of the number (K2) of SNP differences between a pair of sequences at a locus,
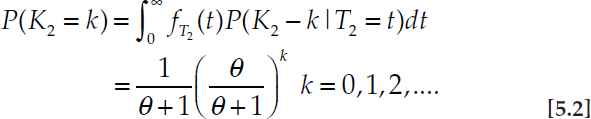
Eq. 5.2 holds under the infinitely many sites mutation model with parameter θ = 4Neu, in which Ne is the coalescent effective population size (Sjödin et al., 2005), and without intralocus recombination (Watterson, 1975). The first line of Eq. 5.2 shows how a typical derivation of this result proceeds by conditioning on the underlying, unknown coalescence time (T2) between the pair of sequences, that is, with T2 ~ Exponential(1) and K2|T2 = t ~ Poisson(θt). Because the distribution of T2 is obtained starting from the single-generation probability of coalescence which, like Eq. 5.1, is an average over the process of reproduction, the exponential distribution of T2 is an average over the long-term process of reproduction, or over the population pedigree.
Thus, Eq. 5.2 is an equilibrium result that captures the balance between genetic drift and mutation. It predicts what would be observed if two sequences at a locus were sampled at random from such a population. For most organisms, it is not feasible to perform long-term experiments analogous to those of Buri (1956) to create multiple replicate populations for comparison with Eq. 5.2 or other similar predictions. Instead, these predictions are applied to datasets of multiple loci genotyped in the same set of individuals sampled from a single population (or species). Although this type of application is conceptually wrong because the loci share the pedi-
gree, standard-model predictions match simulated pedigree-coalescent data surprisingly well for large, well-mixed populations (Ball et al., 1990; Wakeley et al., 2012).
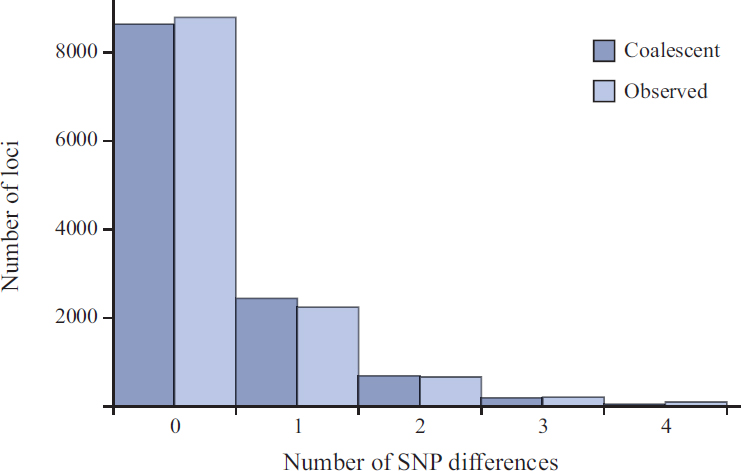
An example of this standard type of application is given in table 3 of Sachidanandam et al. (2001), which gives the numbers of loci showing zero, one, two, three, or four SNP differences between pairs of sequences at 12,027 loci ranging in length between 400–700 bp in one of the first major SNP-typing studies in humans. Fig. 5.2 plots these data alongside the corresponding predictions from Eq. 5.2. The coalescent model in Fig. 5.2 and the more sophisticated one in table 3 of Sachidanandam et al. (2001), which takes variation in the lengths of loci and the mutational opportunity among loci into account, can both be rejected using a χ2 test. However, it is not clear that this is due to the pedigree, because humans deviate from the assumptions of standard models in other ways (e.g., growth and population structure).
This standard type of application is assumed to be appropriate for loci that are far enough apart in the genome (on different chromosomes in the extreme case) that they assort essentially independently into gametes. Whether or not they assort independently, Eq. 5.2 is not the correct predic-
tion because Eq. 5.2 involves the implicit assumption that the loci do not share the same pedigree. Loci on different chromosomes are independent, but only conditional on the population pedigree. They might collectively show patterns of times to common ancestry or genetic variation that depend on the specific features of the pedigree.
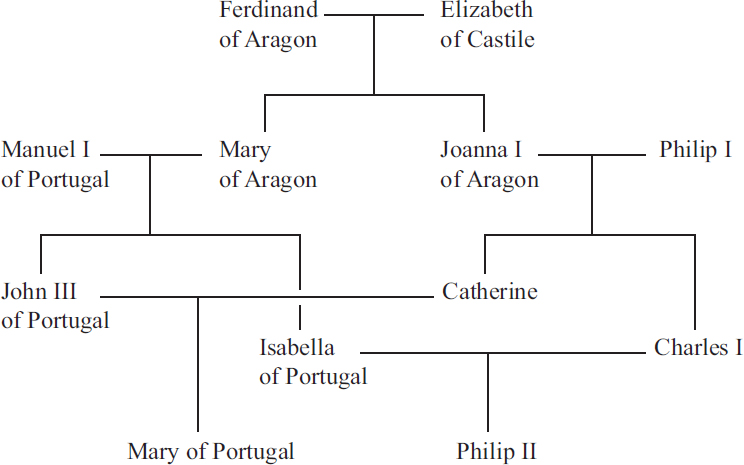
In fact, the population pedigree completely determines the probabilities of coalescence in any given generation. Fig. 5.3 shows a four-generation piece of the Spanish Hapsburg royal family from a study of inbreeding in the demise of this ruling family line (Alvarez G et al., 2009). Two alleles, one sampled from Mary of Portugal and one sampled from Philip II, would have zero chance of coalescing in the previous two generations, then a substantial probability of coalescing in past generation 3. Thus, the probability of coalescence is not constant over time, as assumed in standard models, and it may not be clear whether it should ever be equal to familiar result P(coal) ≈ 1/(2Ne) even under the idealized diploid, monecious Wright–Fisher model.
Simulations for a variety of models of reproduction show that standard predictions, such as the exponential distribution of T2, are robust to the presences of the shared population pedigree (Ball et al., 1990; Wakeley
et al., 2012). One exception is when the sample being analyzed has recent common pedigree ancestors, in which case predictions such as Eq. 5.2 are drastically wrong. However, it is unlikely to sample related individuals from a large population, so the main effect of the shared population pedigree is to make coalescence impossible (as in Fig. 5.3) until the ancestries of the sampled individuals overlap (Wakeley et al., 2012).
In what follows, we consider the effects of extreme pedigrees on distributions of time to coalescence, pairwise SNP differences, and frequencies of mutations in a sample. The results are from simulations of population pedigrees and coalescence of alleles from sampled individuals within pedigrees. In large part, our findings provide further support of the robustness of standard models that average over pedigrees but also suggest that some demographic events might leave signatures detectable in large samples of loci and individuals.
PEDIGREE EFFECTS OF A LARGE FAMILY
An extensive recent study of human Y-chromosome variation (Balaresque et al., 2015) identified a number of descent clusters present at unusually high frequencies in Asia and inferred that these represent the genetic heritages of a corresponding number of highly reproductively successful men. It was surmised that one of these men was Genghis Khan, who had previously been suggested as the source of a particular Y-chromosome haplotype found at ~8% frequency across a large region of Asia (Zerjal et al., 2003). The larger sample and finer-scale geographical sampling seemed to uphold this finding and further revealed substantially higher frequencies of this haplotype in some local populations in central Asia, with one from Middle Kyrgyzstan, for example, showing a sample frequency of ~68% (Balaresque et al., 2015).
We consider a hypothetical, extreme scenario based on these inferences about Genghis Khan, in which a single man has a very large number of children at generation 28 in the past. Details of our simulations are given in Materials and Methods. We present results for distributions of pairwise coalescence times among autosomal loci in a pair of individuals, assuming independent assortment but conditional on a single shared population pedigree. We also present results for pairwise SNP differences and site frequencies, for which we use θ = 0.5 per locus and assume the infinitely many sites mutation model without intralocus recombination (Watterson, 1975). Considering the observed population heterozygosity of about 7 × 10⁻⁴ in humans (e.g., see Palamara et al., 2015), θ = 0.5 corresponds to loci of length ~700 bp, and an average number of SNP differences between pairs of sequences equal to 0.5. Note that the per-site recombination rate is of a similar order of magnitude as the per-site mutation rate in humans (Reich
et al., 2002) and in many other organisms (see table 4.1 in Lynch, 2007). Modeling these relatively short loci, which should have on average only about 0.5 recombination events between a pair of sequences, is one way to minimize the consequences of assuming no intralocus recombination.
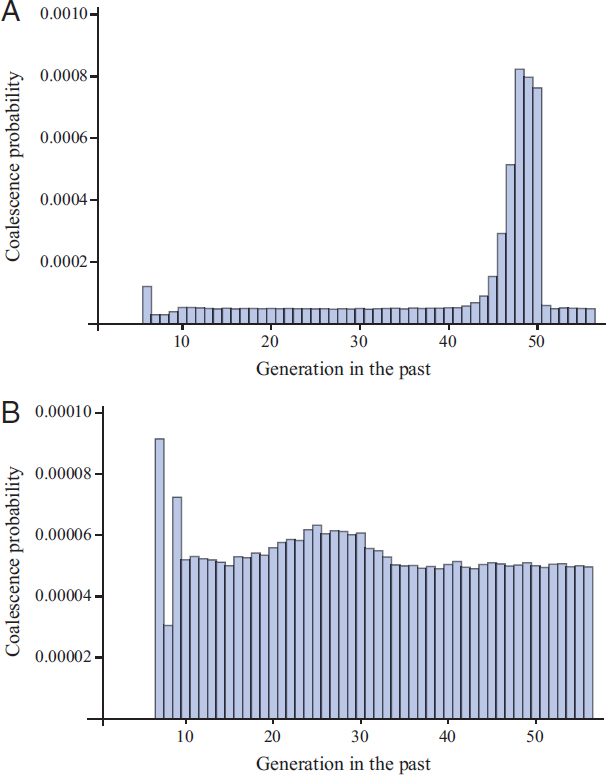
Fig. 5.4A shows the probabilities of pairwise coalescence, or the proportion of loci expected to coalesce, in each of the past 40 generations
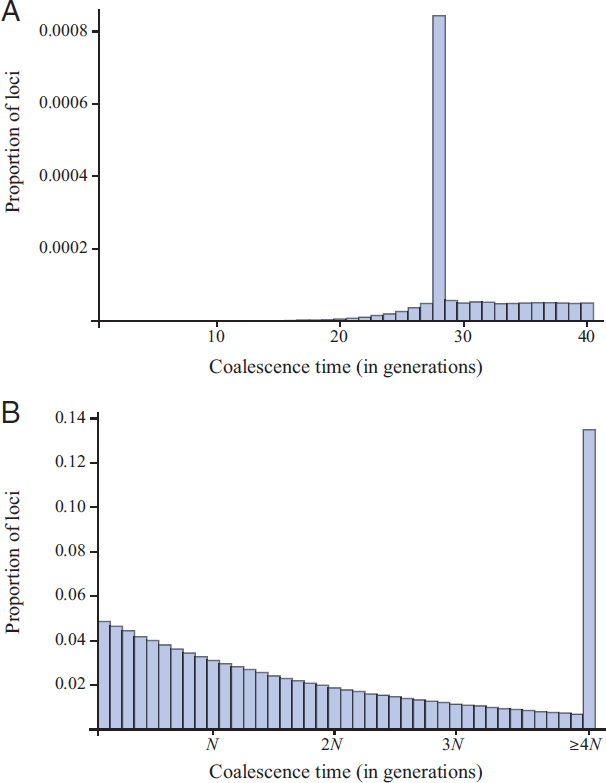
assuming “Genghis Khan’s” children comprise 8% of the population. There is very little coalescence in the most recent generations, 1–20, due the strong population growth assumed, but there would still be little coalescence during this time in a population of constant size (here N = 10,000). In generation 28, there is a spike in the chance of coalescence. Its height is small, though, because coalescence occurs only when both lineages are among that 8% of the population, both trace back to the father, and they descend from the same allele. Thus, the increase in probability is only 0.082 × (1/2)2 × 1/2 = 0.0008.
Looking at the same scenario over the much longer time frame relevant to coalescence, in Fig. 5.4B, this extra mass of coalescence probability has no discernible effect on recent coalescence (leftmost bin in Fig. 5.4B) now corresponding to coalescence within the recent 0.1N, or 1,000, generations. In sum, we cannot expect to observe the effects of even this fairly dramatic demographic event in a large sample of loci from a pair of individuals, which would amount to taking many random draws from the distribution in Fig. 5.4. Fig. 5.4B is indistinguishable from the simple coalescent predictions from an exponential distribution with mean 1 corresponding to 2N generations.
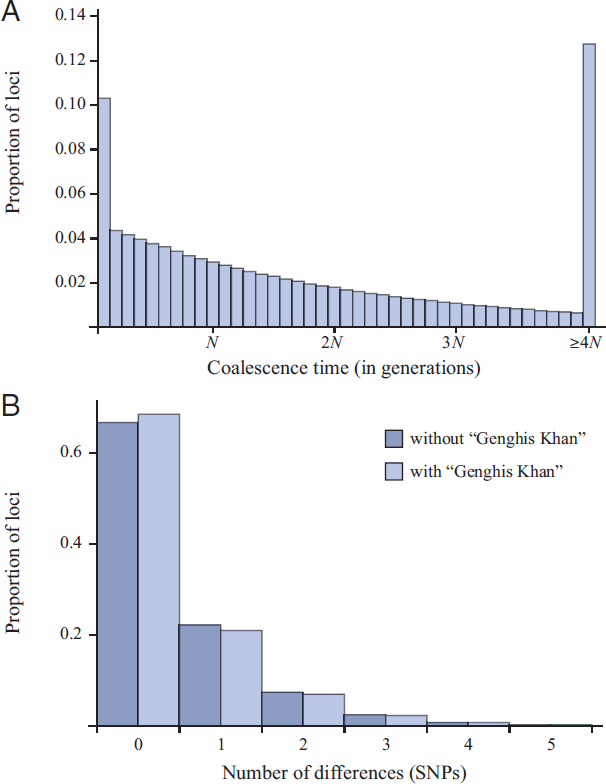
The situation changes when the children make up 68% of the population. Fig. 5.5A shows a dramatic effect even on the overall distribution of coalescence times. In this case the increase in the chance of coalescence is 0.682/23 = 0.0578, which roughly doubles the proportion of loci expected to coalesce within the first 0.1N, or 1,000, generations. We might expect this increase to be observable in data, for example, in pairwise SNP differences. However, for the relatively short (~700 bp or θ = 0.5) loci we model here, a fairly large proportion of loci should be monomorphic even if their coalescence times are greater than 0.1N generations. Fig. 5.5B compares a simulated distribution of pairwise SNP differences among loci on a single population pedigree for this case to a simulated distribution for a pedigree with the same demography but without any special demographic event. The distributions differ, but it would take more than 8,300 loci to distinguish between them at the 1% level using a χ2 homogeneity test.
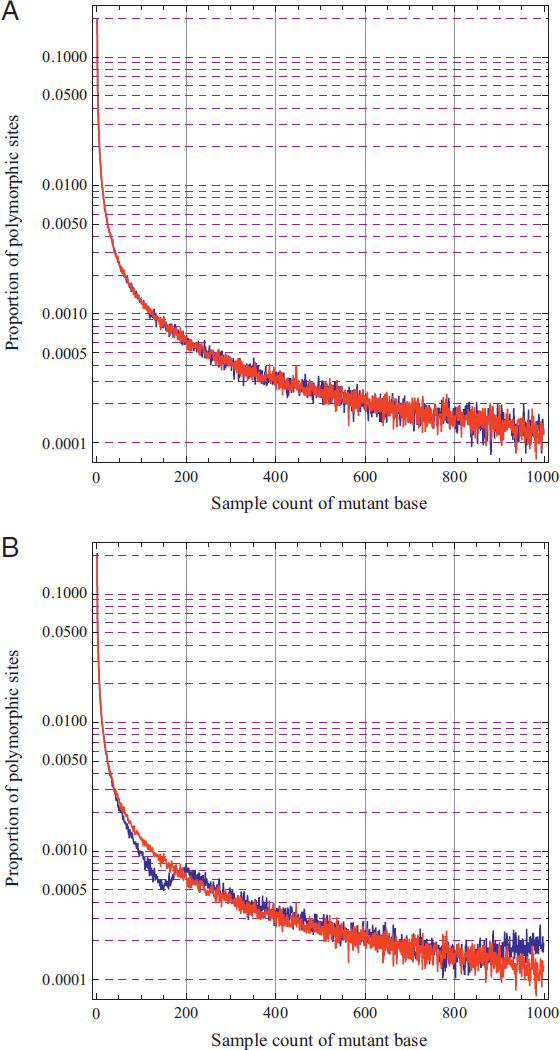
We also investigated the possibility there would be greater power to detect the pedigree effects of a large family using site-frequency data. We again simulated ancestries of very many loci starting from the same set of individuals sampled without replacement from the current generation, only now we sampled 1,000 individuals and followed 1,000 genetic lineages, creating pseudodata for each locus then counting the number of copies of each mutant in the sample. Fig. 5.6 shows these “unfolded” site-frequency distributions (Akashi, 1999) for the case in which the children comprise 8% of the population (Fig. 5.6A) and in which they comprise 68% of the population (Fig. 5.6B).
When the children make up 8% of the population, there seems to be no discernible effect on site frequencies, but a striking pattern is observed when the children make up 68% of the population. Differences appear in two parts of the distribution. First, there is a deficit of polymorphic sites at which the mutant is found in about 50–200 copies in the sample. The
explanation for this is that many potential branches in the gene genealogy that would have had between roughly 50 and 200 descendants in the sample will be collapsed to zero when bunches of lineages coalesce in “Genghis Khan.” Without a large family, these branches would have positive lengths, and mutations on them would produce polymorphisms in these site-frequency classes. In the simulations for Fig. 5.6B, an average of 934 lineages remained by generation 27 in the past, so each of the two clusters of coalescent events in “Genghis Khan” involve an average of 943 × 0.68/4 ≈ 159 ancestral lineages. Thus, there is a deficit of branches with roughly 1,000 − 943 = 66 descendants up to the size of these two clusters (159 lineages each). These calculations are based on average numbers of lineages, whereas the simulations in Fig. 5.6 include a great deal of variation in each of these numbers and in patterns of coalescence.
The second effect on the site-frequency distribution is an increase in the number of high-frequency derived mutations. Similar patterns have been ascribed to positive selection (Fay and Wu, 2000), but U-shaped distributions of allele frequencies are observed within local populations subject to migration (Wright, 1931) and are not unexpected when multiple-merger coalescent events can occur (Sargsyan and Wakeley, 2008). We do not have a quantitative explanation of this pattern in Fig. 5.6B, but, roughly speaking, it is due to the fact that both of the large clusters may be on one side of the root of the gene genealogy. As described in Materials and Methods, we verified the overall pattern of site frequencies for this case using a modified set of standard coalescent simulations.
PEDIGREE EFFECTS OF A SELECTIVE SWEEP
We also investigated the potential of a strong selective sweep to structure the population pedigree in such a way that a genomewide deviation from the predictions of the standard neutral model would be observed. Whereas the genetic effects of selective sweeps are known to be dramatic for loci linked to a locus under selection (Smith and Haigh, 1974; Kaplan et al., 1989; Kim and Stephan, 2002), it is generally understood that unlinked loci are not affected by sweeps. In fact, there is some small effect of a selective sweep even on unlinked loci, which may be attributed to a transient increase of the variance of offspring numbers during a selective sweep (Robertson, 1961; Barton, 1995). To investigate this effect of a sweep as mediated by the population pedigree, we simulated very strong selective sweeps beginning at generation 50 in the past in a population of constant size N = 10,000, with additive fitness effects of two alleles (Materials and Methods).
The pedigree effects of a sweep may be likened to those of a large family, with the family now defined in genetic terms and where the event
unfolds over a larger number near here of generations. Another conceptually similar phenomenon is cultural inheritance of fertility, or correlation in offspring numbers, across generations, evidence for which has been inferred from the shapes of human mitochondrial gene genealogies (Blum et al., 2006).
Fig. 5.7 shows probabilities of pairwise coalescence, or proportion of loci expected to coalesce, in each of the past 56 generations assuming a selection coefficient of s = 10 (Fig. 5.7A) or s = 1 (Fig. 5.7B). When selection is extremely strong, such that individuals homozygous for the advantageous mutant allele have an average of 11 offspring for every one offspring of a wild-type homozygote (Fig. 5.7A), there is a sharp peak in the distribution of coalescence times around the time of the sweep. However, the overall effect on the proportion of loci expected to coalesce during the event is only about four times greater than for our “Genghis Khan” whose children comprise 8% of the population (Fig. 5.4A), and analogously we may infer that even this exceedingly strong selective sweep should have little impact on patterns of genetic variation.
Not surprisingly, the effects of lesser sweeps are very subtle. Fig. 5.7B shows the effect of a sweep with s = 1 on probabilities of pairwise coalescence, plotted over the same number of generations as Fig. 5.7A but with a notably different scale on the vertical axis. In this case, where homozygotes for the advantageous mutant allele have an average of two offspring for every one offspring of a wild-type homozygote, there is just a small bump in the proportion of loci expected to coalesce during the sweep, here centered around generation 26.
In contrast to the large-family simulations that included population growth, and therefore showed little coalescence in the first ~20 generations, both panels in Fig. 5.7 illustrate the effect of recent pedigree structure on probabilities of coalescence. In the most recent ~log2 (N) generations,
here about 13 generations, probabilities of coalescence depend strongly on the ancestries of the two sampled individuals. In the case of Fig. 5.7A, these ancestries did not overlap until generation 6 in the past and in the case of Fig. 5.7B they did not overlap until generation 7 in the past. Tracing farther back, in both cases, the probability then equilibrates and stays near 1/(2N), which here is equal to 0.00005 because N = 10,000.
Fig. 5.8 provides a more detailed view of the pedigree effects of strong selective sweeps. Ten replicate populations, each with a sweep beginning in generation 50 in the past, were simulated. The probabilities of both coalescence for a pair of lineages and the frequency of the advantageous allele were computed for every generation in the pedigree. These two quantities are shown in Fig. 5.8 with thicker and thinner lines, respectively, and using different colors for each of the 10 replicates. Fig. 5.8A shows that sweeps with s = 10 occur very quickly, in about 15 generations, whereas the sweeps in Fig. 5.8B for s = 1 take longer, about 50 generations. Coalescence probabilities for the sweeps in both panels display the relatively great variation over time and among pedigrees in the recent ~log2 (N) ≈ 13 generations as well as the characteristic settling near 1/(2N) = 0.00005 in the more distant past.
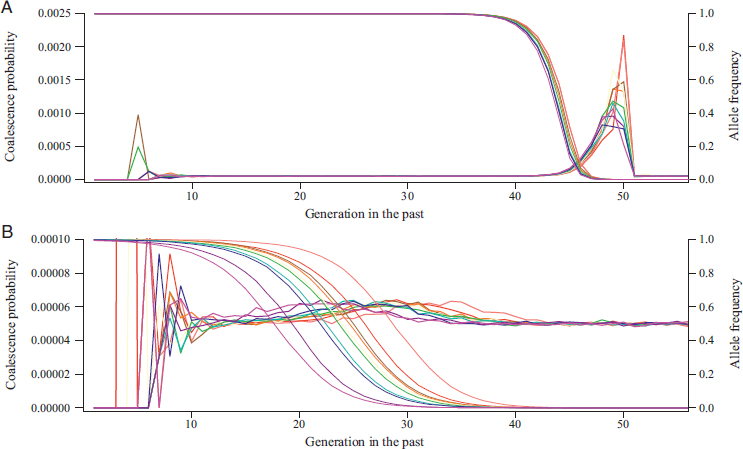
A greater level of variation in the timing of the 10 sweeps is visible in Fig. 5.8B, with s = 1, than in Fig. 5.8A, with s = 10. Fig. 5.8B also shows that differences in the timing of the increase in coalescence probability track differences in the timing of sweeps (distinguished by color). Variation in the timing of a sweep is attributable to the time it takes the favored allele to escape the effects of genetic drift when it is in low copy number in the population. Especially in Fig. 5.8A, it can be seen that coalescence tends to happen earlier in the sweep, when the favored allele is in low frequency (Pennings and Hermisson, 2006). Finally, there is greater variation in the additional density of coalescence events among sweeps in Fig. 5.8A (s = 10) than in Fig. 5.8B (s = 1). We interpret this as a consequence of sweeps happening so quickly when s = 10 that coalescences depend strongly on the details of the initial increase of the favored allele.
CONCLUSIONS
We have explored two ways in which demographic events within populations may alter the structure of organismal genealogies, or population pedigrees, so as to produce unexpected patterns of variation across genomes. Our simulations of the effects of recent very large families and strong selective sweeps on variation among unlinked loci have primarily yielded negative results. Standard population-genetic predictions that average over pedigrees, such as P(K2 = k) in Eq. 5.2, seem quite robust even to fairly extreme versions of these events. However, we have also shown that frequencies of mutant alleles across the genome in very large samples of individuals provide more sensitive indicators of extreme demographic events, compared with simpler measures such as pairwise sequence differences. Following Keinan and Clark (2012), large samples have been of particular interest in human population genetics. For example, the recent update of the 1000 Genomes Project presented site frequencies in a sample of 2,504 people at more than 80 million SNPs (The 1000 Genome Project Consortium, 2015), so the potential is there to generate similar data for more geographically localized populations and for species other than humans to investigate the detailed effects of population pedigrees.
Finally, the genetic signatures of recent demographic events that we have uncovered apply marginally to single sites—they do not take linkage and recombination into account—and we note that the pedigree effects of such events might be relatively strong for multilocus measures such as the length distribution of blocks of identity by descent (Chapman and Thompson, 2003; Palamara et al., 2012).
MATERIALS AND METHODS
Simulations of Population Pedigrees and Coalescence
We simulated pedigrees according to the diploid, two-sex version of the Wright–Fisher model of random mating. That is, each individual in the next generation (forward in time) has a mother and a father chosen uniformly at random from the female and male adults of the current generation. Given a pedigree, neutral genetic loci are transmitted according to Mendel’s laws. Importantly, multiple loci are independent conditional on the pedigree. For each simulated population pedigree, a sample of individuals is taken at random without replacement from the current population, which is generation 0 in the model. A single genetic lineage is followed backward in time from each sampled individual according to Mendel’s law of independent segregation (i.e., going with 50% chance to the mother or the father in each generation). When two lineages trace back to the same individual, they coalesce with probability 1/2 and remain distinct in that individual with probability 1/2. For each pedigree and sample, we simulated large numbers of loci that were assumed also to follow Mendel’s law of independent assortment. The programs used in this research may be downloaded from wakeleylab.oeb.harvard.edu/resources.
Pedigree Simulations Coalescent with a Large Family
We set the generation in which there was a large family to be generation 28 in the past using the fact that Genghis Khan lived about 800 years ago and a current estimate of 29 years as the average length of one human generation (Fenner, 2005). We assume that the children of our “Genghis Khan” comprised either 8% or 68% of the population, and that for the next 27 generations the population grew at rate 0.3 per generation (Keinan and Clark, 2012), which is similar to estimates of growth for descent clusters in Balaresque et al. (2015). The results we present do not depend strongly on this growth because, either way, generation 28 in the past is very recent compared with average coalescence time. We assume an ancestral population size of N = 10,000, and in every generation there are equal numbers of males and females in the population. Pedigree simulations were as above, except in generation 27 in the past. Depending on the case, in this generation, 27, either 8% or 68% of individuals have our hypothetical “Genghis Khan” as their father. The mothers of these individuals are chosen uniformly at random as in every other generation. When considering sample frequencies of mutations, or site frequencies, we sampled 1,000 individuals. With multiple lineages, multiple coalescent events can occur in single generations, either in different individuals or within single individuals. These multiple mergers are especially important in generation 28 in the
past, when large numbers of lineages may trace back to “Genghis Khan.” If k lineages trace back to a single individual, each of them has chance 1/2 of descending from each of the two alleles in that individual. Therefore, a binomially distributed number of lineages, with parameters k and 1/2, will trace back to one allele and the remainder will trace back to the other allele in that parent, creating two clusters of coalescence.
In simulating genetic data, we assumed that all mutations are selectively neutral and that each mutation produces a unique polymorphic site (Watterson, 1975). For each gene genealogy we placed a Poisson number of mutations randomly on the branches in the standard way to create pseudodata (Hudson, 2002), with the modification that our gene genealogies are not necessarily simple bifurcating trees. For a gene genealogy with total length t generations, the number of mutations would be Poisson(θt/ (4N)), where N is the ancestral population size, which we set to 10,000. We assumed the mutant state could be distinguished from the ancestral state at each polymorphic site when compiling the site-frequency distribution and simply counted the number of copies of the mutant in the sample of size 1,000. To verify that the site-frequency distribution shown in Fig. 5.6B, with a deficit of mutant counts around 150 and an increase above about 850, we performed simulations in which a sample of size 1,000 was subject to two rounds of binomial sampling. First, the number of lineages that trace back to “Genghis Khan” was given by a random draw from a binomial distribution with parameters 1,000 lineages and 0.68 × 0.5 for the probability of being among the children and tracing back to the father. All of these (k) lineages then coalesce into two groups, of sizes k1 and k2, one for each of the two chromosomes in the father. We modeled this with a second random draw as described above, that is k1 ~ binomial(k, 1/2), and k2 = k – k1. We then generated a standard coalescent tree (Hudson, 2002) with 1,000 – k + 2 tips, where two tips had k1 and k2 descendants in the sample instead of the usual 1 descendant. These simulations assumed that the large-family event occurred instantaneously at time 0 and did not account for population growth, but the results were extremely similar to those in Fig. 5.6B.
Pedigree-Coalescent Simulations of Strong Selective Sweeps
We assumed that a selectively favored allele A was introduced as a mutant in a single copy in the population in generation 50 in the past, into a background of wild-type alleles a. The relative fitnesses of the three diploid genotypes were AA: 1 + s, Aa: 1 + s/2, and aa: 1. We conditioned on allele A not going extinct, by restarting the simulation if A was lost. Pedigrees were simulated from generation 50 onward by sampling parents nonuniformly, in proportion to their relative fitnesses. The population
size was held constant at N = 10,000. Here, starting with a single pair of sampled individuals, we computed probabilities of coalescence in each generation in the past numerically (e.g., see equation 3 in Wakeley et al., 2012) rather than by simulating large numbers of independent loci. In addition, for each simulated pedigree with a sweep, we recorded the numbers of copies of allele A present in each generation.
ACKNOWLEDGMENTS
We thank Noah Rosenberg for helpful comments and discussion.


