
3
What Can I Learn from My Students’ Work?
Changes you are making in your instruction will give you many more natural opportunities to check on your students’ progress. But what can you actually learn from these opportunities? What concrete evidence can these new kinds of assessments give you about your students’ thinking and what they have learned?
The examples we’ve looked at illustrate important elements that assessments need to have if they are to measure three-dimensional science learning. In the next two chapters we’ll explore examples that show different ways to use these ideas. In this chapter we’ll look at how activities that haven’t traditionally been seen as assessments can be mined for valuable information. The first example, “Behavior of Air,” shows how a teacher can use a class discussion as a way to assess what students understand. The second example, “Measuring Silkworms,” illustrates new ways to score student work products and interpret the evidence of student learning they provide. We’ll also look at some other ideas for recording assessment results and using them to support your instruction.
USING A FAMILIAR ACTIVITY AS AN ASSESSMENT
In this example designed for middle school students, sixth graders in the midst of a unit on the nature of matter are given time to discuss what they are learning. The teacher uses the discussion itself for both instructional and assessment purposes.
EXAMPLE 3 Behavior of Air
Level Middle school
Assesses PRACTICES—Developing and using models; Engaging in argument from evidence
CROSSCUTTING CONCEPTS—Energy and matter: Flows, cycles, and conservation; Systems and system models
DISCIPLINARY CORE IDEAS—Matter and its interactions [PS1]
This example illustrates a way to structure an activity that is part of classroom instruction almost every day—discussion—so that it can provide answers to specific questions about what students are learning. It shows how a teacher can use students’ questions and misconceptions to guide the discussion.
On this day, the students are learning about a particular kind of matter: air. They draw models to explain what they observe about the behavior of air when it is pushed into a syringe. Then the teacher uses the students’ discussion of the models to learn what they understand about the nature of air and what ideas need to be explored further. The discussion also supports the students in collaboratively working out answers to questions that are still not clear to them.
The activity focuses students’ attention on the idea that air is made up of particles. They come to realize both that there must be empty space between moving particles and that this space allows the particles to move—either to become more densely packed or to spread apart. They develop models to explore their understanding of how a type of matter—air—behaves and to explain what they observe. Crosscutting concepts associated with energy flows and systems come into play as the students work out their explanations.
Like the two examples we saw in Chapter 2, this learning activity is embedded in a unit—in this case the assessment is not the tasks the students perform but a discussion the teacher uses to collect information about their thinking.
The teacher already knows, from earlier activities, that the students are having trouble grasping the idea that there is empty space between the molecules of air. But the students have also learned in previous lessons about several important ideas they will draw on for this activity:
- They have defined matter as anything that takes up space and has mass.
- They have concluded that gases—including air—are matter.
- They have determined through investigation that more air can be added to a container even when it already seems full and that air can be subtracted from a container—both without changing the container’s size.
The students still have questions about how much more air can be forced into a space that already seems to be full. They have learned from earlier teacher-led class discussions that simply stating that the gas changes “density” does not solve the problem—it just gives it a name. They recognize that they need to figure out what actually makes it possible for differing amounts of gas (air) to expand or contract to occupy the same space. The teacher has guided them to recognize that understanding this will help them to explain what happens to any type of matter when it spreads out to occupy more space.
The students are given an empty syringe and asked to gradually pull the plunger in and out of it to explore the air pressure. They notice the pressure against their fingers when they push the plunger in and the resistance as they pull the plunger out. They find that little or no air escapes when they manipulate the plunger. They are asked to work in small groups to develop a model to explain what happens to the air so that the same amount of it can occupy the syringe regardless of the volume of space available.
The groups are asked to develop models to represent the air within the syringe in two different positions (see Figure 3-1).
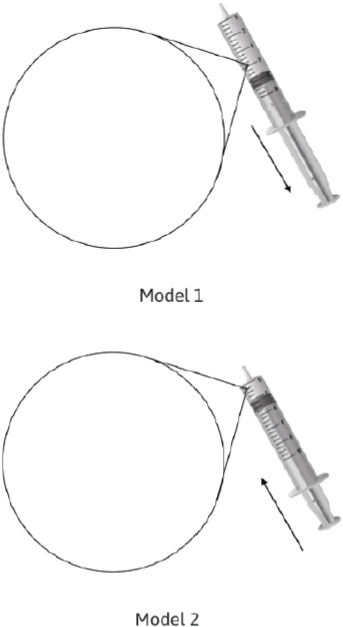
SOURCE: Adapted from Krajcik et al. (2013). Reprinted with permission.
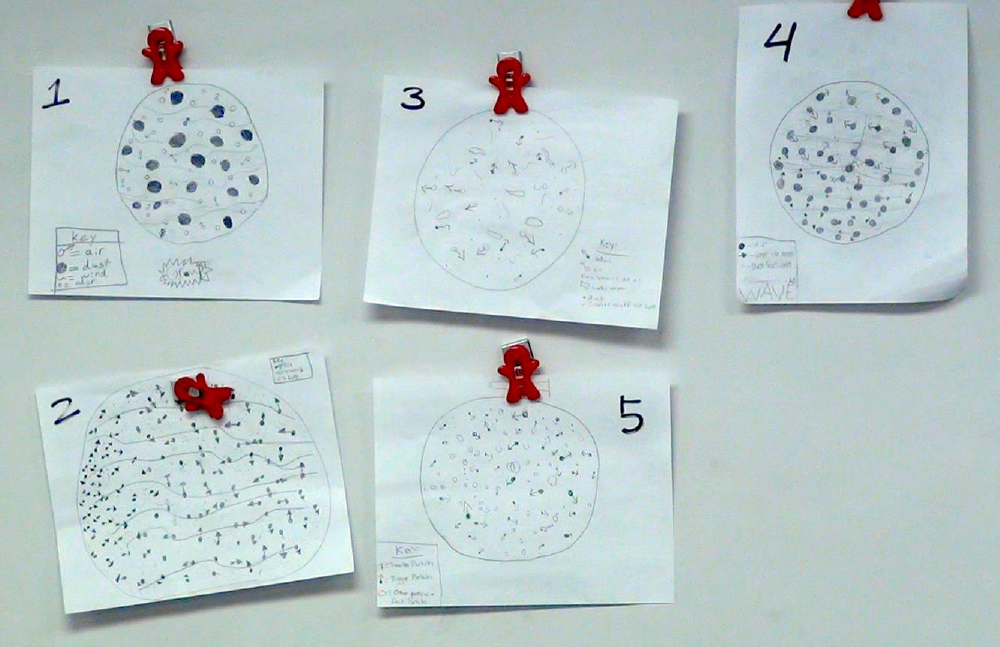
This modeling activity itself is not the assessment task, though. The assessment is the class discussion in which students compare their models: it allows the teacher to diagnose the students’ understanding. Figure 3-2 shows the models that five different groups of students produced to represent the air in the syringe in its first position (with the plunger partway out).
The teacher asks the class to discuss the different models with two goals in mind:
- to explain what they observed when they manipulated the syringe, and
- to try to reach consensus on which model best shows how air behaves.
The class has agreed that there should be “air particles” (shown in each of their models as dark dots) and that the particles are moving (shown in some models by the arrows attached to the dots).
Most of these five models represent air as a mixture of different kinds of matter, including air, odor, dust, and “other particles.” What is not consistent across the models is what is represented as being between the particles: Models 1 and 2 show
SOURCE: Reiser (2013). Reprinted with permission.
“wind” as the force moving the air particles; Models 3, 4, and 5 appear to show empty space between the particles.
Class Discussion as an Assessment
Exactly what, if anything, is in between the air particles emerges as a point of contention as the students discuss their models. The class agrees that the model should include air particles shown with arrows to demonstrate that the particles “are coming out in different directions,” so the teacher draws several particles with arrows and asks what to put next into the model. A transcription of part of the actual classroom discussion is shown in Box 3-1.
The teacher can tell from the way the students have drawn their models that their understanding is not complete. The students have agreed that all matter, including gas, is made of particles that are moving, but many of the students do not understand what is in between these moving particles. Several students indicate that they think air is between the air particles because “air is everywhere,” and some assert that the particles are all touching. Other students disagree that air can be between the particles or that air particles are touching, although they do not yet assert that there is empty space between the particles.
Using the Results
This is an example of a formative assessment whose purpose is to help the teacher decide what instructional steps to take to support the students. The students’ argument about the models plays two roles; it is an opportunity for:
- the students to defend or challenge their existing ideas, and
- the teacher to observe what the students are thinking, and to decide whether she needs to pursue the issue of what is between the particles of air.
It’s also important to note that the discussion is not an accident; it was carefully structured in advance so that the teacher could gain the information she needed. In other words, the teacher does not simply bring up the issue of what is between the particles out of the blue. Rather, she uses what she has learned from the models the students created to direct the discussion. The teacher had anticipated that the empty space between particles would come up and was prepared to take advantage of that opportunity. Hearing the disagreement that emerges from the discussion helps her shape a question that will move the students forward.
The discussion gives the teacher insights into what the students were thinking that she couldn’t learn from their written (and drawn) responses to a task. Drawing the models helps the students clarify their thinking: they refine their models in response to discussion that reveals problems with them, and they use the experience of drawing and revising their models to develop increasingly clear explanations of what they have observed.

The teacher also has different kinds of evidence about what the students are thinking. She hears their discussions and questions as they develop the models. She sees their first attempts at drawing the models and hears their discussion of the differences among them. Then she sees how they revise their models based on those discussions. This combination of evidence shows the teacher how the students have used the practices of model-making and collaborative discussion of interpretations to solve their problem, as well as what they have understood about the nature of matter.
Key Idea
![]() The teacher wants to know exactly what students understand at a point in time so she can use the information to shape the rest of the lesson and maximize what students can learn.
The teacher wants to know exactly what students understand at a point in time so she can use the information to shape the rest of the lesson and maximize what students can learn.
![]() The assessment activity is one that would have been useful in any case, but the teacher has structured it to provide specific answers to her questions.
The assessment activity is one that would have been useful in any case, but the teacher has structured it to provide specific answers to her questions.
![]() The students need not perceive this activity as an assessment: its purpose is not summative (to grade them) but formative (to help the teacher meet their needs).
The students need not perceive this activity as an assessment: its purpose is not summative (to grade them) but formative (to help the teacher meet their needs).
![]() This assessment is not designed to provide scorable results that might be reported beyond the classroom.
This assessment is not designed to provide scorable results that might be reported beyond the classroom.
NEW WAYS TO SCORE AND EVALUATE STUDENT WORK
Using activities such as class discussions for assessment purposes requires new ways to evaluate student work. You are probably very used to learning things from class discussions and many other activities. If you want to use an activity to draw conclusions about what students know and can do, however, you’ll need a structure for evaluating what your students do in response to specific tasks and determining what evidence their responses give you. You would be unlikely to score or grade a discussion, but you can structure it to help you answer very specific questions you have about your students’ progress, for example.
In fact, interpretation of results is a core element of assessment, and it should be a part of the assessment design. The key to drawing valid conclusions about what your students have learned is to plan both the task and the method for scoring it based on an explicit description of what they could be expected to do in response to the task. This sort of description, in turn, should be based on clear ideas about long-term objectives—not only for the unit but also for how learning of the subject matter will develop across years.
A plan for interpreting the results—a rubric or written framework that outlines the expectations—will help you develop assessments or ways to use
activities you already include in your instruction to provide assessment evidence. This rubric can also help students themselves recognize how far they have progressed and where they still have work to do. The way the students’ responses are evaluated will depend on why the information is needed. As we saw with “Behavior of Air,” if information is needed for formative purposes the evaluation doesn’t necessarily need to be formally structured. But other kinds of assessments can be designed to provide more structured results.
You may be using a rubric that has been developed along with the assessment task, and it will help you think concretely about what kinds of information you might get from the task. If you are developing a rubric yourself, for an activity you plan to use as an assessment, the process of describing possible responses will help you think about what, exactly, you are looking for. As you start to describe the results you are seeking and how students can demonstrate the knowledge and understanding you want to measure, you may need to go back and refine the task.
“Measuring Silkworms” illustrates how a rubric serves the design of the assessment.
EXAMPLE 4 Measuring Silkworms
Level Grade 3
Assesses PRACTICES—Asking questions; Planning and carrying out investigations; Analyzing and interpreting data; Using mathematics; Constructing explanations; Engaging in argument from evidence; Communicating information
CROSSCUTTING CONCEPTS—Patterns
DISCIPLINARY CORE IDEAS—Structure and function: Organisms have macroscopic structures that allow for growth [LS1.A]; Growth and development of organisms: Organisms have unique and diverse life cycles [LS1.B]
This example illustrates how an assessment that is carefully designed together with its scoring rubric can help a teacher gain deep insights into students’ understanding. Sample student responses are used in the rubric.
Third graders do this activity as part of a unit on the growth of silkworm larvae. The interactive activity is both an opportunity for the students to learn about the distinction between an individual organism’s growth and growth patterns across a population and an opportunity for their teacher to assess their learning.
As the class period begins, the students have already been working with the silkworms and identified some questions they want to answer. On this day, they measure the silkworm larvae and record the data. The teacher asks the students to think of ways they might display the measurements they have taken that will communicate what they are noticing about the larval growth that day. What is assessed is the way the students decide to display their data: their choices about this tell the teacher what they have understood about how to use techniques for displaying data to interpret what they have observed. The teacher supports the students in developing the kinds of thinking the activity is designed to teach about data display.
The teacher has some guidance in what to expect from the students: the researchers and teachers who designed this unit provided descriptions of six levels of performance that might be expected from third-grade students (shown in Table 3-1). This kind of table is one way to structure a scoring rubric: for each level there is a clear description of what students demonstrate they can do, along with an example or two illustrating what that level response looks like for third-grade students. Researchers who develop assessments like this test them on groups of students and use what they learn to refine the tasks and the rubrics. They can also collect responses that are good examples of each of the six levels. You can do the same thing. If you work with your colleagues you can, over time, build a collection of sample student work and refine the way you design your rubrics.
The process of describing possible responses will help you think about what, exactly, you are looking for.
Figure 3-3 shows one example of how a group of third-grade students decided to display their data (it has been redrawn for clarity). This group of students ordered by magnitude each of the 261 measurements they took. As a result, their display occupied 5 feet of wall space in the classroom! One can see the range of the data at a glance in their display, but the icons they use to represent each millimeter of length are not uniform. These students are at Level 2.
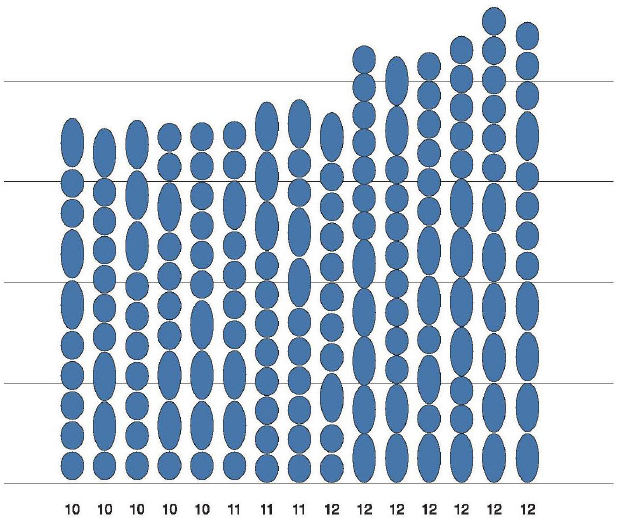
Another group of students used equal-sized intervals to show equivalence among classes of lengths (see Figure 3-4). By counting the number of cases within each interval, the students made a center clump visible. This display makes the shape of the data more visible. The use of space was not uniform, however, and that produces misleading impressions of the frequency with which longer or shorter larvae occur. These students are at Level 3.
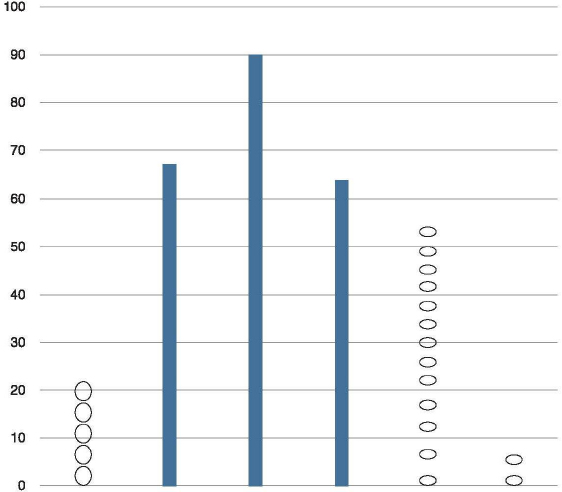
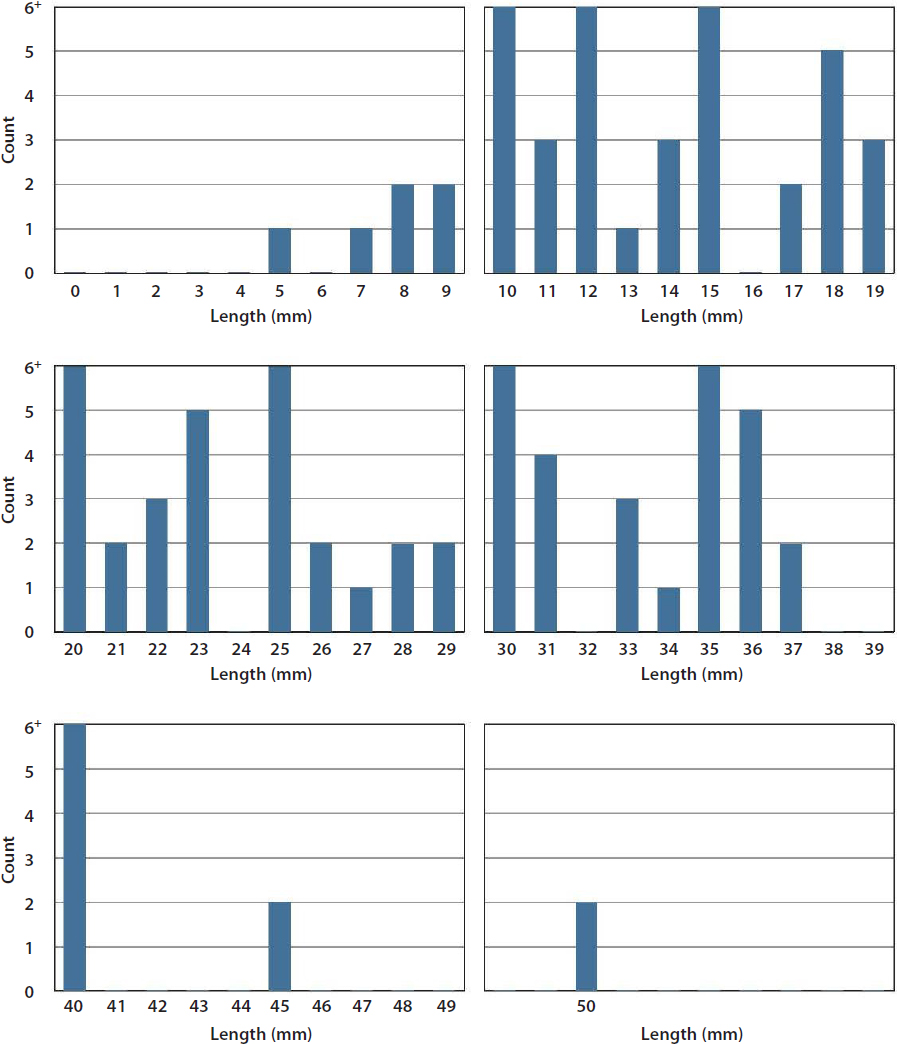
The third display shows how some students used the measurement scale and counts of cases. Because of the difficulties they experienced with arranging the display on paper, they reduced the size for all counts greater than 6 (see Figure 3-5). These students are at Level 4.
TABLE 3-1 Performance Levels for “Measuring Silkworms” Activity
| Level | Performance | What the Students Do/Examples |
|---|---|---|
| 1 | Create or interpret displays without reference to the goals of the inquiry. | “We grouped even and odd numbers because we like even and odd numbers.” “I put these two values (19 and 11) on the top because that’s my birthday—November 19!” “This display has lots of numbers.” |
| 2 | Interpret data displays as collections of individual cases: Construct/interpret data by considering ordinal properties. | “The data start out with the lowest measurement and go to the highest one.” Student creates display by ordering data as a list or case-value graph. |
|
Interpret data displays as collections of individual cases: Concentrate on specific data points without relating them to any structure in the data. |
Student identifies maximum and minimum values. |
|
| 3 | Notice or construct groups of similar values. | Student creates unordered bins and comments on, e.g., the number of occurrences of 40s versus the number of 50s. When asked to name bins in a preset display, assigns discontinuous and/or unequal intervals, such as 2–25, 26–36, 37–45. Creates equal interval bins but leaves out intermediate intervals. Notices “plateaus” in the display or in a group of similar values. “This number, 193, is really different because the others are all between 160 and 165.” |
| 4 | Recognize in, or apply scale properties to, the data: Recognize the effects of changing bin size on the shape of the distribution. | “If we make the bin size wider, the tower in the center will pop up.” |
|
Recognize in, or apply scale properties to, the data: Display data in ways that use continuous scale (when appropriate) to see holes and clumps in the data. |
Uses number line or bar type graph to show proportions. |
|
| 5 | Quantify aggregate property of the display using one or more of the following: ratio, proportion, or percent. | “I found out that measurements between 45 and 55 were 70 percent of our measurements. So, I guess the true height is somewhere between 45 and 55.” |
|
Recognize that a display provides information about the data as a collective (set). |
Students annotate their displays to show percentages within particular regions. |
|
| 6 | Discuss how general patterns or trends are either exemplified by or missing from subsets of cases. | Relate qualities of the case in the activity as an example of the general qualities of a region of data. Notice that the subset of cases does not seem to fit the trends observed or conjectured. |
NOTE: “Bins” refers to categories of data points.
SOURCE: Adapted from Wilson et al. (2013).
SOURCE: Lehrer (2011). Reprinted with permission.
NOTE: The original used icons to represent the organisms in each interval.
SOURCE: Lehrer (2011). Reprinted with permission.
SOURCE: Lehrer (2011). Reprinted with permission.
Using the Results
This assessment can be adapted for both formative and summative purposes. The teacher might use this activity in the midst of instruction to see what students understand about how different ways of representing their data emphasize or convey different information. She can use the results to follow up on areas the students did not fully understand. In this case, to help students develop their competence at representing data, the teacher then invites them to talk about what each of the different ways of displaying the data show and do not show. Through this discussion the teacher focuses the students on the idea that all representational choices emphasize certain features of data and obscure others. During this conversation, the students are guided to think about how space is used in the displays and to appreciate the basis for some of the conventions people use to display data.
The teacher also guides the conversation to some mathematical points related to the display of data: the use of order, counting, and interval and measurement scale to create different shapes in representing data. This teacher-led discussion helps the students discern the bell-like shape that is often characteristic of natural variation.
The focus on the shape of the data is a gentle introduction to the idea of variability. The teacher uses that to get the students thinking about larval growth. For example, as some students examined Figure 3-5, they noticed that the tails of the distribution were comparatively sparse, especially for the longer silkworm larvae, and they wondered why. They speculated that this shape suggested that the organisms did not all have equal access to resources. They related this possibility to differences in the timing of larval hatching and guessed that larvae that hatched earlier might have begun eating and growing sooner and therefore acquired an advantage in the competition for food.
The idea that competition helps to account for the variability and growth the students observed is a new kind of explanation for them. This idea helps them begin to think beyond individual organisms and consider what is happening to the whole population of silkworms.
This activity could also be used for a summative purpose, after students have had more experience with the core ideas in this unit and practice with ways of structuring data displays and thinking and talking about what they show. The levels in the map in Table 3-1 describe the types of reasoning third-grade students are likely to show as they consider possible ways to display their data. The descriptions of the performance levels provide a way to interpret the significance of these differences. The researchers who developed this map based it in part on
the results of similar activities, in which elementary students worked with data and statistics to develop similar descriptions of performance levels that apply more broadly—beyond this activity.
Because these levels were developed in advance, based on instructional goals and information about what third-grade students can be expected to do, it would be reasonable to compare results for different groups of students given the same task, for example, or to use the activity at the end of a unit to see whether students had met performance expectations. As researchers and practitioners continue to collect student work and develop descriptions of learning progressions, there will be more resources to draw on. By collaborating with your colleagues in developing descriptions of performance levels and reviewing the kinds of responses your students come up with, you can refine and improve your “maps” of what your students can do.
Using Example Student Responses
Examples of student work are useful for illustrating what different levels of performance look like. Using them in the interpretation of results from new types of assessments provides a way to make descriptions of a learning progression concrete. The scoring rubric in Table 3-2 was developed for a task that assessed students’ understanding of the core ideas that species develop new traits because of random genetic processes (e.g., mutations) and that the new traits might be either helpful or harmful or have no effect on survival. The most important point in the instruction was that the genetic processes and the new traits that result are random. The traits become more common if they benefit the species; therefore, organisms that have the trait are more likely to successfully reproduce.
The levels described here correspond to a map that researchers had developed showing how student understanding of these ideas may move from an everyday understanding to a scientifically accurate understanding. This rubric does not assign numeric levels, but it does describe responses that demonstrate increasing levels of understanding, with “trait not present” describing the most minimal response.
A scoring guide like this helps the teacher use the students’ responses to see which students have reached the highest level—or upper anchor of performance—and understand the main idea about random mutation. Other students will demonstrate that they have heard some of the terms without developing an integrated understanding of the way this process works. Still others have incorrect ideas—
TABLE 3-2 Rubric for Assessment of Genetic Processes
| Level | Description | Example Student Response |
|---|---|---|
| Random mutations | Student describes one or more of the random genetic mechanisms by which new traits arise. | A species changes over time because of random mutations and gene shuffling. Random mutations can cause a change in a species’ gene pool. And gene shuffling is different combinations of genes that come from the parents. If species are separated long enough, the species’ gene pool changes. |
| Environment causes change with genetic basis | Changes occur as a result of genetic mutations in direct response to the environment and/or not random. | Animals mutate to fit in with their natural surroundings. So becoming darker helps to keep them in camouflage. |
| Unclear or vague | Student refers to mutations or random changes leading to new traits but does not describe a mechanism for how that happens. | If a mutation happens it can [affect] the whole species by creating a variety of differences, from color change to more or less help against gathering food and protecting against predators. |
| Trait not present | Description of differences in traits not given at genetic level or denial of change in genes. | I picked my answer because none of the [others] seemed all the way correct. |
SOURCE: Furtak and Heredia (2014, p. 1004). Reprinted with permission from John Wiley & Sons, Inc.
such as the idea that organisms can intentionally develop traits that will be beneficial in their environments.
The second example (see Table 3-3) is from a unit for sixth graders on the solar system and the relationship between the Sun and Earth’s seasons. The unit engages the students in the practices of discourse, developing an argument from evidence, and modeling as they explore the crosscutting concept of energy and the core ideas about Earth and the solar system. A set of five descriptions of the increasingly sophisticated understanding that can be expected of sixth-grade students is the scoring guide, or learning progression, for this assessment.
At the start of the unit, the teacher recognizes that many of the students have made observations about the seasons that she will want to address, such as that fluctuations in Earth’s distance from the Sun are the cause of changes in the seasons and that the shape of Earth’s orbit around the Sun is an oval rather than very nearly circular. The teacher gives the students a model of Earth and a lightbulb to represent the Sun and encourages them to explore what happens to the lengths and intensity of sunlight at different locations in the Northern and Southern hemispheres as Earth follows its orbit and tilts toward the star Polaris.
TABLE 3-3 Learning Progressions for Assessment of Seasons
| Level | Sophistication of Understanding | Example Student Descriptions of Phenomena |
|---|---|---|
| 5 upper anchor |
Students understand that seasons on Earth and changes in temperature are caused by angle and intensity of sunlight and length of day. | “In North America in June, the Sun is higher in the sky causing longer daylight hours and more direct rays from the Sun.” “Earth’s North Pole always points toward Polaris and in June Earth is tilted so the Northern Hemisphere is getting more direct sunlight.” |
| 4 | Students recognize that Earth’s tilt on its axis changes the length of day but may not be able to apply this understanding to temperature or the crosscutting concept of energy. | “Because Earth is facing the Sun it receives more sunlight and gets warmer.” “Temperatures at the equator are warm because the equator has summer all year.” |
| 3 | Students may have naïve understanding of the seasons. | “The Sun is farther away from Earth in winter and closer in summer.” “The [Sun] gives off more heat in the summer.” |
| 2 | Students are aware that shadows [from] the Sun have different lengths and that length of days changes throughout the year. | “As the day gets longer, so does my shadow from the Sun.” “In the summer, the days are longer than they are in the winter.” |
| 1 lower anchor |
Students notice a change in the times the Sun rises and sets during the year. | “The Sun rises early in the morning in summer.” “It gets dark earlier in the winter.” |
SOURCE: Huff and Duschl (2016). Reprinted with permission.
Table 3-3 lays out the range of expected responses using precise descriptions of each level, together with sample responses, to illustrate what each can look like.
Collecting these sorts of details about the students’ reasoning allows the teacher to address the understanding students demonstrate between the lower and upper anchors in the performance expectations for the unit. He could respond very precisely to the areas where they are struggling by:
- using the students’ own descriptions of the phenomena in his instruction, and
- focusing instruction on evidence that could be used to help students examine and modify their ideas.
WHAT DO THESE EXAMPLES SHOW US?
“Behavior of Air” shows how a classroom discussion can be used to assess three-dimensional understanding. The activity is structured to focus the students’ attention on particular ideas about matter and to guide them on how to use the modeling activity to explore their thinking. The teacher uses the discussion of the students’ models of air particles to identify what they don’t understand and then to support them in collaborating to resolve the differences their models reveal. This task assesses both their understanding of the concept and their proficiency with the practices of modeling and developing oral arguments about what they have observed.
This is a formative assessment designed to help the teacher and the students in real time. With formative assessments there usually is no need to assign scores to individual students. Instead of scoring rubrics, you might use more informal criteria that will help you quickly see what you need to know in order to make instructional decisions and better support your students. In this example, the curriculum designer used information about the challenges students are likely to have (this is often information a learning progression can provide) to develop questions and prompts for guiding the discussion.
“Measuring Silkworms” illustrates the use of a different set of three-dimensional activities for both formative and summative purposes. In the course of doing these activities, students learn about how data displays can convey ideas; they also learn about why professional scientists have developed certain conventions for doing this. They likewise learn how such mathematical practices as ordering and counting data influence the shapes the data displays take. The activities work interactively: as the students learn a practice (data representation as an aspect of data analysis), they also learn about a crosscutting concept (recognizing and interpreting patterns) and a core idea (variation in a population).
Creating the displays is a learning activity for the students, but it is also a formative assessment, a source of evidence for their teacher about what they are learning. The performance levels could be used formatively or summatively. The rubrics for the assessment of genetic processes and understanding the seasons (see Tables 3-2 and 3-3) illustrate how sample student responses can be used to make the descriptions in a rubric more concrete.
What these examples have in common is that they allow the teacher to group the students into categories, which helps with the difficult task of making sense of many kinds of student thinking. They also provide tools for helping the teacher decide what to do next or for assigning scores to individual students.
CHAPTER HIGHLIGHTS
- A critical task in adapting science activities for use as either formative or summative assessments is to develop a clear description of what will be assessed by each task—what students will demonstrate. This description will begin with the specific performance expectations you want to measure. You can use that, together with examples of students’ responses to the task, to develop a scoring rubric.
- To use an informal activity such as a class discussion or a collaborative data modeling exercise as an assessment, you need to structure it ahead of time, based on what you know about the misunderstandings students are likely to have and the specific goals you want the students to accomplish. You can use planned questions and strategies to redirect the students and focus their attention on the concepts you are assessing.
- You can also use your expectations for student learning to develop a structure for interpreting the information you get from the assessment. This might be an informal checklist you have for making sure the students have understood what they need to know in order to move forward, or it might be a more formal rubric for scoring their performance.
This page intentionally left blank.


