
2
Immigration to the United States: Current Trends in Historical Perspective
2.1 INTRODUCTION
More than 40 million persons living in the United States were born in other countries, and almost an equal number—the second generation—have at least one parent who was born abroad. Together, the first generation (foreign-born) and second generation (U.S.-born children of the first generation) comprise almost one in four Americans (Pew Research Center, 2015a, p. 120). Political leaders and social commentators sometimes cite these large numbers as evidence that the United States is facing an unprecedented crisis that threatens the economy and the cultural fabric of U.S. society. However, current levels of immigration, though at record highs in absolute numbers, are not out of line with those experienced for most of American history when considered relative to the total U.S. population. The United States has witnessed successive waves of mass immigration that were initially seen as crises but are now celebrated as major contributions to a “nation of immigrants” (Kennedy, 2008; Martin, 2010). In the coming years, immigration will be the primary source of labor force growth in an increasingly aging population.
Placing current and future immigrant trends and patterns into historical perspective is the objective of this chapter. In addition to setting the stage for the subsequent chapters of this report, a look backward also provides context for understanding the contentious debates over immigration. Each generation of Americans, from the founding of the republic to the present day, has wrestled with questions of who should be allowed to enter the country and to become a citizen. Americans, especially natives and long-
settled immigrants, have always been suspicious of the qualities of newcomers: their character, their skills, their loyalty, and their potential to assimilate to American values and institutions (Zolberg, 2006). At many times during U.S. history, laws and policies were enacted to restrict the entry and freedoms of different groups of newcomers. But the door was never completely closed, and peoples from almost every part of the world have continued to seek refuge and opportunity on American soil that they could not find in their home countries (Daniels, 1991; King, 2000; Reimers, 1992).
The growth of the U.S. population from less than 4 million in 1790 to about 320 million in 2015 is due in no small measure to immigration. Most Americans today are the descendants of immigrants who arrived after the founding of the nation in the late 18th century (Edmonston and Passel, 1994, p. 61; Gibson, 1992). Their immigrant ancestors may not have been welcomed because their language, religion, culture, or appearance was not considered sufficiently “American.” Yet, with the passage of generations, the children, grandchildren, and great-grandchildren of the successive waves of immigrants have become part of the American tapestry. This multigenerational process, which involves integration of different peoples, religions, and cultures, has diversified and broadened what it means to be “an American” (Gleason, 1980).
Immigrants and their descendants have also been accepted, even if not fully embraced, because of their determination and enterprise. Many immigrants are willing to undertake less desirable jobs than, and to settle in locations that are shunned by, native-born workers. The children of immigrants are often distinguished by their ambition and creativity (Hirschman, 2013), helping to invigorate American society and sustain this nation’s world leadership in science and culture. In his 1958 book, A Nation of Immigrants, then-Senator John F. Kennedy claimed that the distinctive American culture of optimism and enterprise arises from our immigrant heritage.
In this brief survey, the panel addresses four major contemporary issues that have historical roots:
- Are current levels of immigration higher than those experienced in the past?
- How is immigration changing the racial and ethnic makeup of the U.S. population?
- What will be the impact of immigrant workers on the U.S. economy as the Baby Boom generation departs the workforce?
- How have the geographic settlement patterns of new immigrants changed in recent decades?
To understand the significance of these issues, the chapter begins with an overview of historical trends and patterns of immigration to the United
States. Three themes are emphasized (1) the volume of immigrant inflows and their changing origins; (2) the context of reception, often hostile but later accommodating; and (3) the successful integration of immigrants and their children.
2.2 IMMIGRATION TRENDS AND ORIGINS FROM 1820 TO 2015
The United States began collecting data on the numbers and origins of arrivals by ship in 1820. This statistical series, published in the annual Yearbook of Immigration of Statistics by the U.S. Department of Homeland Security (DHS), is widely considered to be the standard account of immigration to the United States, even though the series provides an incomplete record of immigration for much of American history. For example, overland entries from Canada and Mexico were not counted until the early 20th century. In recent decades, the DHS figures are not the number of new arrivals but of persons receiving lawful permanent resident (LPR) status, commonly called receiving a “green card.” More than 1 million persons receive LPR status each year, but the majority of these have already been in the United States, some for many years. In addition, many other new arrivals enter the United States on temporary visas to work, study, or accompany a family member who comes to work or study. In fact, LPRs and temporary students or workers are not entirely separate populations, since over half of new LPR visas each year are “status adjustments” received by persons who were already in the United States on another visa (or even without a visa). Despite these limitations, the DHS series is the most widely used source of data for measuring long-term flows of (legal) immigrants to the United States. Figure 2-1 shows the absolute number (in thousands) of arrivals/LPRs based on the DHS data series with labels for the major immigration eras identified by Philip Martin (2013) in his Population Reference Bureau publication. We note that the spike in the numbers of new immigrants from 1989 to 1991 does not represent a surge of new arrivals but rather the change in legal status for the 3 million previously undocumented immigrants who received LPR status following the passage of the Immigration Reform and Control Act of 1986 (IRCA). Table 2-1 shows more detailed data on the specific countries of origin from the published DHS Immigration and Naturalization Service data series for each of the four periods identified in Figure 2-1 (the dates of Martin’s periodization are slightly revised here to be consistent with the availability of DHS data by country of origin).
Based on the DHS data series, at least 74 million immigrants have arrived in the United States since 1820. There are only fragmentary counts of those who returned to their countries of origin or who died without leaving any descendants, but there is little doubt that almost all Americans are
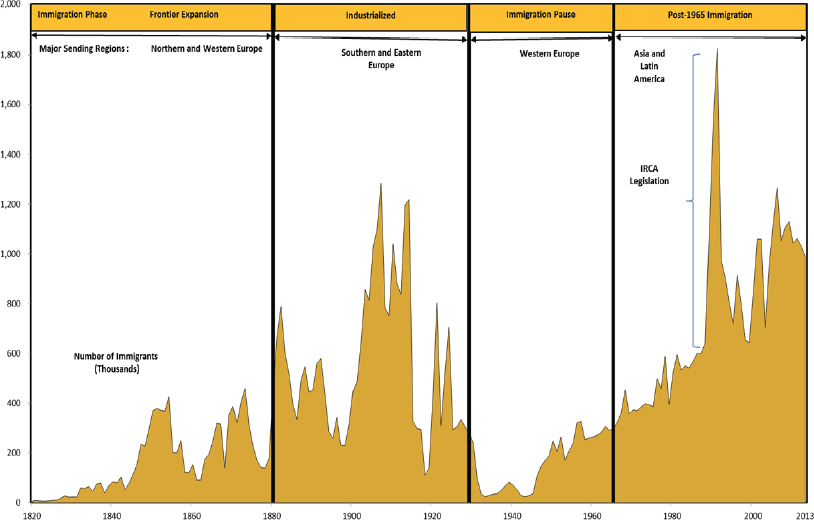
NOTE: IRCA adjustments refer to the amnesty provisions of the Immigration Reform and Control Act of 1986, under which 2.7 million undocumented foreign-born U.S. residents obtained lawful permanent resident status.
SOURCE: This figure replicates Martin (2013, Fig. 2, p. 5) directly from the data series maintained by the U.S. Department of Homeland Security, 2014. These data can be downloaded from https://www.dhs.gov/publication/yearbook-immigration-statistics-2013-lawful-permanent-residents [November 2016].
the products of immigration, past or present. Without a common ancestry (real or imagined) to claim, American identity has been forged by common experiences rather than descent. These common experiences of Americans are created and reinforced by public schools, military service, civic organizations, Hollywood images, political campaigns, and social movements.
The four periods represented in Figure 2-1 are (1) frontier expansion before 1880, (2) industrialization and the age of the Great Atlantic Migration from 1880 to 1929, (3) the immigration pause from 1930 to 1965, and (4) the post-1965 wave of migration from Latin America and Asia. Even though millions of migrants arrived in each period, the eras of industrialization and the post-1965 wave stand out as exceptional, with 23 and 35 million documented immigrants, respectively.
The absolute numbers of arrivals or immigrants represented in Figure 2-1 (and on which the percentages in Table 2-1 are based) are not adjusted for the size of the American population at the time. For example, the 1 million or more annual arrivals in the early 20th century—in a country of less than 100 million people—represented a larger change to the population base than the arrival of 1 million annual immigrants in the early 21st century when the U.S. population numbered more than 300 million. The next section of this chapter presents estimates of the net international migration rate relative to the national population. The first conclusion from Figure 2-1 is that the annual numbers of immigrants in the current period—the “post-1965 wave”—are not exceptionally different from the numbers during much of American history. The one period that is distinctively different is the 1930 to 1965 immigration pause (Massey, 1995). This era, often remembered with nostalgia by many older Americans as representative of the American past, is actually the most different with respect to the annual numbers (and percentage of the receiving population) of arriving immigrants.
Beyond the number of immigrants, it is helpful to survey the major trends and patterns that shape and describe immigrant flows. These include the factors that motivate long-distance migration; condition the reception of immigrants by the receiving population; and shape government policies that have encouraged, discouraged, and restricted immigration at various times (Hirschman et al., 1999; Massey et al., 1998; Portes and Rumbaut, 2014). Economic factors loom large among the many causes of international migration. As a frontier New World country in the mid-19th century, a rapidly growing industrial economy in the early 20th century, and a dynamic postindustrial economy in recent decades, the United States has always attracted immigrants (Easterlin, 1980). Long-distance migrants rarely come from the ranks of the successful; more often they have been peasants pushed off their lands by the commercialization of agriculture, workers who lost their traditional livelihood because of the
| Region and Country of Last Residence | Frontier Expansion | Industrialization | Pause | Post-1965 Era | All Periods |
|---|---|---|---|---|---|
| 1820-1879 | 1880-1929 | 1930-1969 | 1970-2013 | 1820-2013 | |
| Total (%) | 100.0 | 100.0 | 100.0 | 100.0 | 100.0 |
| Europe | 90.0 | 82.9 | 47.5 | 13.1 | 47.7 |
| Northwestern Europe | 52.2 | 13.8 | 14.3 | 3.0 | 13.8 |
| Britain | 19.5 | 6.7 | 8.4 | 1.9 | 6.3 |
| Ireland | 28.7 | 5.0 | 1.8 | 0.3 | 5.6 |
| Scandinavia | 3.6 | 6.1 | 2.1 | 0.3 | 2.7 |
| Germany and Switzerland | 31.8 | 7.1 | 14.8 | 1.3 | 8.3 |
| Eastern Europe | 1.2 | 33.4 | 4.8 | 5.0 | 13.1 |
| Austria-Hungary | 0.7 | 16.6 | 2.3 | 0.3 | 5.5 |
| Poland | 0.2 | 1.5 | 1.3 | 1.2 | 1.2 |
| Russia | 0.4 | 13.7 | 0.1 | 2.0 | 5.2 |
| Southern Europe | 1.3 | 22.5 | 11.2 | 2.3 | 9.2 |
| Italy | 0.7 | 19.0 | 7.2 | 0.9 | 7.0 |
| Greece | 0.0 | 1.9 | 1.9 | 0.5 | 1.0 |
| Spain and Portugal | 0.5 | 1.6 | 2.0 | 0.9 | 1.2 |
| Asia | 2.3 | 3.4 | 7.5 | 34.0 | 18.0 |
| China, Hong Kong, Taiwan | 2.3 | 0.4 | 2.0 | 6.6 | 3.7 |
| Japan | 0.0 | 1.2 | 1.2 | 0.8 | 0.9 |
| Philippines | 0.0 | 0.0 | 1.3 | 6.2 | 3.0 |
| Korea | 0.0 | 0.0 | 0.4 | 3.0 | 1.4 |
| Vietnam | 0.0 | 0.0 | 0.0 | 2.9 | 1.4 |
| India | 0.0 | 0.0 | 0.3 | 4.6 | 2.2 |
| Other Asia | 0.0 | 1.7 | 2.3 | 9.9 | 5.4 |
| Americas | 6.8 | 13.2 | 43.4 | 45.6 | 30.5 |
| Canada and Newfoundland | 5.8 | 7.9 | 15.3 | 2.4 | 5.8 |
| Mexico | 0.3 | 3.2 | 11.1 | 19.2 | 11.1 |
| Caribbean | 0.7 | 1.5 | 8.4 | 11.7 | 6.9 |
| Cuba | 0.1 | 0.2 | 4.3 | 2.7 | 1.8 |
| Dominican Republic | 0.0 | 0.0 | 0.0 | 0.0 | 0.0 |
| Haiti | 0.0 | 0.0 | 0.5 | 1.9 | 0.9 |
| Jamaica | 0.0 | 0.0 | 1.0 | 2.2 | 1.1 |
| Other Caribbean | 0.5 | 1.3 | 1.3 | 1.5 | 1.3 |
| Central America | 0.0 | 0.2 | 2.3 | 5.3 | 2.8 |
| South America and other America | 0.1 | 0.4 | 6.4 | 7.0 | 4.1 |
| Africa | 0.0 | 0.1 | 0.6 | 4.9 | 2.4 |
| Oceania | 0.1 | 0.2 | 0.7 | 0.7 | 0.4 |
| Not specified | 2.1 | 0.2 | 0.2 | 1.7 | 1.1 |
| Total persons (in thousands) | 9,604 | 22,540 | 7,269 | 34,694 | 74,107 |
NOTE: Official recording of immigration to the United States began in 1820 after the passage of the Act of March 2, 1819. For the period 1820-1867, the data represent alien passenger arrivals at seaports. For the periods 1868-1891 and 1895-1897, the data are for all immigrant alien arrivals. For 1892-1894 and 1898-2013, the data represent immigrant aliens admitted for permanent residence. From 1892 to 1903, aliens entering by cabin class were not counted as immigrants. Land arrivals were not completely enumerated until 1908. Prior to 1906, the data are for country of origin; from 1906 to 2013, the data are for country of last residence. Because of changes in national boundaries, data for a particular country may not necessarily refer to the same geographic area over time. Only the largest countries from the source table are listed here, although the regional and subregional areas are inclusive for all new arrivals/immigrants from that area. The boundaries of most of Eastern Europe changed radically from the late 19th century through the early decades of the 20th century. Moreover, many new arrivals may have reported their national identities rather than the country or political unit from which they came. For complete details, see the 21 detailed footnotes to the source table.
SOURCE: This table is a summary of Table 2 of the Yearbook of Immigration Statistics: 2013 (U.S. Department of Homeland Security, 2014, pp. 6-7).
collapse of industries, and minorities who were fleeing religious or political persecution (Hatton and Williamson, 2008; Massey et al., 1998). Nor are migrants selected from the bottom of the socioeconomic spectrum in sending societies; instead, most migrants come from the middle ranks of the sending society. The poorest of the poor rarely become long-distance migrants because they lack the resources to cover the costs of transportation and initial settlement (Massey, 1999; Portes and Rumbaut, 2014, Ch. 3).
Settling the Frontier: Immigration from Western Europe Prior to 1880
Before 1880, 90 percent of immigrants were from Europe, mostly from the United Kingdom, Ireland, and Germany (Table 2-1). Another 6 percent originated in Canada. There were smaller numbers from Scandinavia, the periphery of Europe, and China. Compared to the present, it might seem that the United States was a homogenous society for the first century after independence. This interpretation would, however, be a serious misreading of the deep racial and ethnic divides in 18th and 19th century America.
The first census in 1790 showed that 20 percent of the early American population was of African origin—90 percent of whom were slaves (Archdeacon, 1983, p. 25; Gibson and Jung, 2005, Table A.1). For the three centuries after European arrival in the New World, many more Africans crossed the Atlantic in chains than did free or indentured Europeans (Hatton and Williamson, 2008, p. 8). In addition, it should not be overlooked that Native American populations were demographically and politically ascendant in all of North America except the eastern seaboard (Snipp, 1989), even if they were not enumerated in early censuses. The conflicts and political struggles over slavery and white settlements on Native American lands were the major political issues in early American history.
In the 18th century, Americans often expressed intolerance of European groups that spoke other languages and followed different religious faiths than the majority. Benjamin Franklin complained that the “Palatine Boors” were becoming so numerous in Pennsylvania that they might be tempted to Germanize the resident population instead of the residents Anglifying them (Archdeacon, 1983, p. 20; Jones, 1992, pp. 39-40). The major immigration wave in the 1840s and 1850s, primarily of Irish Catholics fleeing the potato famine, sparked a nativist reaction, popularly known as the “Know-Nothing” movement (Higham, 1988, Ch. 2). In 1854, 6 governors and 75 members of Congress were elected from the Know-Nothing party on a platform of ending immigration (Archdeacon, 1983, pp. 81-82). Although nativism receded in the 1860s as the Civil War dominated domestic politics, the animosity against immigrants, and Catholics in particular, was a harbinger of what was to come.
The American Industrial Revolution and Immigration from Southern and Eastern Europe, 1880 to 1924
The second historical period of immigration includes the last two decades of the 19th century and the first quarter of the 20th (Table 2-1 approximates this period with data from 1880 to 1929). Although most of the immigrants during this era crossed the Atlantic, there was also an important trans-Pacific flow of migrants from China and Japan to California. The first large-scale Chinese migration began in the 1860s and 1870s, and the 200,000 Chinese workers in California in 1880 made up nearly a quarter of the state’s labor force (Bonacich, 1984). Fearing wage competition with Chinese workers, white workers in California, supported by unions and politicians, unleashed a vitriolic anti-Chinese campaign that led to the first ban on immigration of a national origin group—the so-called “Chinese Exclusion Act of 1882” (Chan, 1991). When Japanese began arriving in large numbers in the late 1890s and early 1900s, they were also met with racial hostility that soon led to a ban on immigration of Japanese workers with the “Gentlemen’s Agreement” of 1907 (Daniels, 1962).
In the five decades from 1880 to 1929, more than 22 million immigrants arrived in the United States—a country that only numbered 50 million in 1880. Even more controversial than the numbers were the sources of the “new immigrants,” as they were called. The earlier streams of Irish, British, and German immigrants gradually gave way to peoples from Southern and Eastern Europe, including more than 4 million Italians, 3 million people from the Russian Empire, another 4 million from the Austrian-Hungarian Empire, and millions more from other parts of Eastern Europe, Greece, Spain, Portugal, and Scandinavia. During this period, there were also sizable immigrant streams from the Americas, notably Canada, Mexico, and the Caribbean, as well as from Japan. Relative to the prior period (1820 to 1879), the age of the American industrial revolution (1880 to 1929) saw the fraction of immigrants from Northwestern European origins reduced from 52 to 14 percent, while the numbers from Eastern and Southern Europe soared from 2 to 55 percent.
Industrialization provided a propitious labor market for throngs of unskilled workers willing to accept jobs that were shunned by native-born Americans (Atack et al., 2000, p. 322; Carpenter, 1927, p. 271; Hirschman and Mogford, 2009). However, the differences in language, culture, and religion between new immigrants and the native-born population, combined with popular anxieties over the industrialization of the American economy, contributed to the formidable political backlash against Southern and Eastern European immigrants during the late 19th and early 20th centuries.
Anti-Catholic attitudes were a core feature of 19th century American culture, which sometimes seethed into mob violence (Archdeacon, 1983,
p. 81; Daniels, 1991, pp. 267-268). The rising tide of 19th century nativism morphed into a pseudo-scientific theory of Anglo-Saxon racial superiority based on Social Darwinism (Higham, 1988). Premised on assertions that immigrants from Southern and Eastern Europe could not be assimilated into American society, academic treatises and popular writings alleged that these new immigrants would undermine American political and cultural values and lower the intelligence of the population. An unusual political coalition, including the Ku Klux Klan, Midwestern Progressives, and many prominent intellectuals joined the anti-immigrant hysteria (Higham, 1988, Ch. 1; Jones, 1992, pp. 228-230). In 1910, the Dillingham Commission, appointed by Congress, issued a 42-volume report, which avowed the racial inferiority of the new immigrants from Eastern and Southern Europe (Bernard, 1980, p. 492; Handlin, 1957, Ch. 5).
The Immigration Restriction League, founded by young Harvard-educated elites in 1894, advocated a literacy test to slow the tide of immigration from Southern and Eastern Europe, which allegedly were sending an “alarming number of illiterates, paupers, criminals, and madmen who endangered American character and citizenship” (Higham, 1988, p. 103). When the literacy test failed to stem the immigration tide, the restrictionists pushed for numerical caps on new arrivals that aimed to reduce if not eliminate immigration from undesirable origins. Congress passed a law in 1921 that restricted immigration to 3 percent of each nationality already in the U.S. population, based on the 1910 census. Seeking to tighten the screws, the Immigration Act of 1924 (“Johnson-Reed Act”) lowered the quotas by restricting immigration to 2 percent of each nationality counted in the 1890 census—a date before the surge in immigration from Southern and Eastern Europe. Following vitriolic congressional debates about redistricting, the act was amended in 1929 to set quotas based on the “national origins” of the white U.S. population (Bernard, 1980, pp. 492-493; Jasso and Rosenzweig, 1990; Tienda, 2002).
The anti-immigrant prejudices also triggered scapegoating of immigrants as the alleged causes of a myriad of social problems, including crime, radical politics, labor unions, and disease. The “Red Scare” (directed at socialists and communists) during 1919 and 1920 led to the mass arrests and deportations of immigrants (Higham, 1988, pp. 222-233). In early 1920, Attorney General A. Mitchell Palmer directed federal agents to round up more than 6,000 “aliens” without warrants. Although most were eventually released, many “were detained for unjustifiably long times and some suffered incredible hardships” (Cohen, 1964, p. 73). Similar scapegoating episodes occurred in the 1930s when, in the depth of the Great Depression, President Hoover authorized repatriation of Mexicans without due process in order to reduce welfare rolls and open up deportees’ jobs for American workers (Balderrama and Rodriguez, 1995). As Nazi Germany unleashed
an increasingly violent repression of its Jewish population during the 1930s, only a small number of Jewish refugees from Germany were allowed to enter the United States. Even as awareness of an approaching Holocaust of European Jewry spread, American immigration quotas, reinforced with anti-Semitism in the State Department, restricted any emergency response to accept more refugees (Breitman and Kraut, 1987; Zolberg, 2006).
The Immigration Pause from 1924 to 1965
During the long hiatus in immigration, only 7 million LPRs were admitted (Table 2-1 approximates this period with data from 1930 to 1969). The Great Depression and World War II were key factors leading to the very low levels of immigration for the 1930s and 1940s. Moreover, the restrictive laws of the 1920s had dramatically lowered immigration with very small national origin quotas for Southern and Eastern European countries and quotas of zero immigrants from Asia and Africa. Consequently, almost half of the 7 million immigrants admitted during this period originated from Western Hemisphere counties, which were exempt from the national origin quotas. The largest influx was from Canada, but there were also substantial numbers from Mexico, the Caribbean, and South America. Strong social and economic ties between Mexicans granted U.S. citizenship by decree and Mexican citizens living south of the Rio Grande provided a foundation for sustained migrant flows even after the creation of the Border Patrol in 1924. In addition to those granted permanent residence, the United States authorized the entry of temporary workers from Mexico—popularly known as the Bracero program in 1942. More than 5 million Mexicans came to the United States as braceros between 1942 and 1964 (Massey et al., 2002); virtually all of the braceros returned to Mexico. There was also continued immigration from the few European countries that were given generous immigration quotas (Tienda, 2002).
The era from the 1920s to the 1960s was an important period for the integration and assimilation of Southern and Eastern European immigrants, and especially their children—the second generation—into the mainstream of American life (Alba and Nee, 2003). Against the backdrop of an often-hostile reception encountered by the new immigrants stands the remarkable social and economic progress of millions of immigrants from different cultural origins during the early and middle decades of the 20th century. Because new immigrants were considered a breed apart in the 1910s and 1920s, ethnic intermarriage rates were low and residential segregation levels were high (Lieberson, 1963; Pagnini and Morgan, 1990). Despite its many flaws, the Americanization movement did boost naturalization rates of immigrants and broaden educational opportunities for children of immigrants (King, 2000). By the 1950s, the children of early 20th century
immigrants had reached socioeconomic parity with other white Americans, residential integration was the norm in growing suburban areas, and ethnic intermarriage was unremarkable (Alba and Nee, 2003; Duncan and Duncan, 1968; Lieberson, 1980). During this period, World War II and the ensuing postwar economic boom (when all boats were rising) also played a role as an engine of integration over time. These trends continued and expanded during the second half of the 20th century to incorporate previously stigmatized immigrant and religious groups, including Catholics and Jews, into the social and economic mainstream. For much of the 20th century, the American commitment to diversity was limited to reserving one seat on the Supreme Court for a Catholic and another for a Jew—the implicit assumption was that without some sort of informal quota, minority religions would not be represented. In 2015, by comparison, all of the justices on the Supreme Court were Catholic or Jewish. This shift suggests that other factors, such as political ideology, are now more important than religion or ancestry.
The Post-1965 Immigration Wave from Latin America and Asia
The 35 million legal immigrants from 1970 to 2013 represent a new chapter in American immigration history, with more than 40 percent coming from Latin America and 34 percent from Asia (Table 2-1). The count of immigrants granted LPR status over this period includes 6 million from Mexico, 4 million from the Caribbean, 1.8 million from Central America, and 2.4 million from South America. Of the 12 million Asian immigrants granted LPR status since 1970, 2 million hail from China (including Taiwan and Hong Kong), another 3 million are from the Philippines, and more than 1 million each came from Korea, Vietnam, and India. Since 1970, more than 1.7 million immigrants from Africa were granted LPR status.
Although the popular response to the post-1965 immigration wave may lack the blatant expressions of vitriol that were common in early 20th century America, there are parallels between the anti-immigrant political movements then and now. Undocumented immigrants evoke considerable antipathy from political leaders and the media, including allegations that immigrants increase crime rates; spread communicable diseases; create congestion in schools, parks, and other public facilities; and deplete scarce natural resources (Bouvier, 1992; Chavez, 2008; Federation for American Immigration Reform, 2009; Massey and Pren, 2012). Prominent intellectuals and academics sometimes legitimately claim that the newcomers from Asia and Latin America cannot be assimilated (Brimelow, 1995). Singling out Latin Americans (and Mexicans in particular), Harvard political scientist Samuel P. Huntington (2004, p. 256) warned that the continued influx would eventually “change America into a country of two languages, two cultures, and two peoples.” As in the past when anti-immigrant sentiment
mounted, Congress passed a series of punitive laws in the 1990s and 2000s, which permitted the deportation of aliens, including permanent residents, with little regard for due process. The arbitrary detention and deportation of many Muslim immigrants in the wake of 9/11 is similar to the forced repatriation of Mexicans during the 1930s and 1950s.
Beyond concerns about the impact of immigrants on the labor market and the fiscal system, some Americans believe that the large numbers of immigrants from “third world” countries are a threat to national identity and culture (National Academies of Sciences, Engineering, and Medicine, 2015, p. 50). Much of the outrage in the mass media is focused on undocumented immigrants and the problem of “broken borders,” but the antipathy against illegal immigration often spills over to all immigrants, particularly during periods of economic recession (Chavez, 2008; Portes, 2007; Sanchez, 1999). In 1994, for example, California voters approved Proposition 187, which was intended to limit access to health care and public schooling for the children of undocumented immigrants. Another response to the perceived immigrant threat was the militarization of the Mexican border (Dunn, 1996) and the spending billions of dollars for border enforcement along the nearly 2,000-mile peaceful border (Massey et al., 2016).
2.3 IMMIGRATION DRIVEN BY LABOR DEMAND
One of the major issues in immigration debates, past and present, has been whether migration is primarily a response to conditions in the countries of origin or to economic demand in the United States. Economic and demographic theory predict that both pushes and pulls are important, but there are other noneconomic factors influencing long-distance migration, including the social support from family and friends who have previously migrated (Massey et al., 1993), as well as immigrant admissions policies that emphasize family reunification. It is not so much a question of “either-or,” but whether the magnitude of long-distance migration flows is responsive to labor demand and therefore “self-regulating” (at least in part), or whether immigration can only be controlled by restrictive policies (Hollifield et al., 2014).
The consensus of economic historians is that international migration before the 1920s was highly responsive to the economic demand for labor (Easterlin, 1968; Hatton and Williamson, 2008; Thomas, 1973). The restrictive immigration policies of the United States from the 1920s onward (and elsewhere in the world) reduced international migration to very low levels and ended the historic link between economic demand and the Atlantic migration system.
Following the immigration reforms in the 1960s, immigration levels increased from 1970 to the late 1990s and have oscillated since then at
relatively high levels compared with the decades immediately prior to 1970. However, there have been substantial swings in the national origins and composition of immigrant arrivals during the contemporary period of mass immigration. For example, the large influx of unauthorized migrants, especially from Mexico, appears to have slowed in the early 2000s and then declined after the Great Recession (Passel et al., 2013). The major wave of Korean immigration peaked in the 1980s, while immigration from China and India increased in the 1990s and 2000s (U.S. Department of Homeland Security, 2014, Table 2.1).
Changes in immigration and refugee policies have shaped much of the fluctuations in the most recent period, including expansion of temporary immigration of high-skilled workers under the H-1B visa program and increasing numbers of international students, both undergraduate and graduate, enrolling in American universities (see Section 5.6 in this report). These policies and programs reflect, at least in part, the high demand for highly skilled labor in STEM fields (science, technology, engineering, and mathematics) by American firms in the high tech sector and in research laboratories in universities and the private sector.
There is also a high demand for temporary labor by the American agricultural sector, which has led to the creation of the H-2A visa program. The significant flows of undocumented workers to low-wage jobs in domestic child care, agriculture, and construction signify a partial response to the demand for workers by employers and for services by households in the United States (Massey et al., 2002; Muller, 1993; Portes and Rumbaut, 2014). The dramatic reduction in the levels of unauthorized migration following the collapse of the construction industry during the Great Recession in 2007-2009 suggests a powerful feedback from economic conditions (Martin, 2013; Massey, 2012). As will be shown in a following section, immigrants and their children have comprised a growing share of the working-age population. With the impending retirements among the large population of Baby Boomers, immigrants will play an even larger role in serving the labor needs of economic growth.
2.4 THE NET INTERNATIONAL MIGRATION RATE AND ITS CONTRIBUTION TO POPULATION GROWTH
The iconic portrait of immigration shown in Figure 2-1 represents only the inflow of LPRs to the United States. It does not include those coming on temporary visas to work or study nor those entering without authorization. Moreover, the DHS series does not include emigrants—the numbers of persons who depart from the United States each year. There has always been a substantial return migration of immigrants to their country of origin (Bandiera et al., 2013; Van Hook et al., 2006). More-
over, the absolute number of immigrants does not incorporate information on the size of the national population. The magnitude of immigration relative to the total resident population (sometimes labeled “the density of immigration”) is a better reflection of the visibility of presence of newcomers and of their potential impact on the host society. Standard demographic measures are typically expressed in rates relative to the population per unit of time. Thus, the panel’s preferred index of immigration is the “net international migration rate” (or the net immigration rate) defined as net international migrants (immigrants minus emigrants) for a time interval divided by the (average) total resident population for the same time interval.
However, the lack of direct and complete measurement of all persons who enter and leave the United States has meant that most research relies on the one-sided and partial DHS series of LPRs as the index of temporal flow of immigration to the United States. Demographers and economic historians have, however, made heroic efforts to estimate the net international migration rate based on incomplete data and indirect methods of estimation (Barde et al., 2006; Carter et al., 2006, Ch. 1, pp. 541-550).
Table 2-2 shows the best available estimate of the trend in the net international migration rate and the share of national population growth attributable to net immigration for each decade from 1790 to 2000 and annually from 2000 to 2013. The historical series from 1790 to 2000 was assembled by Michael Haines (2006) and published in the millennial edition of the Historical Statistics of the United States (Carter et al., 2006). Table 2-2 also includes U.S. Census Bureau estimates of the net international migration rate for each year from 2000 to 2013 (except 2009). Although the techniques of estimation used in the historical series and the Census Bureau estimates are somewhat different, they rely on a similar logic. Net international migration is measured as the residual for a specific time interval (decade or year) after subtracting natural increase (births minus deaths) from total population growth for the same time interval. This method is indirect, but components (population growth and natural increase) are better measured than are the actual numbers of immigrants and emigrants.
Despite the record numbers of immigrants admitted in recent decades (as shown in Figure 2-1), the net immigration rate in Table 2-2 shows that contemporary immigration is fairly modest when considered relative to the size of the total population. The highest rates of net immigration relative to the total population occurred neither in the early 20th century nor in the early 21st century but rather in the 1840s and 1850s. The net international migration rate was about 8 or 9 per 1,000 population during this time, falling to about 6 or 7 per 1,000 population from 1880 to 1920, and then falling further in the decades of the Great Depression, 1940s, and 1950s.
| Time Period | Mid-Period Population (thousands) |
Rate of Total Increase (per 1,000) |
Crude Birth Rate (per 1,000) |
Crude Death Rate (per 1,000) |
Rate of Natural Increase (per 1,000) |
Net International Migration | |
|---|---|---|---|---|---|---|---|
| Rate per 1,000 |
Percentage of Population Growth | ||||||
| 1790-1800 | 4,520 | 30.1 | — | — | 26.5 | 3.6 | 11.9 |
| 1800-1810 | 6,132 | 31.0 | — | — | 26.9 | 4.2 | 13.5 |
| 1810-1820 | 8,276 | 28.6 | — | — | 24.7 | 3.9 | 13.7 |
| 1820-1830 | 11,031 | 28.9 | — | — | 26.8 | 2.1 | 7.1 |
| 1830-1840 | 14,685 | 28.3 | — | — | 23.5 | 4.8 | 16.9 |
| 1840-1850 | 19,686 | 30.7 | — | — | 22.4 | 8.3 | 27.0 |
| 1850-1860 | 26,721 | 30.4 | — | — | 20.6 | 9.8 | 32.3 |
| 1860-1870 | 35,156 | 23.6 | — | — | 17.4 | 6.3 | 26.5 |
| 1870-1880 | 44,414 | 23.1 | 41.2 | 23.7 | 17.5 | 5.6 | 24.2 |
| 1880-1890 | 55,853 | 22.7 | 37.0 | 21.3 | 15.7 | 7.0 | 30.9 |
| 1890-1900 | 68,876 | 19.0 | 32.2 | 19.4 | 12.8 | 6.2 | 32.6 |
| 1900-1910 | 83,822 | 19.4 | 29.8 | 17.3 | 12.6 | 6.9 | 35.3 |
| 1910-1920 | 100,546 | 14.2 | 26.9 | 15.3 | 11.6 | 2.6 | 18.1 |
| 1920-1930 | 115,829 | 14.5 | 23.2 | 11.6 | 11.5 | 3.0 | 20.5 |
| 1930-1940 | 127,250 | 7.3 | 19.5 | 11.1 | 8.4 | -1.0 | -14.0 |
| 1940-1950 | 139,928 | 13.9 | 23.1 | 10.5 | 12.6 | 1.3 | 9.6 |
| 1950-1960 | 165,931 | 17.1 | 24.8 | 9.5 | 15.3 | 1.8 | 10.4 |
| 1960-1970 | 194,303 | 12.7 | 20.1 | 9.4 | 10.6 | 2.0 | 16.1 |
| 1970-1980 | 215,973 | 10.3 | 15.4 | 8.9 | 6.5 | 3.8 | 37.0 |
| 1980-1990 | 238,466 | 9.9 | 15.8 | 8.7 | 7.2 | 2.8 | 27.9 |
| 1990-2000 | 266,557 | 11.1 | 14.9 | 8.5 | 6.4 | 4.8 | 42.9 |
| 2000 | 282,172 | 10.3 | 14.3 | 8.6 | 5.8 | 4.3 | 41.3 |
| 2001 | 285,082 | 9.5 | 14.1 | 8.5 | 5.5 | 3.8 | 39.6 |
| 2002 | 287,804 | 8.8 | 14.1 | 8.4 | 5.7 | 2.9 | 32.6 |
| 2003 | 290,326 | 9.4 | 14.2 | 8.4 | 5.7 | 3.4 | 36.3 |
| 2004 | 293,046 | 9.2 | 14.1 | 8.3 | 5.8 | 3.2 | 35.0 |
| 2005 | 295,753 | 9.6 | 14.1 | 8.2 | 6.0 | 3.4 | 35.4 |
| 2006 | 298,593 | 10.0 | 14.4 | 8.1 | 6.3 | 2.9 | 29.0 |
| 2007 | 301,580 | 9.3 | 14.2 | 8.1 | 6.1 | 2.9 | 30.9 |
| 2008 | 304,375 | 8.6 | 14.0 | 8.2 | 5.8 | 2.8 | 32.5 |
| 2009 | Not available | ||||||
| 2010 | 309,347 | 7.7 | 12.8 | 8.1 | 4.7 | 3.0 | 38.5 |
| 2011 | 311,722 | 7.7 | 12.6 | 8.0 | 4.6 | 3.1 | 40.0 |
| 2012 | 314,112 | 7.6 | 12.6 | 8.2 | 4.4 | 3.2 | 41.9 |
| 2013 | 316,498 | 7.5 | 12.5 | 8.2 | 4.3 | 3.1 | 42.2 |
NOTES: Net International Migration Rate from 1790 to 2000 is based on Rate of Population Growth minus the Rate of Natural Increase. Net International Migration Rate from 2000 to 2013 includes the international migration of both native- and foreign-born populations. Specifically, it includes (a) the net international migration of the foreign-born, (b) the net migration between the United States and Puerto Rico, (c) the net migration of native-born U.S. citizens from and to the United States, and (d) the net movement of the Armed Forces population between the United States and overseas. Net international migration for Puerto Rico includes the migration of native- and foreign-born populations between the United States and Puerto Rico.
SOURCES: Haines (2006); U.S. Census Bureau (2015).
The net international migration rate rose from its very low levels during the middle decades of the 20th century to 2 per 1,000 in the 1960s—as the post-1965 immigration wave began. The net international migration rate then jumped to 3.8 per 1,000 in the 1970s, receded to 2.8 in the 1980s, and then increased to 4.8 per 1,000 in the 1990s. In the early 2000s, the rate fluctuated and then dropped to about 2.8 to 2.9 at the onset of the Great Recession in 2008. The rate appears to have stabilized around 3.1 to 3.2 from 2011 to 2013.
The current net international migration rate of one-third of one percent (3.3 per 1,000) per year is only half the level experienced in the prior period of mass migration, from 1880 to 1910. However, one aspect of contemporary immigration is higher than in prior periods of mass migration. During the post-1965 wave of immigration, net international migration has been a larger fraction of national population growth than it was during most earlier periods. The last column in Table 2-2 shows the ratio of net international migration to the total rate of population growth (either intercensal or annual)—which can also be expressed as the share of population growth due to net immigration. Since the 1970s, net immigration has been around 35 percent, and sometimes over 40 percent of total population growth. The ratio did drop below 30 percent during the 1980s and for a few years around the 2008 Great Recession, but immigration has been a major reason for the relatively high rate of population growth in the United States (compared to most other industrialized countries).
The explanation for the apparent anomaly of a historically moderate net international migration rate and a record-high contribution of immigration to national population growth is that other components of population growth have fallen to historically low levels. Over U.S. history, the rate of natural increase in the population (births minus deaths) has been steadily declining because the costs and benefits of large families changed for both native-born and foreign-born couples as the nation became more urbanized and industrialized. In addition, in an aging society deaths per thousand of population are also rising, which further depresses natural increase. In the past few years, the rate per 1,000 for natural increase has fallen below 5.0. As natural increase declined closer to the net international migration rate of around 3.0 per 1,000, the immigration contribution to total population growth has increased to roughly 40 percent, even though the numbers of immigrants per year was not increasing.
The post-1965 immigration wave coincided with the end of the Baby Boom, the transition to below-replacement fertility, and an aging population. Fertility in the United States has hovered around the replacement level of 2.1 births per woman for the past three decades, but fell after the 2007-2009 recession to 1.86 in 2013. With the total fertility rate of white non-Hispanic women, the largest ethnic group, consistently below
1.9, higher fertility among other groups, particularly Hispanics (roughly 2.8 prior to the recession, when it fell to 2.2), has helped to maintain the replacement level.1 Overall, fertility of immigrant women is slightly higher than that of the native-born; however, the differential is small and typically narrows over time (Monte and Ellis, 2014; U.S. Census Bureau, 2014, p. 17). Even though the overall fertility rate has remained near replacement, the convergence of nativity differentials in childbearing behavior, combined with rising numbers of deaths from an aging population, portends slower future population growth even with high immigration levels.
2.5 PAST AND FUTURE TRENDS IN THE STOCK OF FIRST AND SECOND GENERATION IMMIGRANT POPULATIONS
Immigration effects are often viewed as due to not only the numbers of foreign-born alone (the first generation) but also their children born in the United States (the second generation). This section reviews the trends over time in the numbers of first and second generation individuals (see Box 2-1 on sources of data for these trends). The stock of the foreign-born in the total population at any moment in time represents the cumulative impact of prior waves of immigration, net of the deaths and the return migration of earlier immigrants. Changes in the size and composition of the stock of foreign-born across successive Decennial Censuses provide a portrait of the presence of immigrants and their children in American society.
Through the passage of generations, descendants of the foreign-born become part of the national population without any sense of being foreign or “other,” but at what point does this happen? In this chapter, as in the broader research literature, the children of immigrants—the second generation—are considered part of the immigrant community (Carpenter, 1927; Hutchinson et al., 1956; Portes and Rumbaut, 2014). For the fiscal analysis accounting in Chapters 8 and 9, the education and other costs of dependent individuals in the second generation are included on the immigrant side of the ledger. However, the decision of where to draw the line on which generations are included in the immigrant community is somewhat arbitrary.
The children of immigrants, if born in the United States as most are, are native born by definition and, under the Fourteenth Amendment, are U.S. citizens at birth. Most individuals in the second generation adopt English as their primary language, and many of them marry outside their ethnic community (Lichter et al., 2011; Qian and Lichter, 2011). Yet, many if not most of the second generation are reared and socialized within the immigrant/ethnic sociocultural environment of their parents. Their family, religious, and community ties keep them attached to the immigrant experience. This
___________________
1 Fertility data are from Martin et al. (2015).
reality was a reason for the addition of the parental birthplace question to the Decennial Census a few decades after the question on foreign birth was adopted. In keeping with this line of reasoning, the panel considers both the first and second generations as part of the immigrant population.
Figure 2-2 shows the relative size—as a percentage of the total population—of first and second generation immigrant groups from the late 19th century to the early 21st century; these figures are based on historical Decennial Census data and Pew Research Center population estimates and projections. From 1860 to 1920, the foreign-born share of the U.S. population fluctuated between 13 and 15 percent. The second generation was larger, hovering around 20 percent of the total population. The size of the second generation population was a product of the high fertility rate of immigrants at that time, approximately twice what it is today (Morgan et al., 1994). Comprising upward of one-third of the population—one-half the population outside the South and a majority among city dwellers—in
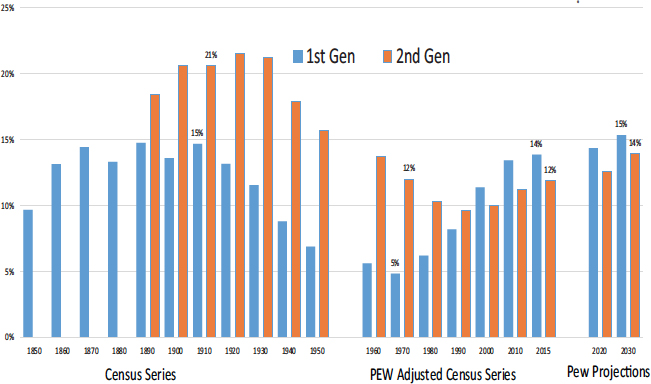
SOURCE: Pew Research Center (2015a).
the early decades of the 20th century, immigrants and their children were a highly visible presence in schools, workplaces, and American politics (Hirschman, 2005).
With the passage of immigration restrictions in the 1920s, followed by the Great Depression in the 1930s and World War II in the 1940s, the flow of immigrants dropped to record lows (Figure 2-1). The decline in the stock of the foreign-born population lagged the drop in flows but followed the same temporal trend, reaching a low of less than 5 percent in 1970. During the long immigration pause in the mid-20th century, the decline of the stock of second generation followed suit with a lag, reaching a low of 12 percent in 1970 and 10 percent in 1980. In the early 20th century, the center of gravity in immigrant communities was in the working-age first generation and their youthful progeny. By midcentury, the foreign-born population was diminished by the lack of new arrivals and a rising death toll among this aging population. The second generation was somewhat younger, but its ranks also began to shrink during the middle decades of the century as that population aged and the fertility of the foreign-born population fell.
The 1965 Immigration Act is typically used to date the beginning of a new era of mass immigration. But implementation of the new immigration quotas was delayed for several years, and it might be better to consider
1970, which recorded the nadir in the size of the foreign-born population, as the start of the new age of mass migration. The absolute size of the foreign-born population rose from less than 10 million in 1970 to 45 million in 2015, while the fraction of foreign-born in the total population rose steadily to reach 14 percent in 2015—slightly below the levels experienced a century earlier. The significance of the second generation is obscured in Figure 2-2 because the rising numbers of children of the post-1965 immigrants are counterbalanced by deaths among much older members of the second generation, who were the children of early 20th century immigrants. Since 2000, however, the “new” second generation has expanded rapidly from 24 million in 2000 to 38 million in 2015 (that is, from 10% to 12% of the population). At present, in 2016, one in four Americans is an immigrant or the child of an immigrant.
Before discussing the projections of the future stock of foreign-born in Figure 2-2, it is useful to review the dynamics of recent immigration since the Great Recession. In the early 2000s, immigration continued at more or less the same pace as in the immediately prior decades. Data from the American Community Survey (ACS) showed a continued rise in the foreign-born population, as did the estimates of the undocumented immigrant population, which reached a peak of 12.2 million in in 2007 (Passel et al., 2013). However, there were signs that Mexican immigration was beginning to decline in the early years of the decade (Passel et al., 2013). For the last three decades of the 20th century, Mexican immigration, much of it unauthorized, had been the largest component of the post-1965 immigration wave. The slowdown in Mexican immigration has several sources. The deep-rooted cause is slower growth of the Mexican population in the young working ages due to sharp fertility declines in the 1980s and 1990s. Mexico’s total fertility rate plunged from 6.8 births per woman in 1970 to 2.2 by 2006 (Johnson and Stoskopf, 2010). When children of the high-fertility era came of age between 1980 and 2000, a very large wave of young people sought job opportunities across the border in Texas and California, later dispersing across the United States. After 2007, owing in part to Mexico’s fertility decline, relatively fewer young people pursued jobs in the United States; with an improved Mexican economy, many more were absorbed into the workforce at home.
Despite the huge increase in personnel and other costs of border enforcement, the size of the foreign-born Mexican-origin population in the United States increased from 2.2 million in 1980 to 11.7 million in 2010 (Greico et al., 2012). A little more than half the foreign-born Mexican-origin population currently in the United States may be unauthorized (Passel et al., 2013). Massey and Pren (2012) have argued that the hardening of the U.S.-Mexican border had a modest impact on the likelihood of young Mexicans crossing the border, but it raised the costs of doing so and there-
fore discouraged return migration once migrants had entered the United States. Traditionally, much of migration from Mexico to the United States had been circular, often traveling for seasonal employment and with only a minority settling permanently in the United States. With the higher costs of border crossing, however, many young Mexican workers opted to settle permanently in the United States rather than risk detection by undertaking multiple crossings. Thus the border hardening yielded the unexpected result of increasing the immigrant population of Mexican origin, and their subsequent children, who permanently resided inside the United States.
The impact of the 2007-2009 Great Recession on Mexican migration was qualitatively different from that of prior downturns. The effects of the high unemployment rate, including the especially sharp decline in construction jobs, which had often been filled by Mexican immigrants, caused the net migration rate from Mexico to fall to zero, or perhaps even to turn negative, as the numbers of returning migrants equaled or surpassed those of new arrivals (Passel et al., 2013). A recent report by the Pew Research Center claims that since 2009, more Mexicans left the United States than entered—reversing the direction of the largest single-country flow since 1970 (Gonzalez-Barrera, 2015). Contributing to this overall decline in Mexican immigration has been a drop in the absolute number of undocumented immigrants in the United States in part due to an increase in their removals and deportations (Massey and Pren, 2012).
Since 2000, even as immigration from Latin America, and Mexico in particular, was decreasing, an increasing share of immigration has come from Asia. In absolute numbers, recent arrivals over the prior 5 years from Asia rose from 323,000 in 1970 to 2.5 million in 2013 (Pew Research Center, 2015a, pp. 36-37). Since 2008, various measures have shown more Asian immigrants arriving in the United States than Hispanics). Recent data, however, show that increases in immigration from Central America have reduced the gap between Asian and Hispanic immigration (ibid).
To summarize, there seem to be two distinct periods of immigrant flows into the United States during the early 21st century. The first was from 2000 to 2007, when the foreign-born population continued the high pace of arrivals recorded in the 1990s. The second period began after 2008, when the recession caused a sharp slowing of immigration from Mexico and Latin America. The economic conditions that dampened the flows of unauthorized immigration have had much less impact on legal immigration based on family reunification, much of which is coming from Asia.
The Pew Research Center projections in Figure 2-2, which incorporate the recent slowdown in unauthorized migration, show only modest increases in the size of the foreign-born population from 45 million in 2015 to 48 million in 2020 and to 57 million in 2030. The share of the foreign-born as a fraction of the total population is predicted to rise slowly to 14
percent in 2020 and to 15 percent in 2030. These projections are roughly comparable to those published by the Census Bureau, but there are minor differences in methods and assumptions (Pew Research Center, 2015a, Ch. 2; U.S. Census Bureau, 2014). The second generation is predicted to rise to 13 percent in 2020 and 14 percent in 2030. Whereas the projected share of the foreign-born in the total population is comparable to the actual share a century earlier, the share of the second generation is projected to be roughly half as large as a century ago, due to the much lower fertility of immigrants today.
2.6 IMMIGRATION AND CHANGES IN RACE AND ETHNIC COMPOSITION
Immigration has been the major demographic driver of changes in the racial and ethnic composition of the U.S. population since the settlement of North America several centuries ago (Klein, 2004). However, for much of the country’s history, the diversity of its population was not measured because of the limited scope of questions in the Decennial Census. For example, Native American populations were only enumerated after they were settled on reservations or in government-administered areas. Religion has never been included in Decennial Censuses. While the list (and definition) of racial and ethnic groups has varied considerably over the past two centuries, ethnic differentiation within the white population was not measured in Decennial Censuses from 1850 through 1970, a period when much of the concern about immigration was driven by diverse countries of origin among white European immigrants.
Table 2-3 shows the racial and ethnic origins of the resident American population in 1900, 1970, 2000, 2010, and 2014. In 1900, the United States was in the middle of the peak years of immigration from Southern and Eastern Europe, while 1970 was just before the massive contemporary wave of immigration from Latin America and Asia. The racial and ethnic classification in Table 2-3 is a blend of pre-2000 and post-2000 categories, with the following major groups: White (non-Hispanic), American Indian/Alaskan Native (non-Hispanic), African American (non-Hispanic), Latino/Hispanic/Spanish, Asians and Pacific Islanders (non-Hispanic) and “mixed race” (non-Hispanic). Data on persons with multiple race identities (two or more races) were first available in the 2000 Decennial Census and starting in 2003 in the CPS.
Almost half of Hispanics report themselves to be white, and about one-third write in a Hispanic national origin category in response to the race question. In Table 2-3, all Hispanics, regardless of their response to the race question, are classified as “Latino/Hispanic/Spanish.” The 1900 and 1970 data are based on public use microdata derived from the Decennial
| Race and Ethnic Identity | Percentage Distribution | ||||
|---|---|---|---|---|---|
| 1900 | 1970 | 2000 | 2010 | 2014 | |
| White (non-Hispanic) | 87.3 | 83.3 | 69.6 | 64.0 | 62.3 |
| 3rd-plus generation | 53.8 | 69.0 | 62.4 | 57.4 | 56.1 |
| 1st and 2nd generation | 33.5 | 14.3 | 7.2 | 6.7 | 6.3 |
| American Indian/Alaskan Native (non-Hispanic) | 0.3 | 0.3 | 1.0 | 0.7 | 0.8 |
| African American (non-Hispanic) | 11.7 | 10.9 | 12.9 | 12.0 | 12.1 |
| 3rd-plus generation | 11.7 | 10.7 | 11.4 | 10.4 | 10.1 |
| 1st and 2nd generation | 0.1 | 0.3 | 1.5 | 1.6 | 1.9 |
| Latino/Hispanic/Spanish | 0.5 | 4.6 | 11.5 | 16.4 | 17.3 |
| 3rd-plus generation | 0.2 | 2.1 | 3.1 | 4.5 | 5.1 |
| 1st and 2nd generation | 0.3 | 2.5 | 8.5 | 11.9 | 12.2 |
| Asian American & Pacific Islander (non-Hispanic) | 0.1 | 1.2 | 4.9 | 5.1 | 5.6 |
| 3rd-plus generation | 0.0 | 0.2 | 0.5 | 0.4 | 0.5 |
| 1st and 2nd generation | 0.1 | 1.0 | 4.5 | 4.7 | 5.1 |
| Race and Ethnic Identity | Percentage Distribution | ||||
|---|---|---|---|---|---|
| 1900 | 1970 | 2000 | 2010 | 2014 | |
| Mixed Race (non-Hispanic) | NA | NA | NA | 1.8 | 1.9 |
| 3rd-plus generation | NA | NA | NA | 1.4 | 1.5 |
| 1st and 2nd generation | NA | NA | NA | 0.3 | 0.4 |
| TOTAL | 100.0 | 100.0 | 100.0 | 100.0 | 100.0 |
| Race and Ethnic Identity | Population Count (thousands) | ||||
| 1900 | 1970 | 2000 | 2010 | 2014 | |
| White (non-Hispanic) | 65,637 | 169,435 | 191,228 | 194,814 | 195,399 |
| 3rd-plus generation | 40,433 | 140,334 | 171,359 | 174,537 | 175,717 |
| 1st and 2nd generation | 25,204 | 29,101 | 19,869 | 20,277 | 19,682 |
| American Indian/Alaskan Native (non-Hispanic) | 196 | 691 | 2,801 | 2,234 | 2,448 |
| African American (non-Hispanic) | 8,810 | 22,257 | 35,424 | 36,589 | 37,783 |
| 3rd-plus generation | 8,761 | 21,731 | 31,311 | 31,621 | 31,738 |
| 1st and 2nd generation | 49 | 526 | 4,113 | 4,968 | 6,045 |
| Latino/Hispanic/Spanish | 401 | 9,289 | 31,660 | 49,797 | 54,253 |
| 3rd-plus generation | 146 | 4,292 | 8,384 | 13,687 | 16,115 |
| 1st and 2nd generation | 255 | 4,997 | 23,276 | 36,109 | 38,139 |
| Asian American & Pacific Islander (non-Hispanic) | 142 | 2,465 | 13,597 | 15,486 | 17,510 |
| 3rd-plus generation | 31 | 495 | 1,339 | 1,285 | 1,496 |
| 1st and 2nd generation | 111 | 1,970 | 12,258 | 14,200 | 16,014 |
| Mixed Race (non-Hispanic) | 5,362 | 6,002 | |||
| 3rd-plus generation | 4,302 | 4,654 | |||
| 1st and 2nd generation | 1,060 | 1,349 | |||
| TOTAL POPULATION | 75,186 | 203,302 | 274,709 | 304,282 | 313,395 |
NOTE: For this table, the categories of White, American Indian, Asian American, and Pacific Islander exclude those identified as Hispanic, to avoid double-counting. All those who identified as Hispanic are included in the category for Latino/Hispanic/Spanish. In this table as throughout the report, “3rd-plus generation” refers to all U.S. residents with two native-born parents.
SOURCES: 1900 and 1970 Decennial Census Public Use Microdata Sample file, available: http://www.ipums.org/usa/ [November 2016]. 2000 CPS from Merged 1998 to 2002 CPS Public Use Microdata Sample file, available: https://cps.ipums.org/cps/ [November 2016]. 2010 and 2014 CPS Public Use Microdata Sample file, available: https://cps.ipums.org/cps/ [November 2016].
Censuses for those years, while data for 2000, 2010, and 2014 are based on the CPS. Within each ethnic-origin category (except American Indian), the third-plus generation2 population is distinguished from the combined first and second generation (immigrant stock) population.
One indicator of the long-resident U.S. population of European origin is the category in Table 2-3 for third-plus generation non-Hispanic white. This group’s share of the total U. S. population has hardly changed from 1900 to 2014. Just over half of the American population (54%) was in this category at the turn of the 20th century, and the share was only slightly higher (56%) in 2014.
In 1900, about 12 percent of the U.S. population was of African (or part African) origin. Because most African Americans lived in the South prior to the Great Migration (from 1915 to 1960), they had only a small presence in the rest of the nation—generally only a few percentage points. Other minority groups, including Native Americans, Hispanics, and Asians combined, comprised only 1 percent of the total population in 1900.
The major source of ethnic diversity in 1900 was within the white (European-origin) population. About one in three Americans in 1900 consisted of whites who were foreign born or had at least one foreign-born parent. This fraction rose to almost half of the population outside the South and to a substantial majority of the population in the largest cities. As discussed earlier, many old stock Americans considered immigrants of Eastern and Southern European origin to be socially and racially inferior. During this period, the Daughters of the American Revolution and similar groups were organized to stress their ancestral origins and to distance themselves from the new immigrants. College fraternities and sororities, social clubs, and many professions established racial, religious, and ethnic barriers to exclude the new immigrants and their descendants (Baltzell, 1964; Lieberson, 1980).
During the middle decades of the 20th century, the second generation (and much of the first generation) population assimilated into American life. Through generational succession, immigrant communities became ethnic communities (often of mixed ancestry) that celebrated their roots through memory, cuisine, annual festivals, and embellished Hollywood stories. Through intergenerational economic mobility and broadly shared economic prosperity, most of the children and grandchildren of Italian, Irish, and Eastern European immigrants joined the American middle class. Rather than the pressurized assimilation endured by their parents during the Americanization movement of the early 20th century, economic integration and social mobility of children and grandchildren of Eastern and
___________________
2 As noted in Chapter 1, throughout this report “third-plus generation” is used as shorthand for all U.S. residents whose parents are native-born Americans.
Southern Europeans were facilitated by postwar economic growth, the GI Bill for World War II veterans, the expansion of public higher education, and suburban development (Alba and Nee, 2003; Duncan and Duncan, 1968; Katznelson, 2005; Lieberson, 1980).
With the gradual acceptance of the descendants of Southern and Eastern Europeans as part of the majority white population, the U.S. ethnoracial landscape in the post–World War II era was focused on the black-white divide. By the 1970 Decennial Census, fully 94 percent of the population self-identified as either white (83%) or African American (11%). For African Americans, who had long been denied equal opportunity on the basis of skin color, the Civil Rights Movement of the 1950s and 1960s was the struggle to redress more than two centuries of segregation and government-sanctioned discrimination. The Great Migration of African Americans to cities in the Northeast and Midwest and to some places on the West Coast made the black-white divide a national issue. Although geographically concentrated in a few major cities and states (California, New York, and Texas), by 1970 the growing Latino presence was felt as activists demanded ethnic identification and social recognition (Mora, 2014).
The 1965 amendments to the Immigration and Nationality Act replaced the infamous, restrictive immigration quotas by national origin of the Immigration Act of 1924 with a preference system based on principles favoring family reunification and certain highly skilled professions. Although Congress may have assumed that there would only be modest increases in the numbers of immigrants and their composition following the 1965 changes in immigration law, the long-term impact was to open the door to a new wave of mass immigration. Not only did annual immigration flows increase but the annual flows of legal immigrants from Asia surpassed that of legal immigrants from Latin America within a dozen years (Tienda, 2015). A less documented trend is a shift in the age composition of LPRs toward older ages, which is a predictable outcome of expanding the definition of immediate family members to include parents (Carr and Tienda, 2013). Accompanying these shifts in legal immigration was the advent of large-scale settlement of undocumented immigrants, mainly from Latin America. By the early 2000s, the numbers of new arrivals of unauthorized immigrants exceeded arrivals of legal immigrant in some years (Passel and Suro, 2005, p. 5).3
This wave of immigration from Latin America and Asia gained momentum during the last quarter of the 20th century and into the 21st cen-
___________________
3 For additional detail on changes in the unauthorized population, see Figure 1-17, which charts the number of undocumented immigrants in the United States from 1990 to 2013, and surrounding discussion in the report of our sister panel (National Academies of Sciences, Engineering, and Medicine, 2015).
tury, further diversifying the U.S. population. The number of Hispanics expanded fivefold from less than 10 million in 1970 to more than 50 million in 2014—representing about 17 percent of the total population. Asians and Pacific Islanders have had an even higher rate of growth—from 1.5 million in 1970 to 17.5 million in 2014—and currently represent over 5 percent of U.S. residents. Assuming the current mix of immigrants continues, Pew Research Center (2015a, p. 119) population projections suggest that Asians could comprise 14 percent of the U.S. population by 2065 and Hispanics 24 percent.
Immigration is driving the increase in population diversity. As shown in Table 2-3, about two-thirds of all Hispanics and 9 in 10 Asian and Pacific Islanders are either foreign born or children of immigrants. Since 1970 there has been an important but much smaller increase in the African American population of immigrants and the children of immigrants.
U.S. population diversity now commands the attention of politicians, bureaucrats, and the general public as electronic and print media report new demographic milestones, such as the rise of majority-minority states and localities. Table 2-3 shows that the percentage of the non-Hispanic white population, which was 87 percent of the total population in 1900 and still 83 percent in 1970, declined to just 62 percent by 2014. The Census Bureau projects that by 2060 non-Hispanic whites will represent 43 percent of the U.S. population (Colby and Ortman, 2015, p. 9; also see Pew Research Center, 2015a).
These projections rest on several arbitrary assumptions about the nature of race and ethnic identities, mainly that racial groups can be defined in categories that are mutually exclusive and not overlapping, and foremost for projections, that the membership in these categories remains distinct over several decades. Given the overlap that already occurs between those who identify as Hispanic and also identify with one of the “race” categories, as well as the trend toward more intermarriage across these ethnoracial boundaries, projections by race and Hispanic origin must rely on today’s categories, which are increasingly hypothetical for the future. Perhaps they are best thought of as projections of the future population based on the predominant “origins” of that population as represented in today’s categories. Predictions about the future ethnic composition of the United States certainly should not be treated as projections of the identities that will be expressed by future residents of America.
2.7 POPULATION AGING, THE BABY BOOM, AND THE TRANSITION TO AN IMMIGRANT WORKFORCE
The age structure of a population, the relative shares of old and young, has an important influence on economic welfare, social mobility, and the
resources available to support the elderly and children. At a given time, the age structure of a population is a reflection of the numbers of births in prior years and their survival, as well as the volume and age composition of immigrants. The most important of these factors is fertility. Societies with high fertility rates invariably have youthful populations with high fractions of children, adolescents, and young adults. Low-fertility societies have larger fractions of older persons, including the elderly.
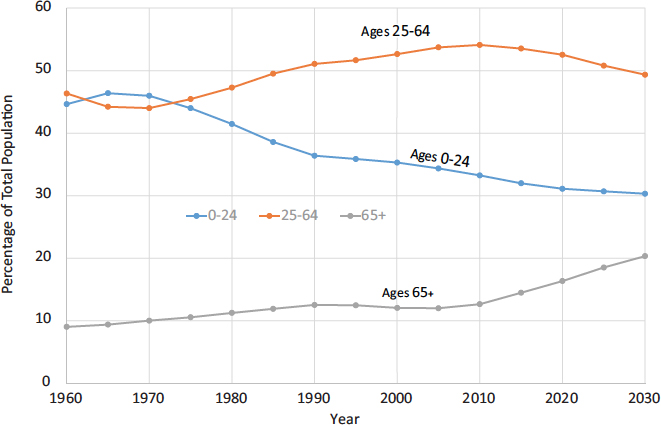
The Baby Boom, those Americans born from the late 1940s to the mid-1960s, actually reversed the aging of the American population for several decades. The very large birth cohorts during this period rippled through the age structure of the American population over the past half-century. This trend is shown in Figure 2-3 with the fraction of the national population in three broad age categories of 0-24, 25-64, and 65 and above, from 1960 to the present and then projected to 2030 based on the Pew Research Center’s population estimates and projections (Pew Research Center, 2015a).
The most distinctive feature of the population in 1960, at the peak of the Baby Boom, was the relative abundance of children and youth and the relative scarcity of the elderly. With less than 1 in 10 Americans above age 65, the costs of Social Security (and Medicare, which was implemented
SOURCE: Pew Research Center (2015a).
in 1965) were easily covered with modest levels of taxation. The costs of youthful dependents, for schooling in particular, were substantial, but the benefits were broadly distributed to most households with children. The costs of child care were primarily borne by families and by women in particular.
The population share of children and youth fell sharply by 10 percentage points from 1970 to 1990 and has continued to decline, but more gradually, in recent years. The share of the elderly has increased very slowly over the same period, rising from 9 percent in 1960 to 12 percent in 2005. However, the rate of change in population aging has accelerated in recent years, and the share of elderly is predicted to reach 16 percent in 2020 and 20 percent in 2030. The population share in the prime working ages, 25-64, rose for several decades after 1970 and was about 54 percent of the total population from 2005 to 2015. As the large Baby Boom cohorts—those born from 1946 to 1964—become senior citizens in the years following 2010, the population share in the prime working ages will decline, dropping below 50 percent by the late 2020s.
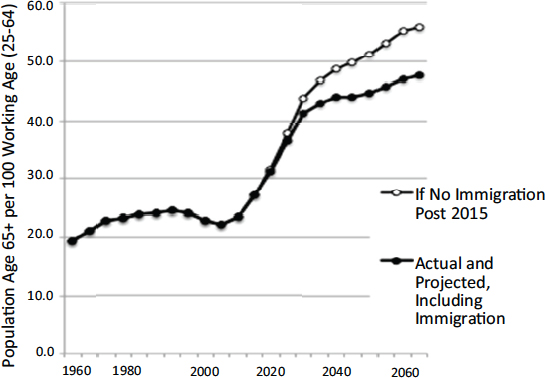
Changes in the age structure and the growth of the elderly population exert a fundamental constraint on public finances. In a “pay as you go” system, public funds for the elderly are a function of the generosity of the program, taxes paid by the working population, and the relative numbers of workers and beneficiaries. In essence, the support of dependent-aged populations rests on the number of working-age Americans. Figure 2-4 displays the ratio of seniors ages 65 and older to working ages 25 to 64, in a variation of demographers’ traditional old-age dependency ratio, but with working age beginning at 25. Of course, people ages 18 to 24 also can be workers, but in modern postindustrial nations more often they are of “training age,” enrolled in higher education or engaged as interns and apprentices, and so they are not yet productive enough to contribute to supporting the seniors. Similarly, people over age 65 also can be workers themselves, but retirement follows for most soon after this age, and old-age support programs have eligibility at 65 (Medicare) and 67 (Social Security’s full retirement age).
What is most striking about Figure 2-4 is that the senior ratio (sometimes called the old-age dependency ratio) remained relatively constant, with between 19 and 24 seniors per 100 working-age population, from 1960 to 2010, after which it is projected to rise sharply (based on the Pew 2015 projection data). The oldest Baby Boomers crossed the age 65 threshold in 2011, and by 2015, the ratio has already climbed to 27.1. In the next 25 years, by 2040, the ratio is projected to reach 44.0. This increase of 16.9 in the senior ratio reflects the growing weight of the entitlement programs carried by a relatively smaller working-age population.
The current level of youthful immigration to the United States is not sufficient to completely reverse population aging or to rejuvenate low-
SOURCE: Myers (2012) and unpublished estimates by Pew Research Center (2015a).
fertility populations (Schmertmann, 1992; United Nations Population Division, 2001). As noted earlier, 1 million new immigrants per year is less than one-third of 1 percent of 300 million people that comprise the American population. But the small effect of immigration on population aging is not inconsequential (Lutz and Scherbov, 2006). To demonstrate the impact of immigration on population aging, one can compare old age ratios in projections that include or exclude immigration using the method developed by Myers (2012). If one hypothetically removes immigration after 2015, including the future descendants of those immigrants, it is possible to compare the future changes in the senior ratio over several decades. These data have already been applied in Figure 2-4, but the calculation of how large a difference immigration makes requires more detail.
As demonstrated in Table 2-4, population projections can be compared for the key ages with and without immigration. Without any immigration after 2015, the older population grows to a ratio of 55.9 seniors per 100 working-age adults in 2065, compared with 47.5 if immigration is included. Even in the first 25 years, by 2040, the ratio without immigration is projected to reach 48.8, an increase of 21.7, ve¡rsus an increase of 16.9 if immigration continues as projected. In effect, already by 2040, the absence of immigration in the population projection would lead to growth of the senior ratio that is about one-quarter (28.1%) greater than if immigration
TABLE 2-4 Population Aging in Projections That Include or Exclude Immigration
| Population (thousands) | Senior Ratio (65+/25-64 × 100) | Growth in Ratio | |||||||
|---|---|---|---|---|---|---|---|---|---|
| 2015 | 2040 | 2065 | 2015 | 2040 | 2065 | 2015-2040 | 2040-2065 | 2015-2065 | |
| Including Projected Immigration | |||||||||
| 25-64 | 173,195 | 187,554 | 213,252 | ||||||
| 65 and older | 46,853 | 82,512 | 101,333 | 27.05 | 43.99 | 47.52 | 16.94 | 3.52 | 20.47 |
| Assuming No Immigration 2015 to 2065 | |||||||||
| 25-64 | 173,195 | 164,620 | 158,345 | ||||||
| 65 and older | 46,853 | 80,278 | 88,469 | 27.05 | 48.77 | 55.87 | 21.71 | 7.11 | 28.82 |
| Percentage Change in the Senior Ratio in the Absence of Immigration | 28.17 | 101.61 | 40.81 | ||||||
SOURCE: Pew Research Center (2015a).
proceeds as projected and, after 50 years (by 2065), it would increase this indicator of aging by 40.8 percent. Clearly, immigration cannot fully stop population aging, but it can partially slow its effects. As can be seen in the table, immigrants (and descendants) add to the working-age population much more than to the elderly population. Not all grow old at once, and even after immigrants age, their children continue to pay a dividend toward old age support.
Belonging to the working-age population does not directly translate into employment—this depends on labor force behavior. In general, foreign-born men are slightly more likely to be employed than their native-born peers, especially after the first few years of adjustment following immigration (Duncan and Trejo, 2012; National Academies of Sciences, Engineering, and Medicine, 2015, Ch. 6). The gap is widest among men with a high school or less than high school education. Over a quarter of low-educated men in the third-plus generation are not employed, whereas the employment-to-population ratio of foreign-born men is very high across the education spectrum. The difference in employment ratios between foreign-born and native-born men is due mainly to differences in labor force participation and not to unemployment. Native-born men have some options—advanced education, early retirement, disability—that are not as readily available to foreign-born men, especially those who are unauthorized immigrants.
Among women, larger nativity differentials in labor force participation are common. Immigrant women are somewhat less likely (about 5 to 10 percentage points) to be employed than their third-plus generation peers in the same racial and ethnic group (the pattern is reversed for those with less than a high school education). The main differences in employment here are due to the high percentage of immigrant women staying home with young children; their labor force participation rate now resembles that of native-born females during the 1970s (which was much higher than it had been, say, in the 1950s, but still far from its peak around the year 2000). Second generation women are, however, just as likely to be working as their third-plus generation peers (National Academies of Sciences, Engineering, and Medicine, 2015, Ch. 6).
As the Baby Boom cohorts age and exit from the labor force in the coming decades, immigrants and their children will play an even larger role in the American economy. To provide an historical perspective on future trends, Table 2-5 and Figure 2-5 report the net population change (in thousands) in the working-age population, ages 25-64, by immigration generation for each decade from 1960 to 2010, with projections added for 2020 and 2030 (Pew Research Center, 2015a). The net change in the working-age population is the balance between the numbers turning age 25 (new entrants) relative to those turning age 65 (those exiting) during the decade. Among the first generation, net change is the inflow of new
| Time Period | Net Change in Resident Working-age Population (thousands) | |||
|---|---|---|---|---|
| Total | Immigrant Generation | |||
| First | Second | Third-plus | ||
| 1960 to 1970 | 6,317 | –526 | –1,949 | 8,793 |
| 1970 to 1980 | 17,195 | 2,597 | –3,092 | 17,690 |
| 1980 to 1990 | 22,373 | 5,346 | –2,564 | 19,591 |
| 1990 to 2000 | 19,637 | 8,703 | –920 | 11,854 |
| 2000 to 2010 | 19,243 | 9,576 | 1,462 | 8,205 |
| 2010 to 2020 | 8,992 | 4,548 | 3,954 | 490 |
| 2020 to 2030 | 2,009 | 2,093 | 6,939 | –7,022 |
SOURCE: Pew Research Center (2015a).
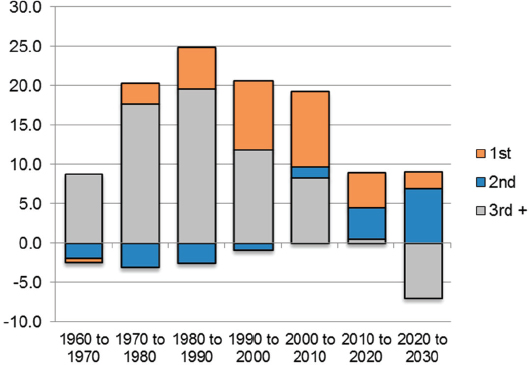
SOURCE: Table 2-5 data, Pew Research Center (2015a).
immigrants minus the number of retiring or departing migrants. Among the second and third-plus generations, net change is driven by the size of cohorts that were born 25 years earlier relative to those born 65 years ago (those entering and leaving the working-age population). A large wave of new immigrants and their childbearing will trigger a subsequent large wave of births of second generation children, who will become workers approximately two decades later.
From 1960 to 1970, the working-age population grew by a little more than 6 million—a slow expansion driven by the relatively small birth cohorts that occurred in the late 1930s and early 1940s. The figure of 6 million additional working-age people reflects the balance of a net increase of almost 9 million in the third-plus generation population and a net decrease of almost 2.5 million in first and second generation populations. These figures reflect the mortality experience and aging out of the workforce (attaining age 65) of immigrants and children from early in the 20th century, before the long immigration pause. In short, the foreign-born population in 1960 was composed mainly of the elderly survivors of the early 20th century immigration. The figure of 6 million persons added to the working-age population during the 1960s is dwarfed by the population changes that follow over the next few decades.
Between 1970 and 2010, the working-age population expanded by about 20 million net workers each decade. From 1970 to 1990, the growth was entirely due to Baby Boom cohorts in the third-plus generation reaching working age. Immigration added to the ranks of potential workers, but much of the increase was canceled out by aging of the second generation (i.e., children of early 20th century immigration). Subsequently, in the last decade of the 20th century, the share of the increase in working-age population due to net immigration rose, not only because the inflow of immigrants increased but also because the additions to the third-plus generation of working age slowed to only 12 million.
The 2000 to 2010 decade was a transitional period in terms of the share of growth in the working-age population contributed by immigrants. Overall growth held steady, with an increase of 17 million persons ages 25 to 64, but the increase from the third-plus generations slowed to 8 million, while the first and second generation working-age population increased by 9.5 and 1.5 million, respectively. These trends have accelerated since 2010 and are projected to continue through the 2020s. Growth of the third-plus generation is all but vanishing, with almost all of the 9 million net additions to the working-age population coming from the ranks of the first and second generations. The high relative growth of the second generation reflects the increases in immigration after 1970; the children of those immigrants are now coming of age, and new immigrants continue to make net additions to the working-age population.
The decade after 2010 marks a major turning point. The leading edge of the Baby Boom generation is aging into the retirement range (turning 65 and older), and their numbers are approximately equal to entry of younger third-plus generation persons in the working ages. Overall, the net growth of potential workers (ages 25-64) among third-plus generation cohorts will shrink to less than half a million from 2010 to 2020. At the same time, the Pew Research Center projections suggest that the net increase in the number of working-age foreign-born will also slow, falling by half between the decades 2000-2010 and 2010-2020. However, the second generation—the children of the post-1965 wave of immigrants—are projected to add almost 4 million net entrants to the working-age population, a much greater number than in earlier decades.
After 2020, the aging of the Baby Boom generation from 2020 to 2030 will begin to drain the potential workforce drawn from the ranks of the third-plus generation; a net departure from the working-age population of over 7 million is expected. From 2020 to 2030, modest growth of the population ages 25 to 64—projected as a net gain of only 2 million persons—will result because of the growth of the first and second generation population segments. Based on the projections by the Pew Research Center (2015a), the net gain of potential first generation workers will slow to 2 million in the 2020s. This number is less than half that of the 2010-2020 decade and lower than any decade since 1970, reflecting the fact that earlier immigration cohorts are reaching retirement ages.
The projected changes in size of the working-age population from 2010 to 2030 are almost entirely due to the aging of persons already born and living in the United States. Assumptions about future mortality and emigration rates create a bit of uncertainty in the projections but not much. If the American economy grows and requires more workers both to replace those who retire and to create new firms and industries, the primary source of labor will be first and second generation immigrants. This basic fact will hold at all levels, from low-skilled service jobs to professionals with postgraduate degrees. It bears repeating that the reason the third-plus generation cannot be a source of workforce growth is that so many of the older members from this population segment will be aging past 65. Many young people who are third-plus generation Americans will be joining the working-age population, but they will simply be outnumbered by the flood of departing Baby Boomers. These Baby Boom departures are expected to create employment opportunities that will benefit all ethnoracial groups. For instance, Richard Alba (2009) has argued that, similar to the World War II period, this coming period could create ideal conditions for reducing competitive frictions between groups and reducing inequality among minority groups and immigrants.
In addition to its impacts on employment and future economic growth, the volume and age composition of the immigrant population also has implications for public expenditures on education, old-age security, and health care. The working ages are also the primary ages of family formation. Foreign-born women will bear an increasing share of future births in the United States. However, as discussed above, all groups in the United States appear to be converging to replacement-level fertility (two children per woman) or below by the second generation. Currently, first and second generation immigrants comprise about one of four children in schools. Their schooling generates expenditures, but it is also an investment in their future productivity and the well-being of the rapidly growing elderly population of Baby Boomers (Myers, 2007).
The post-1965 immigrants also are beginning to retire and to become eligible for Social Security and Medicare. There is also some evidence that late-age immigration has been increasing somewhat (Batalova, 2012; Carr and Tienda, 2013; Terrazas, 2009). Carr and Tienda (2013) used administrative data to examine changes in the age composition of immigrant inflows since 1980; they found that approximately two-thirds of all LPRs admitted between 1981 and 2009 were in their prime working ages. Concurrently, immigration of persons above age 65 increased, rising from about 11 percent of new LPRs admitted between 1981 and 1985 to nearly 17 percent of new admissions between 2006 and 2009. This increase is consistent with claims by Jasso and Rosenzweig (1989), who attribute this rise in older-age immigration primarily to sponsorship of parents by naturalized immigrants and to a lesser extent to the visa backlog for numerically capped relatives of naturalized immigrants. Other studies have found that numerically capped relatives from the top four sending nations contributed to late-age immigration because their family members aged while waiting in long queues for their visa priority number to be called (Tienda, 2015; Wasem, 2012).
2.8 FROM TRADITIONAL GATEWAYS TO NEW DESTINATIONS: THE CHANGING GEOGRAPHY OF IMMIGRANT SETTLEMENT
The geographical distribution of immigrants across the United States has been a function of initial patterns of settlement and subsequent patterns of internal migration. The initial pattern of settlement is sometimes affected by proximity, favoring seaports of first arrival and places near border crossings. The concentration of 19th century Irish immigrants in Boston and New York and of Cubans in south Florida in the 1960s and 1970s is illustrative of the importance of proximity. Locations of economic opportunity and of established co-ethnic communities are also important determinants of settlement patterns. In the early 20th century, high labor
demand drew immigrants to work in steel mills in Pittsburgh and Buffalo and to coal fields in Pennsylvania, as do present-day meat packing plants in small towns in North Carolina and the Midwest. Even more important than arrival proximity is the presence of families and friends who can provide temporary housing, assistance in finding jobs, and the warmth of welcome based on ties of kinship and mutual obligation. These same factors affect the secondary, internal migration of immigrants after arrival. In the 1960s and 1970s, the federal government sought to settle Cuban and Vietnamese refugees in isolated small towns throughout the country in a misguided effort to spur assimilation (Portes and Bach, 1985). Most of these families eventually moved to cities that had concentrations of their ethnicity, where they found family and relatives who could provide economic opportunity and also understand their cultural and spiritual needs.
The descendants of immigrants have less connection to the churches, institutions, and neighborhoods favored by their immigrant forebears, and they tend to move to suburban locations with more amenities and to other states and localities that offer attractive economic opportunities. Many cities and locations within cities retain an ethnic character across generations, but it usually takes a continuous flow of immigrants to maintain the social and economic vitality of an ethnic community. The deconcentration and dispersal of immigrant communities, as with the general process of assimilation, is a multigenerational process that occurs unless discrimination or other institutional factors obstruct economic and social mobility.
The initial settlement patterns of the post-1965 immigration wave follow the logic of earlier immigration flows, except that the origins of the immigrants shifted from Europe to Latin America and Asia. Most new arrivals during the 1970s and early 1980s settled in five gateway states:4 New York along the eastern seaboard; California and Texas along the southern border; Illinois in the heartland; and Florida in the southeast (Hirschman and Massey, 2008; Tienda, 2002). Immigrants registered a visible presence in another five states—Maryland, Massachusetts, New Jersey, Virginia, and Washington—which, together with the traditional destination states, housed over 80 percent of the foreign-born population until 1990 (Massey and Capoferro, 2008). With the exception of Texas and California, where proximity to the Mexican border facilitated recruitment of temporary workers into agricultural jobs throughout the 20th century, most of the initial post-1965 immigrants were concentrated in large urban centers (Singer, 2004).
___________________
4 This discussion follows Massey and Capoferro’s (2008) classification of states. New Jersey could certainly be considered among the major immigration destination states since in recent decades it at least matches Illinois in terms of the share of new settlers, number of foreign-born, and share of foreign-born.
Beginning in the late 1980s and with greater momentum in the 1990s and 2000s, the foreign-born population witnessed a significant geographic dispersal. Labor demand was the primary factor driving the geographic scattering of the foreign-born population, particularly in industries that demanded unskilled and/or seasonal labor (Goodwin-White, 2012; Kandel and Parrado, 2005). Buoyed by low unionization rates suppressed by state right-to-work laws (U.S. Bureau of Labor Statistics, 2015a, Table 5), Southern states with histories of limited prior immigration and recent robust growth in labor demand were major beneficiaries of the dispersal toward nontraditional destinations. In addition, housing costs, school quality, public safety, and other amenities also attracted newcomers away from the traditional gateways and toward other destinations (Lichter and Johnson, 2009; Singer, 2004, 2009; Tienda and Fuentes, 2014). Among factors that pushed both settled immigrants and new arrivals away from the traditional gateways, Massey and Capoferra (2008) identified high unemployment rates, which coincided with growth in the availability of newly legalized workers, along with rising anti-immigrant sentiment and tighter border controls authorized by IRCA and selectively implemented at ports of entry along the U.S.-Mexico border.
Despite widespread agreement in the research literature that the effects of immigration are strongest in areas where immigrants are spatially concentrated, relatively few empirical studies have examined the initial settlement patterns and subsequent internal migration of immigrants. Available empirical studies suggest that internal migration rates are higher for immigrants than for the native-born. However, internal migration rates vary according to skill levels, regional origins, and legal status (Massey, 1987). Based on pubic use microdata from the U.S. Census Bureau, Bartel (1989) found large regional-origin differences in remigration following initial settlement, with Asians more likely than either Europeans or Latin Americans to engage in subsequent internal migration. Furthermore, internal migration tends to accentuate the spatial concentration of the foreign-born population, albeit differentially according to immigrants’ regional origins (Bartel, 1989; Edmonston, 2002). Both the propensity to migrate and spatial concentration patterns depend both on immigrants’ and their families’ characteristics and on their expectations regarding conditions in potential areas of settlement.
To illustrate the changing patterns of settlement of the post-1965 wave of immigrants, Table 2-6 shows the population of immigrants who arrived in the United States during six periods—1975-1980, 1985-1990, 1995-2000, 2002-2008, 2008-2010, and 2010-2104—by current state of residence in 1980, 1990, 2000, 2008, 2010, and 2014, respectively. The first three columns, for the pre-2000 periods, are taken from Massey and Capoferro’s (2008) classic analysis, based on “residence 5 years earlier” data from the 1980, 1990, and 2000 Decennial Censuses. The next three (post-2000)
| Group and State of Residence | Percentage Distribution of Immigrants Arriving in the U.S. (Census or CPS year shown in parentheses) | |||||
|---|---|---|---|---|---|---|
| 1975-1980 (1980) | 1985-1990 (1990) | 1995-2000 (2000) | Pre-Recession 2002-2008 (2008) | Recession 2008-2010 (2010) | Post-Recession 2010-2014 (2014) | |
| Big Five | ||||||
| Subtotal | 63.8 | 67.3 | 54.7 | 47.8 | 50.7 | 44.0 |
| California | 31.1 | 35.4 | 21.1 | 17.0 | 19.9 | 12.3 |
| New York | 12.9 | 13.5 | 9.9 | 7.5 | 7.9 | 8.4 |
| Texas | 8.5 | 6.8 | 10.2 | 10.2 | 8.9 | 9.3 |
| Florida | 5.8 | 7.2 | 8.2 | 9.2 | 9.5 | 9.8 |
| Illinois | 5.5 | 4.5 | 5.3 | 4.0 | 4.5 | 4.2 |
| Second Tier | ||||||
| Subtotal | 12.1 | 13.2 | 14.1 | 14.9 | 12.6 | 15.9 |
| New Jersey | 3.7 | 4.3 | 4.7 | 4.6 | 3.7 | 4.8 |
| Virginia | 1.9 | 2.3 | 2.5 | 3.0 | 2.2 | 3.1 |
| Maryland | 1.8 | 2.2 | 1.9 | 2.5 | 2.6 | 2.8 |
| Massachusetts | 2.6 | 2.8 | 2.6 | 2.8 | 2.2 | 2.8 |
| Washington | 2.1 | 1.6 | 2.4 | 2.0 | 1.9 | 2.4 |
| Third Tier | ||||||
| Subtotal | 18.5 | 15.6 | 25.5 | 24.7 | 22.6 | 23.9 |
| Georgia | 0.7 | 1.2 | 3.0 | 3.1 | 3.0 | 2.3 |
| Pennsylvania | 1.8 | 1.9 | 1.7 | 1.4 | 1.9 | 2.9 |
| Michigan | 1.9 | 1.3 | 2.0 | 1.7 | 1.2 | 2.9 |
| Arizona | 1.1 | 1.5 | 2.0 | 2.6 | 1.9 | 1.1 |
| North Carolina | 0.8 | 0.8 | 2.5 | 1.7 | 0.6 | 1.7 |
| Ohio | 1.4 | 1.0 | 1.5 | 1.3 | 1.3 | 1.7 |
| Connecticut | 1.0 | 1.2 | 1.2 | 1.3 | 1.6 | 1.3 |
| Minnesota | 0.5 | 0.6 | 1.2 | 1.4 | 1.8 | 1.4 |
| Colorado | 1.3 | 0.8 | 1.8 | 1.4 | 0.9 | 1.2 |
| Tennessee | 0.4 | 0.3 | 0.9 | 1.7 | 2.1 | 1.2 |
| Nevada | 0.5 | 0.5 | 1.1 | 1.0 | 0.9 | 1.1 |
| Oregon | 1.0 | 0.9 | 1.2 | 1.2 | 0.7 | 0.9 |
| Utah | 0.4 | 0.4 | 0.9 | 0.8 | 0.7 | 1.4 |
| Indiana | 0.6 | 0.3 | 1.0 | 0.7 | 1.0 | 0.2 |
| Hawaii | 1.4 | 0.9 | 0.6 | 0.5 | 0.8 | 0.4 |
| Wisconsin | 0.8 | 0.6 | 0.8 | 1.1 | 0.3 | 0.4 |
| Kansas | 0.6 | 0.5 | 0.6 | 0.5 | 0.2 | 0.8 |
| Missouri | 0.7 | 0.4 | 0.8 | 0.6 | 0.4 | 0.4 |
| Louisiana | 1.1 | 0.4 | 0.4 | 0.5 | 0.8 | 0.5 |
| Rhode Island | 0.5 | 0.5 | 0.3 | 0.3 | 0.4 | 0.3 |
| Other States | 5.6 | 3.9 | 5.7 | 12.6 | 14.0 | 16.1 |
| Total | 100.0 | 100.0 | 100.0 | 100.0 | 100.0 | 100.0 |
| Average Annual Number of Immigrants Arriving (thousands) | 274 | 766 | 1,146 | 1,196 | 1,267 | 1,287 |
| Theil’s Diversity Index | 70 | 66 | 77 | 80 | 78 | 82 |
NOTE: CPS = Current Population Survey.
SOURCE: Data from Flood et al. (2015) and Massey and Capoferro (2008, Table 1).
periods are selected to show the settlement patterns during the pre-recession period of 2002-2008, the years of the Great Recession (2008-2010), and the post-recession period (2010-2014). The data for these periods are based on a survey question about the year of arrival in the United States, which is included in both Decennial Censuses and the Annual Social and Economic Supplement (March round) of the CPS. The dates of arrival include the first few months of the year of interview (April for a Decennial Census and March for the CPS). The absolute number of immigrants in each data source is adjusted to annual averages (total arrivals/years since arrival).
The classic pattern of post-1965 immigrant concentration on the West Coast, East Coast, and a few other locations is evident in the column for 1980, which reflects the character of immigration in the late 1970s. During this period, 31 percent of recent immigrants were in California and 44 percent were in just two states: California and New York. There were also significant numbers of new immigrants in a few other states: Florida, Illinois, and Texas. More than 60 percent of all recent immigrants resided in these top five destination states. A closer look reveals that most of these immigrants resided in the major cities in these states: Chicago, Houston, Los Angeles, Miami, New York City, San Francisco, and a handful of other metropolitan areas. A second tier of states, including Maryland, Massachusetts, New Jersey,5 Virginia, and Washington, collectively housed 12 to 13 percent of immigrants, or about 2 to 3 percent each. Another 20 states, identified as “third tier” in Table 2-6, each had about 1 percent (more or less) of all recent immigrants each, for a total of 18 percent. Although the post-1965 wave of immigration was in full swing in the late 1970s—on average, more than a quarter million immigrants arrived annually during this period—the very concentrated patterns of settlement meant that the majority of the American population, especially in medium-size cities and small towns in the Midwest and South, had little contact with new immigrants.
The pace of immigration accelerated in the late 1980s with more than 760,000 arrivals annually, almost tripling the average from 10 years earlier. The patterns of immigrant settlement were even more concentrated in 1990 than in 1980, as confirmed by the decrease in Theil’s Diversity Index from 70 to 66.6 There was an increasing concentration of recent immigrant settle-
___________________
5 As noted above, New Jersey could reasonably be categorized in the first group, which would become the “big six.”
6 Geographical diversity of immigrants is measured with Theil’s (1972) entropy index,
![]()
where pi is the proportion of immigrant arrivals in state i and there is a total of n states. The index varies from 0 (all immigrants in one state) to 100 (an equal number of immigrants in each state).
ment in California, New York, and Florida, and some second tier states witnessed increased settlement of recent arrivals. Although many national political leaders thought the concentration of immigrants was a sign of slow assimilation, immigration researchers explained that the gravitation of immigrants to locations with dense social and business networks was not only the historical pattern but also the path most likely to lead to upward mobility (Portes and Rumbaut, 1990).
The 1990s were a period of rapid economic growth and also increased immigration; the average annual number of arrivals in the late 1990s rose to more than 1 million per year. It was also the beginning of a dispersed immigrant settlement pattern that generated many new immigrant destinations (Massey, 2008; Singer, 2004, 2009; Tienda and Fuentes, 2014; Waters and Jimenez, 2005). Although the vast majority of the foreign-born population continued to reside in large metropolitan centers (with more than half of the foreign-born population concentrated in just 10 metropolitan areas), immigrants’ spatial redistribution was particularly vigorous in states where few had previously settled, including small towns, suburban communities, and cities in Georgia, North Carolina, and several Midwestern states (Hirschman and Massey, 2008; Lichter and Johnson, 2009; Singer, 2009). As shown in Table 2-6, the Diversity Index rose from 66 to 77, indicating a very strong trend away from concentrated settlement.
Although gateway cities and states continued to receive the largest numbers of new immigrants, there were very large relative shifts of new immigrants away from California and New York. The diversion of immigrants away from California in the 1990s and continuing to recent years has been stunning. California’s share of the immigrant inflow plunged from 35.4 percent of the nation’s new arrivals in the latter half of the 1980s to 17.0 percent in the early 2000s (Table 2-6). The inflow corresponding to this 18 percentage point decline was distributed across many new places, each with a relatively small share of the total shift. The largest gains in foreign-born population share were 1.8 percentage points in Georgia and North Carolina. The shift has been explained by loss of job opportunities in California in the 1990s due to that state’s unusually deep and prolonged recession, combined with high housing prices as an added deterrent (Myers, 2007, Ch. 5). Once migration networks discovered the plentiful jobs and low costs across the South, much of the immigrant inflow was diverted away from California, save for selected high-skilled Asian immigrants and family reunification sponsored by California’s established base of more than 8 million foreign-born residents. The demographic renewal of depopulated nonmetropolitan areas brought by new immigrants has visibly altered the ethnic composition of rural America in a short period of time and has also infused new economic life into dwindling communities (Lichter and Johnson, 2009; Tienda and Fuentes, 2014). The geography of immigration
defies simple generalizations due to the enormous diversity of places and people involved.
The post-2000 patterns are even more complex, largely because of the Great Recession of 2008 to 2009, which interrupted the dispersal to new destinations. In Table 2-6, the panel examines three periods—2002 to 2008, 2008 to 2010, and 2010 to 2014—that provide pre-recession, recession, and post-recession comparisons. The first period, from 2002 to 2008, shows a continuation of immigrant flows to new destinations and away from California, New York, and Illinois. Relative growth of immigrant settlement accelerated in the Virginia and Maryland suburbs of Washington, DC, but increased most significantly in the residual grouping of “other states,” which doubled their immigrant shares from 6.1 percent in the late 1990s to 12.6 percent in the pre-recession period. The panel’s interpretation is that the attractions of economic opportunity in new destinations, plus the emergence of new immigrant communities, are eroding the pull of the traditional gateway states and cities.
The Great Recession did not stop overall immigration. The CPS data in Table 2-6 show that more than 1 million new international migrants arrived annually in the years before, during, and after the recession. Since these data count only new arrivals and not departures, they are not necessarily in conflict with the evidence that net undocumented migration into the United States slowed or even reversed during these years. The reported inflows might have been counterbalanced by outflows. Moreover, new arrivals after the recession have been mainly authorized immigrants, most of whom are on family reunification immigrant visas or were admitted on temporary work or student visas.
During the Great Recession period (2008-2010), the pull to new destinations waned and there was a slight reversion back to traditional gateways. The diversity index that had risen from 66 to 80 from the late 1980s to the early 2000s (indicating more geographic dispersion) fell slightly to 78 during the recession years. California increased its share of immigrants, as did a couple of other traditional gateway states. Many of the second- and third-tier states that had been gaining immigrants in the 1990s and early 2000s saw a decline in their share of new immigrant arrivals. One explanation, which the panel considers likely, is that many of the growth sectors that were pulling migrants to nontraditional locations, such as construction and manufacturing, had few jobs during the recession for anyone, including immigrants. In the traditional gateways, the ethnic economy, immigrant institutions, and family networks were better situated to buffer the adverse effects of the recession. The new destinations were also in states with the highest concentration of undocumented persons among their immigrant populations (Passel and Cohn, 2014). Thus, the slowdown in unauthorized immigration probably also slowed settlement in many new destinations.
The most recent period, based on 2014 CPS data, shows a return to the dispersal of new migrants away from traditional gateway areas (especially California) and gains for the second tier states and other states. In short, the Great Recession interrupted, but did not reverse, the post-1990s trend toward increasing geographic dispersal of the foreign-born population. Economic recovery rekindled the trend away from traditional gateway locations to new destinations.
The classification of states into “traditional gateways” and “new destinations” obscures more complex patterns that are evident for individual states over the entire 35-year period. Perhaps the most dramatic change is the declining primacy of California as the leading destination for new immigrants. Although California is still the leading destination, receiving 12 percent of new immigrants from 2010 to 2014, this figure is about one-third its foreign-born share in the 1970s and 1980s. Florida, by contrast, increased its share of new immigrants from 6 to almost 11 percent as other groups beyond Cubans (Latin American and Caribbean) have settled there. The increasing dispersal of immigrants around the county has made many more Americans aware that immigration is a national phenomenon.
2.9 CONCLUSIONS
This brief survey of historical, current, and future immigration trends supports five specific conclusions drawn by the panel:
- In terms of the proportion of new immigrants to the national population, contemporary immigration to the United States is at moderate levels historically. Although contemporary net immigration rates are not high by historical standards, international migration is a larger component of U.S. population growth now than in the past because the share of growth due to fertility of the native-born has fallen appreciably.
- Immigration has broadened the ethnic diversity of the American population and will continue to do so, but the increasing integration of American society may make ethnic distinctions ever less meaningful.7 There has been a steady blurring of origin group categories over the last 100 years or more of our history, and with rising rates of intermarriage there is little reason to assume this trend will change in the future. A great source of American resilience as an immigrant-absorbing country is that assimilation has been a two-way street, with the mainstream society gaining exposure to
___________________
7 The sister report to this one (National Academies of Sciences, Engineering, and Medicine, 2015) fully explores topics pertaining to the integration of immigrants into American society.
-
cultures and customs of many nations, as well as benefiting from immigrants’ high aspirations, strong families, and strong work ethic (National Academies of Sciences, Engineering, and Medicine, 2015).
- From 1970 to 2010, the American labor force has accommodated the growth of 80 million persons in the prime working ages (25-64), even while the ratio of female employment to the total population grew by 50 percent from 1970 to 2000. The rapid intergenerational growth of successive cohorts of the third-plus generation—that is, larger cohorts of persons ages 25-34 entering the working years and replacing cohorts who were leaving the prime working age years—ceased after 2010 and will turn negative from 2020 to 2030. Future labor force growth will therefore depend completely on immigrants and their U.S.-born descendants.
- Immigration helps to slow the aging of American society. The senior ratio—the number of people age 65 and older divided by the number ages 25 to 64—has begun to rise sharply, which places added weight on the smaller working-age group to support Social Security, Medicare, and other old-age programs. After decades of stability hovering between 20 and 24 seniors per 100 working-age adults, the ratio is projected to climb to 44 by 2040 (and to 48 by 2065). It would climb to 49 by 2040 (and to 56 by 2065) if no new immigrants (and their descendants) are included in projections of the population after 2015. Given continued levels of immigration in population projections, the increase in the senior ratio in the next 25 years is 28 percent less than if no immigration were projected in the population; for projections out to the next 50 years, the increase in the ratio is 40 percent less if current levels of immigration continue.
- The shift of immigrant settlement away from traditional gateway areas to new destinations, which began in the 1990s, was interrupted during the Great Recession of 2008-2009 but has resumed in the period since. This dispersal of immigration settlement, combined with the virtual cessation in the net inflow of undocumented immigrants, has changed the character and direction of the post-1965 wave of immigration.
The subsequent chapters of this report address economic issues of contemporary immigration with a focus on the labor market and fiscal system. Many of the controversies over these questions turn on issues of the availability of data and the precise measurement of key theoretical concepts. There is also debate over the interpretation of relatively small differences as well as the assessment of short-term versus long-term impacts, some of
which still lay in the future. The study of past demographic trends does not resolve these empirical issues or contemporary policy debates, but it does offer a valuable perspective on American society’s resilience in absorbing immigrants.
For example, the initial political and social response to major waves of immigration has historically almost invariably been negative. Many Americans in the early 21st century, just like their predecessors in the mid-19th and early 20th centuries, fear that the numbers and characteristics of new immigrants will have adverse economic, demographic, and cultural impacts on the welfare of the native-born population. Although there may well be short-term costs of immigration, both for immigrants and the host society, study of the last two centuries suggests the long-term impact has been almost entirely positive. Not only did markets adjust but U.S. society and culture have created institutions that allowed the descendants of immigrants to move up the socioeconomic ladder and that broadened the definition of identity as an American far beyond the imagination of the late 18th century founding population.
2.10 TECHNICAL ANNEX ON COUNTING IMMIGRANTS
To understand the impacts of immigration on U.S. society and its economy, it is necessary to know how many immigrants have arrived on U.S. shores, when they arrived, and from where. Largely because of data limitations, authoritative answers to these seemingly basic questions are surprisingly difficult to obtain. In theory, immigration is measured as stocks—namely, counts of the resident foreign-born in censuses and surveys—and flows, which are the numbers of arrivals (minus departures) in a given period. Even with complete and accurate measurement, however, the stocks of the foreign-born are not simply the sum of the net flows of prior immigrants. Rather, in any given year, the foreign-born stock represents the survivors among prior migrants, those who neither emigrated nor died. International migration adds not only to the foreign-born stock but also to the numbers of native-born Americans through the fertility of the immigrants after they arrive. The U.S.-born children of immigrants—commonly referred to as the “second generation”—are native born, both literally and in law. Yet because of their proximate migration background, many organizations and service agencies consider the second generation (especially when they are children living in their parents’ households) as part of the immigrant community. An ambiguity is that children may have one foreign-born and one native-born parent. By general convention, if either parent is foreign-born, the children are considered second generation.
Stock measures of the foreign-born population are affected by changes in both census enumeration methods and items in the questionnaire that
identify immigrants. Every Decennial Census from 1850 to 2000 included a question on birthplace (and a question on country of birth for the foreign-born). Comparable data on the foreign-born are available from the ACS, which replaced the long-form census schedule after 2000, and from the CPS, which is used to track labor market trends. Decennial Census, CPS, and ACS data on the foreign-born population include permanent residents, persons on temporary work and student visas, and undocumented residents who either entered without inspection or have overstayed visas.8 The native-born population includes persons born in the 50 states and the U.S. territories (e.g., Puerto Rico, American Samoa, etc.) and those born aboard with U.S. citizen parent(s). Therefore, the official census definition of foreign-born—all residents who are not U.S. citizens at birth—differs somewhat from the common understanding that the foreign-born are persons born outside the 50 states.9
The major limitation of Decennial Census, ACS, and CPS data for the study of immigration is that the current visa status (and visa status at time of arrival) of foreign-born respondents is not recorded. Current citizenship and year of arrival are measured in most data sources, although with some significant variations in the wording of the question and in measurement precision in the arrival dates. In census-type surveys, therefore, it is impossible to distinguish between LPRs (“green card” holders), persons on temporary nonimmigrant visas for work or study, and persons who lack an official visa. Nonetheless, it is common statistical practice to refer to the foreign-born population counted in a census or estimated by a survey as “immigrants,” even though the category includes foreign students, temporary workers on H-1B and other visas, and migrants who entered the country surreptitiously or overstayed legal visas. There is considerable mobility across these statuses, and current visa status does not always predict who stays permanently.
Changes in the stock of immigrants over time (e.g., between rounds of a census or survey) are very imperfect measures of immigration flows. Net changes in the immigrant stock are a result not only of in-migration but also of out-migration and deaths of immigrants that have occurred between rounds of the census or survey. Although measurement can be improved by
___________________
8 Although the Decennial Census and federal surveys attempt to be universal, nonresponse is a serious problem. Undocumented persons are likely to be underenumerated in all surveys and censuses.
9 This number of people born abroad of American parents has increased significantly since World War II. Prior to the 1980 Decennial Census, this group was identifiable in census data through the questions on country of birth of parents. Since 1980, the Decennial Census (and the ACS and CPS) inquire about citizenship as well as country of birth. This permits data users to identify the foreign-born population as well as to distinguish U.S. citizens by birth who are “born abroad of American parent(s).”
considering shorter intervals and recent arrivals (based on year of arrival data), the growth (or decline) of the size and change in the composition of the foreign-born population are only indirect measures of the flows of immigration.
Flows of immigrants are also difficult to measure because of changes in the criteria used to record new admissions and because return flows are poorly measured. In 1820, the federal government began counting immigrants based on arrivals by ships at major seaports. However, persons crossing land borders were not counted until the early years of the 20th century. The historical fact that a considerable number of immigrants entered the United States by crossing land borders after arriving by ship at Canadian ports renders counts of immigrants for these periods incomplete.
A second major problem with flow estimates is the lack of comprehensive data on departures, or emigration. Because of poor data quality, the U.S. Immigration and Naturalization Service ceased publishing emigration counts in 1958. Historians have estimated that perhaps up to one-third of the persons who arrived between 1880 and 1924 returned to Europe (Wyman, 1993, p. 10). Even higher figures were reported in a recent study based on detailed administrative records from Ellis Island (Bandiera et al., 2013). That study found that out-migration rates may have been as high as 60 to 70 percent during the early 20th century, although they varied sharply by group, being quite low for those who faced persecution at home but comparatively high for groups dominated by labor migrants. Recent research suggests that current emigration levels are not insignificant and also vary sharply by group (Ahmed and Robinson, 1994; U.S. Census Bureau, 2014; Van Hook et al., 2006).
Another problem with official flow data is the change in definition from “arrivals” to “lawful permanent residents” (LPRs) in the 1930s. When the United States first implemented restrictions on entry by health status and other criteria (literacy was added in 1917), alien arrivals were “inspected” by authorities before being allowed to enter the United States. Steamship companies also screened potential immigrants at embarkation because they were liable for the return transportation of persons denied entry to the United States. After the passage of the 1924 legislation, prospective immigrants were required to obtain an immigrant visa from an American consular office in their origin country (Zolberg, 2006, Ch. 8). The shift in measurement to those with immigrant visas probably had little impact during the 1930s and 1940s. Not only were immigrant flows fairly modest but the numbers of nonimmigrant foreigners who were in the United States for tourism, study, or temporary work also was much smaller than the inflow of permanent immigrants. This is no longer the case. Currently, a majority of the “new” immigrants getting green cards in most years have already been in the United States (often for many years) on temporary visas.
Based on DHS administrative records, there were 61 million nonimmigrant border crossings in 2013 (Foreman and Monger, 2014).10 Of these, more than 48 million were tourists; however, there were also about 3 million arrivals (and associated family members) on temporary work visas, 1.7 million students (and family members) on F1 and M1 visas, a half-million exchange visitors on J1 and J2 visas, and more than 6 million temporary visitors for business on B1 and WB visas. Very few of these nonimmigrant entrants become residents of the United States, as the vast majority are only in the country for short periods.
There is no official count of persons who are in the United States without a visa—the undocumented population—but the expert consensus is that the undocumented population peaked at approximately 12 million in 2007, then fell to about 11 million in the wake of the Great Recession (Baker and Rytina, 2013; Passel et al., 2013).
Both side-door (nonimmigrant visa entrants) and back-door (undocumented entrants) arrivals have complicated the assumption that the number of persons receiving LPR status reliably tracks new arrivals to the United States. Simply put, there are many more persons entering (and leaving) on temporary visas (or without a current visa) than the number of new LPRs. Most but not all persons on temporary work and student visas are counted as part of the foreign-born population in censuses and surveys, which inflates immigrant stock measures. However, people on temporary visas who are included in the count of the foreign-born population very likely represent less than 5 percent of the foreign-born population (National Academies of Sciences, Engineering, and Medicine, 2015, p. 119). Temporary visa holders can achieve LPR status via sponsorship by an employer or family member. In recent years, large pluralities of new LPRs are persons who adjust their temporary visa status to LPR after many years of residence with or without a visa (Kandel, 2014; U.S. Department of Homeland Security, 2013). Notwithstanding these difficulties in measuring immigration flows and statuses, about 70 percent of the foreign-born population in census and survey data are LPRs or naturalized U.S. citizens; the remainder consists largely of undocumented immigrants (Pew Research Center, 2015a, Ch. 5).
___________________
10 Technically, this is the number of I-94 admissions. The estimated number of nonimmigrant border crossings is even larger (173 million): The official estimate includes persons with border crossing cards and other frequent travelers for whom electronic I-94 forms are not automatically generated. The conversion from paper to electronic I-94 forms has increased the reported number of nonimmigrant admissions (Foreman and Monger, 2014).


