
2
Urban Sustainability Indicators and Metrics
Indicators of urban sustainability typically span the three broad dimensions described and noted in Chapter 1: environmental, economic, and social. These are often referred to as the triple-bottom line (Elkington, 1999). How is this threefold typology covered in the literature on indicators for urban sustainability? How useful is it as a foundation for understanding urban sustainability challenges? Are critical indicators omitted when the scope is limited to or organized in terms of environmental, economic, and social dimensions? These are the questions addressed by the first section of this chapter, based on a detailed review of four existing sets of urban sustainability indicators (Arcadis, 2015; The Economist, 2011; Lynch et al., 2011; Mega and Pedersen, 1998).
The chapter then presents an urban sustainability indicator set that was an important resource for the committee’s work, providing much of the empirical basis of the report’s nine city profiles. This chapter describes and explains the set of indicators and metrics that the committee selected from publicly available data as illustrative of the three dimensions of urban sustainability. Some indicators are specific to cities and vary in their coverage, that is, the coverage may be limited to specific cities, while others span regions or are specific to states but can nonetheless be adapted to cities (Arcadis, 2015; The Economist, 2011; Lynch et al., 2011; Mega and Pedersen, 1998). In many instances indicators are contained in local climate, energy, and water plans. The goal is to identify a set of urban sustainability indicators that allow urban communities to diagnose problems and identify pressures that provide useful information to policy intervention.
Many city leaders aspiring to change sustainability policies use indicators and metrics as motivation; they are also used to document progress as a source of urban pride. These tools cannot be underestimated in terms of their importance and impact on political leaders. Every year numerous organizations run rankings for various aspects of sustainability and they are often highly publicized in the press. They are seen by political and economic leaders as bellwethers of the perception of the urban area and can impact tourism and enhance prospects for economic development. Many of the case-study cities illustrate the transformations that can occur when metrics document the decline of a city’s environmental sustainability and its move toward greater sustainability.
Terminology is important: Indicators as used here are quantified by metrics. Like indicators used by the U.S Environmental Protection Agency (EPA, 2014a) and others (Wilbanks and Fernandez, 2012) in the context of climate change, the indicators used in this report are measures of “the state or trend of certain environmental or societal conditions over a given area and a specified period of time” (EPA, 2014a, p. 3). The indicators reflect both baseline conditions and impacts. Some have or imply benchmarks or standards, while others stand alone
as nonnormative descriptive attributes. This work emphasizes the latter, though standards and benchmarks are occasionally referenced.
META-REVIEW OF URBAN SUSTAINABILITY INDICATOR SYSTEMS
Existing urban sustainability indicator sets from the literature are evaluated in terms of their underlying dimensions and the specific indicators and metrics they use. Those that were examined are listed below:
- The North America Green City Index (EIU, 2011) assesses the environmental performance of 27 major U.S. and Canadian cities (The Economist, 2011). While it was originally one product of a research project conducted by the Economist Intelligence Unit (EIU), sponsored by Siemens, it is now part of a larger set of city studies conducted by the EIU.
- The Urban Sustainability Indicators is a product of the European Foundation for the Living and Working Conditions (Mega and Pedersen, 1998). It presents the urban sustainability indicators framework in the context of the Foundation’s program on socioeconomic aspects of sustainable development. The indicator set was examined for a network of medium-sized cities in Europe.
- The Sustainable Cities Index by Arcadis was tested with data on 50 world cities from 31 countries (Arcadis, 2015).
- The Sustainability Urban Development Indicators is a product of the University of Pennsylvania and was commissioned by the Office of Policy Development and Research, U.S. Department of Housing and Urban Development; it focuses on U.S. urban areas (Lynch et al., 2011).
Other notable literature was reviewed in detail, as well. For example, the Sustainability Tools for Assessing and Rating Communities Community Rating System is a toolbox developed for community leaders in the United States to assess the sustainability of their communities, set targets for the future, and measure progress along the way (Lynch et al., 2011). The Carbon Disclosure Project works with cities globally to measure, monitor, and manage greenhouse gas (GHG) emissions (Carbon Disclosure Project, 2014). Other related measurement protocols are the Greenhouse Gas Protocol for cities, the ICLEI Local Governments for Sustainability compact of mayors, the International Organization for Standardization’s (ISO’s) ISO 37120:2014: Sustainable development of communities—Indicators for city services and quality of life, and the ecological footprint protocol being piloted by the recent European Common Indicators report (Ambiente Italia Research Institute, 2003; Greenhouse Gas Protocol, 2015; ICLEI Local Governments for Sustainability, 2015; ISO, 2014).
The literature spans research and metrics at different spatial scales. Which of these systems and metrics are most important for a particular urban region depends on the questions being asked, but what is clear from policy research by Ostrom (2009a,b) is that simultaneous action across multiple dimensions can accelerate the pace and depth of on-the-ground transformations. No single scale alone is sufficient.
The committee’s meta-review is presented in Table 2-1. It shows the predominance of three common dimensions—environmental, economic, and social—across the four sets studied, as well as across a fifth set developed by the committee. The applicability of these three dimensions appears to hold up in these studies.
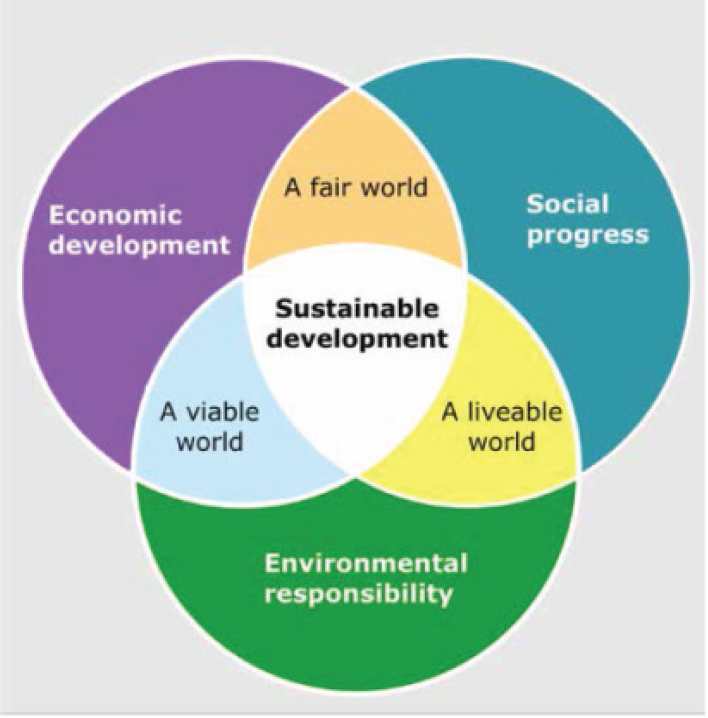
In addition, the meta-review underscores the overlapping nature of the three sustainability dimensions; that is, a given indicator may cut across the three dimensions, supporting the necessity for integration across them. This is illustrated in the Venn diagram shown in Figure 2-1. This diagram was adapted in the Science for Environment Policy 2015 report, based on prior work, in particular referencing concepts proposed by the World Commission on Environment and Development (WCED, 1987). It suggests that sustainability requires the co-occurrence of conditions that operate synergistically to achieve desired outcomes. Another observation is that indicators do not operate in isolation: their impacts depend on context including the historic evolution of the urban system.
The committee suggests, based on its review, that a fourth dimension should be considered, covering institutional arrangements and governance. Sustainability requires that political processes be inclusive, be participatory, exhibit good governance practices, be populated by organizations that offer an ease of doing business, and be linked to local, national, and global networks.
TABLE 2-1 Meta-Review of Urban Sustainability Indicator Sets
| Urban Sustainability Systems | ||||||
|---|---|---|---|---|---|---|
| Measures | I | II | III | IV | V | |
| Environmental Indicators | ||||||
| Air quality | Air Quality indexII, IV, V; criteria pollutant nonattainmentV; nitrogen oxides emissionsI; sulfur dioxide emissionsI; PM2.5 emissionsIII, V; PM10 emissionsI, III, V | 3 | 1 | 2 | 1 | 4 |
| Greenhouse gas emissions | Residential greenhouse gas (GHG) emissionsI, V; commercial GHG emissionsI, V; industrial GHG emissionsII, V; total greenhouse gases (CO2, CH4, N2O, and chlorofluorocarbons [CFCs]) II, III, IV; CO2 emissions by the energy sector divided by the total electricity outputIV; annual amount of carbon dioxide emissions divided by the city populationIV | 2 | 2 | 1 | 3 | 3 |
| Water | Average annual precipitation per yearV; example of a waterway applicable to the cityV; number of waterways impairedIV, V; water leakages in water distribution systemI; total water consumptionII; water consumption per capitaI, IV; drinking water qualityIII; water usageIV, V | 2 | 1 | 1 | 3 | 4 |
| Land | Green spaceI, II, III; existing tree canopyIV, V; landslide vulnerabilityIV, V; park acres per 1,000 residentsIV,V; urban sprawlI, III | 2 | 1 | 2 | 3 | 3 |
| Waste | Total solid waste productionIV; percent of municipal solid waste recycledI, IV; waste management indicatorII; solid waste managementIII | 1 | 1 | 1 | 2 | — |
| Ecological footprint | Ecological footprint by Global Footprint NetworkV | — | — | — | — | 1 |
| Natural hazards vulnerability | Natural hazards vulnerabilityIV, V; natural catastrophe exposureIII | — | — | 1 | 1 | 1 |
| Economic Indicators | ||||||
| Income | City incomeII; gross domestic product (GDP) per capitaI, III; median household incomeV | 1 | 1 | 1 | — | 1 |
| Price | Consumer Price IndexIII, IV; average residential electricity rateV | — | — | 1 | 1 | 1 |
| Unemployment | UnemploymentII, IV, V; goods employmentI; services employmentI; employment by mix of economic sectorsV | 2 | 1 | — | 1 | 2 |
| Energy | Energy consumptionII, III; energy consumption per capitaIV; residential energy intensityIV, V; commercial energy intensityV; industrial energy intensityV; electricity consumption per personI; electricity consumption per unit of GDPI; energy efficiencyIII; renewable energy consumptionIV, V; share of renewable energy in energy mixIII; system average interruption duration indexV; light-emitting diode (LED) street lightingV | 2 | 1 | 3 | 3 | 6 |
| Financial health | G.O. Bond ratings 2014 or 2015 S&P ratings or *Moody’s – AA+ is S&P equivalent to Aa1V; viability of the urban economyII; city fiscal deficitII; indicator tracks the performance of banks and thrifts in meeting the credit needs of the community by using CommunityIV; reinvestment Act lender ratingsIV | — | 2 | — | 2 | 1 |
| Urban Sustainability Systems | ||||||
|---|---|---|---|---|---|---|
| Measures | I | II | III | IV | V | |
| Transportation | Transportation mode shareIV, V; share of workers traveling by public transit, bicycle, or footI, II, IV; annual vehicle miles of travel per capitaIV, V; public transportation ridership averageIV, V; mean travel time to work in minutesI, III, IV, V; Walkscore. comIV, V; length of transport infrastructureI, III; congestionV; yearly delayV; excess fuelV; costV; licensed drivers per 1,000 driving age populationV | 3 | 1 | 2 | 6 | 10 |
| Social Indicators | ||||||
| Demographics | PopulationI, V; population densityI, V; race, ethnicity, age, and genderV | 2 | — | — | — | 3 |
| Education | High school, college, and bachelor’s degreesIV, V; university rankingsIII; literacyIII | — | — | 2 | 1 | 1 |
| Public health | Poor or fair healthV; adult obesityV; premature age-adjusted mortalityV; under age 5 mortality per 1,000 live birthsIV; life expectancy at birthIII; percent of population with health insuranceIV; total percentage of the population affected seriously by crime or traffic accidentsII, IV; rate of violent crimesIV, V; roadway fatalities per hundred million annual vehicle miles of travel (VMT)V | — | 1 | 1 | 4 | 5 |
| Equity | Ratio of household income at the 80th% to income 20th%V; Gini coefficientIII, IV; percentage of city population living in povertyIV, V; percentage of people affected by poverty, unemployment, lack of access to education, information, training, and leisureIII; percentage of low-income households within 1/4 mile of a neighborhood center and a transit stopII; ratio of economically active population to economically inactive populationIII; children in povertyIV, V | — | 1 | 3 | 3 | 3 |
| Housing and buildings | Housing affordabilityIV; home ownershipV; percentage of the homeless populationII; percentage of the population affected by poor housing conditionsII, IV; numbers of Leadership in Energy & Environmental Design (LEED)-certified buildingsI; number of houses certified as energy efficient by certification organizationsIV; median house size of new constructionIV | 1 | 2 | — | 4 | 1 |
| Citizen participation | Percentage of people participating in local election or as active members in associations for urban improvement and quality of lifeII, IV; voter participation as a percentage of the populationIV | — | 1 | — | 2 | — |
NOTE: Superscripts indicate the urban sustainability system that uses each measure indicated in the right-hand columns: I = America Green City Index; II = Urban Sustainability Indicators; III = Sustainable Cities Index; IV = Sustainability Urban Development Indicators; V = The Academies’ Pathways to Urban Sustainability Committee. The number in each cell represents the number of measures represented in each urban sustainability indicator set.
Future research could help to make available indicators more useful to decision makers by ensuring that indicators address actionable issues, target sustainability goals and objectives, incorporate risk levels, and cover institutional and governance issues. It could also provide directions for spatial and temporal adaptations of the indicators to reflect, for example, lifetime of service facilities, equity, and anticipated population shifts, and cover institutional and governance issues.
URBAN SUSTAINABILITY INDICATORS AND METRICS
The indicator dimensions and individual indicator descriptions that follow were used to construct Appendix B and provide the basis for applying the specific indicators to the case-study cities. They are also intended to be more broadly applicable to other communities. Indicators in this chapter, where possible, are defined at the city or metropolitan area scale. Counties were used where city data were not available, and the county list is contained in Table 2-2. These broader geographic areas, i.e., metropolitan areas, are referred to in different ways by the U.S. Census. Indicator values are generally not reported for the states in this chapter and in Appendix B, unless city-based or county-based references were not available or for comparison purposes. Nationwide U.S. values are reported for the purpose of comparison, where they are available or applicable. Indicators generally fall within the following generic typology: characteristics and trends in state or condition measures, users and usage (including equity), and stresses and response to and resilience in the face of stresses. These cut across the three dimensions.
An important consideration is that the indicators covered in this report are specifically adapted to urban areas and are illustrative of a very wide range of sustainability-related indicators covering environmental, social, and
TABLE 2-2 County List: List of Principal Counties Representing Case-Study Cities (where data for the individual cities were not available)
|
City of New York: |
City of Pittsburgh: |
|
City of Grand Rapids: |
|
|
City of Chattanooga: |
|
|
City of Los Angeles: |
City of Cedar Rapids: |
| City and County of Philadelphia (single legal entity) |
City of Flint: |
economic dimensions, many of which are not necessarily directly adapted to urban areas. Examples from this literature are The Heinz Center (2008), Janetos et al. (2012), EPA (2014), the World Bank (ongoing, web site), and Yale University (2016).
ENVIRONMENTAL INDICATORS
Air Quality
One key way of framing air quality indicators is in terms of the regulatory requirements that have evolved over many decades. Two aspects of these requirements are (1) measures of the attainment or compliance with federal Clean Air Act air quality standards and (2) indexes that combine a number of air quality parameters and their standards.
Criteria Pollutant Nonattainment. The federal Clean Air Act and its amendments set forth National Ambient Air Quality Standards (NAAQS) for the six “criteria” pollutants carbon monoxide, lead, nitrogen oxide, ozone, particulate matter, and sulfur oxide.1 Comparisons between the standards and monitored values for each pollutant are made according to a defined process that specifies the procedures for the monitoring and the applicable, defined geographic areas embodied in State Implementation Plans (SIPs) (EPA, 2015e). Since areas defined in SIPs do not contiguously cover the entire United States, a U.S. average is difficult to obtain. “Nonattainment” areas are those that do not conform to the standards, a determination that is made for each pollutant and for the time period specified in the monitoring requirements. The listing of counties that are in nonattainment status and the pollutants which the nonattainment status refers to are available from the EPA (2015b). Particulate matter of 2.5 microns in diameter (PM2.5) is singled out here as an example of one of the NAAQS for its relationship to specific urban area health impacts. It is one that is commonly singled out as an indicator in global indicators and for urban areas (see, for example, City of New York, 2015, p. 18).
Air Quality Index (AQI). EPA has developed an air quality index that combines the values for each of the NAAQS pollutants. The index is measured on a scale that reflects the number of days for each index category, ranging from 0 (the best air quality or “good”) to 201 or higher (the worst air quality or “very unhealthy”), and is given for cities as well as other geographic areas. Below is the EPA interpretation of each of the characteristics it covers (EPA, 2015a):
“# Days with AQI. Number of days in the year having an Air Quality Index value. This is the number of days on which measurements from any monitoring site in the county or MSA were reported to the AQS database.
___________________
1 See EPA’s ongoing web page: https://www.epa.gov/criteria-air-pollutants/naaqs-table.
# Days Good. Number of days in the year having an AQI value 0 through 50.
# Days Moderate. Number of days in the year having an AQI value 51 through 100.
# Days USG - Unhealthy for Sensitive Groups. Number of days in the year having an AQI value 101 through 150.
# Days Unhealthy. Number of days in the year having an AQI value 151 through 200.
# Days Very Unhealthy. Number of days in the year having an AQI value 201 or higher. This includes the AQI categories very unhealthy and hazardous. The EPA indicates that very few locations (about 0.3 percent of counties) have any days in the very unhealthy or hazardous categories.
Other characteristics based on the AQI are:
AQI Maximum. The highest daily AQI value in the year.
AQI 90th percentile. 90 percent of daily AQI values during the year were less than or equal to the 90th percentile value.
AQI Median. Half of daily AQI values during the year were less than or equal to the median value, and half equaled or exceeded it.”
Index values have been linked to qualitative health status.
Climate-Related Variables
Detailed variables to reflect climate change are set forth by the Intergovernmental Panel on Climate Change, the EPA, the National Climate Assessment of the U.S. Global Change Research Program (USGCRP), and numerous research studies that provide details and variations for each of these variables (EPA, 2014a; USGCRP, 2015). This section focuses on GHG emissions data that are specific to cities and generally more controllable by them. GHGs can be described directly in terms of carbon dioxide or as carbon dioxide equivalents. The former measure is used here, that is, carbon dioxide alone (Cox, 2014). The equivalents acknowledge that each of the many kinds of greenhouse gases absorbs radiation differently. For that reason, emissions are often translated into equivalent carbon dioxide mass units for standardization for some particular planning horizon (EPA, 2015d). CO2 equivalents are traditionally expressed in different units by economic sectors; for example, for the residential sector it is per capita, for the commercial sector per gross domestic product (GDP) and per square foot of buildings, and for the industrial sector per dollar value of products. GHGs are often provided by states in terms of such measures as CO2 emissions per capita or per million dollars of GDP. However, it must be remembered and taken into consideration that state-level data yield high values for states that have high levels of energy production and certain types of industry such as petrochemicals. In order to accurately assess the per capita emissions, they must be applied to the balance sheet of end users.
Water Quality
Indicators for water quality are provided separately for waterways and drinking water. The former is covered under the federal Clean Water Act and the latter under the Safe Drinking Water Act (SDWA).2 The federal Clean Water Act and its amendments require that impaired waterways, that is, those that violate federally approved state water quality standards, appear on a list under section 303(d) of the Act. The EPA provides access to the data organized by state with smaller geographic units available also on its website. Indicators are defined by waterway segment, designated usages for each segment, and type of pollutant. Impaired waters are listed by the EPA under section 303(d) of the Clean Water Act. Although this is difficult to operationalize as an indicator, given the level of detail it provides, it is useful to describe it: The federal Clean Water Act’s section 303(d) requires that a list of waterways not meeting water quality standards for individual pollutants be developed and prioritized by the states. Total Maximum Daily Loads (TMDLs) are developed for these waterways, determined as follows: “A TMDL is a calculation of the maximum amount of a pollutant that a water body can receive and still safely meet water quality standards” (EPA, 2015c).
___________________
2 The Clean Water Act actually has a category for drinkable water, but this is distinct from SDWA coverage, which is for community water supply systems.
One indicator based on the impaired waterways concept that reflects overall water quality in a state is the statewide number of impaired waterways, the values of which vary by year, for each state and each pollutant. The status and characteristics of water quality segments for smaller geographic units can be obtained by knowing the waterways within those geographic units and extracting the data for each waterway. The metrics include types of pollutants, sources of the impairment, nature of the impairment, and the length or size of waterways affected. Other potential water quality indicators are the number of exceedances of standards over a given time period and waterway.
Hydrology
The water budget of an area reflects what an area uses versus the capacity it has. Precipitation is one aspect of the water budget of a given area. Other factors are evaporation rate, percolation rate into the ground, and runoff over land. Precipitation as rainfall by city is available in a number of different forms and average annual precipitation in inches per year is given based on National Oceanic and Atmospheric Administration (NOAA) 1981-2010 averages (Current Results, 2015).
Tree Canopy
Tree coverage is one component of land cover along with vegetation in general that pertains to supporting sustainability aimed at water retention, air quality improvements, temperature control, provision of species habitats, aesthetics, and numerous other social and environmental purposes. Tree canopies are measured in terms of the acreage of tree components, for example, leaves, branches, and stems (City of New York, 2012a). Tree canopy assessments are carried out in many areas and the protocol is generally consistent.
Landslide Vulnerability
Landslides are just one example of land-related vulnerabilities. They have occurred in a number of areas throughout the United States for different reasons. The U.S. Geological Survey (USGS) maps landslide vulnerability, and values for a particular location can be estimated from the maps (USGS, 2014b). The USGS scoring system is qualitative based on the following levels:
L, Low (less than 1.5 percent of area involved);
M, Moderate (1.5 to 15 percent of area involved); and
H, High (greater than 15 percent of area involved).
Natural Hazards Vulnerability
The NOAA National Climatic Data Center Storm Events Database enables information to be extracted at the city level (by means of a county identifier) in terms of numbers and types of events, fatalities, injuries, and other factors. State and city Hazard Mitigation Plans also typically provide data on natural hazard events and frequencies. This indicator reflects vulnerability but not risk in terms of likelihood of occurrence or magnitude of the consequences, such as a comprehensive value of damage. The period January 2005 through June 1, 2015, was selected to identify the number of events for each of the cities in Appendix B. Where the number of events exceeded 500 events in that time period, the number entered was 500+. In the case of New York City, the actual number was calculated by breaking up the time period and also was provided by borough (county) within New York City given the size of the city.
Ecological Footprints
Wackernagel and Rees (1996) popularized the ecological footprint concept. The Global Footprint Network (GFN) tracks environmental capacity and resource usage routinely primarily by country but also has conducted a few case studies (Global Footprint Network, 2015). Calculators now exist for specific resources and often facilities, and although a few enable citywide computations, most are based on smaller geographic identifiers such as zip codes. Calculators need to be used with caution, given that the selection of the elements in the calculator is often constrained by their design and may or may not be sensitive to certain changes in inputs used for the calculators, the parameters measured are often simplified in terms of both what is included and their measurement, and most calculators use carbon dioxide emissions as the output (though the GFN uses “number of planets” equivalent to the Earth’s resources), whereas sustainability is often broader than what calculators are based on (Zimmerman, 2012). Again, it must be emphasized that footprint analysis in the context of urban sustainability needs to consider both direct and indirect consumption and impact.
Parkland
The Trust for Public Land has assembled numerous indicators for parkland and recreational facilities for selected U.S. cities. The indicators described by the Trust for Public Land for facilities focus on play areas and recreational facilities. Density and usage indicators are two types of indicators also included in their survey. Density is measured as park acreage per 1,000 residents and as a percent of city area. Usage is measured as visitation rates (The Trust for Public Land, 2015). Data on parkland were only found initially for four of the cities in this report, and other sources would need to be tapped for others.
ECONOMIC INDICATORS
Business Sectors
A general, descriptive indicator for a city’s economic health begins with the relative concentration of employment, dollar value of business, and other metrics across economic sectors. Sectors initially provided by the U.S. Census for employment (number of workers 16 years old or older) are as follows:
- Agriculture forestry, fishing, hunting, and mining;
- Construction;
- Manufacturing;
- Wholesale trade;
- Retail trade;
- Transportation, warehousing, and utilities;
- Information and finance and insurance, and real estate and rental and leasing;
- Professional, scientific, management, and administrative, waste management services;
- Educational services, and health care and social assistance;
- Arts, entertainment, and recreation, and accommodation and food services;
- Other services (except public administration);
- Public administration; and
- Armed forces (U.S. Census Bureau, 2014b).
There are many other ways of portraying economic condition by business sector such as value and number of establishments. Other aggregate city measures exist, such as gross city product. Still other indicators compare concentrations in particular industries with overall industry levels (for employment or value) for cities versus their regions, for example, and this method generally is under the heading of “shift-share” techniques.
Financial Status: Bond Ratings
Bond ratings are one indicator of financial health and hence sustainability. These are conducted, for example, by Moody’s Investors Service, Standard & Poor’s (S&P), and Fitch Ratings, Inc., for municipal services as well as for general obligation bonds that can be used to fund public services such as infrastructure. The scale for S&P ratings, for example, for investment grade (from high to low) is AAA, AA+, AA, AA-, A+, A, A-, BBB+, BBB, and BBB- (other S&P ratings are below investment grade).
Unemployment
The definition of unemployment used in this report is the “[p]ercentage of population ages 16 and older unemployed but seeking work” by geographic area and time period (RWJF and University of Wisconsin Population Health Institute, 2015).
Infrastructure
Both infrastructure capacity and usage rates are important indicators of the sustainability of infrastructure to support economic and social needs. Capacity measures are a combination of the resources available and the usage of those resources. Another term that was used to characterize this measure at least dating from the 1970s is “carrying capacity” (Bishop et al., 1974). Examples of usage rates are given below, for resources associated with basic infrastructures, i.e., transportation, energy, and water, and the same sources of the data usually give capacity measures as well. A common set of metrics that emphasize the social dimensions of public services are availability, accessibility, quality and reliability of the service, cost, and convenience.
(a) Transportation
The U.S. Census provides statistical information on transportation usage for the journey to work (for commuters 16 years old or older) by mode and purpose (U.S. Census Bureau, 2014b). For road-based travel, vehicle miles of travel (VMT) is a common indicator and is available by urbanized area and type of roadway for 2010 (FHWA, 2014). Number of state licensed drivers and registrations is another (FHWA, 2016). Transportation mode share is available from the U.S. Census (for example, percentage of workers using public transit) (U.S. Census Bureau, 2014b). Public transportation usage is measured in terms of passenger trips and miles of passenger travel by the American Public Transportation Association (APTA) and the U.S. Department of Transportation (DOT) Bureau of Transportation Statistics (APTA, 2015). Other measures that reflect facility performance are provided by these sources as well, and local jurisdictions add others as well such as “mean distance between failures” to capture failure rates of transit vehicles. Other indicators come into play in the context of extreme events that threaten urban areas among other areas, such as the recovery rate of transportation services (see, for example, Zimmerman [2014] for transit recovery rates following Hurricane Sandy). The use of some alternative modes is captured in a ranking system by walkscore.com (out of 100) (Walk Score, 2015a). Scores are given for walking, transit, and biking by city based on the proximity of people to daily activities and places that are defined and preselected by walk score (Walk Score, 2015b).
A number of transportation measures exist that reflect what users experience. Congestion measures, for example, for roadways are presented annually by the Texas Transportation Institute and INRIX, and the measures they use that combine facility and user characteristics are as follows:
- “Travel Time Index—The ratio of travel time in the peak period to the travel time at free-flow conditions. A value of 1.30 indicates a 20-minute free-flow trip takes 26 minutes in the peak period.
- Excess Fuel Consumed—Increased fuel consumption [in gallons] due to travel in congested conditions rather than free-flow conditions.
- Congestion Cost—Value of travel time delay (estimated at $17.67 per hour of person travel and $94.04 per hour of truck time) and excess fuel consumption (estimated using state average cost per gallon for gasoline and diesel)”3 (Schrank et al., 2015, p. 18).
(b) Energy
Energy intensity is a key indicator for energy usage. Energy usage varies for different sectors of the economy as shown in Appendix B. The U.S. per capita energy consumption in 2011 is cited as 312 million Btu per person (U.S. Department of State, 2014, p. 65). The incidence and duration of power outages is another critical indicator, and trends in these characteristics appear to point to increasing trends. The measure may be difficult to capture at an urban level, given the widespread nature of most outages. Energy reliability is expressed in terms of the System Average Interruption Duration Index (SAIDI).4 The costs of electric power services are important indicators presented in Appendix B. The average residential electricity rate shows how much money the average person spends at home per kilowatt hour consumed.5 The use of light-emitting diode street lighting reflects the use of sustainable means of providing energy for certain uses. The use of solar and wind power are also important sources of renewable power that support sustainability.
(c) Water usage
County-level water consumption figures are available in terms of domestic gallons per capita per day (USGS, 2014a). Many cities reach well beyond their borders to obtain a water supply. For New York City the farthest reach of the watershed is about 125 miles from the center of the city. For Los Angeles, it is several hundred miles. For water quality, the quantity in terms of restrictions on use (for example, under drought conditions), quality relative to standards of purity, and cost of the supply are user-oriented indicators.
SOCIAL INDICATORS6
Population and Population Density
Population was measured based on Census data for those living in the city and for those living in the Core Based Statistical Area (CBSA). A CBSA is a core area with a significant population nucleus in which neighboring communities are closely economically and socially integrated with the population nucleus (U.S. Census Bureau, 2014c). Population density is another important population characteristic, measured as the number of people per square mile within a defined geographic area (U.S. Census Bureau, 2014c).
Demographics
The U.S. Census Bureau provides data on the racial and ethnic composition of a city. Median age and gender reveal further information about the demographic background of a community (U.S. Census Bureau, 2014c).
___________________
3 These definitions are drawn directly from the Texas A&M Transportation Institute and INRIX 2015 Urban Mobility Scorecard, p. 18, for the “national congestion tables.”
4 SAIDI reflects the average amount of time per year that power supply to a customer is interrupted, expressed in minutes per customer per year. It applies to the territory or service area of the principal utility company serving the city and is not coterminous with the city of the metro area.
5 Applies to the territory served by the principal utility company serving the city (see Local Electricity, 2015).
6 See U.S. Census Bureau (2014a, 2015a).
Education
Education can be measured through a variety of means usually based on educational level attained in formal schooling systems and generally based on U.S. Census Bureau measures. One measure used here is the percentage of high school graduates in the population who are 25 years and older. A second measure is the percentage of those aged between 25 and 44 who have attended some college. Finally, education was measured based on those 25 and older who possess bachelor’s degrees (U.S. Census Bureau, 2014c).
Poverty and Wealth
Numerous measures of population wealth and poverty exist, namely, income (as household, individual, or family median or mean annual income), percentage of the population below the federal poverty level (HHS CMS, 2015),7 and income gaps in terms of the ratio of the population above the 80th percentile and below the 20th percentile in gross annual income (RWJF and University of Wisconsin Population Health Institute, 2015; U.S. Census Bureau, 2014b). These are also available by demographic characteristics of the population.
Housing characteristics are also described in terms of a number of indicators that directly or indirectly reflect wealth. Some examples are housing value or cost (assessed or market value, monthly rent), ratio of owners to renters, rent-to-income ratios for rental housing, and the percentage of household income spent on housing ownership.
Safety
Overall crime statistics are measured in terms of types of crime and rates per capita (RWJF and University of Wisconsin Population Health Institute, 2015). For vehicular accidents, the Federal Highway Administration (FHWA) Highway Statistics give data on fatality rate per 100 million annual VMT, 2013, by functional system, that is, the type of federally aided roadway (FHWA, 2014). The National Highway Traffic Safety Administration (NHTSA) manages the DOT Fatality Analysis Reporting System database, which is also a central place for vehicular accident information (NHTSA, 2015a,b).
Health
Health indicators comprise a large set of characteristics and outcomes typically standardized by a measure of population or population sector such as that adjusted by age. Examples of outcome measures are mortality, morbidity, years of life, or potential life lost. There are numerous cause-specific indicators, including disease-specific indicators and behaviors that contribute to adverse health conditions (RWJF and University of Wisconsin Population Health Institute, 2015). The City of New York has developed community health profiles at the borough-wide (county) level and for its 59 community health districts; for these units, it provides several dozen indicators that are demographic as well as health related (DOHMH, 2015).
CONCLUSIONS
A number of conclusions are suggested from the meta-review and analysis of indicators:
- Three common dimensions dominate—environmental, economic, and social—and these are interrelated and overlapping; that is, any given indicator may fall within more than one dimension.
- An added fourth dimension would highlight institutional and governance aspects of sustainability and is a direction for future research. Examples of these indicators would include performance and oversight capabilities and the ability to obtain resources to attain environmental, economic, and social aims. These indicators or their combinations are often specific to individual areas.
___________________
7 This level is in terms of income by family size.
- Few standards, benchmarks, and thresholds exist among the dozens of indicators and metrics that comprise urban sustainability systems.
- There is a lack of common and standardized indicators and metrics.
- It is difficult to draw strong scientific conclusions about drivers of sustainability because of the limited experimentation and the lack of counterfactual evidence.
- There is a lack of data to populate many metrics (e.g., distributional metrics other than the income Gini coefficient) that often requires other geographic levels to substitute for or represent urban areas.
- It is easy to be overwhelmed by the abundance of indicators. Also, the most common indicators are not necessarily the most important. Some can be surrogates for others. Indicator selection is a process that combines science, judgment, and the involvement of numerous parties; the process needs to be better understood.
- Going forward, rapidly developing information and communication technologies in combination with social media and “big data” approaches will open up new opportunities for monitoring and understanding urban sustainability in ways that can potentially better exploit large quantities of time-series, high-resolution, near-instantaneous measurements. Mapping and visualization will become increasingly important to identify and integrate indicators. The quality of indicators and metrics benefits from the increasing research in numerous areas that pertain to the sustainability dimensions covered in the report; however, to make these actionable will require continued investment in the infrastructure to monitor and measure attributes that comprise the indicators.
- Metrics are not all logically actionable. It is important to identify what is truly exogenous—conditions that cannot be altered but that influence the ability of policies and actions to promote sustainability.
- To be sure the task of selecting a narrow suite of indicators to better understand urban sustainability is by no means easy. The uncertainties of doing so herein are not quantitatively addressed. Instead the committee provides an initial set of set of indicators, to serve as the basis for future research and development.
Using the described indicator dimensions and corresponding individual indicator descriptions, Appendix B provides the foundation for applying these indicators to the profile cities in Chapter 4. Where possible, indicators are designated at the city or metropolitan area scale. Counties (see Table 2-2) were used in instances where city data were not available. For comparative purposes, U.S. values are also reported, where they are available or applicable. Information from Appendix B is used to provide a comparative snapshot of the nine cities in the form of the spider charts presented in Chapter 4 (see Figure 4-22).


