National Academies Press: OpenBook

Frontiers in Decadal Climate Variability: Proceedings of a Workshop (2016)

Chapter: Challenges in Examining Climate Trends

« Previous: Introduction
Suggested Citation:"Challenges in Examining Climate Trends." National Academies of Sciences, Engineering, and Medicine. 2016. Frontiers in Decadal Climate Variability: Proceedings of a Workshop. Washington, DC: The National Academies Press. doi: 10.17226/23552.
×

Challenges in Examining Climate Trends

Many participants noted that conversations about climate trends should clearly specify which time periods defined the trend, which period served as the baseline for determining the trend, and how the trend was quantified. However, not every workshop presented provided these specifications when discussing the slowdown. The presentations spurred discussion about whether the global mean surface temperature (GMST) warming trend did indeed slow down during the early 2000s—the answer to which depended on the timescale chosen and the quantification method used.

The discussion about ways to frame climate trends was motivated in part by a paper released by Karl et al. (2015) prior to the workshop, which suggested that the slowdown during the early 2000s was an artifact of residual data biases in the calculation of GMST from an early version of a global surface temperature dataset.1 Karl et al. based their paper on recent updates to the National Oceanic and Atmospheric Administration (NOAA) GMST dataset, which revealed that the surface ocean has warmed nearly twice as fast in recent years as previously thought. When combined with updated land surface temperature data, which show a slight increase in the rate of land surface warming, the GMST data show a small but significant positive trend (at the 0.10 level) in GMST from 1998 to 2012.

Huai-Min Zhang, a scientist from the NOAA National Centers for Environmental Information (NCEI), said that with these corrections the trend for 1998-2012 is not statistically significantly different from the estimates for the trend for 1951-2012. Zhang suggested that the years used in the Intergovernmental Panel on Climate Change analysis of GMST (IPCC, 2014) do not provide a very good picture of decadal warming trends, because the analysis period is short and started with 1998 (one of the warmest years on record because of a large El Niño event). With the updated dataset and an extended analysis period (1998-2014 or 2000-2014), recent warming rates are even higher and, for the latter period, comparable to warming rates of the second half of the 20th century.

Gerald Meehl, chair of the workshop organizing committee and senior scientist at the National Center for Atmospheric Research,

___________________

1 HadSST3 (the Met Office Hadley Centre gridded SST dataset) made the SST adjustments made by Karl et al. (2015) several years earlier prior; see Kennedy et al. (2011).

Suggested Citation:"Challenges in Examining Climate Trends." National Academies of Sciences, Engineering, and Medicine. 2016. Frontiers in Decadal Climate Variability: Proceedings of a Workshop. Washington, DC: The National Academies Press. doi: 10.17226/23552.
×

Image

FIGURE 2 Time series of annual GMST anomalies in Fahrenheit (dots) based on data from Karl et al. (2015). NOTEs: Black line is linear trend computed from 1950 to 2014 showing long-term trend forced mainly by increasing GHGs. Red and blue lines show that the linear trend is dependent on time period chosen (in this case, positive and negative phases of the Interdecadal Pacific Oscillation (IPO), respectively). SOURCE: Meehl (2015).

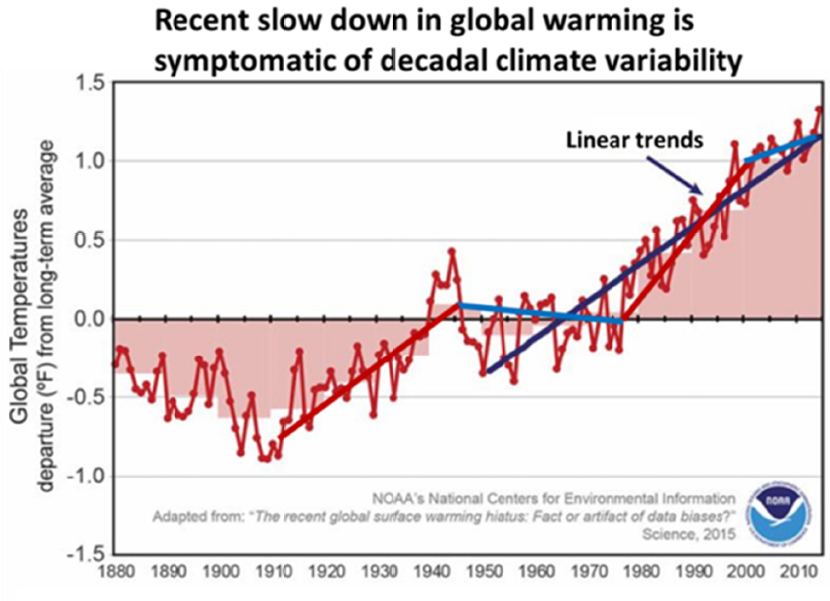
presented a graph of the GMST rise since the late 1800s (Figure 2) to demonstrate that warming rates are sensitive to the years chosen to fit a linear trend. For example, from about 1945 to 1975, the period of low or negative trends in GMST was pronounced (see light blue line in Figure 2). However, over the longer term, the general warming trend is pronounced and clearly evident. He described the global warming trend as an uneven staircase: there are steeper and less steep periods, but the trend over longer timescales has been increasing, consistent with human-caused global warming, regardless of whether some shorter periods exhibit statistically significant positive (or negative) trends.

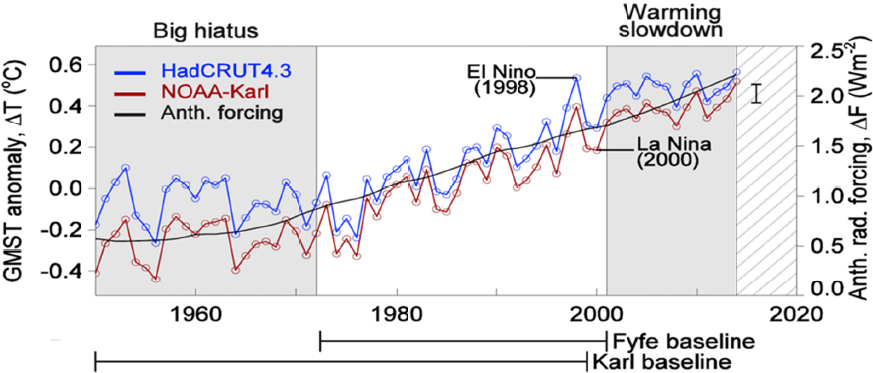
John Fyfe from the Canadian Centre for Climate Modelling and Analysis (CCCma) and his colleagues disagree with the argument by Karl et al. (2015) that the slowdown during the early 2000s is not apparent after correcting observations of global sea surface temperature. Fyfe pointed out that the baseline period used by Karl et al. (2015) for comparison includes the so-called “big hiatus” (a period of near-zero trend in the mid-20th century, shown in Figure 3); therefore the trend computed for the baseline period is low and not dissimilar from recent trends.

Fyfe suggested that the baseline period should be physically based to reflect natural variability. Using a baseline period of 1972-2001, which excludes the “big hiatus,” Fyfe concluded that a warming slowdown did indeed occur, relative to 1972-2001 (see Fyfe at al., 2016).

Suggested Citation:"Challenges in Examining Climate Trends." National Academies of Sciences, Engineering, and Medicine. 2016. Frontiers in Decadal Climate Variability: Proceedings of a Workshop. Washington, DC: The National Academies Press. doi: 10.17226/23552.
×

Image

FIGURE 3 GMST anomalies based on HadCRUT4.32 data (blue), Karl et al. (2015) updated dataset (red), and estimated anthropogenic forcing (black, using RCP; Meinshausen et al., 2011) from 1950 to 2014. NOTES: Karl et al. anomalies are relative to 1971-2000 climatology, and HadCRUT4.3 anomalies are relative to 1961-1990 climatology. The Karl et al. baseline includes the “big hiatus” (shaded gray), whereas the Fyfe et al. baseline does not. SOURCE: John Fyfe presentation, September 3, 2015. © Her Majesty the Queen in Right of Canada, as represented by the Minister of Environment, 2016.

Workshop participants highlighted the fact that GMST variations are expected in the globally integrated Earth system. Challenges to quantifying exact rates and identifying the multitude of processes related to the differing rates largely result from gaps in observations and the ability to measure global energy changes in components of Earth’s climate system. Nonetheless, participants agreed that human-caused changes to Earth’s energy balance have not been on “hiatus” and are causing the planet to warm on average over longer timescales.

Many participants also agreed that, regardless of whether a temporary slowdown in GMST rise occurred between 998 and 2014, natural variations are expected in the long-term temperature record for periods on the decadal timescale. Understanding of this climate variability will in turn inform understanding of the physical climate system as well as advance prediction and attribution capabilities. Some participants noted that framing the discussion around whether or not there was a recent slowdown period obscures the importance of understanding decadal variability and its many climate impacts. Much of the remainder of the workshop discussions delved into research to uncover the contributions by various internal mechanisms and external forcing, how they interact to produce global and regional decadal climate variability, and the potential for increased knowledge to lead to predictions of transitions between periods of slower and faster warming of GMST in response to GHG forcing.

___________________

2 HadCRUT4.3 is a gridded dataset of global historical surface temperature anomalies relative to a 1961-1990 reference period. Data are available for each month since January 1850, on a 5 degree grid. The dataset is a collaborative product of the Met Office Hadley Centre and the Climatic Research Unit at the University of East Anglia. At the time of this writing, HadCRUT4.3 had been updated to version HadCRUT4.4. Available at http://www.metoffice.gov.uk/hadobs/hadcrut4/.

Suggested Citation:"Challenges in Examining Climate Trends." National Academies of Sciences, Engineering, and Medicine. 2016. Frontiers in Decadal Climate Variability: Proceedings of a Workshop. Washington, DC: The National Academies Press. doi: 10.17226/23552.
×

This page intentionally left blank.

Suggested Citation:"Challenges in Examining Climate Trends." National Academies of Sciences, Engineering, and Medicine. 2016. Frontiers in Decadal Climate Variability: Proceedings of a Workshop. Washington, DC: The National Academies Press. doi: 10.17226/23552.
×
Page 9
Suggested Citation:"Challenges in Examining Climate Trends." National Academies of Sciences, Engineering, and Medicine. 2016. Frontiers in Decadal Climate Variability: Proceedings of a Workshop. Washington, DC: The National Academies Press. doi: 10.17226/23552.
×
Page 10
Suggested Citation:"Challenges in Examining Climate Trends." National Academies of Sciences, Engineering, and Medicine. 2016. Frontiers in Decadal Climate Variability: Proceedings of a Workshop. Washington, DC: The National Academies Press. doi: 10.17226/23552.
×
Page 11
Suggested Citation:"Challenges in Examining Climate Trends." National Academies of Sciences, Engineering, and Medicine. 2016. Frontiers in Decadal Climate Variability: Proceedings of a Workshop. Washington, DC: The National Academies Press. doi: 10.17226/23552.
×
Page 12
Next: Modes and Mechanisms of Internal Variability »
Frontiers in Decadal Climate Variability: Proceedings of a Workshop Get This Book
×
 Frontiers in Decadal Climate Variability: Proceedings of a Workshop
Buy Paperback | $46.00 Buy Ebook | $36.99
MyNAP members save 10% online.
Login or Register to save!
Download Free PDF

Many factors contribute to variability in Earth's climate on a range of timescales, from seasons to decades. Natural climate variability arises from two different sources: (1) internal variability from interactions among components of the climate system, for example, between the ocean and the atmosphere, and (2) natural external forcings, such as variations in the amount of radiation from the Sun. External forcings on the climate system also arise from some human activities, such as the emission of greenhouse gases (GHGs) and aerosols. The climate that we experience is a combination of all of these factors.

Understanding climate variability on the decadal timescale is important to decision-making. Planners and policy makers want information about decadal variability in order to make decisions in a range of sectors, including for infrastructure, water resources, agriculture, and energy.

In September 2015, the National Academies of Sciences, Engineering, and Medicine convened a workshop to examine variability in Earth's climate on decadal timescales, defined as 10 to 30 years. During the workshop, ocean and climate scientists reviewed the state of the science of decadal climate variability and its relationship to rates of human-caused global warming, and they explored opportunities for improvement in modeling and observations and assessing knowledge gaps. Frontiers in Decadal Climate Variability summarizes the presentations and discussions from the workshop.

READ FREE ONLINE

  1. ×

    Welcome to OpenBook!

    You're looking at OpenBook, NAP.edu's online reading room since 1999. Based on feedback from you, our users, we've made some improvements that make it easier than ever to read thousands of publications on our website.

    Do you want to take a quick tour of the OpenBook's features?

    No Thanks Take a Tour »
  2. ×

    Show this book's table of contents, where you can jump to any chapter by name.

    « Back Next »
  3. ×

    ...or use these buttons to go back to the previous chapter or skip to the next one.

    « Back Next »
  4. ×

    Jump up to the previous page or down to the next one. Also, you can type in a page number and press Enter to go directly to that page in the book.

    « Back Next »
  5. ×

    Switch between the Original Pages, where you can read the report as it appeared in print, and Text Pages for the web version, where you can highlight and search the text.

    « Back Next »
  6. ×

    To search the entire text of this book, type in your search term here and press Enter.

    « Back Next »
  7. ×

    Share a link to this book page on your preferred social network or via email.

    « Back Next »
  8. ×

    View our suggested citation for this chapter.

    « Back Next »
  9. ×

    Ready to take your reading offline? Click here to buy this book in print or download it as a free PDF, if available.

    « Back Next »
Stay Connected!