Overcoming Data Limitations
Understanding of decadal climate variability is limited by the relatively short length of many climate records, meaning that only a few decadal cycles may be recorded (NRC, 1995). Limited spatial coverage also presents a challenge in that many parameters and processes are not fully characterized with available observations. Several participants discussed their work filling in observational records that can inform understanding of decadal variability.
Gaining Insight from Paleoclimate Data
The study of natural climate variability, in particular to meet the need to separate out human-induced climate effects, requires studying climate variability of the past, before humans played a role. Information about past climate conditions is contained in historical records and “proxy” indicators, such as polar ice caps, tree rings, and corals.
Decadal variations in zonal wind strength can play a role in internal climate variability and consequently the rate of global temperature rise. However, past observations of wind strength and direction for the Pacific Ocean are very sparse, said Diane Thompson from Boston University, who studies coral records to help fill in the gaps in information. Her studies have focused on the period 1910-1939, when about one-third of the 20th century GMST warming occurred despite weak external forcing, suggesting that an important role by internal variability. However, there are very few wind observations for this early 20th-century warming period with which to test the role of tropical Pacific winds in this warming.
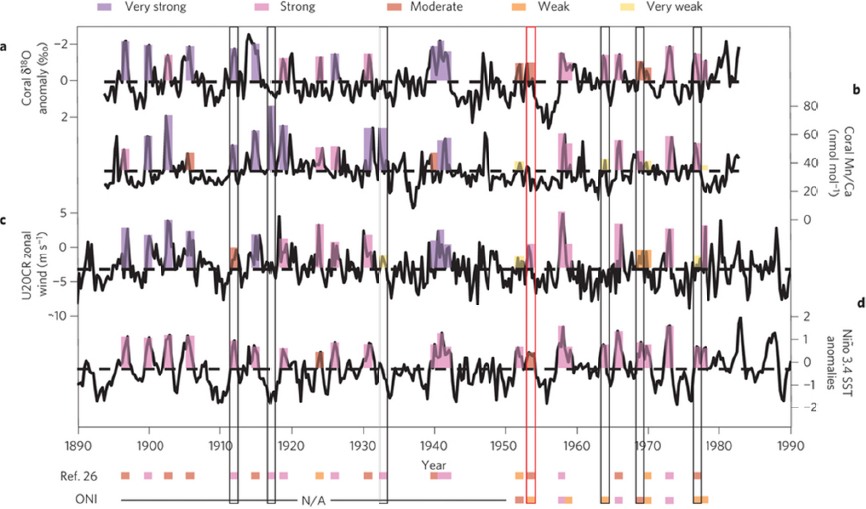
Thompson studies corals that grew just outside of a westerly facing lagoon on Tarawa, an atoll in the central Pacific Ocean. Because the lagoon is shielded from the prevailing easterly trade winds, trace metals, particularly manganese, accumulate there gradually over time. Westerly winds associated with the onset of El Niño events produce wave action that releases manganese from the enriched lagoonal sediments, which is then incorporated into coral skeletons. The coral skeletons also record the warming and freshening (due to increased rainfall) that the resulting El Niño event brings to the island.
Thompson presented a new coral record from 1890 to 2010 showing that ENSO-related westerly winds are associated with spikes in manganese (Figure 17; Thompson et al., 2015). These spikes of manganese in the coral skeleton (and thus bursts of winds from the west) were more frequent during the early 20th-century period of rapid warming and less frequent when warming leveled off in the mid-20th century. Thompson said that this wind reconstruction corroborates and extends the idea that periods of strong Pacific (easterly) trade winds (and less frequent pulses of westerly winds) are associated with cooler equatorial Pacific surface temperature and a slower rate of global warming. Conversely, periods of weaker trade winds (and more frequent pulses of westerly winds) are associated with warmer equatorial Pacific surface temperature and a faster rate of global warming. Thompson is conducting the same study in other equatorial atolls with westerly facing lagoons to replicate and extend this record and reconstruct past trade wind variability across the western tropical Pacific.
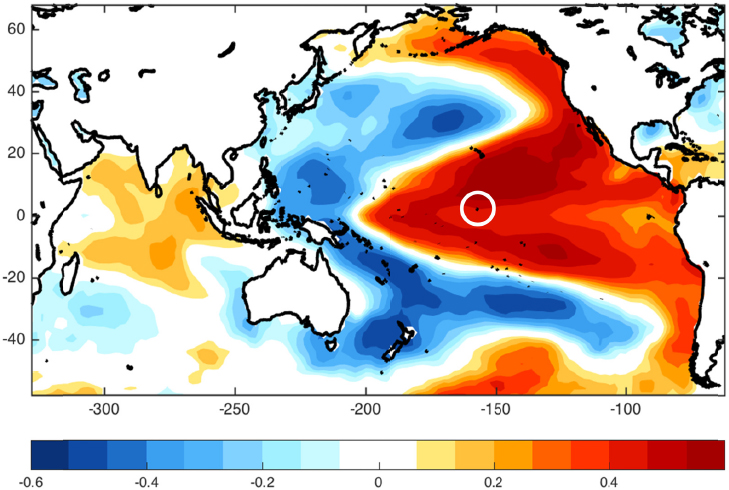
Kim Cobb from Georgia Tech presented work using oxygen isotopes in corals to reconstruct tropical Pacific SST, precipitation, and salinity over the past 1,000 years. Cobb compared the coral records to the evolution of 20th-century Pacific Decadal Variability (PDV) to help separate natural variability from potential human-caused trends in Pacific climate. Cobb
conducts her research in the middle of the tropical Pacific on Palmyra, Fanning, and Christmas Islands, which she notes are very well positioned for study of the history of the PDV and other decadal climate phenomena (Figure 18).
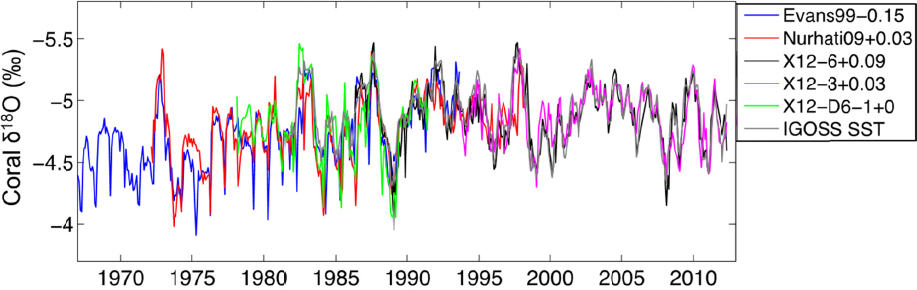
The oxygen isotopic composition (δ18O) of skeletal aragonite in reef-building corals is a well-established proxy for reconstructing tropical SST and hydrological variability. Coral δ18O is inversely proportional to temperature and positively correlated to ocean salinity. Lower coral δ18O values reflect warmer and/or wetter conditions, while higher coral δ18O values reflect cooler and/or drier conditions (e. g., Corrège, 2006). Cobb said coral δ18O records from the Northern Line Islands provide 10-20 points per year of information—equivalent to monthly resolution records that can be directly compared to monthly-resolved instrumental climate records and climate model output. A suite of coral δ18O records from the Northern Line Islands is interchangeable with SSTs from these sites over the past several decades (Figure 19). Moreover, coral δ18O records from samples thrown up onto beaches across the Northern Line Islands—referred to as “fossil” corals—are interchangeable with those derived from coral cores drilled from living coral colonies (Figure 19). By combining living coral and fossil coral archives from across the Northern Line Islands, Cobb has amassed more than six centuries worth of monthly-resolved climate reconstructions from the central tropical Pacific that span various intervals of the last millennium (Figure 20).
The existing Line Islands coral δ18O reconstruction shows a late 20th-century trend toward warmer and/or fresher conditions in the central tropical Pacific that may be associated with the rise of atmospheric GHGs. However, the relative contributions of warming versus
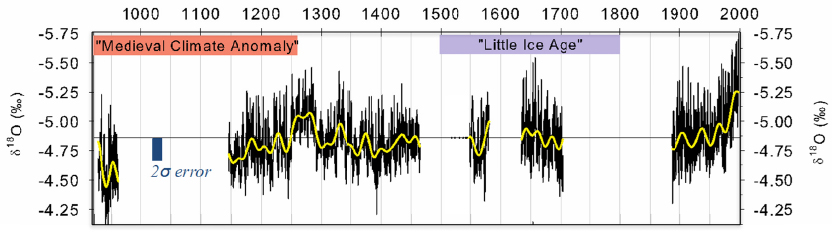
freshening in driving the observed coral δ18O trend is a key question with important implications for the detection and attribution of climate changes in this area.
Cobb advocated for the continued development of additional long, high-resolution coral reconstructions from other islands in the region (i. e., nearby Christmas Island) to constrain the natural vs. anthropogenic contributions to recent trends from across the Pacific. Recognizing that most of these high-quality, high-resolution climate reconstructions will be based on the isotopic variability of water isotopes (i. e., corals, cave stalagmites, lake records, marine sediments), Cobb underscored an urgent need to understand how seawater and rainwater δ18O vary in the Pacific through both space and time, because that variability is translated directly into geologic proxies of climate variability. New research focused on bringing new empirical constraints from observational evidence of the modern system is a promising way forward, in addition to the continued investigation of water isotope-equipped simulations of past and future climate variability. The vast trove of high-quality paleoclimate records represents the best way of extending back the instrumental record of climate long enough to characterize the spatio-temporal patterns of natural decadal-scale variability, and how they differ from those signals related to anthropogenic climate change, according to Cobb.
Integrating Land Datasets, including the Arctic
The Karl et al. (2015) result that NOAA NCEI’s Huai-Min Zhang presented (see section on Challenges in Examining Climate Trends) highlights the importance of data homogenization and bias correction in observed SSTs. Matt Menne, also of NOAA NCEI, described some of the issues encountered in NOAA’s efforts to improve land surface station temperature data known as the International Surface Temperature Initiative (ISTI). These data are being used to produce a new NOAA analysis of land surface air temperature since the late 19th century.
NOAA recognized the need to create a temperature dataset for land for use in reanalysis that is as robust as the International Comprehensive Ocean-Atmosphere Dataset (ICOADs). Progress to increase the dataset has been slow because there are multiple source archives to combine, which usually exist in different formats. Other challenges include devising a system for near real-time updates, managing station histories and metadata, and developing a system for documenting, tracking, and addressing errors. NOAA has already reconciled monthly and daily data and is now working on reconciling the hourly data, according to Menne.
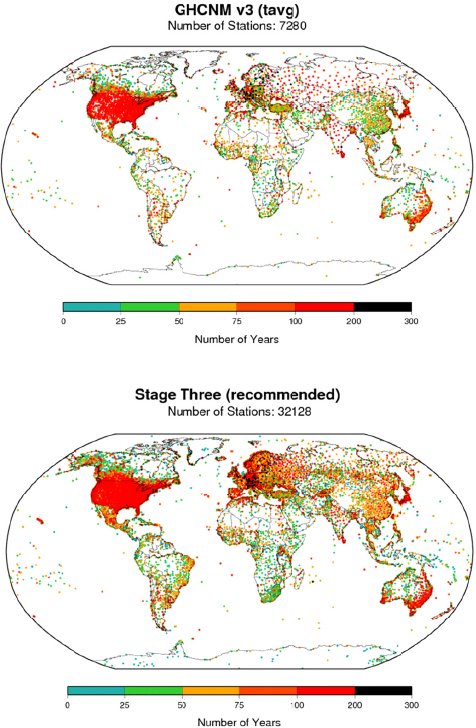
NOAA released a new version of the dataset with many more stations and longer records (Figure 21). In general, there is better sampling of land areas, with a higher spatial density of station records. This is important, Menne said, because artificial shifts at local stations, such as station moves, instrument changes, land use changes, and time of observation changes, can be larger than the climate signal, and the impact of such changes can be quantified by comparing nearby station records. Globally today, there is oversampling at
airport locations that were previously in city centers. Therefore, although people have been worried in the past about the effects on readings from urbanization, Menne said the more obvious signal today is from ruralization of the climate record (given that airports are in rural areas), which could introduce a cooling bias.
Menne noted that data coverage in the Arctic is particularly sparse. Filling in more data from the Arctic region could alter understanding of the GMST trend over the past 15 years quite substantially. An important question is what part of the global climate signal is being missed because of inaccurate accounting for the large changes that have occurred in the data-sparse Arctic regions?
Filling in data gaps using model-data integrations and reanalysis
Formal model-data synthesis (loosely termed data assimilation1) seeks to optimally combine information contained in observations from several data streams (many that are sparse) and models that obey known conservation laws exactly. Products of this data assimilation can then be used to study climate variability over longer timescales than the strictly observational records would allow. Different techniques lead to different pitfalls in the use of these products: for example, Veronica Nieves, NASA Jet Propulsion Laboratory, presented some results that show the limitations of ocean reanalyses products in capturing the depth trend. Reanalyses tend to overestimate the slowdown and warming rates, and thus if heat starts to be transported in deeper layers of the ocean, these products will require improved analysis at depth, according to Nieves (Nieves et al., 2015).
Patrick Heimbach of the University of Texas at Austin discussed problems with developing climate hindcast2 studies using reanalysis3 products. First, reanalyses do not account for
___________________
1 Data assimilation is a cyclical procedure in which scientists compare recently collected observational data with the forecast model output. The model is then adjusted to reflect the known output before a new forecast is initiated.
2 A hindcast refers to the output from numerical simulation or prediction models of past events or history. These hindcasts can be analyzed to determine how well the model output matches the known observations of that event.
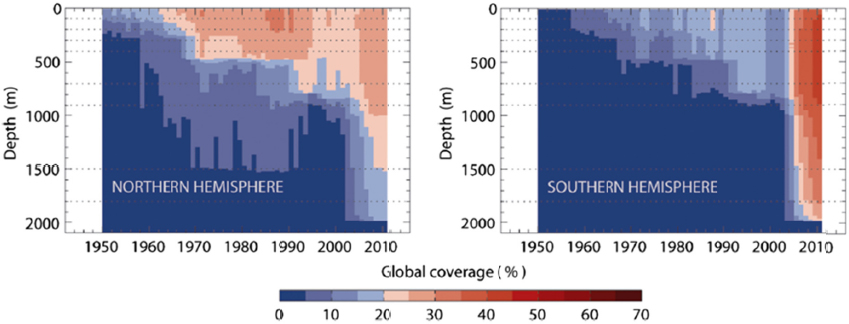
ongoing and continual spatio-temporal improvements to observing systems. For example, the large warming trend at the end of the 1970s in ERA404 is an artifact of large changes in observational coverage at the end of the 1970s. The same problem applies to the ocean and persists today (Stammer et al., 2016), as observational coverage continues to improve, for example, in measuring temperature in the deep ocean (Figure 22).
Additionally, reanalyses were actually created for weather forecasting, not climate studies, said Heimbach. In particular, so-called ocean reanalyses, like atmospheric reanalyses, do not conserve properties over time, in particular heat and freshwater (Wunsch and Heimbach, 2013). This is a problem for assessing decadal changes in climate properties that often are subtle residuals of large regional variations (Wunsch, 2016). Doing so introduces artificial heat sources or sinks that are a product of the reanalysis method and are not a measure of the actual physical properties being represented, according to Heimbach.
___________________
3 Reanalysis refers to the reprocessing of observational data spanning an historical period using a consistent modern analysis system.
4 ERA40 is a widely respected reanalysis by the European Centre for Medium-Range Weather Forecasts (ECMRWF) of global atmosphere and surface conditions from September 1957 through August 2002. ERA-Interim, a precursor to a revised extended reanalysis product to replace ERA-40, is now available here: http://apps.ecmwf.int/datasets/data/interim-full-daily/levtype=sfc/.
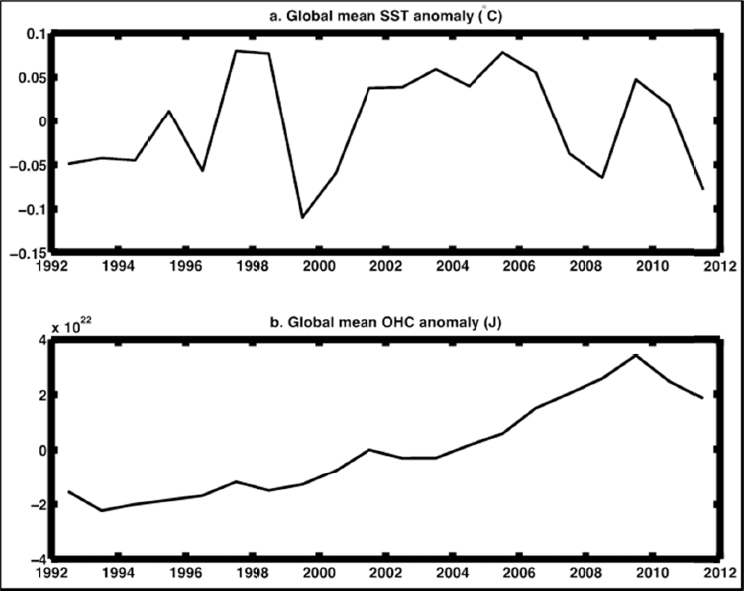
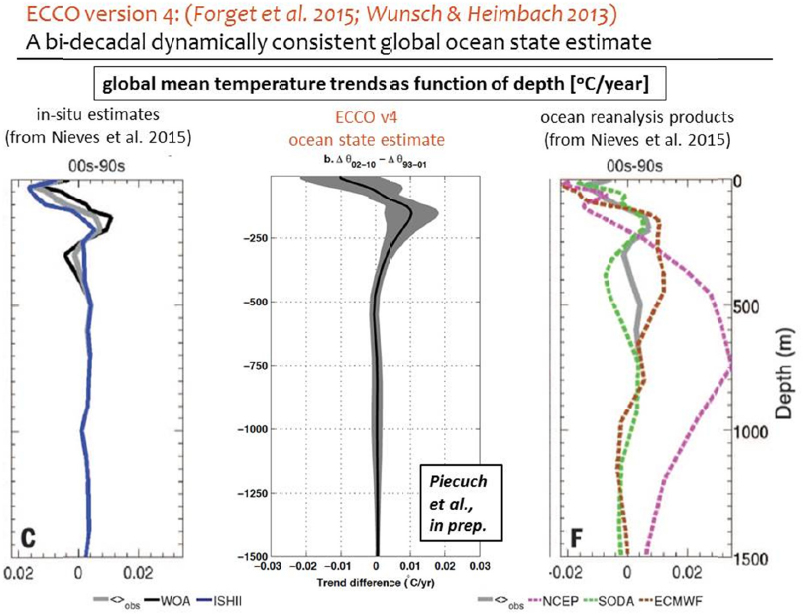
Heimbach has been using the ECCO (Estimating the Circulations & Climate of the Ocean) product, which he said is deliberately not called a reanalysis product, but instead an “ocean state estimate” (Wunsch and Heimbach, 2007). The ECCO design is free of artificial heat (and freshwater) sinks and sources. It places a premium on known conservation laws and uses diverse satellite and in-situ data streams forward and backward in time. Ocean heat content estimates at depths from the latest ECCO version 4 (Forget et al., 2015) are much closer to the in-situ estimates than in the various reanalysis products considered by Nieves et al. (2015), according to Heimbach (Figure 23). ECOO version 4 has also been used to show that even though global mean SST has stagnated, ocean heat content has increased fairly steadily (Figure 24). Designing, maintaining, and coping with coherent observational records of climate quality will require long-term inter-generational commitments to sustain stable observing systems (Wunsch et al., 2013).