
6
Molybdenum-99/Technetium-99m Historic and Projected Demand
This chapter addresses the demand component of the fourth charge of the statement of task for this study (see Sidebar 1.3), which directs the Academies to provide an assessment of
The adequacy of molybdenum-99 supplies to meet future domestic medical needs, particularly in 2016 and beyond.
This chapter focuses on assessing the current and near-future demand (referred to as medical needs in the study charge) for molybdenum-99 (Mo-99)/technetium-99m (Tc-99m) in the United States. Current and near-future supplies of Mo-99/Tc-99m to the United States are discussed in Chapter 7.
This fourth study charge was not mandated in the American Medical Isotopes Production Act of 2012 (Appendix A). As noted in Chapter 1, this study charge was added in consultation with the study sponsor, the Department of Energy’s National Nuclear Security Administration, to assist it with its nuclear non-proliferation mission and to provide important additional information to the U.S. Congress and the medical isotope production and utilization communities.
Demand for Mo-99 is driven by demand for technetium generators, which in turn is driven by demand for Tc-99m radiopharmaceutical doses (see Figure 2.4 in Chapter 2 and Figure 3.1 in Chapter 3). Technetium generator sales are not publicly disclosed by generator suppliers, and there is no centralized source of information on numbers of Tc-99m radiopharmaceutical doses dispensed in hospital and nonhospital settings in the United
States. Consequently, the committee had to develop a number of proxy metrics (see Sidebar 6.1) to assess Mo-99/Tc-99m demand trends. The data used to develop these metrics were derived from
- Published information,
- Expert opinions of medical professionals and other Mo-99/Tc-99m supply chain participants, and
- Three databases that contain information on Tc-99m radiopharmaceutical utilization in selected sectors of the U.S. health care system.
These data sources are identified in Table 6.1 and discussed in Section 6.2 of this chapter.
Historical Mo-99 demand trends are useful for informing projections of future demand. Such projections can be developed by examining past demand trends and assessing the factors that are likely to affect those trends in the future. Some key demand trends are identified and discussed in Section 6.4 of this chapter.
6.1 GLOBAL DEMAND FOR Mo-99/Tc-99m
The most authoritative information on the global demand for Mo-99/Tc-99m comes from periodic assessments by the Organisation for Economic
TABLE 6.1 Data on Historic Decline of Mo-99 Demand in the United States
| Source | Reference | Study Period | Proxy for Mo-99/Tc-99m Demand | Estimated Decline (%) |
|---|---|---|---|---|
| Published Literature | ||||
|
OECD-NEAa |
OECD-NEA 2011b, 2015, 2016 | 2010-2015 | Production capacity | 25 |
|
Kaiser Permanente of Northern California |
McNulty et al., 2014 | 2009-2011 | MPI utilization | 30 |
|
Six large integrated health systems |
Smith-Bindman, et al., 2012 | 1996-2010 | Nuclear medicine | 35 |
| Expert Opinions | ||||
|
Nuclear cardiology |
Conference call (see Appendix C) | 2009-2015 | MPI utilization | 40 |
|
Mo-99 supply chain participants |
Conference call/site visit (see Appendix C) | 2009-2015 | Tc-99m generator sales and Tc-99m generator purchases | 25 |
| Committee Analysis | ||||
| Medicare Part B data | 2006-2014 | 49 | ||
| 2010-2014 | 29 | |||
| Nuclear Pharmacy A (Rocky Mountain area) | 2008-2014 | Radiopharmaceutical doses dispensed | 42 | |
| 2010-2014 | 32 | |||
| Nuclear Pharmacy B (Upper Midwest) | 2008-2014 | Radiopharmaceutical doses dispensed | 29 | |
| 2010-2014 | 13 | |||
| Average reported decline ~2009/2010-2014/2015b | 25 | |||
a OECD-NEA reported data are for global Mo-99 supply and demand. However, the United States accounts for 50 percent of global demand; therefore, global demand trends are also reflected in the U.S. market.
b Data that contributed to the average reported decline estimate are the following: OECD-NEA, expert opinions of nuclear cardiologists and Mo-99 supply chain participants, and the committee’s analysis of Medicare Part B, Nuclear Pharmacy A, and Nuclear Pharmacy B data. See text for details.
Co-operation and Development’s s Nuclear Energy Agency (OECD-NEA). OECD-NEA surveys irradiation services suppliers and Mo-99 suppliers about the number of reactor operating days and Mo-99 production capacities within specified periods.
OECD-NEA has published three estimates of global demand for Mo-99 over the past 5 years:
- 2010: 12,000 6-day curies (Ci) per week (OECD-NEA, 2011b).
- 2012: 10,000 6-day Ci per week (OECD-NEA, 2012).
- 2015: 9,000 6-day Ci per week (OECD-NEA, 2015, 2016).
The 2009 Academies report on medical isotope production (NRC, 2009) estimated that global demand was 10,000 to 14,000 6-day Ci per week in 2006. This estimate was based on that report’s authoring committee’s discussions with global Mo-99 suppliers.
The OECD-NEA estimates show a 25 percent decline in demand for Mo-99 globally from 2010 to 2015. OECD-NEA suggests that this decline was driven by several changes in the utilization of Mo-99/Tc-99m as a result of the 2009-2010 Mo-99 supply shortages (see Chapter 3). These changes included the more efficient global distribution of available Mo-99/Tc-99m supplies, more efficient elution of technetium generators and patient scheduling, and the use of alternative imaging modalities (OECD-NEA, 2011b).
6.2 DOMESTIC DEMAND FOR Mo-99/Tc-99m
Representatives of a U.S. technetium generator supplier and a U.S.based national nuclear pharmacy chain told the committee that the OECD-NEA-estimated 25 percent decline in global Mo-99 demand before and after the 2009-2010 shortages is also reflected in the U.S. market.1 An analysis carried out by the committee suggests that the decline in Tc-99m use in the United States began before the 2009-2010 supply shortages:
- Published data from Kaiser Permanente of Northern California show a continuous reduction in myocardial perfusion imaging (MPI) procedures between 2000 and 2011; the reduction in MPI use from 2009 to 2011 was 30 percent (McNulty et al., 2014).
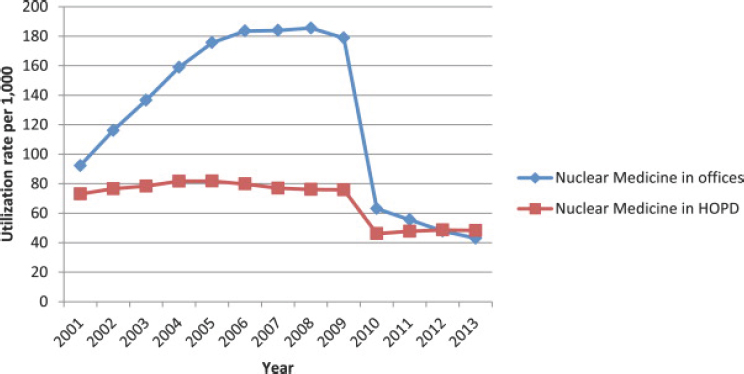
- A report on imaging utilization in six large integrated health care systems across the United States described a decrease in nuclear medicine use from 32 to 21 per 1,000 enrollees from 1996 to 2010
___________________
1 Ira Goldman, Lantheus Medical Imaging, verbal communication, June 2, 2015; and Scott Claunch, Cardinal Health, verbal communication, August 11, 2015.
-
(Smith-Bindman et al., 2012), a decline of 35 percent within this period.
- A group of nuclear cardiology experts working at institutions across the United States estimated that the decline in MPI in their practices was about 40 percent during the period 2009-2015.2
The committee’s analysis of Tc-99m utilization in the United States used data from the following two sources:
- Publicly available Medicare Part B data3 on outpatient services for the period 2006-2014. These data are summarized by billing code for specific diagnostic and therapeutic radiopharmaceutical doses approved for Medicare Part B reimbursement. These billing codes are known as the Healthcare Common Procedure Coding System (HCPCS) and are administered by the Centers for Medicare & Medicaid Services (CMS).4
- Data on radiopharmaceutical doses dispensed at two nuclear pharmacies in the United States5 during the period 2008-2014. Nuclear Pharmacy A is located in the Rocky Mountain area and Nuclear Pharmacy B in the Upper Midwest. Both nuclear pharmacies dispense unit doses for inpatients and outpatients of all ages.
These data are discussed in the following subsections.
6.2.1 Medicare Part B Data
Medicare is the federal health insurance program for people 65 years of age and older and those with permanent disabilities. Individuals enrolled in Medicare account for about 15 percent of the total population in the
___________________
2 These experts provided this information to the committee on a June 2, 2015, conference call; see Appendix C.
3 Centers for Medicare & Medicaid Services (CMS), Part B National Summary Data File. Available at https://www.cms.gov/Research-Statistics-Data-and-Systems/Downloadable-PublicUse-Files/Part-B-National-Summary-Data-File/Overview.html (accessed September 15, 2015). Permissions for this intended use of the American Medical Association (AMA) content were not required as this falls within “Fair Use.” Communication between Academies staff (Ourania Kosti) and AMA’s Licensing Manager (Cheryl Ashe).
4 HCPCS are based on Current Procedural Technology (CPT) codes developed, maintained, and copyrighted by AMA. CPT codes were developed to describe procedures and are assigned to every task and service a medical practitioner may provide to a patient. HCPCS codes were developed for billing purposes.
5 Data from these two nuclear pharmacies were provided to the Academies and permission to use these data was granted provided that the names of the nuclear pharmacies were not disclosed.
United States (Henry J. Kaiser Family Foundation, 2016a); Medicare’s share of total personal health care spending in the United States was 22 percent in 2013 (MedPAC, 2015). Medicare’s structure is described in Rajaram and Bilimoria (2015).
The committee used publicly available Medicare Part B data to assess trends in utilization of Tc-99m radiopharmaceuticals based on counts of HCPCS codes that were approved for reimbursement in particular years. The number of HCPCS codes approved for reimbursement each year equals the number of doses of a radiopharmaceutical approved for reimbursement for that same year, which is also equal to the number of procedures using a radiopharmaceutical approved for reimbursement that year. The only exception relates to doses for Tc-99m-sestamibi and tetrafosmin used for Tc-99m MPI; a complete Tc-99m MPI procedure typically utilizes two doses: one administered at rest and another during either an exercise or pharmacological stress. Appendix D provides the list of the radiopharmaceuticals and their HCPCS codes as well as the grouping of the HCPCS codes for the committee’s analysis.
An increasing number of Medicare beneficiaries are transitioning from Medicare Part B to Medicare Part C (also known as Medicare Advantage), a program that allows beneficiaries to receive Medicare-covered benefits by enrolling in private health plans: for example, health maintenance organizations and preferred provider organizations (Rajaram and Bilimoria, 2015). These Medicare-approved private plans provide all benefits covered under Medicare Parts A and B. However, services performed under Medicare Advantage are not reflected in the publicly available Medicare Part B National Summary Data. Medicare Advantage beneficiaries represented 16 percent of the total Medicare beneficiaries in 2006 and 31 percent of the total Medicare beneficiaries in 2014 (Henry J. Kaiser Family Foundation, 2016b).
The migration of beneficiaries from Medicare Part B to Part C (Medicare Advantage) introduces a systemic bias into the Medicare Part B National Summary Data on approved radiopharmaceutical doses. If one assumes that Tc-99m utilization rates by Medicare Part B and Part C beneficiaries is similar, then this bias can be removed by adjusting the data for each year as follows:
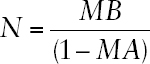
Where
| N = | Committee’s estimated number of Tc-99m radiopharmaceutical doses approved by Medicare in that year for both Medicare Part B and Part C (Medicare Advantage) beneficiaries. |
| MB = | Number of radiopharmaceutical doses approved for reimbursement by Medicare Part B in that year. |
| MA = | Percent (expressed as a decimal) of Medicare beneficiaries enrolled in Medicare Part C (Medicare Advantage) in that year. |
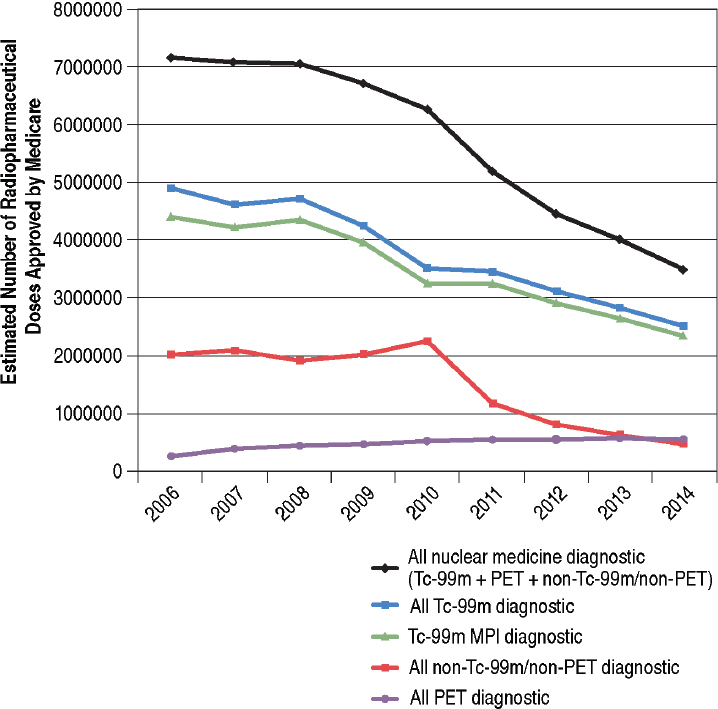
The committee adjusted Medicare Part B data for Medicare Advantage enrollments using the equation above. The committee’s estimates of Tc-99m radiopharmaceutical doses approved by Medicare are presented in Figure 6.1. Tc-99m diagnostic radiopharmaceutical utilization declined 49 percent from 2006 to 2014 (from an estimated 4.9 million to 2.5 million doses) and about 29 percent from 2010 to 2014 (blue line in Figure 6.1). These trends were driven primarily by reductions in utilization of Tc-99m doses for MPI (green line in Figure 6.1). MPI agents Tc-99m-sestamibi and tetrafosmin were estimated to account for more than 90 percent of all Tc-99m doses approved for reimbursement by Medicare.6
Utilization of radiopharmaceutical doses for all nuclear medicine diagnostic procedures declined 51 percent from 2006 to 2014 (from an estimated 7.2 million to 3.5 million; black line in Figure 6.1). Non-Tc-99m/non-positron emission tomography (PET) diagnostic utilization was relatively constant from 2006 to 2008; increased about 15 percent from 2008 to 2010; and declined about 50 percent from 2010 to 2011 (red line in Figure 6.1). The 2008-2010 increase and 2010-2011 decrease were likely driven by changes in utilization of thallium-201, which is used in myocardial scintigraphy for evaluating cardiac disorders. Thallium-201 myocardial scintigraphy is an alternative diagnostic test that replaced Tc-99m MPI during the 2009-2010 Mo-99/Tc-99m shortages. The quality of scans with thallium-201 is inferior compared to the quality of those acquired with Tc-99m MPI and the radiation dose to the patient is higher.
The decline in utilization of nuclear medicine diagnostic procedures during the period 2006-2014 does not include PET radiopharmaceutical utilization. In fact, PET utilization, which accounts for less than 4 percent of all nuclear diagnostic procedures in 2006, increased twofold from 2006 to 2014 among Medicare beneficiaries (purple line in Figure 6.1). In 2014 it accounted for about 15 percent of all nuclear diagnostic procedures among Medicare beneficiaries. Moreover, the utilization of other advanced imaging
___________________
6 Tc-99m MPI accounts for about 50 percent of all Tc-99m doses in the general population. This discrepancy with the Medicare data is believed to be age-specific.
procedures such as computed tomography (CT) and magnetic resonance imaging (MRI) also increased among Medicare beneficiaries during this period.7 These data are not shown.
___________________
7 For this analysis the committee used CPT codes for one common MRI and CT procedure: MRI of the lumbar spine (CPT codes 72148, 72149, 72158) and CT of the abdomen +/–pelvis (CPT codes 74150, 74160, 74170, 74146, 74177, 74178). The data were also adjusted for Medicare Advantage enrollments. The following workload changes were observed from 2006 through 2014: about +13 percent for MRI of the lumbosacral spine, about +28 percent for CT abdomen and/or pelvis, and about +135 percent for CT pulmonary angiograms.
6.2.2 Nuclear Pharmacy Data
The committee analyzed the number of radiopharmaceutical doses dispensed at two nuclear pharmacies (Nuclear Pharmacy A and Nuclear Pharmacy B, described previously) in the United States during the period 2008-2014. About 95 percent of the nuclear medicine doses delivered by these nuclear pharmacies were to outpatients and 5 percent were to inpatients.
Data from Nuclear Pharmacy A show a 42 percent decline in utilization of Tc-99m radiopharmaceutical doses from 2008 to 2014 and a 32 percent decline from 2010 to 2014 (blue line in Figure 6.2). This decline is similar to those for non-PET nuclear medicine radiopharmaceutical doses (orange line in Figure 6.2) and Tc-99m MPI diagnostic doses (green line
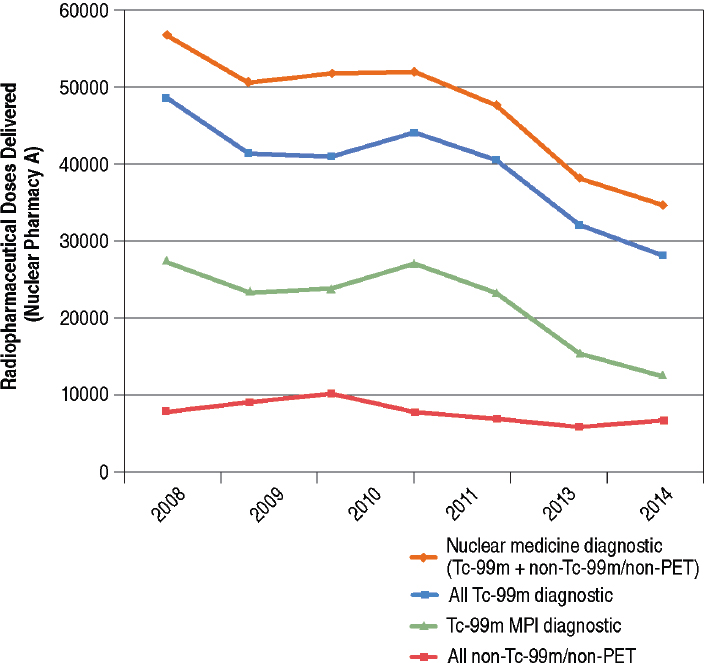
in Figure 6.2). Trends in Tc-99m utilization in Nuclear Pharmacy A were less driven by Tc-99m MPI compared to Medicare (see Figure 6.1). More specifically, Tc-99m MPI accounted for about half of all of the Tc-99m doses, a finding consistent with existing data for the general population. Also, there was not as dramatic a decline in non-Tc-99m/non-PET utilization from 2010 to 2011 (red line in Figure 6.2) compared to Medicare (red line in Figure 6.1).
Data from Nuclear Pharmacy B (see Figure 6.3) show a 29 percent decrease in utilization of Tc-99m radiopharmaceutical doses from 2008 to 2014 and a 13 percent decline from 2010 to 2014 (blue line in Figure 6.3). The decline in Tc-99 utilization (blue line in Figure 6.3) is similar to that for Tc-99m MPI diagnostic doses (green line in Figure 6.3) and for non-PET
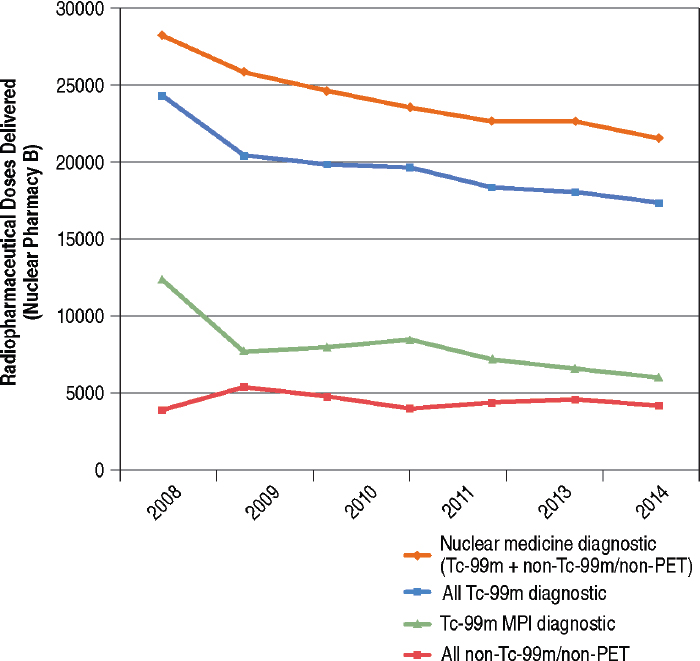
nuclear medicine radiopharmaceutical doses (orange line in Figure 6.3). Trends in Tc-99m utilization were not driven by Tc-99m MPI to the same degree as for Medicare patients (compare the green lines in Figures 6.1 and 6.3). Also there was not as dramatic a decline in non-Tc-99m/non-PET utilization from 2010 to 2011 (red line in Figure 6.3). The overall trends in radiopharmaceutical utilization in Nuclear Pharmacy A were similar to those observed for Nuclear Pharmacy B.
6.2.3 Discussion
Available data from published reports, expert opinions, and the committee’s independent analysis of data from Medicare Part B data and two nuclear pharmacies indicate that
- Mo-99/Tc-99m utilization in the United States has been declining for at least a decade. The decline started before the 2009-2010 Mo-99/Tc-99m supply shortages and continued until at least through 2014-2015, the latest period of available data.
- The decline is reflected in all nuclear imaging procedures except PET.
The observed decline in demand for Tc-99m ranges from 13 to 40 percent for the period 2009-2010 to 2014-2015 and is on average about 25 percent (see Table 6.1). This is a similar magnitude of decline as observed in global Mo-99 demand for the same period (see Section 6.1 in this chapter).
The observed variability in decline across the different data sets could be caused by age and geographic variability. Age and geographic (IOM, 2013) variation in health care utilization is well documented in the medical literature. Age variation may also explain the differences in MPI utilization between the Medicare and the nuclear pharmacy data sets. The Medicare population is 65 years of age and older, whereas the populations served by the two nuclear pharmacies are of all ages. Older populations are more likely to be diagnosed with heart disease and have MPI procedures.
6.3 FUTURE GLOBAL DEMAND FOR Mo-99/Tc-99m
Past attempts to estimate future Mo-99/Tc-99m demand have met with limited success, primarily because of the difficulties in forecasting medical, economic, and market developments that affect future demand. The previous Academies medical isotopes report (NRC, 2009) estimated that Mo-99/Tc-99m demand in the United States would grow between 3 percent and 5 percent per year for the period 2008-2012 “if there are no major disruptions in Mo-99/Tc-99m supplies and no major changes in
health care policies or practices” (NRC, 2009, p. 78). However, there was a major recession in the late 2000s, a supply disruption in 2009-2010, and there were also important changes in health care policies and practices during these periods. The Academies’ growth forecast proved to be overly optimistic at least in part because of these unforeseen developments.
OECD-NEA has revised its future Mo-99 demand estimates downward in response to new data on utilization trends. In 2011, for example, OECD-NEA estimated a 25 percent increase in Tc-99m utilization in mature markets (Europe, Japan, North America, Oceania, and South Korea) from 2010-2020 and a 40 percent increase in emerging markets (South America, Africa, and Asia8) for the same period (OECD-NEA, 2011b). These estimates were revised in 2015 to 0.5 percent and 5 percent per year, respectively, based on then-current information from supply chain participants (OECD-NEA, 2015).9 As noted in Section 6.1 of this chapter, OECD-NEA also adjusted its Mo-99 demand projections from 12,000 6-day Ci per week in 2010 to 9,000 6-day Ci per week in 2015.
OECD-NEA’s projected demand increase in mature markets (0.5 percent per year) is driven by population aging, which as noted previously should increase the demand for Tc-99m-based procedures. Projected out 5 years, this demand increase would amount to an additional 225 6-day Ci per week over the current estimated global demand (9,000 6-day Ci per week). This is essentially a stable demand.
Emerging markets accounted for about 16 percent of the global demand for Mo-99 in 2015 (OECD-NEA, 2015). OECD-NEA assumed that this portion of the market would grow at 5 percent per year because of population aging (especially in China), economic growth, and expansion of the health care sector in these countries. However, data to support this projected demand are limited. Moreover, some of the demand growth in emerging markets is likely to be met by regional Mo-99 suppliers (see Chapter 3) and will not affect Mo-99 supplies in mature markets.
Mature markets are estimated to account for the remaining 84 percent of global demand (OECD-NEA, 2015). As noted previously, the United States has historically accounted for about half of the global demand for Mo-99/Tc-99m. Therefore, at least over the next 5 years, Mo-99/Tc-99m utilization in the United States will drive global demand.
___________________
8 But not including Japan or the Republic of Korea.
9 The OECD-NEA does not presently have sufficient data to make new estimated growth rates.
6.4 FUTURE DOMESTIC DEMAND FOR Mo-99/Tc-99m
The committee has refrained from developing quantitative estimates of future demand for Mo-99/Tc-99m because it is unable to forecast future medical, economic, and market developments that could affect demand trends. The committee instead identified factors that have affected Mo-99/Tc-99m utilization in the past and that might affect future utilization, especially in the near term (i.e., over the next 5 years). These factors are described in the next two subsections.
6.4.1 Factors That Could Decrease Future Demand for Mo-99/Tc-99m
The committee identified eight factors that could decrease future demand for Mo-99/Tc-99m in the United States:
- Reduced reimbursements for medical imaging procedures
- Transitioning away from the fee-for-service health care model
- Decline in the number of nuclear medicine experts
- More efficient use of technetium generators and Tc-99m-based radiopharmaceuticals
- Widespread acceptance and further development of appropriate use criteria
- Slow progress in new Tc-99m radiopharmaceutical development
- Increasing preference for competing imaging modalities
- Radiation exposure concerns
These factors are described in the following subsections. The committee judges that the first six of these factors could be particularly important for modulating domestic demand over the next 5 years.
6.4.4.1 Reduced Reimbursements for Medical Imaging Procedures
Per capita, health care costs in the United States are twice the average of other developed countries, and the percentage of the U.S. gross domestic product spent on health care continues to grow. Efforts to control these costs in recent years have resulted in reduced reimbursements for medical imaging procedures. These reductions were triggered by a 2005 report to Congress that noted that the growth rate for imaging procedures far exceeded rates for other medical services. The report raised concerns about the appropriateness of the imaging services being provided (GAO, 2008; MedPAC, 2015). Many of these services were provided in private offices.
The federal government has addressed these concerns by changing reimbursement policies to limit office-based medical imaging. The most
important of these changes was the Deficit Reduction Act of 2005 (P.L. 109-171). Congress enacted special payment rules, effective January 1, 2007, that limit reimbursements for the technical component of imaging services10 performed in private offices. These special payment rules eliminated financial incentives for performing studies such as nuclear MPI in private offices. In 2009, CMS implemented a strategy to bundle services, frequently provided together as an episode of care, into one code and to reimburse a fixed amount for the bundle without adjustment for services actually provided. This new reimbursement policy discouraged providers from performing tests having little clinical value-added11 because the costs would have to be borne by the provider, not the payer (Ferrari et al., 2014).
These changes in reimbursement policies resulted in an abrupt and nearly threefold reduction in the number of office-based nuclear medicine procedures (primarily MPI studies) performed from 2008-2010 (see Figure 6.4), and they likely played a significant role in the observed decline in nuclear medicine procedures from about 2007 to today. These changes are also likely to affect future health care practices and to further reduce the demand for nuclear imaging (and Mo-99/Tc-99m).
6.4.4.2 Transitioning Away from the Fee-for-Service Health Care Model
There are two major changes in the traditional fee-for-service health care model: capitation and value-based adjustments. The fee-for-service model encourages providers to offer more billable services, whereas the capitated and value-based models incentivize providers to reduce spending.
- Capitation gives providers a prepaid fixed payment based on expected annual spending for each enrolled patient. This payment is not determined by the services actually offered, so providers have no financial incentive to perform imaging studies that provide little added clinical value.
- Value-based adjustments, such as Medicare’s Hospital Value-Based Purchasing (CMS, 2015) system, reward hospitals for efficiency as measured by the costs of individual episodes of care starting from 3 days prior to admission to 30 days after discharge.
___________________
10 Most imaging procedures permit separate reimbursement for generating the image (technical component) and reading and interpreting the images generated (the professional component). Under these special payment rules, reimbursements for the technical component of imaging services provided in a physician office setting cannot be greater than the same service provided in a hospital outpatient setting.
11 There is some overlap in the information provided by the different imaging modalities. In the fee-for-service model of health care, there is motivation to employ multiple imaging modalities because an additional test may provide some unique useful information for disease diagnosis. But this approach is expensive and often has limited return.
The switch from fee-for-service to capitation and value-based health care models could further reduce the number of imaging procedures performed, including those utilizing Mo-99/Tc-99m.
The full transition from fee-for-service to capitated or value-based payments will occur over many years. The U.S. Department of Health and Human Services (HHS) announced a goal of transitioning 85 percent of Medicare fee-for-service reimbursements into fee-for-value payments by 2016 (HHS, 2015). At the end of 2014, CMS estimated that 20 percent of Medicare payments were made under the fee-for-value model.
6.4.4.3 Decline in the Number of Nuclear Medicine Experts
General nuclear medicine (excluding nuclear cardiology) is practiced by physicians certified in nuclear medicine and nuclear radiology or radiologists who are not specialty trained in nuclear medicine.12 The number of physicians with training in nuclear medicine and nuclear radiology is cur-
___________________
12 All radiologists have some nuclear medical experience as part of their residency.
rently low and declining as practicing physicians retire. Few physicians are certified in nuclear medicine each year by the American Board of Nuclear Medicine: an average of 74 physicians per year were certified from 2004 through 2013 nationwide (ABMS, 2015). The number of radiologists who opt for fellowships in nuclear radiology is even lower: an average of 6 radiologists per year opted for fellowships from 2004 through 2014 nationwide. In comparison, about 1,200 physicians were certified in diagnostic radiology each year (ABMS, 2015).
Radiologists who are not specialty trained in nuclear medicine now provide the majority of professional services in the practice of general (non-cardiac) nuclear medicine because there are a limited number of specialty-trained physicians in nuclear medicine. The lack of specialty expertise in nuclear medicine among radiologists is likely to influence practice preferences in favor of alternate imaging modalities. The selection of alternate modalities by physicians could further reduce demand for Mo-99/Tc-99m in their practices.
The number of cardiologists with training in nuclear cardiology remains relatively steady (ABIM, 2015). On average, about 66 percent of all cardiologists in the United States obtain additional credentials in nuclear cardiology through the Certification Board of Nuclear Cardiology (CBNC). CBNC awarded primary certification to 571 cardiologists in 2014.13 Cardiologists trained in nuclear cardiology will likely continue to utilize Tc-99m MPI in their practices until superior imaging modalities gain widespread acceptance and until reimbursement and the infrastructure exists to permit migration to these alternatives.
6.4.4.4 More Efficient Use of Technetium Generators and Tc-99m-Based Radiopharmaceuticals
Regional commercial nuclear pharmacies have replaced many hospital-based nuclear pharmacies over the last few decades. These commercial nuclear pharmacies have improved the efficiency of technetium generator utilization by more effectively matching generator supplies with Tc-99m radiopharmaceutical demand, primarily through economies of scale and more effective scheduling. Nuclear pharmacies and Tc-99m end users (hospitals and clinics) implemented other procedural changes to improve Tc-99m utilization efficiencies during the 2009-2010 Mo-99 supply shortages. These included the following:
- More frequent technetium generator elutions to increase Tc-99m yields (see discussion in Section 2.5.5 in Chapter 2).
___________________
- Use of appropriate software to track Tc-99m utilization and estimate Tc-99m activities needed daily or weekly to allow generator sizes and delivery schedules to be optimized.
- Adjustments to imaging schedules to better utilize available Tc-99m supplies, including grouping exams that use the same radiopharmaceuticals.
- Refinements of imaging protocols to reduce the activity administered to patients without compromising image quality.
- Use of more sensitive imaging equipment (solid-state detectors) to reduce the activity administered to patients (Gambhir et al., 2009).
Further penetration of these procedural changes in nuclear pharmacies and imaging centers could further increase Tc-99m utilization efficiencies and decrease demand for Mo-99/Tc-99m.
6.4.4.5 Widespread Acceptance and Further Development of Appropriate Use Criteria
The initial motivation for developing and promoting Appropriate Use Criteria (AUC) arose from concerns about costs and harms associated with unnecessary imaging.14 Introduction of AUC has impacted clinical practice since around 2005, especially in cardiology, and it has resulted in lower use of some imaging procedures when minimal or no patient benefit is expected.
The definition of an appropriate diagnostic or therapeutic procedure is “one in which the expected clinical benefit exceeds the risks of the procedure by a sufficiently wide margin such that the procedure is generally considered acceptable or reasonable care” (Mann et al., 2015). AUC currently do not strongly support the use of one imaging modality over another; instead, they provide a score or categorical assignment as to the appropriateness of an imaging study in a given clinical setting.
AUC often score multiple types of imaging modalities similarly, allowing flexibility to the ordering physician to decide on the appropriate imaging modality and to incorporate secondary considerations (e.g., safety, cost,
___________________
14 The methods for the development of AUC have evolved over time. The following process is used at present: A multidisciplinary panel of experts first develops a list of possible clinical indications for the tests based on patients’ symptoms at the time of presentation, and it reviews the literature that assesses the performance of the tests in various clinical settings. Once the list of indications and the literature review have been vetted, a rating panel is convened. Each panel member independently rates each test for each indication using a 9-point scale, where 1-3 is “rarely appropriate,” 4-6 “may be appropriate,” and 7-9 is “appropriate.” One or more additional rounds of scoring occur when the rating panel members interact and each panel member is allowed to change his/her score based on panel discussions. The process ends when consensus is reached for the indications being assessed.
local expertise, availability, and patient preference) in the decision-making process (Hendel et al., 2013).
AUC are broadly used in decisions for diagnostic or therapeutic procedures in cardiology and have likely contributed to the decline in imaging studies utilizing Tc-99m. The use of AUC in other disciplines could lead to the further decline in imaging procedures, including those that utilize Tc-99m, if those AUC were to give greater weight to alternate imaging modalities.
6.4.4.6 Slow Progress in New Tc-99m Radiopharmaceutical Development
Several Tc-99m radiopharmaceuticals have been removed from the U.S. market over the past 25 years (see Table 6.2). Additionally, there has been slow progress during the past decade in developing new Tc-99m radiopharmaceuticals that could stimulate demand for Mo-99/Tc-99m.15
The most recent Tc-99m agent to be approved by the Food and Drug Administration (FDA) was Tc-99m tilmanocept (Lymphoseek™), which is used for imaging the lymph nodes in cancer patients (Azad et al., 2015). FDA approval of this agent occurred in 2013.
According to the U.S. National Institutes of Health database of active clinical trials (ClinicalTrials.gov), only one novel FDA-approved Tc-99m agent, Tc-99m-EC-DG (Ethylenedicysteine-Deoxyglucose), is currently being evaluated in a multicenter Phase 3 (NIH, 2008) study.16 Another 10 clinical trials are evaluating off-label Tc-99m agents (i.e., agents used for different indications than those described in the FDA-approved drug label).17 A few Tc-99m radiopharmaceuticals are at various stages of preclinical study development.18
Most new radiopharmaceutical development is for PET imaging. Nuclear imaging with PET offers many advantages over single-photon emission computerized tomography (SPECT). These include better image quality due to improvement in resolution, better hybrid integration with
___________________
15 Developers of a potential new radiopharmaceutical must weigh the costs of research and regulatory approval against the potential downstream profits of an approved drug. If future reimbursements for the new drug are judged to be low, then the expected downstream profits will be smaller, and development of the radiopharmaceutical will be less attractive.
16 The purpose of this study is to determine if the images of the primary lesions of lung cancer and any metastatic lesions seen from the investigational SPECT/CT Tc-99m-EC-DG scans are the same as the PET/CT 18F-FDG scans.
17 Search performed by the committee on February 28, 2016.
18 For example: Tc-99m etarfolatide to evaluate response to treatment in patients with metastatic ovarian and lung cancer, Tc-Annexin V-128 as an in vivo apoptosis imaging marker, and Tc-99m-PSMA to diagnose prostate cancer.
TABLE 6.2 List of Tc-99m Agents Discontinued from the U.S. Market
| Tc-99m-Radiopharmaceutical | Year Approved by the FDA | Year Discontinued | Reason for Discontinuance |
|---|---|---|---|
| Tc-99m-Arcitumomab (CEA Scan™) | 1996 | 2006 | Low sales |
| Tc-99m-Fanolesomab (NeutroSpec™) | 2004 | 2005 | Reported life-threatening adverse effects |
| Tc-99m-Apcitide (AcuTect™) | 1998 | 2005 | Low sales |
| Tc-99m-Teboroxime (Cardiotec™) | 1991 | ca. 1994 | Low sales |
CT and MRI, and the capacity for quantitative imaging (Kudo, 2007). Two new PET agents received FDA approval in 2016.19
6.4.4.7 Increasing Preference for Competing Imaging Modalities
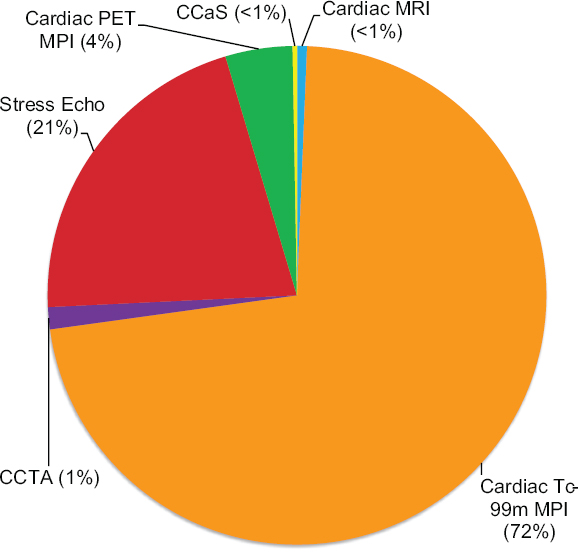
Advancements in medical imaging have enabled the development of new imaging modalities for disease diagnosis, some of which compete with SPECT imaging. For example, cardiac ischemia can be diagnosed using six different procedures: MPI SPECT, cardiac CT angiography (CCTA), stress echocardiography, cardiac PET MPI, coronary artery calcium scoring, and cardiac MRI perfusion. The relative utilization of these procedures for all noninvasive cardiac imaging procedures among Medicare B recipients 2014 is shown in Figure 6.5. Tc-99m MPI SPECT is the most utilized cardiac imaging procedure today, accounting for 72 percent of cardiac imaging performed in the United States. Cardiac MRI scans (performed for any purpose) comprise less than 1 percent, and cardiac PET comprises about 4 percent.
The choice of imaging modality to diagnose cardiac ischemia and disease in general is often dictated by available infrastructure (equipment and expertise), cost, and amount of reimbursement. These factors are less favorable today for MRI and PET than for SPECT imaging. At present, infrastructure does not exist for any substantive conversion of Tc-99m MPI SPECT to cardiac MRI or PET in the United States. Even if utilization of Tc-99m MPI SPECT undergoes further decline, the volume is likely to
___________________
19 These are Ga-68 DOTATATE (produced with a Somakit-TATE kit), a PET agent for neuroendocrine tumor diagnosis and follow-up, and F-18 FACBC (F-18 fluciclovine) for prostate cancer recurrence.
remain high compared to alternate modalities for cardiac imaging. Other factors such as physician preferences and expertise as well as patient-specific factors will continue to affect the choice of imaging modalities in the future.
6.4.4.8 Radiation Exposure Concerns
A report released by the National Council on Radiation Protection and Measurements in early 2009 indicated that Americans were exposed to about six times as much ionizing radiation from medical diagnostic procedures in 2006 than in 1980 (3 mSv per capita per year compared to 0.5 mSv) (NCRP, 2009). The increased exposures in medical diagnostic imaging were driven primarily by the increased usage of higher-dose procedures,
particularly CT and nuclear medicine (especially nuclear cardiology) (Lin, 2010; Mettler et al., 2009). Physician and patient concerns about the potential health consequences of these increased exposures, especially related to cancer, have driven efforts to reduce patient exposures by eliminating unnecessary procedures (see discussion on AUC in Section 6.4.4.5 in this chapter) and reducing the radiation doses received from these procedures. The Image Gently and Image Wisely initiatives20 are notable examples of these efforts.
Advancements in gamma cameras and image processing software have improved image quality while lowering radiation doses. Such software is already in wide use in nuclear medicine and is therefore unlikely to result in substantial further dose reductions in nuclear medicine studies. Further dose reductions are most likely to be obtained from further reduction in unnecessary imaging procedures.
6.4.2 Factors That Could Increase Future Demand for Mo-99/Tc-99m
The committee identified two factors that could increase future demand for Mo-99/Tc-99m in the United States:
- Aging populations
- Greater access to health care
These factors are described in the following two subsections.
6.4.2.1 Aging Populations
The need for health care services in the United States will increase as the population ages, and the U.S. population is aging. About 15 percent of the U.S. population is currently 65 and older (48 million of the 320 million total current population); this segment of the population is expected to nearly double by 2030 (72 million of the 358 million total projected population), when the median postwar baby boom generation is expected to reach 75 years of age, and stabilize thereafter (Ortman et al., 2014).
This change in the population age structure, together with trends in obesity and diabetes, are expected to lead to the increased incidence of coronary heart disease in the United States: from about 17 million cases in 2015 to 21 million cases in 2018 to 30 million cases by 2027.21 These
___________________
20 See http://www.imagewisely.org/ and http://www.imagegently.org/.
21 These predictions come from the Future Elderly Model, a microsimulation model developed to examine health and health care costs. This model has been used in many predictions of health and health spending. See Gaudette et al. (2015) and NASEM (2015).
trends will likely result in increased demand for cardiac imaging procedures that utilize Tc-99m.
6.4.2.2 Greater Access to Health Care
The 2014 Affordable Care Act (P.L. 111-148) requires almost all citizens to be covered by health insurance, either through their employer or purchased from the government or a third-party provider. The rate of uninsured adults in the United States dropped by about 7 percent, from 18 percent before the fourth quarter of 2013 (just before the Affordable Care Act took effect) to 11 percent in the second quarter of 2015 (Marken, 2015). The increase in insured Americans could result in some additional growth in Tc-99m-based imaging procedures. However, many of the Tc-99m MPI SPECT scans performed in the United States are already covered by Medicare, so the growth in Tc-99m-based imaging procedures could be less than for imaging procedures in general.
6.5 DOMESTIC DEMAND FOR I-131 AND Xe-133 AND FUTURE PROJECTIONS
The committee is not aware of any published estimates of future demand for the medical isotopes I-131 and Xe-133. Some marketing companies collect survey data on utilization of these medical isotopes, but their analyses are based on low participation rates and their estimates may therefore have limited accuracy.
The committee analyzed Medicare Part B data to assess historic trends in I-131 and Xe-133 utilization using the same methodology described in Section 6.2 of this chapter. Medicare reports the amount of I-131 activity (in microcuries [μCi] or millicuries [mCi]) administered in procedures, not the number of radiopharmaceutical doses. Medicare reports Xe-133 utilization in terms of doses, similar to reporting on Tc-99m-based radiopharmaceuticals.
6.5.1 Iodine-131
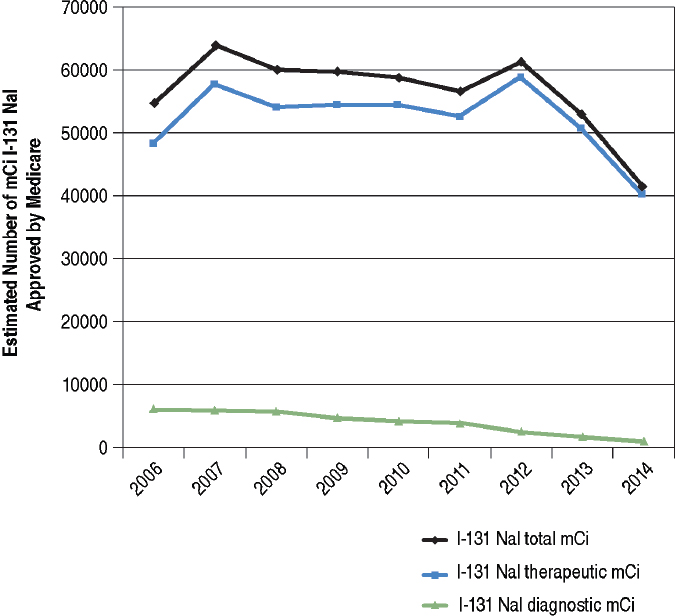
The committee’s analysis of Medicare Part B data showed a 24 percent decline in total I-131 utilization for both therapeutic and diagnostic purposes from 2006 to 2014 (black line in Figure 6.6). The decline in I-131 utilization for diagnostic purposes began around 2008 and continued through 2014 (green line in Figure 6.6). I-131 utilization for therapeutic purposes declined slightly from 2007 to 2011, increased slightly from 2011 to 2012, and declined sharply (about 40 percent) from 2012 to 2014 (blue line in Figure 6.6).
Approximately 20 percent of thyroid cancers diagnosed in the United States are among individuals 65 years and older22 and therefore eligible for Medicare. Consequently, the exact percent of decline observed by the committee’s analysis of Medicare Part B data may not be representative of the entire U.S. population.
Most I-131-NaI used today is for the treatment of hyperthyroid disorders and thyroid cancer. The American Thyroid Association (ATA) revised its guidelines for the management of these diseases in 2009 (Cooper et al., 2009). The revised guidelines include a recommendation to not use I-131NaI to treat patients who are at very low risk of cancer recurrence after surgery, and also to use reduced doses of I-131-NaI to treat patients who are at low risk of recurrence and have no residual disease after surgery
___________________
(Haugen et al., 2016). The latter recommendation was supported by two studies published in 2012 (Mallick et al., 2012; Schlumberger et al., 2012).
These and other recommendations by ATA have contributed to the decline in I-131 utilization in therapy observed in Figure 6.6. I-131 utilization for treatment of hyperthyroidism has remained relatively stable and is expected to remain so in the near future.
I-131 utilization for diagnostic purposes overall is only about 10 percent of the doses used for therapy. Diagnostic applications for I-131 include the following:
- Measuring thyroid uptake and imaging the thyroid for the diagnosis of thyroid disease.
- Imaging the thyroids of thyroid cancer patients to demonstrate presence of remnant or metastasis and the need for I-131 therapy.
Iodine-131 for thyroid imaging is being replaced by I-12323 because it is less likely to damage thyroid cells during imaging. The practice of imaging the thyroid before I-131 therapy is also becoming less common because of the low sensitivity of thyroid scans (using either I-123 or I-131) for detecting remnant or metastasis and concerns about decreased uptake of the subsequent therapeutic dose by the remnant thyroid tissue or metastatic cells.24 These changes in practice have contributed to the decline in I-131 used in diagnostic procedures.
The committee anticipates that it may take the medical community a few additional years to fully adopt the ATA recommendations. Therefore, it is possible that Na I-131 used in therapy and I-131 used in diagnosis will further decline in the near future.
6.5.2 Xenon-133
Xe-133 is the only FDA-approved agent for pulmonary ventilation studies in the United States. Most of these studies are done in conjunction with Tc-99m macroaggregated albumin (MAA) lung perfusion imaging for the diagnosis of pulmonary embolism. The other ventilation agent in wide use in the United States is Tc-99m DTPA aerosol (an off-label use of an FDA-approved agent).25 Tc-99m TechnegasTM (Tc-99m delivered as an ultrafine carbon dust) is approved only for use outside the United States.
___________________
23 I-123 has a half-life of about 13.2 hours. It decays to tellurium-123 via electron capture and emits a gamma ray with a predominant energy of 159 kiloelectron volts (keV).
24 Described in the medical literature as stunning.
25 Tc-99m-DTPA is FDA approved as a renal and brain imaging agent (see Table 2.1, Chapter 2) but its off-label use in ventilation imaging is more common than its FDA-approved use in renal and brain imaging.
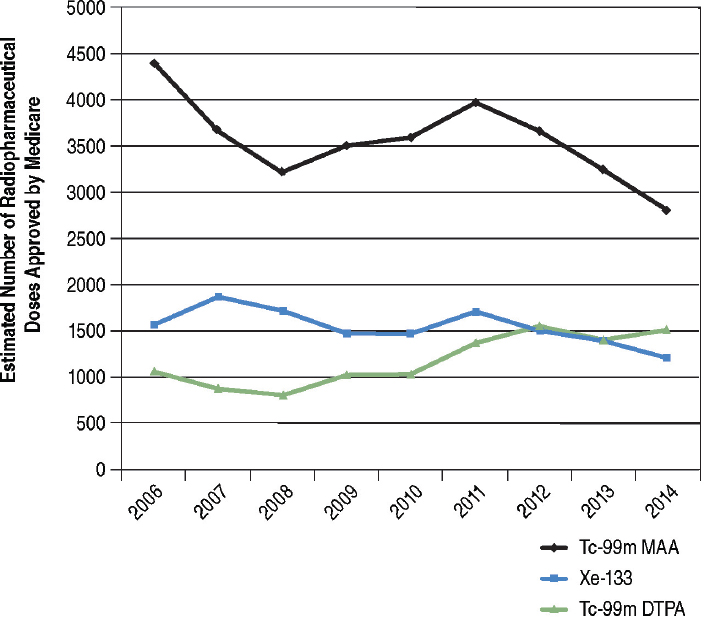
Xe-133 utilization declined 24 percent during the period 2006 to 2014 among Medicare beneficiaries (blue line in Figure 6.7). Tc-99m-MAA utilization for lung perfusion declined by about 36 percent during this same period (black line in Figure 6.7) while use of Tc-99m DTPA aerosol increased by about 43 percent (green line in Figure 6.7). These trends suggest that Tc-99m DTPA aerosol is replacing Xe-133 for pulmonary ventilation studies. There may be several reasons for this shift, but it is primarily because Xe-133 studies
- Must be carried out in a room with a negative ambient air pressure relative to outside hallways and with an exhaust vent to remove xenon gas.
- Require an additional piece of equipment (a gas delivery system) with associated quality control procedures.
- Provide limited projection images.
The committee judges that it is likely that Tc-99m DTPA aerosol will continue to replace Xe-133 in the near future because of the above factors. In addition, Xe-133 utilization could decline further if FDA approves TechnegasTM for use in the United States and cost and reimbursement arrangements favor it over the other alternatives. Technegas is generally accepted to be superior to either Xe-133 or Tc-99m DTPA aerosol for pulmonary ventilation imaging (Jögi et al., 2010).
Technegas is manufactured in Australia by Cyclomedica Australia Pty Ltd. The Australian manufacturer has (intermittently) been trying to obtain FDA approval for Technegas for many years.
6.6 FINDING
The committee developed one finding to address the demand side of the fourth study charge to assess the “adequacy of molybdenum-99 supplies to meet future domestic medical needs, particularly in 2016 and beyond.” The finding is presented below.
FINDING 4A: Domestic demand for molybdenum-99/technetium-99m for medical use has been declining for at least a decade. The decline began well before the global Mo-99 supply shortages in 2009-2010 and is reflected in nuclear imaging procedures that utilize technetium-99m. The average decline in domestic molybdenum-99/technetium-99m utilization from 2009-2010 to 2014-2015 was about 25 percent, similar to the estimated decline in global molybdenum-99 demand for that same period. Some of the factors responsible for the decline in domestic demand will continue to operate into the future, making it unlikely that domestic demand will increase significantly over the next 5 years. International demand for molybdenum-99 for medical use may increase over the next 5 years primarily because of higher utilization in emerging Asian markets.
OECD-NEA estimates that global demand for Mo-99 in 2015 was about 9,000 6-day Ci per week, a decrease of about 25 percent since 2010. This estimate is based on data provided by Mo-99 suppliers and is likely to
be reliable. The committee’s analysis presented in this chapter indicates that Mo-99/Tc-99m utilization in the United States has also declined on average about 25 percent since 2009-2010 (see Table 6.1). Moreover, Mo-99/Tc-99m utilization in the United States has been declining for at least a decade, starting well before the 2009-2010 Mo-99 global supply shortages and continuing through the most recent available data in 2014-2015. This decline is reflected in all nuclear imaging procedures except PET.
OECD-NEA’s latest estimates for future growth in global demand for Mo-99 are 0.5 percent in mature markets (including the United States) and 5 percent in emerging markets (e.g., Asia). The demand growth in mature markets is expected to be driven by aging populations, whereas growth in emerging markets is expected to be driven by aging population, economic growth, and expansion of the health care sector.
The committee judges that demand for Mo-99/Tc-99m in the United States is unlikely to grow significantly over the next 5 years primarily because of changes in health care policies, reimbursement rules, and medical practices. Some of these changes will take several additional years to be fully implemented across the U.S. health care system and therefore will continue to put downward pressures on domestic demand; these pressures may not be offset by potential growth factors such as aging of the U.S. population and greater access to health care.


