
2
Racism and Health Inequities1
The keynote presentation was delivered by Gilbert C. Gee, a professor in the Fielding School of Public Health at the University of California, Los Angeles. Gee provided an overview of the role of racism in the production of racial and ethnic health inequities and discussed intersectionality as a lens for examining the impact of racism over the life course.
RACE IN THE UNITED STATES
As argued by Healthy People 2020, reducing racial health inequities will require attending to the “historical and contemporary injustices” that underlie race relations (National Partnership for Action to End Health Disparities, 2011; also see Braveman and Gruskin, 2003).2 In the United States, a conversation about injustice and inequities has to include a discussion of the central role of race and ethnicity, Gee said. Race and ethnicity shape official reports, social policies, and many of our day-today interactions. Statistics from a variety of agencies, including the U.S.
_______________
1 This synopsis by the rapporteur of the presentation by Gilbert Gee, a professor at the Fielding School of Public Health at the University of California, Los Angeles, and the statements therein have not been endorsed or verified by the National Academies of Sciences, Engineering, and Medicine.
2 More on the definition of health equity cited by Healthy People 2020 is available at https://www.healthypeople.gov/2020/about/foundation-health-measures/Disparities#5 (accessed July 13, 2016).
TABLE 2-1 U.S. Census Categories
| Race Alone or in Combination with One or More Other Races | |
|---|---|
| Total population | 314,107,084 |
| White | 239,576,409 |
| Black or African American | 43,081,695 |
| American Indian and Alaska Native | 5,235,224 |
| Asian | 18,515,599 |
| Native Hawaiian and Other Pacific Islander | 1,234,990 |
|
Some other race |
16,444,358 |
SOURCES: Gee Presentation, February 4, 2016, data available at http://factfinder.census.gov/faces/tableservices/jsf/pages/productview.xhtml?pid=ACS_14_5YR_DP05&src=pt (accessed May 16, 2016).
Census Bureau, provide data on a variety of health indicators and population indicators. Despite their objective appearances, many of these reports carry implied messages and value judgements.
For example, consider this table (see Table 2-1) from the U.S. Census Bureau. The groups on the Census list are not in alphabetical order, they are not listed by population size, and they are not listed by who was on this land first, Gee said. Implied in this very simple ranking are some implicit notions of which groups are thought to be most deserving of conversation.
Racism
When people talk about race in the United States, Gee said, they need to confront the historical reality of racism. It is a historical and contemporary fact that racism has shaped the lives and meanings of people of color in the United States. In 1882, for example, President Chester A. Arthur signed the Chinese Exclusion Act of 1882 (see Figure 2-1). The act was the first to specifically prevent the immigration of an entire group of laborers based upon ethnicity. When people talk about discrimination, it is important to recognize the role not only of day-to-day individual experiences, but also the structures that perpetuate such inequality. Today, the United States may no longer have de jure segregation of things like water fountains or systems, but if people think about what has happened with lead in the drinking water in Flint, Michigan, or national discussions about closing United States borders to immigrants, it might be said that those days of overt blatant racism are not the distant past, but a contemporary reality (see Figure 2-2).
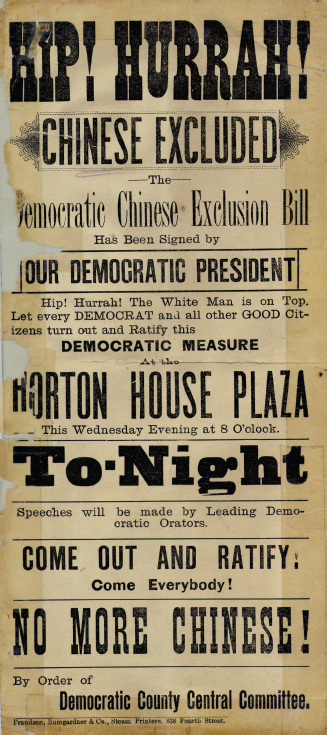
FIGURE 2-1 Image of Chinese Exclusion Act of 1882.
SOURCE: Courtesy of Royal British Columbia Museum and Archives.
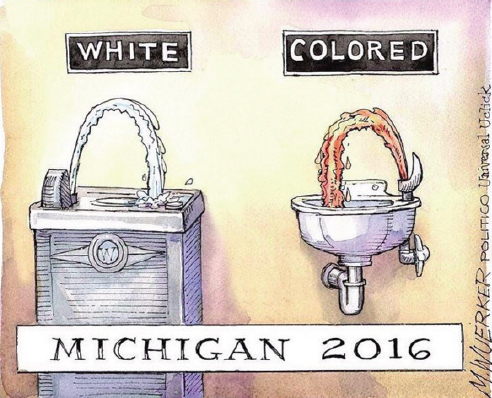
FIGURE 2-2 Michigan 2016.
SOURCE: Matt Wuerker, 2016.
Developing a Multilevel Understanding of Race and Health
Many scholars have talked about racism at multiple levels, including some of the early writings by Carmichael and Hamilton (1967) that talked about racism as stemming from both interpersonal and structural levels. More recent scholars such as Camara Jones (2000) have talked about a variety of these levels. In his own work, Gee uses a multilevel perspective on race and racism that incorporates an understanding of overt interpersonal racism and covert structural racism (Gee et al., 2009). Gee said that ignoring the significant contribution made by structural racism makes it much more difficult to reverse the trajectory of health inequities.
Importantly, this multilevel understanding of race and racism parallels a broader understanding of the multilevel production of well-being. Urie Bronfenbrenner and many others have talked about how the health and well-being of individual persons are not simply about their personal behaviors but, also, importantly, a function of who their peers are, what is going on with their families, where they live, where they work, where
they play, the laws of the land, economic conditions where they live, and where they are in a particular historical moment (Bronfenbrenner, 1994; Niederer et al., 2009).3 Taken together, both health and racism are produced at multiple levels, and future research should account for such complexity, Gee said.
Discrimination and Health
Many meta-analyses and reviews have been published in recent years that have consistently shown that people’s experiences with discrimination are associated with a variety of morbidity outcomes, not only in the United States but across the world (Paradies et al., 2015; Pascoe and Smart Richman, 2009; Schmitt et al., 2014; Williams and Mohammed, 2009).
Gee and colleagues documented the association between reports of discrimination and health outcomes with data from the 2002–2003 National Latino and Asian American Study. A greater frequency of reports of discrimination was associated with a higher predicted probability of having a variety of health problems such as clinical depression, respiratory problems, pain-related conditions, and cardiovascular conditions as well as with global markers of self-rated health (Gee et al., 2007b,c) (see Figure 2-3).
In another article Gee and his colleague Devon Payne-Sturges proposed an exposure-disease framework for environmental health disparities (Gee and Payne-Sturges, 2004) (see Figure 2-4). One of the key propositions of that framework is that not only does segregation concentrate social and environmental toxins as well as poverty and other social problems, but the two types of factors can potentially amplify each other. It is not just the independent effects of lead or the independent effects of concentrated poverty that affect individual and community stress; it is their combination that makes both of them more toxic. It is the synergy between these exposures to social and environmental toxins that amplifies or widens racial health inequities.
Intersectional Frameworks
The intersections between poverty and race and ethnicity can be approached through a broader body of research on intersectionality (e.g., Collins, 1991; Crenshaw, 1991). Intersectionality recognizes that our identities are not simply single social categories. Rather than treating race or
_______________
3 An image of Bronfenbrenner’s ecological model is available in Niederer et al. (2009); see http://bmcpublichealth.biomedcentral.com/articles/10.1186/1471-2458-9-94 (accessed May 4, 2016).
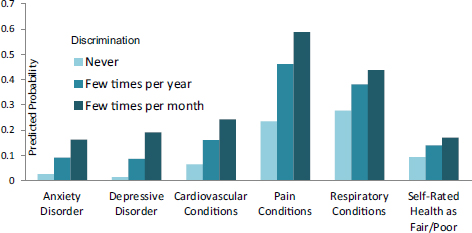
FIGURE 2-3 Association between reports of discrimination and health outcomes, according to the National Latino and Asian American Study, 2002–2003 (n = 2,095).
SOURCE: Gee and Ro, 2009.
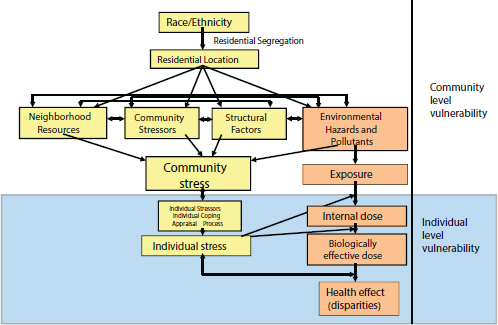
FIGURE 2-4 Exposure–disease–stress framework for environmental health disparities.
SOURCE: Gee and Payne-Sturges, 2004.
gender as separate categories, they need to be understood as interlocking systems of oppression that shape people’s lives (Collins, 1991; Ford and Airhihenbuwa, 2010; Schulz and Mullings, 2005; Virnell-Fuentes et al., 2012).
An intersectional framework informed the work of Gee and colleagues when they did a national study of Latino and Asian American immigrants and the relationship between racial discrimination, body mass index (BMI), and years in the United States. What they found is that the longer immigrants were in the United States (the range was 1 to 45 years), the stronger the relationship between BMI and discrimination (Gee et al., 2008). Taken another way, this analysis suggests that duration in the United States is not simply a marker of “acculturation” to United States norms. Rather, duration could also be reconceptualized as a greater length of exposure to racial bias (see Figure 2-5).
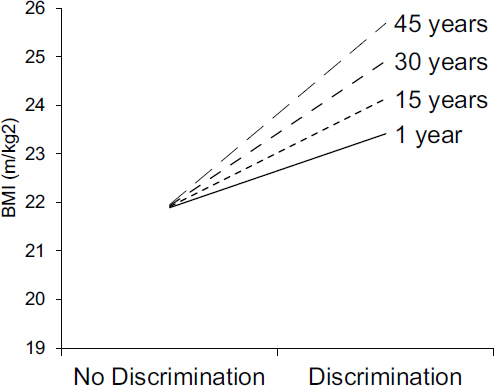
FIGURE 2-5 Interaction between racial discrimination and years in the United States, according to the National Latino and Asian American Study (n = 2,095).
SOURCE: Gee et al., 2008.
RACISM OVER THE LIFE COURSE
What is important about a life-course perspective, Gee said, is not simply viewing human aging as a function of biology, but also understanding that as people age, they encounter new social institutions. As people age into new social institutions, they age into new forms of racism (Gee et al., 2012).
What this suggests, Gee said, is that the nature of discrimination changes as people age, and researchers need to attend to these changes in their analyses. Gee presented evidence that reports of discrimination change with age, using data from the National Longitudinal Surveys of Young Women and Mature Women, a dataset produced by the Bureau of Labor Statistics. These surveys started in 1967 and have sampled more than 10,000 working women (2,815 black; 7,237 white; 134 other). To Gee’s knowledge, these surveys include the longest running span of representative reports on self-reported race, gender, and age discrimination in the workplace (Gee et al., 2007a).
The analyses show that reports of age discrimination follow an S-shape. Reports of age discrimination in women are relatively high around age 20, drop around age 30, rise again in the 50s, and then decline in 60s and 70s when women retire or are at positions of power in the workplace (see Figure 2-6). The shape of gender discrimination is qualitatively different—almost the opposite pattern—with reports of discrimination being relatively low for women in their 20s, peaking in their 30s, and declining thereafter. The reporting of gender and age discrimination is similar between black and white women. However, reports of racial discrimination are low among white women and much higher among African American women throughout the life course. These data show the importance of considering how reports of discrimination vary by race, age, and gender over the life course.
Life Interrupted by Racism
Gee and his colleagues created a conceptual model (see Figure 2-7) to diagram what life interrupted by racism would look like (Gee et al., 2012). The top panel of this figure shows a “general” life trajectory that begins in utero. After a child is born, the child’s experiences are largely shaped by family, but as the child ages, the child moves into new life stages shaped by education, work, and retirement. The blue bar in the figure represents undesirable times in one’s life caused by such things as unemployment, incarceration, and illness. The bottom panel of this figure displays a life interrupted by racism. The blue bar is much larger, yet the total life expectancy is shorter (denoted by the red bracket). Thus, Gee said, racism can create a shorter life with greater strife.
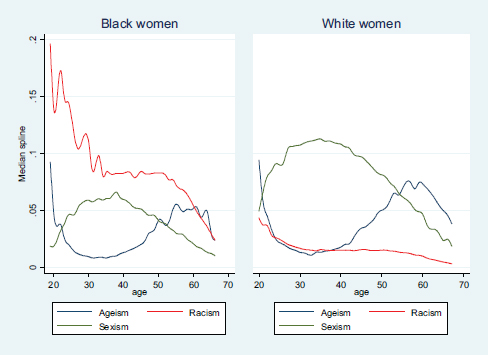
FIGURE 2-6 Reports of age, gender, and racial discrimination for black and white women.
SOURCES: Gee presentation, February 4, 2016, based on data from Gee et al., 2007a.
Gee said that the recent events highlighted by the Black Lives Matter movement and many other events such as the tragic death of Tamir Rice and other young people have encouraged him to rethink what the earlier framework published some years ago may look like in 2016 (see Figure 2-8).
In closing, Gee said that it is important to recognize the resistance and the resiliency that can be seen in communities in the form of individuals who are standing up for themselves and for their communities as well as coalitions and marches involving people agitating for improved living and working conditions. Historically, these acts of resistance have culminated in achievements like the Civil Rights Act of 1964. Gee suggested that the implementation of the Act can be linked to a decrease in infant mortality rates for African Americans in states like Indiana and Mississippi, as shown in research by Douglas Almond and colleagues (Almond et al., 2006). What the declines suggest is that social policies that
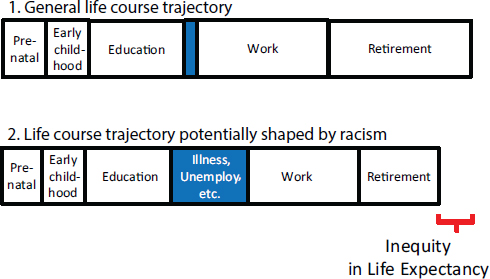
FIGURE 2-7 Conceptual model of how racism may shape time over the life course.
SOURCE: Gee et al., 2012.
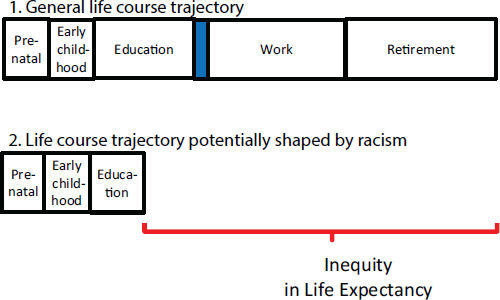
FIGURE 2-8 Conceptual model of how racism may shape time over the life course in 2016.
SOURCE: Gee presentation, February 6, 2016.
are designed to expand rights may also have important spillover effects in reducing things like infant mortality.4
Gee suggested that a framework for health equity should have four parts related to a multilevel perspective examining intersectionality that considers all these factors across the life course (e.g., race, class, gender, immigration, sexual orientation) and also considers the strength and resilience of communities. The study of racism and the interlocking systems of oppression across generations and individuals’ life courses need to be studied directly, Gee said, in order to achieve health equity and social justice. What this suggests, ultimately, is that policies that are designed to improve civil rights not only buttress the foundations of a just and civil society but lead to a healthier one as well.
_______________
4 The article focuses on Title VI of the 1964 Civil Rights Act, which mandated the desegregation of institutions receiving federal funds.
This page intentionally left blank.


