
3
Science Literacy in Society and the World
As discussed in Chapter 2, there are four rationales for the importance of science literacy. Three of these arguments (economic, democratic, and cultural) make claims about the value of science literacy for nations and societies. Perhaps the most commonly heard claim is that a more science literate population may help democratic societies make prudent and equitable decisions about policy issues that involve science (European Commission, 1995; Rudolph and Horibe, 2015). However, as discussed in this chapter, the available evidence on science literacy at the society level does not provide enough information to draw conclusions on whether these claims are justified. In this chapter, we review available evidence on science literacy from national and international analyses, focusing on what is known about science literacy and its correlates at the macro level, and we identify areas where evidence is lacking. In our review, we consider different countries as different societies, characterized generally by different cultures, level of economic development, and form of governance. Chapter 4 will further delineate the differences between a society and a community.
TWO RESEARCH PERSPECTIVES
Research on science literacy at the level of a nation or whole society can be split into two perspectives. The first relies on data about individuals, usually collected through large public opinion surveys with representative samples of a population. Aggregating these data and examining them as a whole or by subgroup offers insight into broad patterns of attributes such as awareness,
knowledge, and attitudes. This sort of analysis might examine, for instance, the relationship between scientific knowledge and attitudes toward scientific research, looking for patterns within and across countries. We refer to this as the aggregate perspective. As we discuss below, the vast majority of scholarly inquiry into science literacy at the whole-society level, as well as much of the public discourse on science literacy, has adopted this perspective. The aggregate perspective treats all participants in the national sample as individuals and their contribution to science literacy at the society level are represented by statistical means or variances.
The second perspective, which the committee thinks has great potential value, focuses on social structures that likely contribute to science literacy, a broad category that could include (but is not limited to) formal policies and institutions (e.g., schools and the scientific establishment) as well as emergent cultural properties such as norms of political participation, social and economic stratification, and the presence of diverse groups and worldviews. This sort of analysis might examine, for instance, how open meeting laws and other governance structures shape the participation of citizens in science-related decisions, how large-scale information networks affect access to science information, and/or how particular subgroups of citizens differ in their perspective on scientific issues. We refer to this as the structural perspective. Though there has been relatively little research on science literacy from a structural perspective, we discuss later in this chapter how such an approach might help move the field forward.
The two perspectives should be understood as complementary rather than competing ways of understanding the nature and effects of science literacy at the whole-society level. On one hand, the knowledge and attitudes of individuals—attributes that are the focus of the aggregate perspective—influence society through social interaction, which is mediated by social structures. For example, if there is no platform for citizens to contribute to governance of scientific matters, what they do and do not understand about science may have little effect on policy decisions. On the other hand, social structures inform what people know, think, and feel. For example, membership in a cultural group (Kahan et al., 2011) or connection to a social network (Brossard and Scheufele, 2013; Southwell, 2013) affects what information people have and how they are most likely to interpret that information. Research that examines the intersection of these two perspectives is in its infancy, and more work is required to articulate how the aggregate science literacy of individuals and the social structures that shape their lives combine to affect important social outcomes.
SCIENCE LITERACY ACROSS SOCIETIES
The available research on science literacy at the macro-level focuses on cross-national comparisons. The number of countries administering national
surveys to measure the public’s attitudes toward science and general knowledge of science has grown since the 1970s (Bauer et al., 2012b). Table 3-1 lists many of those surveys (Bauer and Falade, 2014; National Science Board, 2016). These surveys ask standard questions1 to nationally and internationally representative adult samples, typically 1,000 interviews or more. There is no publication currently that compiles results from all of these surveys. However, there are studies that make comparisons across some countries on similar measures (e.g., see summaries from National Science Board (2016) discussed later in this chapter).
It is possible to compare different countries’ aggregated responses to identical (or substantially similar) questions regarding science knowledge and/or attitudes toward science. That said, the committee recognizes the limitations of these comparisons. In the rest of this section, we summarize the available findings that can be compared from surveys across the globe, drawing primarily from the Science and Engineering Indicators compiled by the U.S. National Science Foundation (National Science Board, 2016).
The limitations inherent in international comparisons require careful consideration. The available data includes the use of nearly identical questions across multiple countries in multiple years, which reassures the committee that comparisons of aggregated responses can provide some meaningful insight on public knowledge and attitudes toward science. That said, seemingly identical questions can be affected by language and cultural differences that cause questions to be interpreted differently. The data that are being compared were often collected at different time periods and/or in different contexts (i.e., face-to-face interviews versus paper or online questionnaires). For some countries, there are large gaps between data collection years, and there is much irregularity between the countries as to when data were collected (Table 3-1). Some data may not be made available to researchers. Data for international comparison come primarily from Europe, with only limited recent data from the Asia-Pacific region. Data from Africa and South America are especially rare. In addition, like any survey data, the results are subject to sampling and response errors which may result in the omission of significant portions of the target populations or the inclusion of respondents who were not citizens of the countries in which they were surveyed. Also of note, while science and engineering can be understood as distinct fields, national survey data often do not make this distinction (National Science Board, 2016).
Knowledge of Science
Most surveys of adult populations use a small set of quiz-like questions to measure the public’s knowledge of underlying science constructs. The nature
___________________
1See Table 3-2 for common knowledge questions asked across multiple surveys as well as more detailed information about the questions in Chapter 2.
TABLE 3-1 National Surveys of Public Knowledge and Attitudes Toward Science
| Country | Survey Titles and Sponsors |
|---|---|
| United States | National Science Foundation Public Attitudes Toward and Understanding of Science and Technology, General Social Survey (GSS), GSS Science and Technology Module |
| Years Administered | 1979, 1983, 1985, 1988, 1990, 1992, 1995, 1997, 1999, 2006, 2008, 2010, 2012, 2014 |
| Canada | Ministry of Science and Technology; Public Survey of Science Culture in Canada |
| Years Administered | 1989, 2013 |
| China | China Association for Science and Technology, Chinese National Survey of Public Scientific Literacy; China Research Institute for Science Popularization |
| Years Administered | 1991, 1995, 1997, 2001, 2003, 2007, 2010 |
| European Union | Eurobarometer |
| Years Administered | 1977, 1978, 1989, 1992, 2001, 2005 |
| India | National Council of Applied Economic Research |
| Years Administered | 2004 |
| Japan | National Institute of Science and Technology Policy, Survey of Scientific Literacy |
| Years Administered | 1991, 2001, 2011 |
| Malaysia | Science and Technology Information Center, Survey of the Public’s Awareness of Science and Technology |
| Years Administered | 2000, 2014 |
| Russia | Survey of Public Attitudes Toward Science and Technology in Russia |
| Years Administered | 2003 |
| Korea | Survey of Public Attitudes Toward and Understanding of Science and Technology–Korea Foundation for the Advancement of Science and Creativity |
| Years Administered | 2004, 2006, 2008 |
| Argentina | Red Iberoamericana de Indicadores de Ciencia y Tecnología |
| Years Administered | 2003 |
| Brazil | Brazilian National Research Foundation, Research Foundation of the State of Sao Paulo, Brazil |
| Years Administered | 1987, 2003, 2006 |
| Country | Survey Titles and Sponsors |
|---|---|
| Bulgaria | Bulgarian Academy of Science, Institute of Sociology, Sofia |
| Years Administered | 1992, 1996 (also included in Eurobarometer survey 2001, 2005) |
| France | Centre for the Study of Political Life, SciencePo, Paris |
| Years Administered | 1982, 1988 (also included in Eurobarometer survey) |
| New Zealand | Ministry of Science and Technology |
| Years Administered | 1997 |
| United Kingdom | Economic and Social Research Council, MORI (British public opinion research company); Office of Science and Technology, London |
| Years Administered | 1986, 1988, 1996, 2000, 2004 (also included in Eurobarometer survey) |
| 15 countries, including the United States | BBVA Foundation International Study on Scientific Culture |
| Years Administered | 2011 |
| 11 countries, including the United States | World Values Survey |
| Years Administered | 2010-2014 |
SOURCE: Data from Bauer and Falade (2014) and National Science Board (2016).
and development of these questions is discussed elsewhere in the report (see Chapter 2). Across the set of knowledge questions (see Table 3-2), scores for individual items vary from country to country, and no country seems to outperform the others on every question (National Science Board, 2016). Table 3-2 shows the proportion of each sample by country that answered specific questions correctly for the most recent survey year available. As shown in this table, the United States’ correct response rate is higher than some countries and lower than others. The National Science Board (2016) notes that U.S. performance on science knowledge has been fairly stable across 2 decades. In 2014, a representative sample of adults in the United States correctly answered an average of 65 percent of the knowledge questions used for the trend scale.2 This score
___________________
2The questions used for the trend scale across years in the Science and Engineering Indicators include the nine factual knowledge questions described in Box 2-4 (see Chapter 2). In 2014, Americans were able to correctly answer an average of 5.8 of the 9 items (National Science Board, 2016).
TABLE 3-2 Correct Response to Factual Knowledge Questions in Physical and Biological Sciences, by Country/Region (in percentage)
| United States (2014) | Canada (2013) | China (2010) | European Union (2005) | India (2004) | Japan (2011) | Malaysia (2014) | Russia (2003) | South Korea (2004) | |
|---|---|---|---|---|---|---|---|---|---|
| Survey Information | |||||||||
| N | 2130 | 2004 | 68,416 | 26,403 | 30,255 | 812 to 984 | 2653 | 2207 | 1000 |
| Error margin | ±2.5-3.3% | ±2.2% | ±2.71% | ±3.1% | |||||
| Physical Science Questions | |||||||||
| The center of the Earth is very hot. (True) | 84 | 93 | 56 | 86 | 57 | 84 | 75 | NA | 87 |
| The continents have been moving their location for millions of years and will continue to move. (True) | 82 | 91 | 50 | 87 | 32 | 89 | 62 | 40 | 87 |
| Does the Earth go around the Sun, or does the Sun go around the Earth? (Earth around Sun) | 76 | 87 | NA | 66 | 70 | NA | 85 | NA | 86 |
| All radioactivity is man-made. (False) | 72 | 72 | 48 | 59 | NA | 64 | 20 | 35 | 48 |
| Electrons are smaller than atoms. (True) | 51 | 58 | 27 | 46 | 30 | 28 | 35 | 44 | 46 |
| Lasers work by focusing sound waves. (False) | 50 | 53 | 23 | 47 | NA | 26 | 30 | 24 | 31 |
| The universe began with a huge explosion. (True) | 42 | 68 | NA | NA | 34 | NA | NA | 35 | 67 |
| Biological Science Questions | |||||||||
| It is the father’s gene that decides whether the baby is a boy or a girl.* (True) | 59 | NA | 58 | 64 | 38 | 26 | 45 | 22 | 59 |
| Antibiotics kill viruses as well as bacteria.** (False) | 55 | 53 | 28 | 46 | 39 | 28 | 16 | 18 | 30 |
| Human beings, as we know them today, developed from earlier species of animals. (True) | 49 | 74 | 66 | 70 | 56 | 78 | NA | 44 | 64 |
NOTES: Data are for the most recent year available for each country. European Union data includes Austria, Belgium, Cyprus, Czech Republic, Denmark, Estonia, Finland, France, Germany, Greece, Hungary, Ireland, Italy, Latvia, Lithuania, Luxembourg, Malta, the Netherlands, Poland, Portugal, Slovakia, Slovenia, Spain, Sweden, and the United Kingdom, but does not include Bulgaria and Romania. NA indicates data not available or question not asked.
*China and Europe surveys asked about “mother’s gene” instead of “father’s gene.”
**Japan survey asked about “antibodies” instead of “antibiotics.”
is nearly identical to the average across surveys since 2001 and a slight increase from the average correct in 1992.
In order to respond to the statement of task, the committee reports the National Science Board’s comparison of aggregated responses to identical or similar science knowledge questions asked in different countries. As mentioned above, the committee recognizes the limitations of comparing questions asked in different survey administrations under different contexts, but is compelled to use the best data available.
In 2011, the BBVA Foundation surveyed 10 European countries and the United States on a set of 22 knowledge questions that varied from those traditionally asked.3 The United States, on average, performed similarly to many of the European countries, and slightly above the European average. In this survey as well as others reported by the National Science Board (2016), science knowledge scores have varied between different European countries, with northern European countries, including Denmark, the Netherlands, and Sweden, tending to score the highest. Notably, in comparisons with performances across European countries, U.S. performance on knowledge questions tends to fall in the middle. In the United States, as well as in Europe, researchers have noted that men, younger adults, and more highly educated people tend to score higher on these questions, and these trends have been fairly consistent across different surveys and years (National Science Board, 2008, 2016; Wellcome Trust, 2013).
Variations in level of science knowledge among countries can potentially be attributed to different levels of education across societies and levels of economic development. Bauer (2009) draws on large-scale surveys of knowledge and attitudes across European and Indian states (over 30,000 interviews in each) to conclude that people’s knowledge of science does scale with economic development, as indicated by Gross Domestic Product per capita.
Beyond factual knowledge, reasoning capabilities and understanding of the processes of science have not been the focus of surveys from most other countries in recent years. However, the National Science Board (2016, pp. 7-54, 7-55) acknowledges a few available findings in this regard:
In Asia, a 2010 Chinese survey reported that 49% understood the idea of probability, 20% understood the need for comparisons in research, and 31% understood the idea of “scientific research” (China Research Institute for Science Popularization, 2010). In a July 2011 Japanese survey, 62% correctly answered a multiple-choice question on experiments related to the use of a control group, whereas 57% answered correctly in a follow-up December 2011 survey (National Institute of Science and Technology Policy, 2012). [In the United States], 66% of Americans provided a correct response to a similar question in 2014.
There are also surveys of adolescents’ understanding of science, which have
___________________
3See http://www.fbbva.es/TLFU/dat/Understandingsciencenotalarga.pdf [June 2016].
been used in global assessments of science knowledge and competencies in school-age children. We present this data here because adolescent data is often cited in popular media as an indication of flagging U.S. science achievement. The committee declines to draw conclusions based on this adolescent data, however, as a thorough analysis of this data is outside the scope of this report. As noted in the introduction to this report, we focus on evidence pertaining to adults in order to remain consistent, as much of the research on public perceptions of science uses indicators of adult science knowledge (see Chapter 5).
The most well-known measure is the Programme of International Student Assessment (PISA) from OECD, which was set up in 1997 with the first survey results published in the year 2000. Every PISA survey tests “reading, mathematical and scientific literacy in terms of general competencies, that is, how well students in economically developed countries can apply the knowledge and skills they have learned at school to real-life challenges.”4 PISA does not test how well a student has mastered a school’s specific curriculum. The goal of PISA is the measurement of the science literacy of 15-year-old students. In the initial tests, 28 OECD countries, including the United States, and 4 non-OECD countries participated. In 2018, 34 OECD countries and 46 non-OECD countries will participate. The assessment uses a randomized sample of students drawn from each country. The tests last for two hours with one subject out of reading, mathematics, and science defined as the major subject and the two others defined as minor subjects.5 The tests contain a set of trend items which enable comparability from year to year. The results for the United States in comparison to the lowest and highest achieving countries are shown in Table 3-3. The U.S. performance in science is not statistically different from the average among a wide range of countries. However, enormous variation within the United States has been observed; for example, students from Massachusetts (for which there was a separate sample in 2009) did as well as the Asian countries (Carnoy and Rothstein, 2013).
The other international test in which the United States participates is the Trends in Mathematics and Science Survey (TIMSS). Established in 1995, this measures 8th graders’ mathematics and science knowledge every 4 years. However, unlike the PISA, TIMSS is designed to align with each participating country’s science curricula. The results of TIMSS “suggest the degree to which students have learned mathematics and science concepts and skills likely to have been taught in school.” Further, TIMSS also “collects background information on students, teachers, schools, curricula, and official education policies to allow cross-national comparison of educational contexts that may be related to
___________________
4See PISA FAQ at https://www.oecd.org/pisa/aboutpisa/pisafaq.htm [July 2016].
5What PISA measures is defined by the assessment framework which is rewritten when it is the turn of one of the three major subjects to be assessed. The one defining what was to be assessed in science in 2015, when science was the major subject, was rewritten in 2012 (OECD, 2012a).
TABLE 3-3 International Performance on PISA
| Date | Lowest Achieving Countries | U.S. Score | Highest Achieving Countries |
|---|---|---|---|
| 2000 | Peru: 333 (4.0) Brazil: 375 (3.3) Albania: 376 (2.9) Indonesia: 393 (3.9) |
499 (7.3) | Korea: 552 (2.7) Japan: 550 (5.5) Hong Kong: 541 (3.0) Finland: 538 (2.5) |
| 2006 | Kyrgyzstan: 322 (2.9) Qatar: 349 (0.9) Azerbaijan: 382 (2.8) Tunisia: 386 (3.0) |
489 (4.2) | Finland: 563 (2.0) Hong Kong: 542 (2.5) Canada: 534 (2.0) Taiwan: 532 (2.6) |
| 2012 (Science was not a major subject this year) |
Brazil: 405 (2.1) Kazakhstan: 425 (3.0) Costa Rica: 429 (2.9) Cyprus: 438 (1.2) |
497 (3.8) | Shanghai-China: 580 (3.0) Singapore: 551 (1.5) Hong Kong: 555 (2.6) Japan: 547 (3.6) |
NOTE: The scores are normalized to a scale which goes from 0-1000 with a mean of 500 and standard deviation of 100. Standard errors appear in parentheses.
SOURCE: Data from OECD and UNESCO Institute for Statistics (2003) and OECD (2007, 2014).
student achievement” (Provasnik et al., 2012, p. 1[emphasis added]). The committee therefore sees these results as a way to measure how well an education system performs an international context, rather than as a measure of science literacy. See Table 3-4 for TIMSS results.
Attitudes toward Science
According to the National Science Board (2016, p. 7-6), “...Americans’ overall attitudes about science are either stable or becoming more positive” and are generally comparable to those of other countries. For example, spending on basic scientific research has been consistently supported by U.S. public opinion. About 80 percent of U.S. respondents have agreed “that the federal government should fund scientific research” (p. 7-7) across multiple survey years from 1981 to 2004. Levels of agreement in South Korea, Malaysia, Japan, and Brazil are similar to those in the United States, whereas agreement is slightly less in Canada, China, and Europe at 72-77 percent (National Science Board, 2016).
Several different surveys have asked similar questions about the perceived past and future benefits of science and technology (S&T) (European Commission, 2013; Council of Canadian Academies, 2014; World Values Survey, 2014). Responses across countries have been largely favorable with the public viewing positive influences of science on society and prospects for the future (see Box 3-1 for comparisons of different countries).
In a similar question, the World Values Survey asked respondents to address whether science has made the world better off or worse off (World Values Survey, 2014); most respondents across countries agreed the world was better off because of science (National Science Board, 2016). Among OECD countries surveyed 2010-2014, the U.S. response was similar to those in other countries with 79 percent agreeing the world was better off, compared to responses in South Korea (84%) and Sweden (80%), and Japan (75%).
Data are available for the U.S. public on people’s reported confidence in the leaders of the scientific community. Here, again, there has been much stability in views since the 1970s. In 2014, 90 percent of U.S. respondents expressed a great deal or some confidence in leaders in the scientific community, rating science more favorably than almost all other institutions (see Figure 3-1).
TABLE 3-4 International Performance of 8th-grade Students on TIMSS and the Highest- and Lowest-performing Countries
| Date | Lowest Achieving Countries | U.S. Score | Highest Achieving Countries |
|---|---|---|---|
| 1995 | South Africa: 326 (6.6) Columbia: 411 (4.1) Kuwait: 430 (3.7) Cyprus: 463 (1.9) |
534 (4.7) | Singapore: 607 (5.5) Czech Republic: 574 (4.3) Japan: 571 (1.6) Korea: 565 (1.9) |
| 1999 | South Africa: 243 (7.8) Morocco: 323 (4.3) Phillipines: 345 (7.5) Chile: 420 (7.8) |
515 (4.6) | Taiwan: 569 (4.4) Singapore: 568 (8.0) Hungary: 552 (3.7) Japan: 550 (2.2) |
| 2003 | South Africa: 244 (6.7) Ghana: 255 (5.9) Botswana: 365 (2.8) Phillipines: 377 (5.8) |
527 (3.1) | Singapore: 578 (4.3) Taiwan: 571 (3.5) Korea: 558 (1.6) Hong Kong: 556 (3.0) |
| 2007 | Ghana: 303 (5.4) Qatar: 319 (1.7) Botswana: 355 (3.1) El Salvador: 387 (2.9) |
520 (2.9) | Singapore: 567 (4.4) Taiwan: 561 (3.7) Japan: 554 (1.9) Korea: 553 (2.0) |
| 2011 | Ghana: 306 (5.2) Morocco: 376 (2.2) Indonesia: 406 (4.5) Lebanon: 406 (4.9) |
525 (2.6) | Singapore: 590 (4.3) Taiwan: 564 (2.3) Korea: 560 (2.0) Japan: 558 (2.4) |
NOTES: Scores are reported on a scale which is normalized to go from 0-1000 with an average of 500 and standard deviation of 100. Standard errors appear in parentheses.
SOURCE: Data from Beaton et al. (1996) and Martin et al. (2000, 2004, 2008, 2012).
The relationship between science knowledge and attitudes toward science for individuals is discussed in detail in Chapter 5. However, we consider here what is known across countries (societies) about this relationship. The meta-analysis by Allum et al. (2008, p. 51), synthesizing results from public opinion surveys in a range of countries from 1989 to 2005, found “there is very little cross-cultural variation in the correlation between knowledge and attitudes. . . .” The committee inferred from these results that the mechanism by which science knowledge and general attitudes toward science are associated, whatever it may be, is likely very similar in all countries for which we have knowledge and attitude measures. This weak positive correlation is discussed further in Chapter 5.
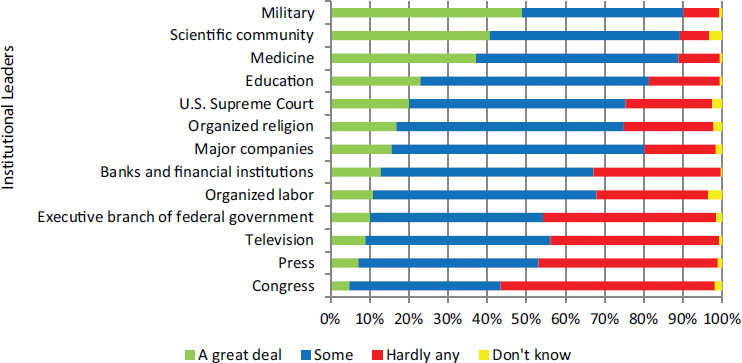
NOTE: The responses were to the following question: “As far as the people running these institutions are concerned, would you say that you have a great deal of confidence, only some confidence, or hardly any confidence at all in them?”
SOURCE: National Science Board (2016, Fig. 7-17); data from the 2014 General Social Survey.
Others have looked at cross cultural variations in attitudes/support for specific science innovations; one study looked at nanotechnology in the United States and Singapore (Liang et al., 2013). The authors concluded that the mechanisms at play were different in the two nations when a specific scientific issue is considered. In each country, perceived familiarity with nanotechnology and of the benefits and risks of the emerging technology tend to be interpreted differently. The responses were filtered through different values (religiosity and deference to scientific authority), therefore indirectly affecting public support in different ways (Liang et al. 2013).
Research using the country as the unit of analysis is rare. However, this type of research may be helpful in understanding the impact of variations in science literacy at the society level. One exception is the work of Durant and colleagues, who proposed that societies or countries with higher levels of scientific, technological, and industrial development (as measured by standard international indices) will attend to science knowledge differently than those societies or countries with lower levels (Durant et al., 2000). Using data from the 1992 Eurobarometer with respondents in 12 European countries, the researchers found that the level of public scientific knowledge (represented by the aggregated mean of individual measures) increases as the level of industrial-
ization6 increases. Furthermore, they found that “sociodemographic variables7 are better predictors of knowledge in the less industrialized countries than in the advanced industrialized countries” (Durant et al., 2000, p. 141). With the 1992 Eurobarometer data, they also observed that average interest in science increases among countries from low- to mid-levels of industrialization and that average interest drops off for countries with the highest levels of industrialization. The researchers suggest that this trend may occur because more knowledgeable societies may take science knowledge for granted and as a result show lower levels of interest in science. A similar pattern emerged in comparisons of average attitudes toward science in Indian states (with relatively low economic development) and European states (with relatively high economic development) (Bauer, 2009), as well as in comparisons of China to Europe (Liu et al., 2012).
Interpreting Data on International Comparisons
Cross-national research is useful for revealing broad-brush patterns and trends over time. In recent decades, such comparisons have focused on performance metrics. For countries for which there are data, attitudes toward science have been (and remain) quite positive, particularly in regard to support for scientific research and opportunities created by science for societies. Across indicators of science knowledge on public surveys of adults, scores for individual questions vary from country to country, and no country consistently outperforms other countries. There is some evidence that society-wide levels of educational attainment and economic development correlate with average scores on survey measures of science knowledge. There has also been some research examining variations in the relationship between knowledge and attitudes across different societies, but more work is needed to draw strong conclusions.
Some observers interpret these comparisons and scores as reassuring, given the relative similarity across countries. Others see them as disheartening, on the grounds that populations in developed countries should score higher on measures of science knowledge.8 At times, findings on individual knowledge questions in national surveys have been taken out of the context of gauging
___________________
6Durant and colleagues use a socioeconomic indicator of industrialization developed by Bairoch (1982).
7The term “sociodemographic” is used in the European literature and refers to variables involving social and demographic factors, such as gender, age, level of education, and income class.
8See, for example, http://www.pewresearch.org/fact-tank/2015/02/02/u-s-students-improvingslowly-in-math-and-science-but-still-lagging-internationally/ or http://blogs.discovermagazine.com/loom/2012/06/11/science-literacy-a-worldwide-look/#.V1BeyU3ruUk or https://www.sciencedaily.com/releases/2007/02/070218134322.htm [June 2016].
science literacy from a set of science questions and over-interpreted.9 Perhaps more importantly, the historical focus on average levels obscures the very considerable diversity within societies. The next section examines how science literacy (and the related concepts of foundational literacy and health literacy) is distributed in the United States.
VARIATIONS IN LITERACY WITHIN SOCIETY
When it comes to measures of science literacy, there is often greater variation within a country than between countries. In other words, the difference between the most and least knowledgeable people in a society is far greater than the knowledge difference between the average citizen and the average citizen in another country (Sum et al., 2002; Carnoy and Rothstein, 2013). A closer look at variation within one country (the United States) reveals stark disparities in knowledge, access to knowledge, and access to systems that enable people to interpret and act on the knowledge they have.
Research on stratification, variation, and disparities in science literacy is very rare. Existing data on science knowledge, of the sort collected in the ongoing Science and Engineering Indicators project, offers limited insight. The subgroup differences in the Science and Engineering Indicators10 are available by age, gender, education level, and family income. Surveys of factual knowledge since the early 1980s tend to show a significant gap between the top-performing age group (ages 25-34 in the 2014 results) and older age groups, though this gap is narrowing. The overall average score for men tends to be higher than for women (69% and 61%, respectively, in 2014); however, differences depend on specific questions asked. In addition, a strong relationship has been observed between scores of factual knowledge and level of formal schooling and the number of science and mathematics courses a person has completed. Information on family income has been compared since 2006. Respondents in the top income quartile have consistently scored higher than those in the bottom quartile (76% and 54%, respectively, in 2014) (National Science Board, 2016).
A recent Pew Research report, based on a survey of knowledge on 12 science-related questions (see Box 3-2),11 finds similar relationships between demographic factors and science knowledge (Pew Research Center, 2015). Generally, younger adults displayed slightly higher overall knowledge of science
___________________
9See, for example, http://www.science20.com/news_articles/science_literacy_american_adults_flunk_basic_science_says_survey-47608 [July 2016].
10Data reported in the Science and Engineering Indicators are taken from relevant questions asked on the General Social Survey: see Appendix Table 7-6 in National Science Board (2016) for a breakdown of percentage answering trend factual knowledge questions correctly by respondent characteristics.
11For more information, see http://www.pewinternet.org/2015/09/10/what-the-public-knowsand-does-not-know-about-science/ [May 2016].
than adults ages 65 and older, though this trend was reversed on some specific questions. The Pew study also found a gap in science knowledge between men and women, with men outperforming women on many questions, even when comparing men and women with similar levels of education. Notably, the questions on the Pew survey were primarily drawn from the physical sciences, an area in which men tend to fare better than women, as contrast to the biological sciences, an area in which women tend to answer more questions correctly (National Science Board, 2016).
The Pew study also found differences associated with race and ethnicity. Whites were more likely than Hispanics or black Americans to answer more of the questions correctly, on average; the mean number of items correct is 8.4 for whites, 7.1 for Hispanics, and 5.9 for black Americans.12 These findings should be interpreted with caution due to the smaller number of respondents in this survey who are black American (N = 259) or Hispanic (N = 247) compared to the number of respondents who are white (N = 2,551). The findings, though,
___________________
12The Pew Research Center report (2015, p. 5) points out that “the findings on race and ethnicity are broadly consistent with results on science knowledge questions in the General Social Surveys between 2006 and 2014. Pew Research analysis of the GSS data finds white adults scored an average of 6.1 out of 9 questions correctly, compared with 4.8 for Hispanics and 4.3 for black Americans.”
are consistent with those from previous Pew Research surveys13 as well as other studies that measure knowledge or educational performance across a range of domains.
The Pew Research report is a rare analysis of race and ethnic differences in regards to science literacy. In most studies on scientific knowledge and attitudes data are not disaggregated by race, class, or other social group because of issues such as sample size within the subgroups. However, educational measures assessing students’ knowledge, for which sample sizes are often larger, are commonly disaggregated in this way, and they reveal stark differences in scientific knowledge by race and socioeconomic status (SES), as well as geographic differences from state to state and region to region within a state (National Center for Education Statistics, 2012b; U.S. Department of Education, 2014b). Although the results of standardized science assessments in school settings may be an imperfect proxy for adult science literacy, researchers studying knowledge gaps for decades have observed in both cross-sectional and time-series research that people with higher levels of education and science knowledge are significantly more likely to acquire and understand science information from public sources, which suggests that differences in knowledge and interest are likely to expand rather than contract over lifespans (Viswanath and Finnegan, 1996; Southwell, 2013).
In contrast with the scarcity of research on disparities in science literacy, there is a substantial body of research focused on disparities in foundational literacy and health literacy. Taken together the results of this research paint a sobering picture of intra-national disparities. Comparisons of this sort evoke a shallow and problematic deficit perspective14 that may not accurately portray the competence of particular individuals and groups. At the same time, comparisons of this sort are useful ways of demonstrating inter-group differences on particular measures in ways that prompt discussion about the origins and consequences of those differences.
Examining such differences in literacy, a 2002 report used the joint availability of large-scale literacy assessments (the National Adult Literacy Survey (NALS) and the International Adult Literacy Survey (IALS) “to compare both the distributions and average literacy proficiencies of adults in the U.S. with those of adults in other high-income countries around the world” (Sum et al., 2002, p. 5). The report found that the average literacy score of U.S. adults was similar to the average scores of other countries, with the U.S. score falling in the middle of the range of scores from countries that were surveyed. More
___________________
13See http://www.pewinternet.org/2015/09/10/comparison-of-science-knowledge-questionsacross-pew-research-center-surveys/ [July 2016].
14“Deficit perspective” is a term used to characterize viewpoints which focus on individuals’ or population’s weaknesses and which can at times associate differences between groups as weaknesses and unfairly characterize certain groups as deficient in some regard.
importantly, however, certain subgroups fell in the bottom half of the overall distribution, revealing a high degree of inequality between the best and poorest performers in the United States. The NALS results showed large gaps in the average scores of white adults and those of black and Hispanic adults. In addition, the mean literacy scores of young adults in the United States varied quite substantially by educational attainment.
These trends in foundational literacy are echoed in health literacy. In 2004, a report on the state of health literacy in the United States (Rudd et al., 2004) analyzed performance on 191 health-related tasks15 in NALS and IALS. The results of this analysis highlighted significant inter-group differences, and included the worrisome finding that 12 percent of the U.S. adult population scored in the lowest bracket, with an additional 7 percent scoring at a slightly higher level that might still be expected to have great difficulty performing simple health-related tasks (Rudd et al., 2004, p. 3). Years of schooling, age, racial and ethnic status, and country of birth were all powerful predictors of health-related literacy skills among adults. Figure 3-2 shows the distribution of scores for each of these characteristics. The average overall score on this 500 point scale is 272 with a standard deviation of 61. In Figure 3-2(a), the average score of adults who had not completed high school or earned a general equivalency diploma (GED) (220) is lower than that for individuals who had graduated from high school or earned a GED (271) and lower than for those who had continued their education beyond high school (306). Figure 3-2(b) illustrates differences between racial/ethnic groups. Notably, among Hispanic adults, some 30 percent scored below Level 1. The report notes that several variables such as education, health status, poverty status, and immigrant status16 influence the observed differences among racial/ethnic groups. Figure 3-2(c) shows that almost half of adults older than 65 in the United States performed in or below Level 1 (scores less than 25).
The Institute of Medicine (2004) delved deeper into the problem of health literacy, finding relationships between limited health literacy, poorer health status, and lower use of preventive services. These findings have had a considerable effect in the health care community, leading to a surge in research focused on interventions that could improve a patient’s health literacy or on changes to the health care system that would reduce literacy demands on patients (e.g., Chin et al., 2007; Sudore and Schillinger, 2009). Some of this research is discussed in Chapter 5.
___________________
15For example, survey respondents were asked to read a medicine dosage chart and indicate the correct dose for a child of a particular weight and age, and to interpret information from a news article on bicycle safety (Rudd et al., 2004).
16The survey considered whether respondents were born in or outside the United States and found that 48 percent of Hispanic respondents were born outside the country.
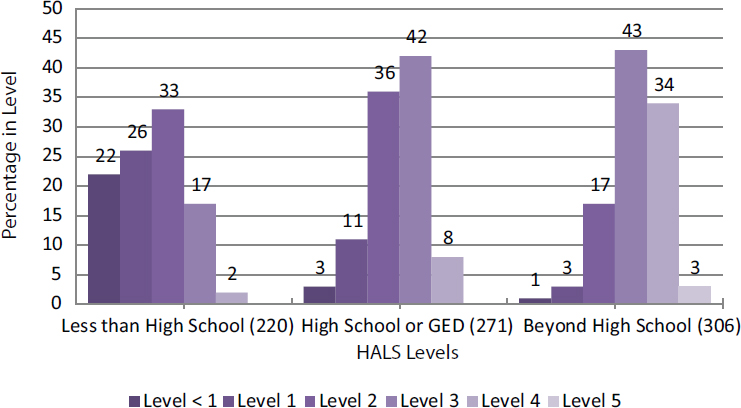
SOURCE: Rudd et al. (2004, Fig. 4).
Copyright © 2004 Educational Testing Service. Policy Information Report: Literacy and Health in America. Used with permission.
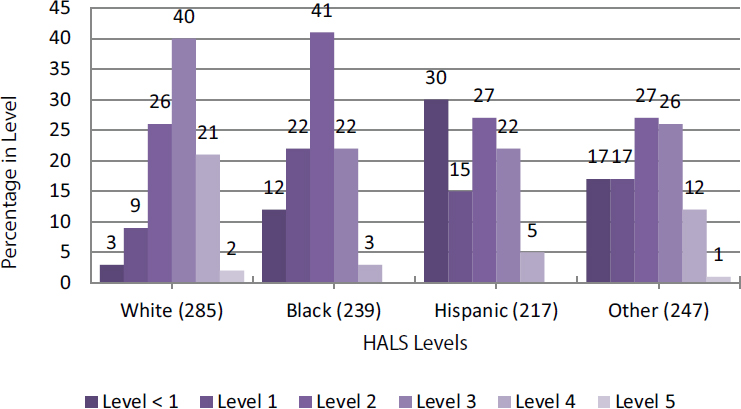
SOURCE: Rudd et al. (2004, Fig. 5).
Copyright © 2004 Educational Testing Service. Policy Information Report: Literacy and Health in America. Used with permission.
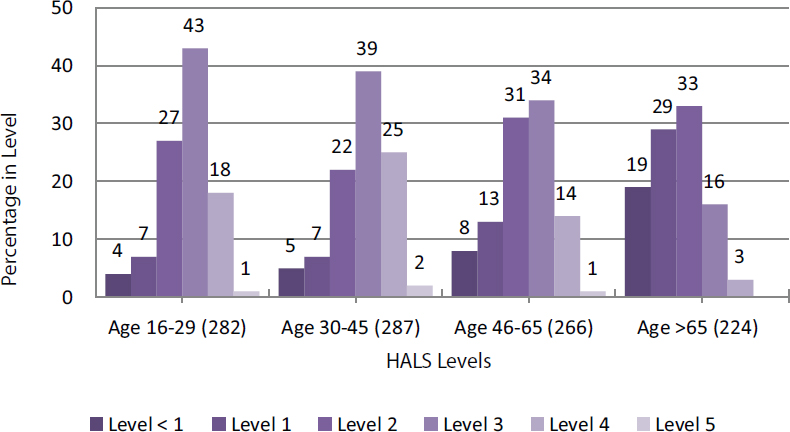
SOURCE: Rudd et al. (2004, Fig. 6).
Copyright © 2004 Educational Testing Service. Policy Information Report: Literacy and Health in America. Used with permission.
THE ROLE OF SOCIAL STRUCTURES IN SHAPING SCIENCE LITERACY
Observed differences in science literacy (or at least in survey-based measures of science knowledge) lead quickly to more important questions: How do these differences arise, and what are their implications for society? Much focus has been placed on education and the school system. Differential access to high-quality science education is thought to have substantial impact on the ability of individuals to develop science literacy (Barton, 2003; Ladson-Billings, 2006). If educational opportunities are at least in part responsible for providing individuals with some of the features of science literacy identified in Chapter 2 (content knowledge, foundational literacy, understanding of scientific practices, for example), then if some individuals do not have access to high-quality education, they may be less likely to be able to develop the tools necessary for science literacy (see Box 3-3). Educational inequities also contribute to disparate levels of educational attainment and the under-representation of various groups in the science, technology, engineering, and mathematics (STEM) workforce, both of which may further reinforce the lack of knowledge or access to knowledge in a community (Anderson, 2015; Plutzer, 2013). But other systems of social and political life beyond schooling—including but not limited to the health
care system, the justice system, federal and state governments, and even informal learning networks—also shape how people interact with each other, with institutions, and with science information. All of these systems may operate differently across society as a result of class-based, regional, and/or cultural differences.
In all societies, life circumstances including (but not limited to) group membership and geographic location affect what people are likely to know. Southwell (2013) points to the isolating effects of segregated social networks that link some people, but not others, to resources, information, and expertise. Other researchers have pointed to research on the differential access and use of informal science education resources, nearly all of which indicates that underserved minorities, low-SES, and other marginalized groups are less likely
to use these resources for a range of reasons including cost, distance, and the widespread (often accurate) sense that resources such as science museums were not designed with them in mind (e.g. Dawson, 2014). Also, despite a remarkable leveling in access to the Internet and Internet-enabled technologies in the past 2 decades in the United States, research continues to point to troubling differences in the way that people are supported in their use of Internet technologies, particularly in educational settings (Warschauer, 2006; Margolis et al., 2010; Barron et al., 2014). All of these differences feed into a Matthew effect “to those who have shall more be given” for science literacy (Merton, 1968; Stanovich, 1986).
Just as life circumstances shape what people are likely to know, life circumstances also shape what is important to know and the consequences befall those who are uninformed or unable (by virtue of personal characteristics or lack of access to resources) to interpret and act on available knowledge. For example, scholars working in the field of environmental justice have clearly demonstrated that environmental harms and goods are unevenly distributed in society (Brulle and Pellow, 2006). In the United States, poor citizens and people of color are far more likely to be exposed to hazardous levels of environmental toxins in their home and work environments, as well as in the air they breathe and the water they drink. In short, structural inequality produces situations in which some people have a more urgent and immediate need to engage with science around pressing health and environmental concerns—and those same people often have less access to informational and interpretive resources, as well as fewer avenues for political participation. This state of affairs leads the committee to think that the research question that could be asked is not what can these individuals do to better themselves, but what can society and scientific institutions do to help.
Much of the rhetoric around science literacy describes the obligations of citizens to participate in democratic governance. Although formal decision-making contexts like voting are the most obvious means of political participation, they are far from the only venues in which science may be relevant. Citizens (and noncitizen residents) may have access to political deliberation through open meetings; they may be able to offer input on new policies through comments on news sites, letters to their elected officials, community forums, citizen panels, and other public engagement mechanisms (Goidel and Nisbet, 2006; see Scheufele, 2011 for an overview and shortcomings of these mechanisms); and they may be able to exert influence through protest, petitions, referenda, and demonstrations (Jasanoff, 2003; Kleinman, 2000). Each form and instance of political participation may make different demands on science literacy, and many also provide formal or informal opportunities to learn more about science. When the public is expected or required to participate more, the demand for science literacy may be correspondingly greater, and opportunities
for learning about socially relevant science may also be more common. In contrast, when there are relatively few avenues for political participation, or where access to the political process is restricted, the demand for science literacy (and the opportunity to develop and use it) may be correspondingly lower.
The pattern that is discernible in the formal and informal structures that shape political participation is also relevant to other social structures and sectors of society. In the justice system, for example, rising use as well as criticism of forensic science evidence (see, e.g., National Research Council, 2009) are increasing awareness of the need for science literacy among participants in court proceedings. Although this situation is hardly new, it is becoming increasingly difficult to ignore (Jasanoff, 2009). Rising awareness of the need for science literacy among citizens and professional jurists engaged in litigation serves as a call to the justice system to examine structures that promote and support science literacy in legal contexts and serve to provide relevant scientific information and training to judges, attorneys, and juries as necessary.
CONCLUSIONS
Currently, what is measured as science literacy at the society level comes from large public opinion surveys among adults and survey tests of adolescents in many countries. These measures are useful for examining trends over time and for identifying areas for improvement in a society. Additional data comes from tests of adolescents through PISA, which indicates that U.S. performance on recent tests of science knowledge is about average in comparison to a range of countries (Table 3-3). Again, the committee declines to draw conclusions about adolescents, as a thorough investigation and interpretation of the PISA data is beyond the scope of this report.
Indicators of adults’ knowledge of science are limited to a narrow range of measures on public surveys that can be compared across countries. It is difficult to draw strong conclusions on cross-national performance from these measures. However, survey responses over time have shown much stability. In the United States, the average score on knowledge questions for each survey year since 2001 is consistently near 65 percent of the questions answered correctly. In addition to observed stability in responses, there is evidence that no country consistently outperforms other countries on all questions (Table 3-2). In view of these findings on adults’ performance and the limitations of public opinion data, the committee concludes that the performance of the adult population in the United States on general science knowledge is similar to that of other countries for which there are data.
CONCLUSION 5 The population of adults in the United States performs comparably to adults in other economically developed countries on most current measures of science knowledge.
The committee recognizes that the narrow range of existing measures is unlikely to adequately capture the full range of science literacy discussed in this report. Although countries can be compared and ranked on the basis of their survey scores, there is little understanding of what those rankings mean: What do the differences in survey measures of science knowledge actually imply about the health and wellbeing of those societies, their communities, or their citizens? The current evidence available simply does not allow one to make strong inferences about the relationship between average scores on common measures of science literacy and the putative consequences of enhanced science literacy, such as improved public health or more enlightened civic and political engagement.
The large public opinion surveys in different countries also include measures of attitudes toward science. On these measures, there are many similarities among countries, and response trends have been stable across multiple survey years, particularly in the United States for which there are more data. Attitudes have been (and remain) quite positive, notably in regard to the perceived benefits created by science for societies and support for scientific research.
CONCLUSION 6 Current evidence, though limited, shows that populations around the world have positive attitudes toward science and support public funding for scientific research. These attitudes have been generally stable over time. In addition, the same evidence reveals an overall high level of trust in scientists and in scientific institutions.
In the cross-national comparisons, there is some evidence that countries with similar measures of economic development and educational attainment tend to have similar average scores on measures of science knowledge. Although this is useful and intuitive information, a focus on average levels can obscure the wide variation that can exist in a society. In reviewing the literature and data from surveys on science literacy as well as those on foundational literacy and health literacy, the committee found significant disparities in knowledge and access to knowledge. Much more is known about disparities in foundational literacy and health literacy as well as about disparities in science education in school systems in the United States. In contrast, research on stratification, variation, and disparities in science literacy is rare. The committee encourages new research in this area to examine the extent of disparities in science literacy and the social structures that contribute to inequities.
CONCLUSION 7 Within societies, evidence shows that severe disparities in both foundational literacy and health literacy exist and are associated with structural features such as distribution of income and access to high-quality schooling. Though direct evidence for such structural disparities in science literacy is scarce, we conclude they too exist, in part because
the possession of foundational literacy is so integral to the development of science literacy.
The committee proposes that any social structures that limit an individual’s access to high quality educational opportunities would have a direct bearing on that individual’s ability to develop or apply science literacy. Access to education is but one example. Studies of social structures reveal that groups disadvantaged in one social system tend to be disadvantaged in others as well, and the effects of disadvantage accumulate over generations, leading to harsh, self-reinforcing disparities (e.g., Ladson-Billings, 2006; Delgado and Stefancic, 2012).
Analysis of aggregated science knowledge measures could be used to analyze the variations in social structures as explanatory variables of the differences in national means and could be used to analyze subgroup differences in societies. However, a thorough account of disparities in science literacy cannot rely solely on aggregated measures of science knowledge. It would also include an examination of the conditions that structure science literacy differently for different groups of people, shaping how their understandings of science are developed and deployed, and the institutional response needed to address current failings. As discussed in the following chapters, different individuals and communities in a society rely on science literacy to different degrees at different times to accomplish their personal and civic goals. In this sense, social conditions define meaningful science literacy, and shape (if not determine) the distribution of science literacy for the communities and individuals therein. The research community has not yet studied in sufficient detail both the value of science literacy in societal systems (such as the health care system, the justice system, and the various systems of political participation) and the opportunities to develop science literacy that these systems provide.
This page intentionally left blank.


