
2
Social Risk Factors: Definitions and Data
The committee’s first report (see Appendix A) presents a conceptual framework that illustrates how social risk factors could affect the health outcomes of Medicare beneficiaries, as well as results from a literature search that provides empirical evidence in support of these hypothesized conceptual relationships (NASEM, 2016a). Thus, that report provides a conceptual basis and empirical evidence that social risk factors could affect performance indicators used in Medicare value-based payment (VBP) programs independently of provider influence. The committee’s third report builds on the first report, identifying social risk factor indicators that could be accounted for in Medicare quality measurement and payment, as well as offering criteria for selecting these social risk factor indicators to account for them in Medicare payment programs (NASEM, 2016b). The committee’s fourth report provides guidance on data the Centers for Medicare & Medicaid Services (CMS) could use to account for social risk factors in Medicare payment programs (NASEM, 2016c). In this chapter, the committee summarizes key material from those reports and defines each social risk factor and relevant indicators, as well as the potential data sources CMS could use if it chose to account for these social risk factors in some or all of its VBP programs. The chapter closes with general considerations to address questions that arose after the publication of the prior reports. The interested reader is referred to Appendixes A, C, and D for detailed information.
DEFINITION, EVIDENCE, AND DATA SOURCES
Each indicator described in this section meets the committee’s criteria that a social risk factor has a relationship to health care outcomes of interest (i.e., performance indicators used in VBP such as health care use, health care outcomes, and resource use), precedes care delivery and is not a consequence of the quality of care, and is not something the provider can manipulate, and also meets practical considerations. Potential data sources are also discussed. Figure 2-1 shows the specific social risk factor indicators the committee identified. The committee notes that the listing of social risk factors does not reflect an order of priority.
Socioeconomic Position1
Socioeconomic position (SEP) reflects a person’s absolute and relative position in a socially stratified society, and it captures a combination of access to material and social resources, as well as relative status (i.e., prestige- or rank-related characteristics). The committee identified income, education, dual eligibility, and wealth as possible indicators for use by CMS in VBP.
Income
Income is the most commonly used measure of economic resources (Braveman et al., 2005), largely because there are available measures, but also because income has strong face validity. Individual income can affect health and health care outcomes directly as a means of purchasing health care and indirectly as a means of acquiring health promoting resources, such as better education, housing, and nutrition (Adler and Newman, 2002; Braveman et al., 2005). Income can be assessed annually or cumulatively, as lifetime earnings. The latter may be more relevant for older adults, fewer of whom participate in the paid workforce. Lifetime earnings are also less likely to be influenced by current health.
When self-reported, income can be sensitive to collect, but reliable methods exist to accurately, reliably, and feasibly collect income data (Moore and Welniak, 2000). Although there may be less variation in income among older populations, especially the very old (age 80 and older), because income includes both earned and unearned income, there is likely to be sufficient variation in income among the Medicare population (albeit a narrower range than among the general population) to capture the full variation in SEP (HHS, 2015).
___________________
1 As described in the committee’s first report (NASEM, 2016a), the committee prefers socioeconomic position to the more common phrase socioeconomic status, because socioeconomic position is a broader term encompassing resources as well as status (Krieger et al., 1997).
CMS does not currently collect or maintain income data (Samson et al., 2016), nor do providers and plans do so through electronic health records (EHRs) or otherwise. The Social Security Administration (SSA) maintains several sources of individual-level income data. Government agencies that collect premiums for Medicare parts B and D (e.g., SSA, Railroad Retirement Board, and Office of Personnel Management) also have income data used for determining premium amounts; however, CMS does not have individual income information.2
An area-level measure of income from the American Community Survey such as median household income could be used as a proxy for individual-level income. However, an area-level proxy measure is an imperfect proxy for the individual-level measure and may therefore be less preferable than a true individual-level measure. In the short term, CMS should use available area-level income data from the American Community Survey as a proxy for individual income. In the longer term, CMS should explore the feasibility of linking to SSA income data from the uncapped Medicare payroll tax and/or develop standardized measurements and methods for new data collection.3
Education
Education is important for health because it shapes future employment and economic resources (Adler and Newman, 2002; IOM, 2014; NASEM, 2016a). Education can therefore affect health indirectly through other indicators of SEP—employment, occupation, and income. At the same time, education can also affect health by enabling individuals to access and understand health information and health care and to make decisions that promote health and reduce health risks, and by contributing to a patient’s ability to advocate for him- or herself in health care (Cutler and Lleras-Muney, 2006; IOM, 2014). The relationship between education and health care outcomes may vary across age cohorts owing to changes in the distribution of education over time (Lynch, 2003). Education can be measured as continuous or categorical years of schooling completed or as educational attainment measured by credentials of formal schooling (e.g., high school diploma, college degree) (Braveman et al., 2005; IOM, 2014).
Currently, CMS does not collect or maintain data on education, nor do providers and plans routinely collect it. Although some of the more comprehensive EHRs may capture educational attainment, standardized measures
___________________
2 Personal communication, John D. Shatto (Centers for Medicare & Medicaid Services, Office of the Actuary) to Kathleen Stratton (National Academies of Sciences, Engineering, and Medicine staff), September 8, 2016.
3 See Recommendation 3 in the committee’s fourth report (NASEM, 2016c).
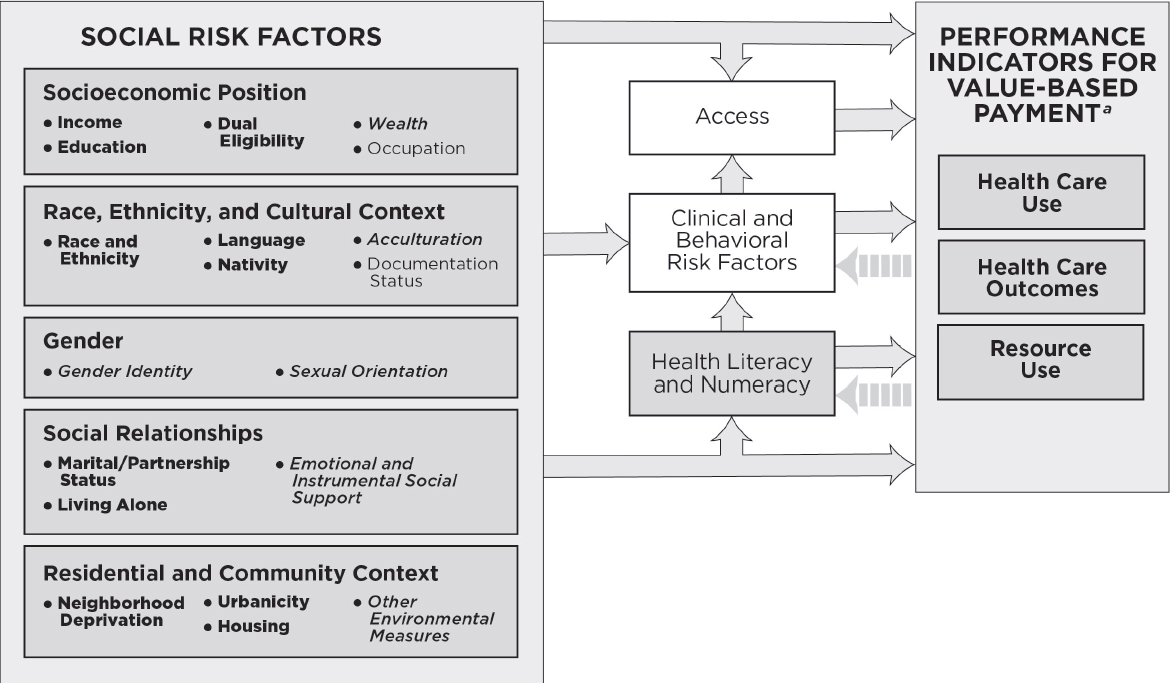
NOTE: This conceptual framework illustrates primary hypothesized conceptual relationships. For the indicators listed in bullets under each social risk factor, bold lettering denotes measurable indicators that could be accounted for in Medicare VBP programs in the short term; italicized lettering denotes measurable indicators that capture the basic underlying constructs and currently present practical challenges, but are worth attention for potential inclusion in accounting methods in Medicare VBP programs in the longer term; and plain lettering denotes indicators that have considerable limitations.
a As described in Figure 1-1, health care use captures measures of utilization and clinical processes of care; health care outcomes capture measures of patient safety, patient experience, and health outcomes; and resource use captures cost measures.
and data collection strategies are needed. To that end, the earlier Institute of Medicine (IOM) report on social and behavioral domains and measures for EHRs identified education as a clinically useful social risk factor and recommended its inclusion in EHR meaningful use standards. With respect to other government sources, area-level measures are available through the American Community Survey. Thus, in the short term, CMS should use these available area-level measures as a proxy for individual education. In the long term, because education is relatively stable for Medicare beneficiaries, CMS should develop standardized measures and methods to collect education data.3
Dual Eligibility
In health research, numerous studies assess the effects of insurance coverage on health status (see, for example, IOM, 2009a), but its use here is restricted to its use as a proxy for resources to support health and health care and thus as an indicator of SEP. For the Medicare population, Medicaid eligibility—also referred to as dual (Medicare and Medicaid) eligibility—is an indicator of insurance status that can be used as a proxy that captures elements of both income and wealth, due to income thresholds and asset limits. Because states establish Medicaid eligibility, what dual eligibility represents varies by state.
Dual eligibility may capture dimensions of health status that are unmeasured by other data sources because it represents insurance coverage as a concept distinct from SEP. For example, dual eligibles receive more generous health coverage through Medicare and Medicaid than uninsured or underinsured persons who have relatively higher SEP, but who are ineligible for Medicaid coverage because they have income and/or wealth just above the eligibility threshold. Relatedly, dual eligibility may capture clinical characteristics covering those who are under age 65 and eligible for Medicare coverage based on disability. Because dual eligibility captures elements of income, wealth, and health status, dual eligibility can be considered a broader measure of health-related resource availability that captures medical need.
CMS administers both Medicare and Medicaid programs, and therefore already possess existing data on dual eligibility among Medicare beneficiaries. This includes graded data on full or partial eligibility and is the most reliable source of available data. Thus, following the committee’s guiding principle for CMS to first use data it already has, CMS should use its existing data on dual eligibility.4
___________________
4 See Recommendation 2 in the committee’s fourth report (NASEM, 2016c).
Wealth
Wealth is an alternate measure of economic resources that represents total accumulated economic resources (assets). Similar to income, wealth is likely to be important for health and health care outcomes as a means of acquiring health care and health-promoting resources (Braveman et al., 2005; Deaton, 2002; NASEM, 2016a). Moreover, whereas income may capture less variation in economic attainment among Medicare beneficiaries, especially persons who are very old, wealth may capture more variation. Therefore, wealth may be a more sensitive indicator of SEP for persons who are very old (Allin et al., 2009). Additionally, there are substantial differences by subgroups with similar incomes, especially racial and ethnic subgroups and by gender. For example, blacks have significantly less wealth compared to whites even at the same income levels (Kochhar and Fry, 2014; Shapiro et al., 2013). Wealth can also buffer the effects of changes in income (such as those attributable to unemployment or illness) (Cubbin et al., 2011). However, wealth may still be susceptible to changes as a consequence of health events among individuals (Lee and Kim, 2008). This may be particularly relevant for low-income persons who also share a disproportionate burden of disease. A challenge of using wealth as an indicator of SEP is that relatively few studies have examined the relationship between wealth and performance indicators used in VBP (Braveman et al., 2005; NASEM, 2016a). Hence, there is little evidence documenting an empirical association.
Collecting self-reported net worth is difficult because it is sensitive and because many individuals simply do not know the value of their net worth or what assets they have (Braveman et al., 2005; Eggleston and Klee, 2015). Nevertheless, some reliable and validated measures and data collection methods do exist. In particular, the Health and Retirement Study (HRS) has designed measures and methods to collect data on wealth that overcome traditional barriers to collecting wealth data such as concerns about privacy and imprecise knowledge (National Institute on Aging et al., 2007). Some HRS data are linked to Medicare records (ResDAC, n.d.), and therefore are useful for examining the effect of wealth on health care outcomes. However, as described in the committee’s third report (see Appendix C), because samples for the HRS are small, these data are unlikely to be useful for application in Medicare quality measurement or payment (NASEM, 2016b).
Wealth data are not currently available through CMS, providers and plans, or other government agencies. Medicaid programs do require assets be below a certain threshold for eligibility, and this asset threshold could be used to measure wealth dichotomously (i.e., high wealth above the threshold, and low wealth at or below the threshold). However, Medicaid eligibility criteria, including this asset threshold, vary by state. Moreover, this
measure of wealth would be at least partly captured through dual eligibility status, for which there is better and available existing data (as described in the previous section on dual eligibility).
Because no data sources are available for use in the short term, CMS should conduct more research on both measurement and data collection methods on wealth by CMS or through EHRs.5 In particular, CMS may want to consider the empirical question of whether the addition of wealth data adds sufficient precision above and beyond income data, for which some data is already available and for which methods and measures exist to collect data with less burden, to warrant additional data collection for inclusion in any method to account for social risk factors in Medicare quality measurement and payment. National surveys such as the HRS that can be linked to individual-level health care outcomes of Medicare beneficiaries could serve as a test bed for CMS to assess this question.
Note Regarding Occupation
Occupation includes both employment status (whether an individual participates in the paid labor force or not, and if so, to what degree), as well as the type of occupation among the employed (Adler and Newman, 2002; NASEM, 2016a). Additionally, occupation can be collected in its current state or in a past state, as primary lifetime occupation. There is relatively little empirical evidence on the association between employment or occupation and performance indicators used in VBP, especially using U.S. data (NASEM, 2016a). This is likely because of the difficulty of collecting and classifying occupation in the United States, which maintains a Standard Occupational Classification System, but many of the categories are too heterogeneous to be meaningful (Braveman et al., 2005). Additionally, some groups such as retired persons and homemakers may not have an employment related to occupation, making it difficult to identify their SEP. In short, occupation is a conceptually powerful indicator of SEP, but practical considerations limit its potential use.
Race, Ethnicity, and Cultural Context
Race and ethnicity are related but conceptually distinct constructs that are dimensions of a society’s stratification system by which resources, risks, and rewards are distributed. In particular, race and ethnicity capture features of social disadvantage, including access to social institutions and rewards; behavioral and other sociocultural norms; inequality in the distribution of power, status, and material resources; and psychosocial exposures
___________________
5 See Recommendation 4 in the committee’s fourth report (NASEM, 2016c).
(IOM, 2014; Williams, 1997). Three constructs of community context are language, nativity, and acculturation.
Race and Ethnicity
Categories of race and ethnicity capture a range of health-relevant dimensions, especially those related to social disadvantage. Race and ethnicity are strongly associated with health and health care outcomes, even after accounting for measures of SEP (Krieger, 2000; LaVeist, 2005; NASEM, 2016a; Williams, 1999; Williams et al., 2010). This effect may be caused by the lack of comparability of a given SEP measure across racial and ethnic groups (e.g., wealth is differentially correlated with income by race), the importance of other unmeasured social factors that are patterned by race and ethnicity (e.g., neighborhood environments, discrimination, immigration-related factors, language), and measurement error in SEP (NASEM, 2016a). Observed differences by race and ethnicity may also represent differences in the quality of care received, including differences related to poor communication, poor cultural competence, discrimination, and bias (IOM, 2003b).
Race and ethnicity are typically identified through self-reported categories. In health research, Hispanic ethnicity is frequently combined with racial categories. The most commonly used “racial” categories are non-Hispanic white, non-Hispanic black, Hispanic, and Asian (see, for example, AHRQ, 2016; CMS, 2016b). This categorization is problematic because it conceals substantial heterogeneity within certain categories. Some existing standards include federal standards from the White House Office of Management and Budget (OMB), which the U.S. Department of Health and Human Services (HHS) is increasingly adopting (CDC, 2010; IOM, 2009b; OMB, 1995), as well as those recommended in a 2009 IOM report (IOM, 2009b). Because race and ethnicity are conceptually distinct, these standards recommend using separate items for collecting race and ethnicity data. The committee acknowledges that causal pathways by which race and ethnicity influence health include mechanisms that can be related to quality of care.
Medicare currently maintains race and ethnicity data in its administrative records (Filice and Joynt, 2016). Current Medicare surveys and administrative records capture self-reported race and ethnicity using categories that adhere to federal standards issued by OMB (Filice and Joynt, 2016; OMB, 1995). However, race and ethnicity information for older beneficiaries who enrolled in Medicare prior to when these standards were issued and implemented may reflect outdated racial and ethnic classifications (Filice and Joynt, 2016; Zaslavsky et al., 2012). EHRs are likely to capture race and ethnicity data. To that end, the Office of the National
Coordinator for Health Information Technology (ONC) included capturing race and ethnicity using categories that adhere to OMB standards in its stage 2 meaningful use standards (CMS, 2012).6 Race and ethnicity are also clinically useful and were included in the 2014 IOM report on capturing social and behavioral domains and measures. Because race and ethnicity are relatively stable factors for which Medicare already has data, CMS should use available self-report and imputed race and ethnicity data in its existing records and existing methods in the short term. However, the committee acknowledges some limitations with regard to lack of standardization in current measurement and collection, and less accuracy for older age groups. Thus, over the long term, CMS should also continue to collect self-reported race and ethnicity data following the OMB standards and to work on standardizing measures and methods across the various self-report mechanisms it oversees—including administrative forms, Medicare sample surveys, and provider and plan reporting requirements.7
Language
In health care and health services research, language typically represents language barriers, such as speaking a primary language that is not English, having limited English proficiency, or otherwise needing interpreter services. This includes deaf American Sign Language users. Language barriers are strongly associated with health and health care outcomes—in particular, poorer access to health care, poorer health status, poorer quality care, including less recommended care, and more adverse health events (NASEM, 2016a).
CMS currently maintains some data on preferred language, which has high specificity, but poor sensitivity. In its Strategic Language Access Plan, CMS included having the CMS Civil Rights Agency Liaison examine the feasibility of including collection of language preferences to existing CMS surveys as well as ways to standardize data collection on existing and future surveys (CMS, 2014). Providers and plans could also collect language data, because it is clinically useful for providers and plans to provide tailored care, such as providing health information in languages other than English or providing language interpreter services. Indeed, to provide such services, many health plans collect and maintain language data (Lawson et al., 2011; Nerenz et al., 2013a,b). Similarly, providers may voluntarily col-
___________________
6Meaningful use in health information technology refers to the use of EHR data for specific objectives, such as to improve quality of care, care coordination, and population and public health (CMS, 2016a; IOM, 2014; ONC, 2014). CMS meaningful use incentive programs to providers and plans that demonstrate that their EHRs achieve certain meaningful use objectives, and have been implemented in stages.
7 See Recommendation 3 in the committee’s fourth report (NASEM, 2016c).
lect and maintain language data in adherence to national standards, such as those put forth by the CMS Office of Minority Health (2016) and the HHS Office for Civil Rights (HHS, 2016). Capturing preferred language using the Library of Congress language codes was also included in the stage 2 meaningful use regulations as part of the measure of recording demographics (CMS, 2012). Area-level measures, such as those from the American Community Survey and some imputation methods, are also available as individual-level proxies where individual-level data do not exist. In the short term, CMS should use its existing data on preferred language while acknowledging its limitations. In the long term, CMS should continue efforts to standardize measures and data collection methods.8 A 2009 IOM report provides guidance on standardization of race, ethnicity, and language data (IOM, 2009b).
Nativity and Acculturation
Nativity refers to one’s country of origin. Immigration history includes refugee and documentation status, as well as duration in the United States. Acculturation describes the extent to which an individual adheres to the social norms, values, and practices of his or her own ethnic group or home country or to those of the United States (NASEM, 2016a).
Measures of nativity include identifying a specific country of origin or a dichotomous measure comparing foreign-born to U.S.-born individuals. These measures of nativity and measuring duration in the United States could therefore feasibly be collected during an office visit or in an electronic health record. Measures of nativity and time in the United States are also less sensitive than measures of documentation status or citizenship (IOM, 2014). Nativity, duration in the United States, and measure of language can be crude proxies for acculturation. Although there is evidence on the relationship between acculturation and health, evidence on the effect of acculturation on performance indicators used in VBP is not well established (Abraído-Lanza et al, 2006; IOM, 2014).
Medicare beneficiaries’ place of birth could be collected either by CMS or via EHRs with relatively little burden to patients, providers and plans, or CMS. Nativity is a stable social risk factor, which supports one-time collection by CMS to reduce burden, but nativity also has clinical usefulness, which supports collection through EHRs. The SSA collects place of birth, including city and state or foreign country, on applications for a Social Security card (SSA, 2011) or at enrollment for Social Security benefits (SSA, n.d.), and it maintains place-of-birth data in its Numident file (McNabb et al., 2009). These data could be paired with Medicare beneficiary records.
___________________
8 See Recommendation 3 in the committee’s fourth report (NASEM, 2016c).
Because data exist in SSA records that could be linked to Medicare beneficiary records, CMS should use this available source of data for nativity.9
Because there is a strong interaction between acculturation and race and ethnicity, measures of acculturation frequently assess acculturation among specific subgroups (e.g., Hispanic immigrants) (HHS, 2014). For example, the Brief Acculturation Scale for Hispanics is a reliable, validated measure to assess acculturation among Hispanic Americans using four self-reported language use items (Mills et al., 2014). Duration in the United States is also used as an imperfect proxy for acculturation, because acculturation is expected to increase with the amount of time spent in the United States. Because more evidence is needed on the empirical association between acculturation and health care outcomes, CMS should revisit this indicator and its appropriate measurement when more evidence is available.10 However, because acculturation is often measured using preferred language, which is available to CMS in the short term, language data could capture elements of acculturation in addition to language itself.
Gender Identify and Sexual Orientation11
Gender minorities (individuals who identify as transgender, intersex, or otherwise nonconforming gender) may experience differences in health and health care outcomes, but there remains little empirical evidence. What evidence does exist suggests that differential health care outcomes may arise from miscommunication, lack of cultural competence, or bias in the patient–provider encounter (IOM, 2011). The lack of evidence is due in part to the lack of a good existing measure, although, based on recommendations from a 2011 IOM report, HHS has been actively working to improve data collection. Emerging literature supports a relationship between gender identity and health care outcomes of interest, but existing measures pose challenges to feasibility. Hence, the empirical association is poorly established.
Sexual orientation in this context primarily refers to sexual minorities, or individuals who identify as lesbian, gay, bisexual, queer, questioning, or otherwise nonconforming. Sexual orientation is typically defined with respect to three dimensions: attraction, behavior, and identity (IOM, 2011).
___________________
9 See Recommendation 2 in the committee’s fourth report (NASEM, 2016c).
10 See Recommendation 6 in the committee’s fourth report (NASEM, 2016c).
11 As described in the committee’s third report (NASEM, 2016b), normative gender categories (men and women) are strongly associated with health and health care outcomes, despite the fact the gender effects are difficult to separate from biological sex effects. Thus, normative gender is a strong candidate for inclusion in methods to account for social risk factors in Medicare quality measurement and payment programs. However, the committee notes that gender is already included as a risk factor in clinical risk adjustments in Medicare.
As with gender identity, emerging evidence suggests that differential health care outcomes among sexual minorities may be largely attributable to drivers related to the quality of care provided (e.g., miscommunication, poor cultural competence, discrimination) (Elliott et al., 2015; IOM, 2011). Similar to the practical challenges of establishing better evidence between gender identity and performance indicators used in VBP, there are no good existing measures. Any current measures frequently only capture one dimension of sexual orientation, and identifying the dimension or dimensions most relevant to the outcome of interest can be conceptually challenging (IOM, 2011). Specifically, some individuals do not present consistently across the three dimensions of sexual orientation. For example, some men report that they have sex with other men, but do not identify as gay. In cases of such inconsistency across dimensions, identifying the dimension or dimensions most relevant for the outcome of interest will be important to accurately classify individuals. Taken together, like gender identity, emerging literature supports a relationship between sexual orientation and health care outcomes of interest, but poor existing measures have limited available evidence.
Although some measures and best practices for data collection exist and CMS has included data collection of sexual orientation and gender identity in its Equity Plan for Improving Quality in Medicare, there are currently no standards for measuring and collecting data on sexual orientation and gender identity (CMS Office of Minority Health, 2015). Partly because of a lack of standardized measures, there is currently little evidence on the effect of sexual orientation and gender identity on performance indicators used in VBP (NASEM, 2016a,b). Because more evidence is needed on the empirical association between sexual orientation and gender identity and health care outcomes, CMS should revisit this indicator and its appropriate measurement when more evidence is available.12 In particular, for sexual orientation, CMS should take notice of which dimension or dimensions are most relevant for health care outcomes of interest. At the same time, CMS should continue efforts to develop standardized measures and data collection strategies and to collect data.
Social Relationships
Social relationships are important for health because they provide access to social networks that can provide access to resources (including instrumental support and access to health care services or health-promoting resources), as well as emotional support (Berkman and Glass, 2000; Cohen, 2004; Eng et al., 2002; House et al., 1988). Social relationships are most
___________________
12 See Recommendation 6 in the committee’s fourth report (NASEM, 2016c).
frequently assessed in the health care and health services research literature with three constructs: marital/partnership status, living alone, and social support.
Marital/Partnership Status
Marital or partnership status is a foundational structural element of social relationships that is also often considered an important indicator of social support. Being married or partnered is associated with better health care outcomes, while being single, widowed, or otherwise unpartnered is associated with worse health care outcomes (NASEM, 2016a). Literature suggests that this relationship holds true for both heterosexual partners and same-sex couples (Liu et al., 2013). Additionally, the relationship between marriage and health outcomes interacts with gender. Demographic shifts in family structure have emerged over the past several decades—marriage rates have declined while the number of cohabiting individuals and persons who never married has increased (Wang and Parker, 2014). Additionally, there is likely to be greater variability in the future with the increase in the never-married and cohabiting populations, which are increasingly tied to SEP, race, ethnicity, and community of residence (Aughinbaugh et al., 2013; Tamborini, 2007; Wang and Parker, 2014). Some evidence suggests that the relationship between marital status and health is changing along with these demographic shifts (Liu and Umberson, 2008).
CMS maintains data on marital status, because it is important for Social Security benefits, but it does not collect or maintain data on partnership. Providers, plans, and other federal government agencies also do not collect data on partnership. However, because partnership can change over time, especially among older adults, and is clinically useful, it could be collected through EHRs. If so, validated measures of partnership exist in the literature, but CMS would need to develop standardized measures and data collection methods for its own collection or provider/plan reporting requirements. An important consideration for the longer term are ongoing demographic shifts in family structure, including the federal Supreme Court ruling making same-sex marriage legal nationally.13 It will be important for CMS to monitor the empirical association between marital/partnership status and health care outcomes and revisit assumptions about marital/partnership status as an indicator of social support over time. In the short term, CMS should use available data on marital status. In the long term, research is needed on measurement and data collection for partnership.14 In particular, CMS may want to examine whether including partnership in any
___________________
13Obergefell et al. v. Hodges, Director, Ohio Department of Health, et al. 576 US (2015).
14 See Recommendation 3 in the committee’s fourth report (NASEM, 2016c).
method to account for social risk factors in Medicare quality measurement and/or payment that already includes marital status and living alone adds substantial additional precision and explanatory value.
Living Alone
Living alone is a structural element of social relationships. In health research, living alone is typically an indicator of social isolation or loneliness, which have been shown to have important negative consequences for health (Berkman and Glass, 2000; Brummett et al., 2001; Cohen, 2004; Eng et al., 2002; House et al., 1988; Wilson et al., 2007). Living alone is also likely to at least partly capture elements of social support. Living alone is strongly associated with health, although literature on the association between living alone and performance indicators used in VBP is sparse (NASEM, 2016a).
Living alone is potentially susceptible to rapid changes, including changes resulting from a health care interaction. For example, an ill parent may temporarily move in with his or her child following a health event or the advice of a doctor. However, living alone is not likely to be susceptible to rapid changes on average. Living alone can be fairly easily and feasibly assessed in the clinical setting using a dichotomous measure (living alone or not) or more finely graded household composition measures (e.g., living alone, with one other person, two other persons, and so on).
CMS currently collects data on living arrangements for some patients in postacute settings, such as through the Home Health Outcome Assessment Information Set (AHRQ, 2016; CMS, n.d.), and in the Medicare Current Beneficiary Survey (CMS, 2015a). Providers and plans do not currently collect data on living arrangements, nor is national data available through other government agencies. Thus, there are no data sources that could be used in the short term. However, for the long term, because living arrangements can change rapidly, especially for older adults and because living alone is clinically useful, living alone may best be captured in the clinical setting, and CMS should develop standardized measures and methods for data collection through EHRs.15
Social Support
Social support is a key function of social relationships and includes emotional elements (such as through caring and concern) as well as instrumental components (such as material and other practical supports). Instrumental social support can support access to health-promoting
___________________
15 See Recommendation 4 in the committee’s fourth report (NASEM, 2016c).
resources (e.g., delivery of nutritious meals) and health care (e.g., providing transportation to a doctor’s appointment) (Berkman and Glass, 2000). Researchers often measure an individual’s perceived or potential social support through measures of social connections or social integration, which may represent potential sources of social support (IOM, 2014).
Measures of social support may pose feasibility issues. Some measures have many items and are burdensome to collect or may only assess one element of social support (e.g., instrumental but not emotional support; perceived support versus actual support). Additionally, because social support is multidimensional, identifying the measure that represents the most relevant dimension for a given health care outcome can be challenging. Despite these limitations, measures of social support are still likely to capture elements of social relationships that are relevant for health care outcomes.
Currently, no social support data are available within CMS, from providers and plans, or from other national data via other government agencies. Thus, there are no data sources that could be used in the short term. However, for the long term, because social support can change rapidly especially among older adults and because it is clinically useful, it may best be captured in the clinical setting, and CMS should develop standardized measures and methods for data collection through EHRs.16
Residential and Community Context
Residential and community context captures a set of broadly defined characteristics of residential environments, including compositional characteristics that describe aggregate characteristics of individuals residing in a given neighborhood or community, as well as characteristics of social and physical environments.
Neighborhood Deprivation
Compositional characteristics of communities include, for example, dimensions of SEP, the proportion of racial and ethnic minority residents, foreign-born residents, single-parent households, and English language–proficient residents. Residential environments include both physical and social elements that are relevant for health. These are described in more detail in the section on environmental measures. Because compositional characteristics can be interpreted to represent a combination of environmental effects, group-level effects, and as a proxy for effects of individual characteristics, in its third report, the committee concluded that a measure
___________________
16 See Recommendation 4 in the committee’s fourth report (NASEM, 2016c).
of neighborhood deprivation assessed using a composite measure of compositional characteristic is likely to be a good proxy for a range of individual and true area-level constructs (compositional and environmental) relevant to performance indicators used in VBP (NASEM, 2016b).
Compositional characteristics can be assessed and used individually, such as neighborhood racial and ethnic composition or neighborhood SEP. Compositional characteristics can also be assessed using composites, such as a summary indicator of neighborhood deprivation or neighborhood SEP. For example, Roblin developed a summary measure to assess the neighborhood SEP of a managed care organization’s enrollees measured at the census tract level using seven indicators:
- Percent of households with income below the federal poverty level,
- Percent of households receiving public assistance,
- Percent of households with low income,
- Percent of unemployed adult males,
- Percent of adults with low educational attainment,
- Median household income, and
- Median home value (Roblin, 2013).
Because neighborhood deprivation captures a patient or beneficiary’s environment or residential context, an area-level measure based on the beneficiary’s residential address is appropriate. Although residential addresses are available from providers, plans, and Medicare records, the latter is preferable, because these are the data CMS already possesses. Neighborhood deprivation can be assessed using a single-item measure such as median household income or using a multi-item composite measure. Numerous neighborhood deprivation indexes comprising multiple items (e.g., median household income, percent of residents with a high school degree, percent of unemployed residents, percent of households with an income below the federal poverty level) have been developed (Oka, 2015), and data on these area-level measures are available through the American Community Survey. The committee recommends that CMS test a composite measure (such as an existing indicator from the literature) and a simple single-indicator item (such as median household income), contrast their performance at the census tract level, and also weigh the benefits of the simplicity of a single indicator against the increased precision from a composite measure for use in the short term. To increase accuracy in the long term, CMS could conduct research on measurement and data collection such as measures to better capture neighborhood deprivation in rural areas, to identify an improved geospatial unit of analysis for rural settings, and to assess the performance of any given variable (single or composite) across multiple geographic areas.
Urbanicity and Rurality
Urbanicity/rurality describes where an individual’s place of residence falls on the spectrum from urban to rural. On one end of the spectrum, rural areas are associated with poorer access to health care owing to both distance and availability. Rural areas are also associated with increased risks from environmental hazards associated with rural industries such as pesticides in farming (IOM, 2003b). On the other end, urban areas may have regions with concentrated disadvantage that expose residents to negative effects of poverty, negative psychosocial exposures, and physical decay. Cities may also expose residents to environmental hazards associated with air pollution and the safety hazards of old or densely populated buildings (IOM, 2003a). Patient urbanicity/rurality may differ in significant ways across provider urbanicity/rurality because, for example, rural patients who receive care from urban hospitals are likely to differ significantly from rural patients who receive care at rural hospitals. Importantly, provider urbanicity/rurality can only measure between-unit effects, whereas patient urbanicity/rurality can be used to assess both within- and between-unit effects. Assessing urbanicity/rurality may pose some potential measurement issues related to identifying the appropriate size to avoid misclassification (Krieger et al., 1997). For example, at the census tract level, there can be substantial variation in population and geographic size. Additionally, census tracts may be too small to capture truly rural or urban areas, misclassifying, for example, areas within a large metropolitan county as “rural” or small towns in rural areas as “urban” (Hart et al., 2005).
For the purpose of inclusion in Medicare performance measurement and payment, the urbanicity or rurality of a beneficiary’s place of residence is likely to be a more salient indicator of his or her social risk factors than a provider’s location. Because urbanicity/rurality represents a beneficiary’s residential and community context, an area-level measure based on the beneficiary’s place of residence is appropriate.
A Medicare beneficiary’s place of residence is available in Medicare administrative records and is also likely to be captured in administrative or EHR data by providers and plans. Following the principle for Medicare to first use its existing data, Medicare should use beneficiaries’ residential addresses in its administrative records. Beginning with the 2010 Census, the U.S. Census Bureau used a trichotomous measure to classify census tracts and/or census blocks (Census Bureau, 2015). Urban areas are defined as regions with 50,000 or more people, urban clusters are regions with at least 2,500 and fewer than 50,000 people, and rural characterizes all areas not included in either urban classification (Census Bureau, 2015). Because an area-level measure of urbanicity/rurality is appropriate and a trichotomous classification of census tract–/block-level urbanicity/rurality
is available through the Census Bureau, this available measure should be used based on a Medicare beneficiary’s residential address in the Medicare record.17
Housing
Elements of housing that may influence health and health care outcomes include housing stability, homelessness, and quality and safety. Homelessness and housing instability, defined as a lack of access or threats to reasonable quality housing (Frederick et al., 2014), can be barriers to accessing health care and are associated with poorer physical and mental health and increased mortality (NASEM, 2016a). Poor quality or unsafe housing can expose individuals to such environmental hazards as lead, poor air quality, infectious disease, and poor sanitation, and can lead to injury (IOM, 2003b; NASEM, 2016a).
Currently neither CMS nor providers and plans routinely collect housing information. Some more comprehensive EHRs may collect or link to data on housing (e.g., Gottlieb et al., 2015; ONC, n.d.). Some area-level measures of housing are available through the American Community Survey and the U.S. Department of Housing and Urban Development (HUD). For example, American Community Survey housing data capture physical characteristics (e.g., rooms, age, access to utilities) as well as housing costs, age, and value (Census Bureau, 2013), and the HUD Healthy Communities Index captures vacancy rates, housing costs, and blood lead levels in children as an indicator of environmental hazards, and age of housing (San Diego Council of Governments, n.d.). Because some dimensions of housing reflect beneficiaries’ environment, an area-level measure could be appropriate. This measure would be based on a beneficiary’s residential address, which is collected by CMS, through EHRs, and by plans. Following the principle to first use available existing data it possesses, the residential address in the Medicare record is preferred. Thus, in the short term, the committee recommends that CMS test area-level measures of housing based on a beneficiary’s residential address in the Medicare record and contrast their performance. Because other elements of housing, in particular, physical characteristics, occur at the individual level, and these are likely to change over time, individual-level housing data could be collected through EHRs in the long term, but more research is needed on measurement and data collection methods.18
___________________
17 See Recommendation 2 in the committee’s fourth report (NASEM, 2016c).
18 See Recommendation 5 in the committee’s fourth report (NASEM, 2016c).
Other Environmental Measures of Residential and Community Context
Environmental measures of residential and community context capture dimensions of residential environments including the physical or built environment (e.g., housing, walkability, transportation options, and proximity to services—including health care services) as well as social environments (e.g., safety and violence, social disorder, the presence of social organizations, and social cohesion). Although environmental measures are likely to be associated with health and health care outcomes, evidence is currently limited (NASEM, 2016a). For example, a growing body of literature shows that some neighborhoods have substantially fewer safe recreation spaces, purveyors of healthy foods, and health care resources, and these factors may be related to health (Blustein et al., 2010; Diez Roux and Mair, 2010). However, evidence regarding the effect of these factors on performance indicators used in VBP is still lacking. This is therefore an emerging area of research that could be reevaluated for potential inclusion as more evidence emerges. In sum, environmental measures are conceptually powerful, but this is an emerging area of research and the empirical association with health care outcomes is poorly established. Therefore, CMS should revisit such environmental measures and their appropriate measurement when more evidence is available.19
Table 2-1 summarizes the preceding discussion regarding availability of data for social risk factor indicators.
GENERAL CONSIDERATIONS
Upon release of the committee’s prior reports, several questions arose about the placement of specific risk factors in the committee’s framework (in the first report) or in the discussions of data sources (in the fourth report). The committee addresses these here.
Priorities
The placement of each social risk factor indictor in Table 2-1 should not be interpreted as the committee’s preference or priority for that indicator. The committee has found compelling reasons for considering each indicator listed for inclusion in Medicare quality and measurement programs and makes no distinctions in terms of which social risk factor or indictor is “most important” from either a conceptual or empirical standpoint. The table is meant to convey “readiness” for use of any specific indicator. Data availability drives which indicator can be used now versus in the future.
___________________
19 See Recommendation 6 in the committee’s fourth report (NASEM, 2016c).
TABLE 2-1 Summary of Data Availability for Social Risk Factor Indicators
| SOCIAL RISK FACTOR | DATA AVAILABILITY | ||||
|---|---|---|---|---|---|
| Indicator | 1 | 2 | 3 | 4 | |
| SEP | |||||
| Income | |||||
| Education | |||||
| Dual eligibility | |||||
| Wealth | |||||
| Race, Ethnicity, and Cultural Context | |||||
| Race and ethnicity | |||||
| Language | |||||
| Nativity | |||||
| Acculturation | |||||
| Gender | |||||
| Gender identity | |||||
| Sexual orientation | |||||
| Social Relationships | |||||
| Marital/partnership status | |||||
| Living alone | |||||
| Social support | |||||
| Residential and Community Context | |||||
| Neightborgood deprivation | |||||
| Urbanicity/rurality | |||||
| Housing | |||||
| Other environmental measures | |||||
![]() Available for use now
Available for use now
![]() Available for use now for some outcomes, but research needed for improved, furure use
Available for use now for some outcomes, but research needed for improved, furure use
![]() Not sufficiently available now; research needed for improved, future use
Not sufficiently available now; research needed for improved, future use
![]() Research needed to better understand relationship with health care outcomes and on how to best collect data
Research needed to better understand relationship with health care outcomes and on how to best collect data
Those ready to be used now might not be the indicators that will be most meaningful in the future, once CMS resolves measurement issues and conducts relevant empirical work.
For example, dual eligibility data are available for use in the short and long term. However, their availability do not reflect whether dual eligibility is a better indicator of SEP compared to individual income, wealth, or education. Conceptually, dual eligibility is a very imperfect proxy of SEP, compared to individual income, wealth, or education for reasons detailed earlier in the chapter. However, its predictive power for any given performance indicator used in VBP in a model that accounts for social risk factors in Medicare quality measurement and payment relative to the predictive power of other indicators of SEP is an empirical question that is beyond the scope of the committee’s task. For example, to determine the extent to which adjustment for dual eligibility accounts for the adjustment that would occur with a broader set of social risk factors not limited to dual eligibility, CMS could compare the variance in scores and payments from a fully adjusted model to the variance of adjustments from a model adjusting only for dual eligibility. If the difference is substantial, accounting for dual eligibility as a sole social risk factor may not be sufficient.
Similarly, lack of data does not indicate low priority. Just as some indicators are available, but have conceptual weaknesses, some indicators are conceptually powerful, but there is currently insufficient evidence of their effect on performance indicators used in VBP. Sexual orientation and gender identify provide another example. Theory suggests that sexual orientation and gender identity may contribute to health disparities experienced by Medicare beneficiaries who identify as gender or sexual minorities (IOM, 2011; NASEM, 2016a,b). However, although there are best practices for collecting data on gender identity and sexual orientation, there are no standards (NASEM, 2016c). Consequently, there remains little information on the effect of sexual orientation and gender identity on performance indicators used in VBP. This is, however, a rapidly evolving area of research. For example, the ONC included capacity to collect sexual orientation and gender identity in EHRs in its stage 3 meaningful use regulations set to begin in 2017 (CMS, 2015b). In October 2016, the National Institutes of Health designated gender and sexual minorities as a disparity population for research purposes (Perez-Stable, 2016). These and other policies may catalyze more research to provide evidence of an empirical association that supports the conceptual relationship between sexual orientation and gender identity and performance indicators used in VBP. Sexual orientation and gender identity questions are also included in some national health surveys (e.g., Behavioral Risk Factor Surveillance System, National Health and Nutrition Examination Survey, National Health Interview Survey) (CDC, 2013, 2015, 2016), and data from these surveys could
be used to examine the effect of sexual orientation and gender identity on indicators of health care use, health care outcomes, and health care costs. The committee recommended that, as such evidence emerges, CMS should revisit inclusion of these indicators in Medicare quality measurement and payment programs.
Health Literacy
In addition to the five domains of social risk factors, the committee also considered the influence of health literacy on performance indicators used in Medicare VBP, because it is specifically mentioned in the committee’s task. It is also included in the Improving Medicare Post-Acute Care Transformation (IMPACT) Act of 2014, and thus is of interest to Congress. Health literacy is “the degree to which individuals have the capacity to obtain, process, and understand basic health information and services needed to make appropriate health decisions” (IOM, 2004, p. 23). The committee does not consider health literacy to be a social risk factor, but rather a more proximal risk factor that is influenced by (more distal) social risk factors. Specifically, health literacy can be considered the product of an individual’s skills and abilities (including reading and other critical skills), sociocultural factors, education, health system demands, and the health care context (IOM, 2004). Exclusion of health literacy as a social risk factor and exclusion in the discussions of data sources should not be interpreted as a lack of appreciation for the contribution of health literacy to health and health care outcomes.
Disability
The committee considers disability to be a proximal risk factor for poor health care outcomes that is influenced by more distal social risk factors, somewhat like health literacy. The committee recognizes that disability is in part socially determined (IOM, 2007). The World Health Organization’s International Classification of Functioning, Disability, and Health, advocated in the 2007 IOM report The Future of Disability in America conceives of disability not as an inherent attribute of individuals, but rather the product of individual capacities (health conditions) and social conditions (including social and physical environments) (IOM, 2007; WHO, 2001). Thus, disability may arise in part from social risk factors. Additionally, disability may be a risk factor itself for poor health care outcomes (ODPHP, 2016a). In this conception, disability is not itself a distal social risk factor like SEP, race and ethnicity, gender, social relationships, or residential environments, but rather a mediator of social (and clinical) risk factors and health care outcomes.
Some Medicare beneficiaries with disabilities are systematically different from persons with disabilities more generally and from beneficiaries who qualify because of age. Specifically, to qualify for federal disability benefits, a person must have a clinical condition severe enough to prevent that person from completing substantial gainful activity, regardless of age, education, or work experience (SSA, 2008). Persons who qualify for Social Security disability benefits are eligible for Medicare after a waiting period. In other words, individuals eligible for Medicare on the basis of disability rather than age are by definition persons with certain clinical risk factors or diagnoses who also have at least one social risk factor such as low earnings. Some clinical risk adjustment systems currently include disability as an origin of Medicare entitlement (CMS, 2016c; MedPAC, 2016). Additionally, the clinical risk factors that entitle an individual to Medicare benefits are captured in existing clinical risk adjustments for Medicare VBP programs through major clinical diagnoses associated with disability, such as stroke, schizophrenia, or multiple sclerosis. Similarly, as part of the eligibility criteria, low earnings and inability to work define a beneficiary’s classification as disabled. These and other social risk factors are likely to also contribute to health disparities in beneficiaries with disabilities experience. For example, Medicare beneficiaries under age 65 are more likely to be black or Hispanic than beneficiaries who qualify because of age (Cubanski et al., 2016). Thus, accounting for social risk factors could capture additional risk that is unmeasured by clinical risk factors not currently accounted for in Medicare payment programs, and which contributes to disparities among beneficiaries with disabilities.
The committee acknowledges that the Medicare population is heterogeneous (even among beneficiaries with disabilities and among beneficiaries age 65 and older) and notes that its conceptual framework applies to all Medicare beneficiaries, including those with disabilities. The committee expects the effect of social risk factors to be similar for all Medicare subpopulations and variations in the effect of social risk factors are considered to fall within a continuous spectrum of effects. The committee found no evidence that social risk factors operate differently (i.e., no interactions or effect measure modification) among Medicare beneficiaries with disabilities compared to those without. To the extent that clinical risk adjustment captures clinical elements of disability and accounting for social risk factors captures social elements of disability, disability will be partially if not substantially captured in VBP quality measurement and payment.
Finally, the committee acknowledges that disability can be differentiated from some clinical risk factors for poor health outcomes or other health problems because of increased stigma. However, the committee notes that many health problems have social correlates. Indeed, many clinical and behavioral diagnoses—for example, mental health and substance use
disorders, sexually transmitted infections, and obesity—are also stigmatized. At the same time, stigma as a social correlate of disability is likely to affect this Medicare subpopulation’s ability to access and receive high-quality care, and could contribute to health disparities and poor health care outcomes of beneficiaries with disabilities (Corrigan, 2014). Persons with disabilities experience health and health care disparities, and these may arise from discrimination and stigma, as well as physical barriers (such as inaccessible medical equipment and health care facilities) and communications barriers (such as inadequate materials in Braille or large-print and lack of access to sign-language interpreters) that result from inadequate tailoring (Iezzoni, 2011; Krahn et al, 2015; ODPHP, 2016b). These types of barriers are consequences of the quality of care and therefore are not appropriate adjustors because they reflect true differences in quality. Accounting for these differences such as through risk adjustment would obscure these quality differences and reduce incentives to improve quality and reduce disparities.
REFERENCES
Abraído-Lanza, A. F., A. N. Armbrister, K. R. Flórez, and A. N. Aguirre. 2006. Toward a theory-driven model of acculturation in public health research. American Journal of Public Health 96(8):1342-1346.
Adler, N. E., and K. Newman. 2002. Socioeconomic disparities in health: Pathways and policies. Health Affairs (Millwood) 21(2):60-76.
AHRQ (Agency for Healthcare Research and Quality). 2016. 2015 National Healthcare Quality and Disparities report and 5th anniversary update on the national quality strategy. http://www.ahrq.gov/sites/default/files/wysiwyg/research/findings/nhqrdr/nhqdr15/2015nhqdr.pdf (accessed June 8, 2016).
Allin, S., C. Masseria, and E. Mossialos. 2009. Measuring socioeconomic differences in use of health care services by wealth versus by income. American Journal of Public Health 99(10):1849-1855.
Aughinbaugh, A., O. Robles, and H. Sun. 2013. Marriage and divorce: Patterns by gender, race, and educational attainment. Monthly Labor Review 136:1.
Berkman, L., and T. Glass. 2000. Social integration, social networks, social support, and health. In Social epidemiology, edited by L. F. Berkman and I. Kawachi. New York: Oxford University Press.
Blustein, J., W. B. Borden, and M. Valentine. 2010. Hospital performance, the local economy, and the local workforce: Findings from a US national longitudinal study. PLoS Medicine 7(6):e1000297.
Braveman, P. A., C. Cubbin, S. Egerter, S. Chideya, K. S. Marchi, M. Metzler, and S. Posner. 2005. Socioeconomic status in health research: One size does not fit all. Journal of the American Medical Association 294(22):2879-2888.
Brummett, B. H., J. C. Barefoot, I. C. Siegler, N. E. Clapp-Channing, B. L. Lytle, H. B. Bosworth, R. B. Williams Jr, and D. B. Mark. 2001. Characteristics of socially isolated patients with coronary artery disease who are at elevated risk for mortality. Psychosomatic Medicine 63(2):267-272.
CDC (Centers for Disease Control and Prevention). 2010. National Health Interview Survey annotated bibliography. http://www.cdc.gov/nchs/nhis/rhoi/rhoi_bibliography.htm (accessed April 26, 2016.
CDC. 2013. Behavioral Risk Factor Surveillance System questionnaire. http://www.cdc.gov/brfss/questionnaires/pdf-ques/2014_brfss.pdf (accessed August 4, 2016).
CDC. 2015. Sexual behavior—(SXQ). https://www.cdc.gov/nchs/data/nhanes/nhanes_15_16/SXQ_ACASI_I.pdf (accessed August 4, 2016).
CDC. 2016. Draft 2016 NHIS questionnaire- sample adult. ftp://ftp.cdc.gov/pub/Health_Statistics/NCHS/Survey_Questionnaires/NHIS/2016/english/qadult.pdf (accessed August 4, 2016).
Census Bureau. 2013. American Community Survey information guide. https://www.census.gov/content/dam/Census/programs-surveys/acs/about/ACS_Information_Guide.pdf (accessed August 11, 2016).
Census Bureau. 2015. 2010 census urban and rural classification and urban area criteria. https://www.census.gov/geo/reference/ua/urban-rural-2010.html (accessed August 8, 2016).
CMS (Centers for Medicare & Medicaid Services). 2012. Eligible professional meaningful use core measures, measure 3 of 17. https://www.cms.gov/Regulations-and-Guidance/Legislation/EHRIncentivePrograms/downloads/Stage2_EPCore_3_RecordingDemographics.pdf (accessed August 9, 2016).
CMS. 2014. Strategic language access plan for limited English-proficient persons. https://www.cms.gov/About-CMS/Agency-Information/OEOCRInfo/Downloads/StrategicLanguageAccessPlan.pdf (accessed August 9, 2016).
CMS. 2015a. 2015 questionnaires. https://www.cms.gov/Research-Statistics-Data-and-Systems/Research/MCBS/Questionnaires-Items/2015_Questionnaires.html?DLPage=1&DLEntries=10&DLSort=0&DLSortDir=descending (accessed August 15, 2016).
CMS. 2015b. Medicare and Medicaid programs; electronic health record incentive program-stage 3 and modifications to meaningful use in 2015 through 2017, Final Rule. Federal Register 80(200):62761-62955.
CMS. 2016a. EHR incentive programs for eligible professionals: What you need to know for 2016 tipsheet. https://www.cms.gov/Regulations-and-Guidance/Legislation/EHRIncentivePrograms/Downloads/2016_EPWhatYouNeedtoKnowfor2016.pdf (accessed August 2, 2016).
CMS. 2016b. Racial and ethnic disparities in health care in Medicare Advantage. https://www.cms.gov/About-CMS/Agency-Information/OMH/Downloads/National-Level-Results.pdf (accessed June 8, 2016).
CMS. 2016c. Risk adjustment. https://www.cms.gov/Medicare/Medicare-Fee-for-ServicePayment/PhysicianFeedbackProgram/Downloads/2015-RiskAdj-FactSheet.pdf (accessed December 1, 2016).
CMS. n.d. Home health patient tracking sheet. https://www.cms.gov/Medicare/Quality-Initiatives-Patient-Assessment-Instruments/HomeHealthQualityInits/Downloads/OASIS-C2-Item-Set-Effective_1_1_17a.pdf (accessed August 12, 2016).
CMS Office of Minority Health. 2015. The CMS equity plan for improving quality in Medicare. https://www.cms.gov/About-CMS/Agency-Information/OMH/OMH_Dwnld-CMS_EquityPlanforMedicare_090615.pdf (accessed August 11, 2016).
CMS Office of Minority Health. 2016. The national CLAS standards. http://minorityhealth.hhs.gov/omh/browse.aspx?lvl=2&lvlid=53 (accessed September 12, 2016).
Cohen, S. 2004. Social relationships and health. American Psychologist 59(8):676-684.
Corrigan, P. W. 2014. The stigma of disease and disability: Understanding causes and overcoming injustices. Washington, DC: American Psychological Association.
Cubanski, J., T. Neuman, and A. Damico. 2016. Medicare’s role for people under age 65 with disabilities. http://files.kff.org/attachment/issue-brief-Medicares-Role-for-People-Under-Age-65-with-Disabilities (accessed November 2, 2016).
Cubbin, C., C. Pollack, B. Flaherty, M. Hayward, A. Sania, D. Vallone, and P. Braveman. 2011. Assessing alternative measures of wealth in health research. American Journal of Public Health 101(5):939-947.
Cutler, D. M., and A. Lleras-Muney. 2006. Education and health: Evaluating theories and evidence. Cambridge, MA: National Bureau of Economic Research.
Deaton, A. 2002. Policy implications of the gradient of health and wealth. Health Affairs (Millwood) 21(2):13-30.
Diez Roux, A. V., and C. Mair. 2010. Neighborhoods and health. Annals of the New York Academy of Sciences 1186:125-145.
Eggleston, J. S., and M. A. Klee. 2015. Reassessing wealth data quality in the Survey of Income and Program Participation. http://www.census.gov/library/working-papers/2016/demo/SEHSD-WP2016-17.html (accessed October 16, 2016).
Elliott, M. N., D. E. Kanouse, Q. Burkhart, G. A. Abel, G. Lyratzopoulos, M. K. Beckett, M. A. Schuster, and M. Roland. 2015. Sexual minorities in England have poorer health and worse health care experiences: A national survey. Journal of General Internal Medicine 30(1):9-16.
Eng, P. M., E. B. Rimm, G. Fitzmaurice, and I. Kawachi. 2002. Social ties and change in social ties in relation to subsequent total and cause-specific mortality and coronary heart disease incidence in men. American Journal of Epidemiology 155(8):700-709.
Filice, C. E., and K. E. Joynt. 2016. Examining race and ethnicity information in Medicare administrative data. Medical Care. doi: 10.1097/MLR.0000000000000608.
Frederick, T. J., M. Chwalek, J. Hughes, J. Karabanow, and S. Kidd. 2014. How stable is stable? Defining and measuring housing stability. Journal of Community Psychology 42(8):964-979.
Gottlieb, L. M., K. J. Tirozzi, R. Manchanda, A. R. Burns, and M. T. Sandel. 2015. Moving electronic medical records upstream: Incorporating social determinants of health. American Journal of Preventive Medicine 48(2):215-218.
Hart, L. G., E. H. Larson, and D. M. Lishner. 2005. Rural definitions for health policy and research. American Journal of Public Health 95(7):1149-1155.
HHS (U.S. Department of Health and Human Services). 2014. Improving cultural competence: A treatment improvement protocol. Rockville, MD: U.S. Substance Abuse and Mental Health Services Administration.
HHS. 2015. A profile of older Americans: 2015. http://www.aoa.acl.gov/aging_statistics/profile/2015/docs/2015-Profile.pdf (accessed June 6, 2016).
HHS. 2016. New hospitals and health care providers join successful, cutting-edge federal initiative that cuts costs and puts patients at the center of their care. http://www.hhs.gov/about/news/2016/01/11/new-hospitals-and-health-care-providers-join-successful-cutting-edge-federal-initiative.html (accessed April 20, 2016).
House, J. S., K. R. Landis, and D. Umberson. 1988. Social relationships and health. Science 241(4865):540-545.
Iezzoni, L. I. 2011. Eliminating health and health care disparities among the growing population of people with disabilities. Health Affairs (Millwood) 30(10):1947-1954.
IOM (Institute of Medicine). 2003a. The future of the public’s health in the 21st century. Washington, DC: The National Academies Press.
IOM. 2003b. Unequal treatment: Confronting racial and ethnic disparities in health care. Washington, DC: The National Academies Press.
IOM. 2004. Health literacy: A prescription to end confusion. Washington, DC: The National Academies Press.
IOM. 2007. The future of disability in America. Washington, DC: The National Academies Press.
IOM. 2009a. America’s uninsured crisis: Consequences for health and health care. Washington, DC: The National Academies Press.
IOM. 2009b. Race, ethnicity, and language data: Standardization for health care quality improvement. Washington, DC: The National Academies Press.
IOM. 2011. The health of lesbian, gay, bisexual, and transgender people: Building a foundation for better understanding. Washington, DC: The National Academies Press
IOM. 2014. Capturing social and behavioral domains and measures in electronic health records: Phase 2. Washington, DC: The National Academies Press
Kochhar, R., and R. Fry. 2014. Wealth inequality has widened along racial, ethnic lines since end of great recession. Pew Research Center 12.
Krahn, G. L., D. Klein Walker, and R. Correa-De-Araujo. 2015. Persons with disabilities as an unrecognized health disparity population. American Journal of Public Health 105(S2):S198-S206.
Krieger, N. 2000. Refiguring “race”: Epidemiology, racialized biology, and biological expressions of race relations. International Journal of Health Services 30(1):211-216.
Krieger, N., D. R. Williams, and N. E. Moss. 1997. Measuring social class in US public health research: Concepts, methodologies, and guidelines. Annual Review of Public Health 18:341-378.
LaVeist, T. A. 2005. Disentangling race and socioeconomic status: A key to understanding health inequalities. Journal of Urban Health 82(3):iii26-iii34.
Lawson, E. H., R. Carreón, G. Veselovskiy, and J. J. Escarce. 2011. Collection of language data and services provided by health plans. American Journal of Managed Care 17(12):e479-e487.
Lee, J., and H. Kim. 2008. A longitudinal analysis of the impact of health shocks on the wealth of elders. Journal of Population Economics 21(1):217-230.
Liu, H., and D. J. Umberson. 2008. The times they are a changin’: Marital status and health differentials from 1972 to 2003. Journal of Health and Social Behavior 49(3):239-253.
Liu, H., C. Reczek, and D. Brown. 2013. Same-sex cohabitors and health: The role of race-ethnicity, gender, and socioeconomic status. Journal of Health and Social Behavior 54(1):25-45.
Lynch, S. M. 2003. Cohort and life-course patterns in the relationship between education and health: A hierarchical approach. Demography 40(2):309-331.
McNabb, J., D. Timmons, J. Song, and C. Puckett. 2009. Uses of administrative data at the Social Security Administration. Social Security Bulletin 69(1).
MedPAC (Medicare Payment Advisory Commission). 2016. Medicare Advantage program payment system. http://medpac.gov/docs/default-source/payment-basics/medpac_payment_basics_16_ma_final.pdf?sfvrsn=0 (accessed December 1, 2016).
Mills, S. D., V. L. Malcarne, R. S. Fox, and G. R. Sadler. 2014. Psychometric evaluation of the brief acculturation scale for Hispanics. Hispanic Journal of Behavioral Sciences 36(2):164-174.
Moore, J. C., and E. J. Welniak. 2000. Income measurement error in surveys: A review. Journal of Official Statistics 16(4):331.
NASEM (National Academies of Sciences, Engineering, and Medicine). 2016a. Accounting for social risk factors in Medicare payment: Identifying social risk factors. Washington, DC: The National Academies Press.
NASEM. 2016b. Accounting for social risk factors in Medicare payment: Criteria, factors, and methods. Washington, DC: The National Academies Press.
NASEM. 2016c. Accounting for social risk factors in Medicare payment: Data. Washington, DC: The National Academies Press.
National Institute on Aging, National Institutes of Health, and U.S. Department of Health and Human Services. 2007. Growing older in America: The Health and Retirement Study. http://hrsonline.isr.umich.edu/sitedocs/databook/HRS_Text_WEB_Ch3.pdf (accessed September 19, 2016).
Nerenz, D. R., R. Carreon, and G. Veselovskiy. 2013a. Race, ethnicity, and language data collection by health plans: Findings from 2010 AHIPF-RWJF survey. Journal of Health Care for the Poor and Underserved 24(4):1769-1783.
Nerenz, D. R., G. M. Veselovskiy, and R. Carreon. 2013b. Collection of data on race/ethnicity and language proficiency of providers. American Journal of Managed Care 19(12):e408-e414.
ODPHP (Office of Disease Prevention and Health Promotion). 2016a. Disability and health. https://www.healthypeople.gov/2020/topics-objectives/topic/disability-and-health (accessed November 28, 2016).
ODPHP. 2016b. Disparities. https://www.healthypeople.gov/2020/about/foundation-health-measures/Disparities (accessed October 13, 2016).
Oka, M. 2015. Measuring a neighborhood affluence-deprivation continuum in urban settings: Descriptive findings from four US cities. Demographic Research 32(54):1469-1486.
OMB (Office of Management and Budget). 1995. Standards for the classification of federal data on race and ethnicity. https://www.whitehouse.gov/omb/fedreg_race-ethnicity (accessed December 20, 2016).
ONC (Office of the National Coordinator for Health Information Technology). 2014. How to implement EHRs, step 5: Achieve meaningful use. https://www.healthit.gov/providersprofessionals/ehr-implementation-steps/step-5-achieve-meaningful-use (accessed August 4, 2016).
ONC. n.d. CHP participant community: All Chicago making homelessness history. https://www.healthit.gov/sites/default/files/all_chicago_making_homelessness_history-final.pdf (accessed August 15, 2016).
Perez-Stable, E. J. 2016. Sexual and gender minorities formally designated as a health disparity population for research purposes. http://www.nimhd.nih.gov/about/directors-corner/message.html (accessed October 12, 2016).
ResDAC (Research Data Assistance Center). n.d. Health and Retirement Survey—Medicare linked data. https://www.resdac.org/cms-data/files/hrs-medicare (accessed August 4, 2016).
Roblin, D. W. 2013. Validation of a neighborhood SES index in a managed care organization. Medical Care 51(1):e1-e8.
Samson, L. W., K. Finegold, A. Ahmed, M. Jensen, C. E. Filice, and K. E. Joynt. 2016. Examining measures of income and poverty in Medicare administrative data. Medical Care. doi: 10.1097/MLR.0000000000000606.
San Diego Council of Governments. n.d. HCI domains and indicators. http://hci-sandiego.sandag.org/indicators (accessed August 11, 2016).
Shapiro, T., T. Meschede, and S. Osoro. 2013. The roots of the widening racial wealth gap: Explaining the black-white economic divide. Institute on Assets and Social Policy.
SSA (Social Security Administration). 2008. Disability evaluation under Social Security. https://www.ssa.gov/disability/professionals/bluebook/4.00-Cardiovascular-Adult.htm (accessed October 13, 2016).
SSA. 2011. Application for a Social Security card. https://www.ssa.gov/forms/ss-5.pdf (accessed August 8, 2016).
SSA. n.d. Checklist for online Medicare, retirement, and spouses applications. https://www.ssa.gov/hlp/isba/10/isba-checklist.pdf (accessed August 11, 2016).
Tamborini, C. R. 2007. Never-married in old age: Projections and concerns for the near future. Social Security Bulletin 67:25.
Wang, W., and K. C. Parker. 2014. Record share of Americans have never married: As values, economics and gender patterns change. Washington, DC: Pew Research Center, Social & Demographic Trends Project.
WHO (World Health Organization). 2001. International classification of functioning, disability and health. Geneva, Switzerland: World Health Organization.
Williams, D. R. 1997. Race and health: Basic questions, emerging directions. Annals of Epidemiology 7(5):322-333.
Williams, D. R. 1999. Race, socioeconomic status, and health. The added effects of racism and discrimination. Annals of the New York Academy of Sciences 896:173-188.
Williams, D. R., S. A. Mohammed, J. Leavell, and C. Collins. 2010. Race, socioeconomic status, and health: Complexities, ongoing challenges, and research opportunities. Annals of the New York Academy of Sciences 1186:69-101.
Wilson, R. S., K. R. Krueger, S. E. Arnold, J. A. Schneider, J. F. Kelly, L. L. Barnes, Y. Tang, and D. A. Bennett. 2007. Loneliness and risk of Alzheimer’s Disease. Archives of General Psychiatry 64(2):234-240.
Zaslavsky, A. M., J. Z. Ayanian, and L. B. Zaborski. 2012. The validity of race and ethnicity in enrollment data for Medicare beneficiaries. Health Services Research 47(3 Pt 2):1300-1321.


