
6
Data Sources and Tools for Understanding and Addressing Health-Related Transportation Needs
In this session, panelists described a range of data sources, tools, and ongoing activities that could be useful in helping define the transportation-to-health issue, make the case for funding support, and develop patient-centric solutions.1 Chris Barnett, the co-director of the Center for Applied Research and Environmental Systems (CARES) at the University of Missouri at Columbia, described the Community Commons, a website providing access to numerous datasets and tools for mapping, analysis, and reporting. Roy Grant, a public health research consultant who was formerly at the Children’s Health Fund, discussed using data to demonstrate the extent of the problem of lack of transportation and to plan solutions to improve health care access. Marcie Cynamon, the director of the Division of Health Interview Statistics for the National Center for Health Statistics (NCHS) at the Centers for Disease Control and Prevention, provided a brief overview of the National Health Interview Survey. Kelsey Walter, the director of National Core Indicators-Aging and Disabilities (NCI-AD) at the National Association of States United for Aging and Disabilities (NASUAD), described the NCI-AD survey and shared preliminary results relative to transportation and health care. Finally, Karen White, the director of the Office of Statistical and Economic Analysis in the Bureau of Transportation Statistics (BTS) at the U.S. Department of Transportation, highlighted three BTS areas of focus related to health and accessibility: safety, clean air and connectivity, and active transportation.
___________________
1 The many resources and websites shared throughout the workshop are collated in Appendix C.
The presentations were followed by comments from discussants Steve Yaffe, a transit services manager with Arlington Transit; David Riley, the director of the Veterans Transportation Program at the U.S. Department of Veterans Affairs; and Peter McNichol, the chief of quality control for nonemergency medical transportation at the Department of Vermont Health Access. The session was moderated by Catherine Lawson, an associate professor of geography and planning at the State University of New York at Albany, and Paul Hughes-Cromwick, the co-director of the Center for Sustainable Health Spending at the Altarum Institute. (Highlights are presented in Box 6-1.)
COMMUNITY COMMONS
Community Commons is a website supporting dialogue to improve communities and inspire change through group-based discovery, discussion,
and shared resources, grounded in data and analytical tools that can lead to positive change in communities, Barnett said. It is a joint effort among CARES; the University of Missouri, which provides the data and technical support; the nonprofit group IP3, which handles the stewardship, marketing, and user support aspects of the project; and Community Initiatives in Portland, Oregon, which does much of the community-based work and relationships. At the core of Community Commons is a national Web-based geographic information system (GIS). The website provides access to thousands of datasets that are available for mapping (from a variety of mainly public sources) as well as supporting analysis and reporting tools. The available information spans a variety of topics, Barnett said, such as education, environment, food, housing, economics, poverty, health, emergency management, transportation, and demographics.
Barnett shared an example of how one might use Community Commons (see Figure 6-1). By first mapping predominant race/ethnicity by U.S. Census block group using data from the 2010 U.S. Census, one can interact
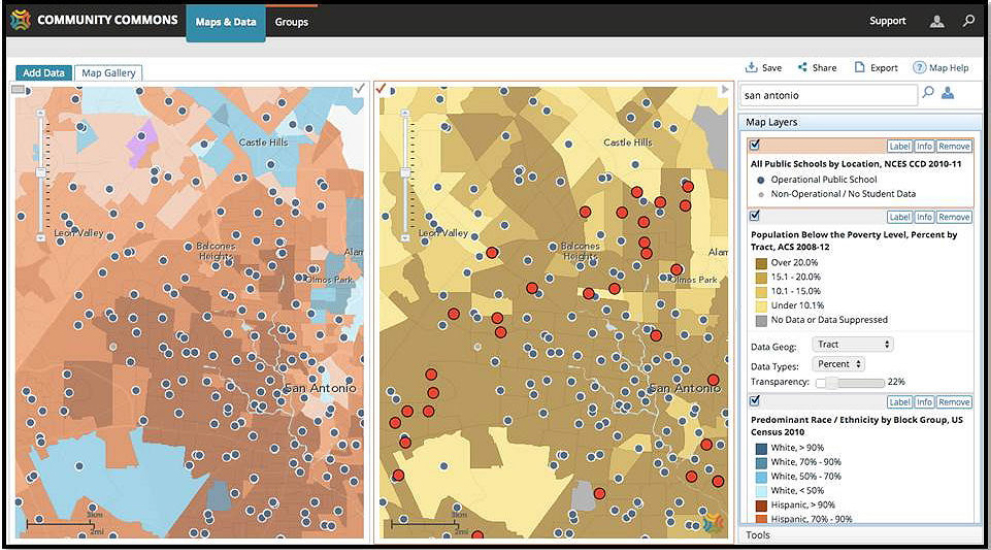
SOURCES: Barnett presentation, June 7, 2016; Public Schools with Poverty and Predominant Race/Ethnicity, San Antonio Area, Texas, USA. Community Commons (2016). Retrieved April 2016, www.communitycommons.org.
with the national map and zoom to a specific city or area. One can then view the spatial distribution of specific characteristics of U.S. Census block groups on the map and access the associated data. Subsets of data can be queried for analysis and used for further exploration and visualization within Community Commons or downloaded for further analysis outside Community Commons. Barnett said that those who register to use the maps and data on the system can save all of the maps they generate to their account and return to them at any time for additional analysis, without having to start again from the beginning with data selection.
Beyond the core data engine and mapping tools, Community Commons provides tools and visualizations that help to provide meaning to data. Barnett highlighted four tools as examples. The Vulnerable Populations Footprint tool uses public data to provide a snapshot of where in the community some of the most vulnerable populations reside by mapping the intersection of poverty and low education. Users can adjust thresholds levels to define areas of greatest concern and create a vulnerable populations demographic report. Another tool is the Location Opportunity Footprint, which maps the intersection of good schools, nearby jobs, and low housing and transportations costs. The tool uses data released by the U.S. Department of Housing and Urban Development (HUD), and the U.S. Environmental Protection Agency, among others. The Community Health Needs Assessment tool is intended to provide a base set of secondary health and demographic data for launching a community health needs assessment. The tool also includes dial charts and maps that provide some state and national context for the results. The last example was the Local Food Market Report, which is designed to encourage and support local food producers.
Collaboration Hubs
One of the more powerful aspects of Community Commons, Barnett said, is the ability for users to participate in a collaboration hub, moving beyond the data into carrying on “the conversation among partners working to improve communities.” Within a hub, a group can upload and share data, maps, reports strategies, best practices, and presentations and tell its stories to help get the organization’s point across. Hubs can interact with other hubs and foster conversations across different platforms and groups within Community Commons. Some groups, he said, also embed information from Community Commons on their own websites to leverage the power of Community Commons within their own area. Barnett encouraged participants to visit the website to learn more.2
___________________
2 See http://www.communitycommons.org (accessed August 4, 2016).
HEALTH TRANSPORTATION SHORTAGE INDEX
Speaking from his experience at the Children’s Health Fund, Grant described using data to demonstrate the extent of the problem of lack of transportation and to plan solutions to improve health care access. A series of national surveys made it clear that there are areas of the country (e.g., areas of high poverty, rural areas) that are much more affected by lack of transportation than other areas. Targeted data collection (in 2006 and 2010, before passage of the Patient Protection and Affordable Care Act) showed that 39 percent of U.S. residents did not have public transportation available in their community, 11 percent of households did not own a working vehicle, and only 42 percent of those with public transportation in their community reported it could be used to get to a heath care site (ranging from 14 percent in rural areas to 69 percent in major cities). Automobile ownership did not vary significantly across the range from big cities through suburban, small town, and rural areas, while access to public transit declined steeply from big cities to less densely populated areas.
The Children’s Health Fund was interested in missed pediatric appointments, and surveys found that 4 percent of U.S. children had missed a health care appointment within the preceding 12 months because transportation was not available. This rose to 9 percent in households with incomes less than $50,000. Thirty-one percent reported seeking care in the emergency department (ED) later for the condition associated with the missed appointment. Applying U.S. Census data to this observation, Grant implies that there are 1 million potentially preventable pediatric ED visits annually.
Those data were used to develop an index to target areas at high risk for transportation-related access barriers, Grant said. The Health Transportation Shortage Index (HTSI, see Figure 6-2) is a validated tool for health planning that assesses factors associated with transit barriers to primary care access and generates a point score from 0 to 14.3 A score of greater than 7 indicates high risk, he said. The factors assessed include rural/metro status, poverty rate (proxy for the likelihood of not owning a vehicle), health professional shortages, safety net health clinics, and public transportation resources. Grant noted that one criterion for the selection of the data was that the data be readily available and not difficult to obtain, which led to such decisions as using the poverty rate of an area instead of car ownership data.
GIS software was then used to map by longitude and latitude the safety clinics in each county in a given state (i.e., federally qualified health centers, rural health clinics, safety net hospitals, and local health department
___________________
3 For further information, see http://www.childrenshealthfund.org/sites/default/files/HealthTransportation-Shortage-Index-HTSI.pdf (accessed August 4, 2016).
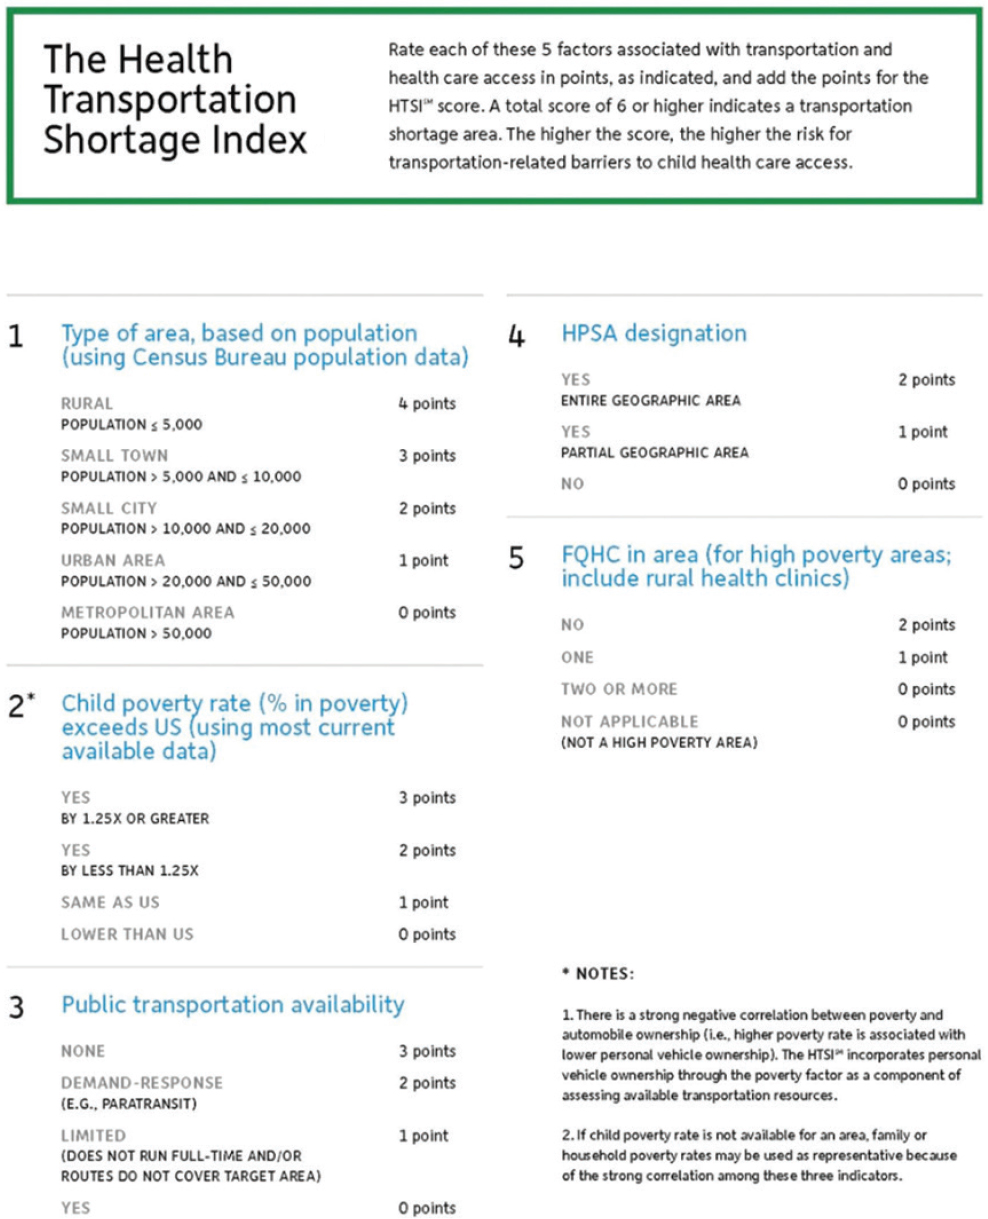
NOTE: FQHC = federally qualified health center; HPSA = health professional shortage area; HTSI = Health Transportation Shortage Index.
SOURCES: Grant presentation, June 7, 2016; Children’s Health Fund, 2012. Used with permission.
clinics). Population was mapped by U.S. Census block, and straight-line distance was calculated from the population-weighted center to the nearest clinic. An example from Tennessee shared by Grant showed how clinics were well located relative to population centers. Fifty-two percent of counties in Tennessee were identified as high-risk for transportation barriers to health care access; these were generally rural and with higher poverty. Grant said that there was considerable overlap between these counties and areas with shortages of health professionals.
With regard to transportation resources, all high-risk counties in Tennessee had public transit, and 80 percent had paratransit services. The distance to clinics did not differ between high-risk counties and other counties. Furthermore, the straight-line distance to a clinic for residents in most high-risk, high-poverty counties was found to be less than 10 miles. In other words, the majority of the population could be accommodated with vehicular transportation within a 10-mile radius of a safety net clinic, which did not sound like an insurmountable problem, Grant said. Many patients were located within 5 miles of a clinic. A literature search was done of effective strategies to leverage paratransit resources to improve health care access, and several models with proven track records were identified. These included modifying paratransit services to include scheduled stops linking health care sites with population centers, developing contracts between county or state governments and paratransit providers specifically for health care access, and using existing paratransit services to strengthen Medicaid nonemergency medical transportation.
NATIONAL HEALTH INTERVIEW SURVEY
The mission of NCHS, Cynamon said, is to collect objective, nonpartisan, high-quality data on a broad array of health topics to inform the public, Congress, the White House, and others who are interested in health data. It is 1 of 13 federal agencies that have statistics as their core mission. NCHS houses the Vital Registration Statistics System and runs national health surveys. Cynamon provided a brief overview of the National Health Interview Survey. The survey has been continuously in the field since 1957, she said, and its data collection is done by U.S. Census Bureau interviewers in the homes of the non-institutionalized civilian population. Every year confidential interviews are conducted in 35,000 to 45,000 households. The broad mandate of the survey is to collect data on morbidity and mortality, health risk behaviors and protective factors, actions people take to improve their health, how people access health care, barriers to care, what services people utilize, why people do not utilize health care, and health insurance coverage in the United States. The goal is to develop a general sense of the health of the U.S. population. Cynamon said that the results
from the survey are linked to other federal records (e.g., HUD data on Section 8 housing, health data from the Centers for Medicare & Medicaid Services, National Death Index data, data from the Medical Expenditures Panel Survey, and Area Health Resources Files from the Health Resources and Services Administration of the U.S. Department of Health and Human Services [HHS]).
Since 1997, Cynamon said, the survey has included one question on whether problems with transportation delayed getting needed medical care, and the number who answered yes has hovered around 2 percent annually for the past two decades. This is just one question, she said, and it does not provide a very accurate reflection of the complex issues related to transportation and accessing care. But, she suggested, combined with data on mobility impairments, cognitive impairments, and other types of disability and limitations of activity, the survey data could be used to obtain a more detailed picture of the types of assistance needed.
The survey questionnaire is currently being redesigned, and the revised version will be introduced in 2018. The health system has changed dramatically since 1997, but the questionnaire has remained fairly stable, Cynamon said. In addition, the length of the interview has increased over time to about an hour and a half, which can be burdensome for some respondents, she said. In determining how to refocus the questionnaire, NCHS is reaching out to the survey user community, which she noted is not just Congress, the White House, and HHS. There are thousands of users across the country, in academia, community health, state health, and elsewhere who use the data for reports, grant applications, program evaluations, and a vast array of other purposes. Examining barriers to care is an important question for the revised survey. Now that insurance coverage is more accessible, what else is preventing people from getting the care they need? Cynamon encouraged participants to visit the National Health Interview Survey webpage, view the information on the 2018 redesign, and provide input, particularly on any aspects of transportation for which data at the national and state levels would be useful.4
NATIONAL CORE INDICATORS-AGING AND DISABILITIES
NASUAD is the membership organization for state agencies working on aging and disability services, Walter said. In 2015, NASUAD launched the NCI-AD initiative in partnership with the Human Services Research Institute. NCI-AD is a quality-of-life survey of older adults and adults with physical disabilities. Walter said that NCI-AD grew out of the National Core Indicators Survey, which is focused on adults with intellectual and
___________________
4 See https://www.cdc.gov/nchs/nhis/2018_quest_redesign.htm (accessed August 4, 2016).
developmental disabilities. NCI-AD focuses on how individuals are being served by their states’ long-term services and supports systems, including skilled nursing facilities, Medicaid waivers, Medicaid state plans, managed long-term services and supports populations, state-funded programs, and Older Americans Act programs.
NCI-AD Survey
The NCI-AD survey gathers information through face-to-face interviews with consumers who are receiving services (or a proxy, if identified). The process includes a pre-survey used to set up the interviews, the collection of background information on demographics and personal characteristics (from state agency administration records and/or the consumer), and interviewer feedback on the survey experience. The consumer survey consists of 89 questions, including both subjective, satisfaction-related questions that can only be answered by the consumer and objective questions that can be answered by the consumer or, if needed, the proxy.
The survey covers a broad range of measures of quality of life that states are interested in, including community participation, choice and decision making about the types of services individuals are receiving, relationships, satisfaction, service care and coordination, access, self-direction of care, work and employment, rights and respect, health care, medications, safety and wellness, everyday living and affordability, planning for future, and control. Thirteen states participated in the first survey in 2015–2016 (survey period June 1–May 31), Walters said, and more are slated to participate in 2016–2017. She shared some of the mid-year results from six states5 that committed to a shortened data collection period—specifically, the findings related to transportation and health care.
Mid-Year Results 2015–2016
The types of area that individuals were living in spanned metropolitan, micropolitan, rural, and small town. The majority lived in their own home or in a family home. Eighty-eight percent of the people surveyed (averaged across six states) reported needing help with everyday activities (e.g., grocery shopping, housecleaning), and 71 percent reported needing help with self-care (e.g., bathing, eating, using the bathroom, getting in and out of bed). An average of 62 percent reported being able to do things outside the home when, and with whom, they wanted to. Those who replied that they were not able to do such things were asked why, and transportation
___________________
5 Colorado, Georgia, Maine, Mississippi, New Jersey, North Carolina.
was one of the most common reasons cited for people not being able to get outside of their homes, Walters reported.
When asked specifically about transportation to get to medical appointments, an average of 91 percent of individuals reported that they did have transportation. Walters said that because these are people being served by Medicaid or state programming, transportation is often included in the health care services they are receiving. Fewer individuals (an average of 71 percent) reported having transportation when they wanted to do other things outside of the home (e.g., social activities, religious services). Walters said that the ability to be active outside of the home is part of the larger context of health. An average of 37 percent of respondents reported having a regular dental visit within the past year, and 62 percent reported having had a vision exam within the same period. In response to a question on the subject of overall wellness, an average of 16 percent reported being “in poor health.”
States design their own survey samples, Walter said, and they can assess the data by regional level or by specific population (such as the managed care populations, which can be further subgrouped by managed care organization). The intent is to have data that are useful at the local level that can also be included in the NCI-AD national report. Walter referred participants to the NCI-AD website for the 2015–2016 Six State Mid-Year Report and for information on participating.6
BUREAU OF TRANSPORTATION STATISTICS
Like NCHS, BTS is 1 of the 13 federal agencies that have statistics as their core mission. BTS was created to administer the collection, analysis, and reporting of transportation data and to ensure the most cost-effective use of resources to monitor transportation’s contributions to the economy, and transportation’s implications (e.g., safety, environment). It is a policy-neutral, objective broker of information and is afforded some special abilities to protect the confidentiality of the information it collects. White spoke about three BTS areas of focus related to health and accessibility: safety, clean air, and connectivity and active transportation.
Safety: Close Calls/Near Miss Data Program
Confidential close-call reporting allows people who see a close-call incident in the transit environment to report it anonymously. All of the information provided is protected from the Freedom of Information Act, White said. A close call is an event that does not rise to the level of an Occu-
___________________
6 See http://nci-ad.org (accessed August 4, 2016).
pational Safety and Health Administration incident and does not result in an injury, but which a worker considers to be dangerous.
As an example, White mentioned the close-call reporting program that allows employees of the Washington Metropolitan Area Transit Authority (WMATA) to report close calls that WMATA and the two transit workers unions would not otherwise know about. Through this program, BTS has received 349 close call reports and developed 55 preventive safety actions (e.g., concave and convex mirrors, better signage). BTS analyzes data and reports trends and patterns back to WMATA, and WMATA uses that information to implement suggested preventative safety measures.
Clean Air: National Transportation Atlas Database
The National Transportation Atlas Database is a collection of geospatial databases that depict transportation networks; flows of people, goods, vehicles, and craft over the transportation networks; and social, economic, and environmental conditions that affect or are affected by the transportation networks.7 The atlas is also capable of supporting intermodal network analysis. White noted that while the atlas includes details on what is moving, it does not collect data on why a vehicle took a trip. She highlighted some data items in the atlas that might be of interest to health and transportation including, for example, infrastructure locations, border crossings, passenger facilities, non-attainment areas, the Fatality Analysis Reporting System, hazmat information, and parks.
White observed that “medical tourism” was an aspect of transportation to health care that had not to that point been discussed at the workshop. In the increasingly connected world, more people are traveling far beyond the local environment for care, she said.
Connectivity and Active Transportation
There are several databases on connectivity and active transport that are relevant to transportation access to health care.8 The Intermodal Passenger Connectivity Database includes information that allows passengers to find connections from one mode of transport to another in order to complete a trip. It provides geographic coordinates of rail, airport, ferry, and bus terminals. BTS is now working with Federal Transit Administration
___________________
7 See http://www.rita.dot.gov/bts/sites/rita.dot.gov.bts/files/publications/national_transportation_atlas_database/index.html (accessed August 4, 2016).
8 See the BTS Intermodal Transportation Database, available at http://www.rita.dot.gov/bts/data_and_statistics/intermodal_transportation_database.html (accessed August 4, 2016).
(FTA), through the National Transit Database, to collect stop locations and frequency for intra-city bus transit.
The National Household Travel Survey, conducted by BTS and the Federal Highway Administration, gathers trip-related data such as the mode of transportation and the duration, distance, and purpose of a trip. It also gathers demographic, geographic, and economic data. Questions on trip purpose include whether the trip was for a medical or dental appointment, whether a medical condition limits the person’s travel, and the length of time the person has had the medical condition. Data are also used to find walkable and bikeable trips.
BTS also gathers airline industry data, including passengers enplaned on U.S. carrier scheduled domestic and international service and on foreign carrier scheduled international service from the United States.
DISCUSSION
The main topics of discussion following the presentations included the challenges of predicting demand for transportation services, issues around demonstrating the impact of transportation on health outcomes, and linking data from major national surveys.
Predicting and Measuring Demand
Yaffe raised a concern that the predictive models used to anticipate future Americans with Disabilities Act paratransit-eligible ridership are overly based on overall U.S. Census figures. There is a need to do market segmentation, he suggested, not only to provide a more accurate predictor of demand for paratransit, but also to understand who will need rides to treatments. Grant mentioned a federally funded program involving comprehensive screening to identify those in need of enabling services to get to health care. Although transportation is a service included in the screening, there is a prohibition against using any of the funding to increase the availability of transportation, he said. This is a vehicle-owning country, he said, and the availability of public transit resources in some counties and communities is very limited. There is also a stigma about using public transit. Not only is it important to predict where the needs will be, Grant added, but it is also critical to strengthen infrastructure to meet those needs and to improve public transit availability and usability. This will require reconsidering how funding is allocated, he said. Barnett said that the tools available on Community Commons—and on GISs in general—can sort through a variety of data sources to help identify subpopulations and, for example, display that information in relationship to transportation nodes
or the availability of transportation. He suggested that GIS could also be used to identify the congressional district where the need exists (i.e., for advocacy purposes).
McNichol said that Vermont uses predictive modeling and data for a statewide care coordination program that is run through Vermont Medicaid. Although the program is constantly doing its best to get people rides, it is very limited in what it can do with the amount of funding it gets. Currently, the two biggest users of transportation resources are people traveling to adult day services and people going to opioid treatment centers, both in state and across state lines. McNichol added that some people have had issues with personal safety on buses to programs (e.g., assaults). Predictive modeling does not necessarily identify or help to alleviate these growing problems. Yaffe observed that lack of transportation is an issue for a variety of conditions that lead to complications in the absence of treatment (e.g., untreated hypertension or untreated diabetes can lead to kidney failure and potential need for dialysis). There is a need to better understand why patients need to get to the doctor. Lawson and White emphasized that the National Household Travel Survey website has a variety of tools for analysis and the ability to deal with multiple variables.9
Demonstrating the Value of Transportation to Health-Related Destinations
Riley highlighted the challenges of making the business case for transportation to health-related destinations to the leadership of the U.S. Department of Veterans Affairs and also spoke about the need for metrics. He noted that it is not possible to show that a veteran would not have gotten to a care provider without the provided transportation service. When patients do not make it to their appointment, there might be clinical resources already dedicated to that appointment that go to waste. When patients do not have enabling services that allow them to remain in their homes and be independent, they must often move to a higher level of care (e.g., a nursing home), which can be very expensive. Can a return on investment be shown in terms of reductions in the waste of clinical resources or in the time lost by clinicians or in terms of eliminating the need for costly higher level care?
White commented on the challenges of measuring accessibility. BTS has been looking at matching across administrative data as a measure of accessibility at the U.S. Census tract level, she said. For example, BTS has been matching data from the U.S. Department of Agriculture on food deserts
___________________
9 See http://nhts.ornl.gov (accessed August 4, 2016).
with data on transportation accessibility in order to better understand how people are eating and getting food in areas that are not well served by a grocery store with fresh fruits and vegetables. BTS is considering a similar analysis on the availability of different tiers of health care. She added that some areas accessible by car have other challenges, such as parking issues.
Grant highlighted the need to develop standardized definitions for assessing data across agencies and sectors. For example, there are many different definitions of terms such as “rural” and boundaries of a specific “community.” “Uninsured” is defined differently in different federal household surveys (e.g., a gap in continuity of coverage during a 12-month period, uninsured continuously for 12 months, etc.). The lack of standardized terminology makes getting straight answers to simple questions very difficult, he said.
Stacey Elmer from Kaiser in Southern California suggested that the way to test whether providing transportation improves health outcomes is to use pilot programs. As an example, she described the Kaiser Community Paramedicine pilot program, in which paramedics and nurse practitioners proactively address the needs of frequent ED utilizers in the home in an effort to prevent them from returning to the ED. One of the findings was that some patients were not going to their follow-up appointments with their primary care providers after a home visit by paramedics, even if the appointment had been scheduled for them. Kaiser has now funded a “pilot within the pilot,” with a control group and a research group, to study whether the use of vouchers for taxis will encourage patients to go to their appointments. Grant remarked that Kaiser is well suited for conducting such pilot studies because it has access to a vast amount of patient-level data over time within its system. With baseline data for individual patients, a transportation intervention can be introduced, use monitored, and outcomes assessed.
Noting that the paramedicine pilot is a very small study, Elmer asked about federal grant opportunities to fund a larger study to explore whether providing transportation does improve health outcomes. Yaffee suggested approaching the local metropolitan planning organization and becoming involved in its FTA Section 5310 process. Stock reiterated that FTA has demonstration grants, and has 5 years’ worth of funding in the Fixing America’s Surface Transportation (FAST) Act for competitive programs, including the types of demonstrations being discussed. Vince Valdes, the associate administrator for research, demonstration, and innovation at FTA, mentioned the Mobility on Demand Sandbox, with $8 million to
be awarded for mobility-on-demand public transportation demonstration projects.10
Marsha Regenstein, a professor of health policy at George Washington University, pointed out that one out of every six dollars spent in the United States is spent on goods and services associated with health care. Whether for-profit, nonprofit, or public, health care providers design services around their businesses, she continued. She cautioned against assuming that all health care providers actually want the people in their communities to come to their locations. Many health care systems have moved away from inner cities and other areas with large need because the desired populations are elsewhere, she observed. These desired populations are where the money is.
Moderator Hughes-Cromwick reminded participants of the examples presented earlier by Kell and others (see Chapter 4) on making a compelling case for a cost-effective return on transportation projects.
Bridging Across Surveys
There was discussion among participants, including White, Cynamon, and Janet Lynott of the AARP Public Policy Institute, of the potential value of linking the National Household Travel Survey and the National Health Interview Survey and potentially others as well. Cynamon said that the new core questionnaire for the National Health Interview Survey will be about 40 minutes long and that other agencies have the opportunity to add questions that can change from year to year (for a fee, no more than 5 minutes on a particular topic, about 20 minutes total of additional questions). Ed Christopher, an independent consultant, agreed and suggested that one way to enhance the large national surveys discussed would be to add context from other surveys. For example, in the past the National Household Travel Survey has added land use characteristics to records without making the survey questionnaire longer. If agencies could link or cross-tag their major surveys, it could provide rich information, he said. White cautioned that matching across data is not necessarily easy to do. For example, the U.S. Postal Service has a master registry of addresses that is not available to other statistical agencies. It may be possible to know the address of someone who has completed the National Household Travel Survey, but there could be a different person at the same address who completed the National Health Interview Survey. Cynamon responded that it would not have to be a direct match to the same household. Grant suggested using some type of common geographic identifier for linkage that is above the individual level,
___________________
10 Applications closed on July 5, 2016. See https://www.transit.dot.gov/research-innovation/mobility-demand-mod-sandbox-program.html (accessed August 4, 2016).
such as the county level. This could allow the user to aggregate data around a common point across different surveys.
Engaging Safety Net Hospitals
A participant from America’s Essential Hospitals said that safety net hospitals deal with these issues on a day-to-day basis and are recognizing the excessive costs in ED visits. They are also recognizing the problem that a lack of transportation poses in large population health management. She encouraged participants to reach out to the safety net hospitals in their areas as partners in addressing transportation issues.


