
2
Assessing Innovation Measurement
The workshop steering committee organized much of the content of the first day of the workshop to respond to the following set of overarching questions:
- Which aspects of the innovation processes are not well covered in current statistics and are increasing in importance?
- Among things that are currently not measured but could be, what are the top priorities? Where can funding for measurement be most productively directed?
- For what aspects of innovation measurement might conventional surveys not comprise the optimal data collection strategy? Where might administrative or big data become more prominent in meeting demand for new metrics?
- What is the path forward for measuring innovation (a difficult measurement process) in the case of public goods and social progress (difficult to measure, largely nonmarket outcomes)?
The steering committee believed that addressing these questions requires first assessing the adequacy of current measures of innovation (the topic of Session 2 of the workshop). The longstanding measurement paradigm in this field emphasizes collecting data on inputs and expenditures (e.g., investment in research and development [R&D]). While this emphasis is driven largely by feasibility constraints, it means that the impact of innovation on economic outputs and other outcomes is only
captured in a partial way at best. It may also lead to excessive attribution of returns to R&D (if complementary activities tend to correlate with R&D). This measurement gap has led for calls to collect new kinds of data and create new metrics (see, e.g., National Research Council, 2014).
In this session, participants were asked to identify aspects of the innovation process and its impacts that are measured well and aspects that are being measured incorrectly, incompletely, or not at all. Such assessment encompasses inputs to innovation (R&D and other), outputs and outcomes of innovation (such as economic growth or a better functioning society), and the utility of metrics to stakeholders ranging from government to researchers to businesses themselves. This discussion was intended to help the National Center for Science and Engineering Statistics (NCSES) assess the adequacy of current data collection programs and what additional kinds of information should be pursued.
THE PURPOSE OF INDICATOR FRAMEWORKS AND UNDERMEASURED ASPECTS OF INNOVATION
Bronwyn Hall (University of California, Berkeley) began the session by reviewing desirable characteristics of innovation indicators in the context of how they are used for policy and other purposes; she also commented on existing data gaps. Drawing from Hall and Jaffe (2012), she pointed out that one important use of current indicators is for benchmarking. Since it is difficult to measure returns to innovation activities, organizations set goals of how to spend on a range of activities by benchmarking and carrying out performance assessments based on changes in these benchmarks. This need requires data that are comparable across space and over time. Innovation indicators are also used for public policy questions, private-sector decisions, and academic research; for the latter, microlevel information and data matched to other sources (an area for which there has been recent progress) are desirable.
Hall pointed out that, until now, the dominant data collection methodology has been surveys—for example, asking companies how much they spend on research, or asking individuals about their education and career paths. However, due to falling survey response rates and increasing costs, there is a growing sense that some data might be better collected using administrative and other passive methodologies that utilize data created as a matter of course for operational or other (nonresearch) purposes. One example is accounting data maintained by firms that are sometimes available publicly. The patent system also generates passive data, and, again, these are public sources. One advantage of passive data, Hall said, is that if they are generated during the course of other activities, they lend themselves less to gaming by respondents. She said a key issue
to be addressed in using passively collected data to complement survey data is quality, which is important for web scraping and other emerging methods. As noted in Hall and Jaffe (2012), for passive methods, “it may be much harder to assess reliability, precisely because the relationship between the captured data and the universe of underlying activity is not known” (p. 8). An additional issue to be addressed by statistical agencies, and which will systematically differ between survey and nonsurvey data and between publicly and privately generated data, is accessibility—an issue considered at various points throughout the workshop.
One approach used for measuring innovative activities is the growth accounting framework, Hall explained. This framework is used for measuring R&D, which is only a subset of innovative activities in the National Income and Product Accounts (NIPAs). The difference between the growth accounting exercise done for the NIPAs and what microeconometricians do is that the former is basically an input cost approach. Normal rates of return are assumed, which may not be wholly appropriate for intangible inputs like R&D, and, from a welfare perspective, the value of unpriced output is omitted. Additionally, the aggregate accounting approach is something of a black box that obscures the functional relationships underlying the system. In contrast, she noted, researchers use the microeconometric approach to try to find out how much innovative activities contribute to the value of output (whereas the growth accounting version assumes that the value of the contribution is equal to what is spent on it). For many questions, it is the value of the output of innovative activity that is most ideal to measure.
Having more and better indicators creates opportunities to examine variables in models of innovation as well as feedback mechanisms that exist, such as the influence of ideas coming from users back to firms. The impacts of basic science discoveries that emerge from applied research are also important, but predicting the flow of information in this way is extremely difficult. Hall and Jaffe (2012) concluded that, at least for the United States, indicators of resource flows—inputs to innovation—are fairly well covered, but that flows within government, industry, academic, and household sectors are less well measured. And non-R&D inputs are typically not measured at all, at least in the United States.1 This gap means that measures of innovation expenditures could be off by orders of magnitude if the goal is to measure all innovation. Human capital formation and knowledge output is measured fairly well, but the proxies that they provide are distant from the underlying concept of interest to researchers and policy makers. For example, counts of papers, degrees, and patents
___________________
1European Union member states have had programs to measure expenditure on non-R&D innovation activities.
are available, but the success or impact of them (e.g., the value of outputs linked to them) is less well measured.
Hall concluded that to address gaps in data coverage, improving the ability to link sources, to generate timely data, and to produce information on capital for financing innovation (much of which is privately held) should be top priorities for the statistical agencies.
Ben Martin (University of Sussex) identified the challenge for innovation measurement, which is to lessen the danger that it fails to keep up with the changing world and the changing nature of innovation. NCSES, other statistical offices, and the OECD play an important role in providing the empirical infrastructure for the field of science, technology, and innovation policy studies. The national and international research system—in which government actors, university researchers, and the private sector all play a part—must work together to meet this challenge.
Martin highlighted one area for which innovative activities go largely unmeasured: the knowledge economy. While encouraged by emerging opportunities created by new kinds of data, Martin pointed to a number of challenges. Increasingly, the problems of interest, such as growing competition and increasing complexity of productive processes, which put a growing premium on innovation, science, and technology, are global rather than national or regional. Innovation takes place in a vast range of sectors (not just in manufacturing, as was often implicitly assumed until the 1990s) and in different kinds of organizations (not just firms, again as was often assumed in the past). Additionally, he said, innovation is not just technological; for example, it may be process oriented.
The rapidly changing environment motivated one central question addressed by many presenters during the workshop: Are current innovation indicators adequate? Citing Hall and Jaffe (2012), Martin prefaced his answer by noting that all indicators are partial. Especially in the world of social science and policy, indicators only capture certain aspects of a phenomenon or its characteristics, and then only to a limited extent. Sometimes, he noted, caveats are forgotten, assuming, for example, that patents measure innovation, which they do not. This approximation ignores the subtle distinction between innovation and invention, as well as the fact that patents are only used in certain sectors for certain technologies and for certain types of innovations.
Martin noted, for a given indicator, conceptual clarity is needed about what aspects of innovation are being captured and what aspects are being neglected. For example, bibliometric indicators relate to only one form of scientific output: publishing. But a whole range of other outputs from research may be equally important, such as commercial applications. Likewise, citations relate to impact on academic peers rather than to qual-
ity or outcomes that affect the balance sheets of firms or the well-being of individuals.
Martin next observed that every indicator is based on assumptions, many of which are implicit and rarely subject to critical scrutiny. The validity of these assumptions varies with circumstances and over time. For these reasons, he characterized statistics and indicators as more of an art than a science. Reiterating a point made by Hall, he noted that outdated measures are often maintained due to the appeal to researchers of consistent time series. When NCSES redesigned its R&D survey in the early 1990s to send to a much larger group of firms, the change required extra work to interpret trends spanning the pre- and post-change periods. However, dogmatically sticking with an outdated approach can be counterproductive when the nature of phenomena of interest changes (e.g., the types of individuals or organizations innovating) or the relevant population changes (e.g., a shift to embrace services as well as manufacturing firms). Sometimes, Martin asserted, maintaining a long time series comes at a cost in terms of growing distance from reality.
To the extent that innovation is conceptualized, defined, and measured in a way that reflects conditions when the field of innovation studies was being established—when most innovation was assumed to be technology-based and conducted by private-sector firms in the manufacturing sector, especially in high tech—today’s indicators are failing to keep up with the changing world. In the 1960s, 1970s, and 1980s, technological innovation may have been better captured by indicators such as those for R&D spending (although R&D has never been a satisfactory proxy for all innovation), numbers of qualified scientists and engineers, patents, and so on. But now a huge amount of innovative activity takes place that is not technological, not based on R&D, not reflected in patents, and not in the manufacturing sector. Citing one example, Martin observed that the innovations that most impacted people’s lives in the first decade of this century were financial—mortgage-backed securities, collateralized debt obligations, credit default swaps, and the like. Neither these innovations nor their negative outcomes were captured by conventional indicators and, as a result, they were not investigated by the innovation studies community.
Martin stressed that a lot of innovative activity is largely invisible through the lens of current measures. Here, he drew an analogy with cosmology, and the fact that about 95 percent of the universe is invisible with current measuring techniques (telescopes). It takes the form of dark matter or dark energy. For this reason, he adopted the term “dark innovation,” that which is invisible with current metrics. In addition, unmeasured innovation may be taking place disproportionately in places, such as China, Latin America, and Vietnam that are producing a large percent-
age of goods consumed worldwide. Much of this innovation is not being captured in any official statistics, which further distorts our perception of what is happening.
During open discussion, Scott Stern called for more evidence to assess whether the rate of dark innovation had been changing in recent years. If it has been increasing, that means that the measurement system has become more partial or grown more outdated. As noted above, the original measurement system for innovation, when set up, was perhaps well designed for the phenomena at that time. But since the phenomena have changed, Stern said evidence is needed regarding the extent of dark innovation, and there are currently little hard data on which to study this question.
Pointing to the challenges now being faced, Martin identified the need to conceptualize, define, and devise methods for measuring dark innovation. Some solutions may be facilitated by opportunities created in an era of big data. He warned, however, about several dangers. The first of these is characterized by the metaphor of a person looking for his keys under a lamppost. A temptation of indicator producers will be to focus on phenomenon and characteristics where the light is, which could lead to the neglect of less easily measured or indeed nonmeasurable aspects, even if they are equally or more important. This methodological tendency is also linked to the McNamara Fallacy: making the measurable important rather than attempting to make the important measurable.2
A second danger identified by Martin is Goodhart’s Law, which states when a variable is adopted as a policy target, it rapidly loses its ability to capture the phenomenon or characteristics supposedly being measured.3 In this context, once an indicator is adopted as part of policy, it leads to changes in behavior—specifically, game playing may take place in response to perverse incentives, thereby creating unintended consequences. As an example, Martin cited the British minister for science talking about the number of spinoffs from universities. When he started talking about it, there were 70 spinoffs a year; the next year, the number grew to 200. Clearly the universities had not become three times better at this activity: they had just become better at playing the game.
The third danger facing innovation measurement according to Martin has to do with costs and benefits. Indicator development entails setting indicators up and regularly updating them. In some cases, the costs,
___________________
2Named after Robert McNamara, U.S. Secretary of Defense, 1961 to 1968; first coined by Daniel Yankelovich in 1972.
3Named after Charles Goodhart, a former advisor to the Bank of England and emeritus professor at the London School of Economics, who first gave expression to Goodhart’s Law in 1975.
which may include distortions created by gaming the system, may come to exceed the benefits. Martin sees this as possibly being the case in the application of bibliometric indicators, where individuals aiming to score in this system have incentives that may lead to higher incidence of research misconduct.
Martin concluded that in a knowledge-intensive society, innovation becomes even more important than it has been in the past, but it takes on a growing variety of forms and geographic characteristics. Conventionally accepted indicators reflect primary forms of innovation of previous decades, which has left much current innovative activity invisible or dark. Thus, new indicators are needed. But, in an era of easily available big data, the temptation to search only “under the lamppost” must be resisted. Martin urged continuing awareness of the McNamara Fallacy and of subsequent game-playing and unintended consequences, and, above all, that the benefits of indicator systems must be greater than their costs.
INTERNATIONAL INDICATOR STANDARDS—THE OSLO MANUAL AND THE COMMUNITY INNOVATION SURVEY
Fred Gault (United Nations University–Maastricht Economic and Social Research Institute on Innovation and Technology) spoke to a range of issues: developing new indicators to capture the changing nature of innovation; policy and other uses of innovation data and indicators; and international comparisons. His approach to the challenge posed by the workshop—to identify questions that cannot now be answered but could be with additional data that have a reasonable chance of being collected—was to compare what can be done within the existing definition of innovation in the Oslo Manual with what could be done if changes were made to the definition and new data sources were then developed.4 The current definition in the Oslo Manual is as follows:
An innovation is the implementation of a new or significantly improved product (good or service), or process, a new marketing method, or a new organisational method in business practices, workplace organisation or external relations (OECD-Eurostat, 2005, para 146).
Further:
A common feature of an innovation is that it must have been implemented.
___________________
4For background material and references underlying Gault’s arguments, see Gault (2016). The Oslo Manual: Guidelines for Collecting and Interpreting Innovation Data (3rd ed., 2005). Available: http://www.oecd.org/sti/inno/oslomanualguidelinesforcollectingandinterpretinginnovationdata3rdedition.htm [August 2016].
A new or improved product is implemented when it is introduced on the market. New processes, marketing methods, or organizational methods are implemented when they are brought into actual use in the firm’s operations (OECD-Eurostat, 2005, para 150).
The new or improved product does not have to make money to be an innovation—it just has to be put on the market. And similarly, new processes, marketing methods, and other changes are implemented when they are brought into actual use in firms’ operations.
Gault echoed comments by Hall and Martin that the world in which innovation occurs (and is measured) has changed enormously over the years. About one-half of the economy consisted of manufacturing or services related to the distribution and sale of goods (wholesale and retail trade, transportation, and warehousing) in 1947 when the Bureau of Economic Analysis Gross Domestic Product (GDP) series began. Today, he said, service industry innovations in sectors, such as financial services, health care, computing services, and others dominate in a similar fashion and have transformed people’s lives (though not always for the better, as the 2008 financial crisis made clear). In addition to the economy itself changing, the classification of industry for statistical purposes, as reflected in the North American Industry Classification System, has likewise changed.
The Oslo Manual was first published in 1992 and drew on about 20 years of experimental surveys from Canada, Germany, Italy, the Nordic countries, and the United States. The Manual was initially concerned with only manufacturing and technological innovation. In the second edition, published in 1997, coverage expanded to cover private-sector services, but the emphasis remained on technological product and process innovation. Published in 2005, the third edition recognized nontechnological forms of innovation, especially organizational, managerial, and marketing, for the first time. Problems identified by Gault include that types of innovation are not exclusive. Not infrequently, product innovation involves process innovation, organizational change, and marketing. An innovation can also be distributed across a range of activities, which overlap. A systems approach has been creeping gradually into the Manual, which is essential for understanding a complex system. The idea is to better measure linkages and feedback of different kinds of innovation. Some of these ideas will appear in the forthcoming revision to be issued in 2017.
The Community Innovation Survey (CIS)—a series of harmonized surveys based on the Oslo Manual and fielded by national statistical offices throughout the European Union—provides data on sources of informa-
tion for innovation and on collaboration for innovation.5 One thing that is missing, Gault pointed out, are data on sources of prototypes, such as a whitewater kayaker modifying a kayak in a way that feeds back into future design. Data could also be considered, either survey or administrative, on the size and age of firms. Sources such as business registers also provide data on firm entries and exits by size and by innovation status. Gault noted that this information can be and often is coordinated and overlaid with additional indicators based on analyses of sources of innovation, human resources, characteristics of innovators, and other factors. However, problems often exist with regard to the quality of matches across sources.
Another point raised by Gault and several others is that innovation does not always relate to R&D. Arguably, one of the most significant findings of the CIS is the extent to which firms innovate without engaging in R&D. NCSES data indicate that firms performing R&D have a substantially higher propensity to innovate; however, there are still more than 1 million “non-R&D” firms in the U.S. economy reporting innovation. This number raises a policy question that is not being addressed: how to prompt innovation—perhaps through state and municipal support—among non-R&D firms operating in different sectors. Gault referred to Martin’s “dark matter” problem—if firms are not engaging in R&D, then how are they innovating?
Gault speculated about how measurement might be broadened by extending the Oslo Manual definition to cover innovation beyond the business sector, to the public (government) and household sectors, in a way that makes it possible to examine how innovation links together economy wide. He suggested a new definition might take the following form:
An innovation is the implementation of a new or significantly changed product or process. A product is a good or a service. Process includes production or delivery, organisation, or marketing processes. A new or significantly changed product is implemented when it is made available to potential users. New or significantly changed processes are implemented when they are brought into actual use in the operation of the institutional unit, as part of making product available to potential users.
The main change he proposed involves generalizing the language so that “process” has three components that overlap; “improved” becomes “changed” to avoid normative statements; and “market” becomes “potential users.” In the new definition, implementation occurs when the product is made available to potential users, which also applies in the public
___________________
5See http://ec.europa.eu/eurostat/web/microdata/community-innovation-survey [August 2016].
sector as well as the business enterprise sector. In addition, the process activities involve making the product available to potential users.
In discussion, Hall commented about the importance of measuring whether anything actually happened once a new or improved product is on the market (e.g., the share of sales due to products introduced during the past 3 years). This is a question that many firms are able to answer, at least approximately. Survey developers, she argued, should continue to give thought to how questions might be developed in order to generate more useful variables about the impact of innovations, rather than the yes/no information concerning whether the organization introduced an innovation. Data on market outcomes are quantitative and more informative, especially when comparing firms of different sizes, in part because they are size normalized. Martin commented that such a question brings time scales to the surface, because when a firm is asked whether it has put products on the market, the firm is able to look back over a specific reference period and report that new products that went on the market accounted for x percentage of sales. There are analogous metrics for the public sector—for example, for health care, perhaps decreased bed days or gains in quality-adjusted life years created as a result of a new or significantly improved product or process. Surveys have to be customized to capture the value of innovation for the public sector, which would make them very different from the CIS, which is the same regardless of sector.
A final point made by Gault is that the goal of policy makers is not only to talk about or measure innovation, but also to nurture good innovation, green innovation, and sustainable innovation. He argued that current statistics are designed to count innovations, not to ask whether they are good or bad. In order to do that, agencies have to conduct surveys after the fact, which requires a long-term strategy for measurement and a commitment to understanding the system.
Fernando Galindo-Rueda (OECD), following up Gault’s discussion of the Oslo Manual revision, considered international standards for measuring and comparing innovation. As he and Gault outlined, the OECD-Eurostat Oslo Manual embodies, as the outcome of a global consensus-building exercise, a number of measurement choices reflecting sectoral scope, perspective on the unit of interest, data sources, who is performing the measurement, and who benefits from the data. Galindo-Rueda’s presentation focused on the role of international standards for measuring innovation and the scope for extending them in order to facilitate the international benchmarking of U.S. innovation performance—one of the potential NCSES requirements for data on innovation.
Standardization requires above all a community of practitioners with defined responsibilities and resources who have shared interests about what to measure and how to measure it. The Manual reflects the perspec-
tive of national statistical organizations, although many measurement systems involve partnerships with academic researchers, who carry out data collection, and with international organizations, who themselves field surveys across the world. Finding a common denominator among stakeholders, Galindo-Rueda noted, is not trivial because quite often individual countries have idiosyncratic perspectives on why innovation is of interest and what aspects are worth measuring. In some cases, phenomena of interest are universal, and this is increasingly becoming the case as the world becomes more global. In other cases, where interests and practical constraints are location specific, it is more challenging to compare results, such as outputs of innovation, across countries.
The Oslo Manual provides guidelines oriented toward the measurement of innovation through statistical surveys based on self-reported measures from respondents (who are typically managers within firms). It focuses on businesses, although there has been a struggle to reach all activities (e.g., agriculture or knowledge-providing services). A number of alternative perspectives could be adopted to measure innovation, Galindo-Rueda suggested. In terms of sectoral scope, surveys of households, governments, and nonprofit organizations could all be fruitful additions.
The perspective of the Oslo Manual is on measuring dimensions of innovation that are descriptive of the institutional units—that is, firms—being covered. One advantage of this approach is that it creates the possibility of linking information on innovation at the level of the firm with information about firms’ economic outcomes. But there are alternatives such as to focus on the actual innovations: an object-based approach, which was prominent until the early 1980s, or on innovation projects or innovation related to transactions, and perhaps inventions as a subset.
To date, statistically representative surveys have focused on eliciting information from management, but they could be reoriented toward capturing relevant insights from other perspectives such as the firm’s workforce or from outsiders such as users of products and services. The methods prescribed by the Manual generate information about innovation as reported by a firm; but, perhaps information is also needed from users to verify whether those self-assessments are sufficiently accurate and reliable.
Regarding data sources, the Manual could in principle expand beyond statistically representative surveys to cover use of administrative and commercial data, and new platforms that have the potential to be used by researchers to generate interesting insights. Specialized or nonspecialized media are also potentially useful data sources. There is a history of research in the academic literature based on announcements in the media about new product launches and similar activities. One can
envision new indicators based on data from the Kickstarter platform, for example, which may be used to identify what proportion of projects receive funding and how much. Some of these new data gathering and analysis activities will no doubt develop outside of the confines of the Oslo Manual. Some of these measurement avenues could be the object in the future of standardization, but it is important to note that not all areas are equally mature for that purpose, bearing in mind the OECD criteria for endorsing statistical guidelines. In considering new kinds of data and guideline development, OECD will no doubt demand quality assessment along the lines described by Hall and Jaffe (2012); NCSES may also play a similar role in the U.S. context for subjects of high domestic relevance where no international consensus exists. Incorporating new kinds of data is also likely to require experimentation and building up different types of consortia that involve different actors that take advantage of specialization and comparative strengths.
INNOVATION AND PRODUCTIVITY: RECENT PUZZLES
Dan Sichel (Wellesley College) discussed measurement of innovation within a macroeconomic framework, specifically what national-level and sectoral-level productivity statistics tell about innovation. A key question in this context is whether the productivity statistics currently being produced by statistical offices are credible and, in light of the answer, what might be the next steps forward.
National-level data imply that the pace of innovation has been exceptionally slow in recent years. Sichel expressed the view that this conclusion is not credible, and identified some key areas in which data inaccuracies need addressing, most notably in price measurement. While acknowledging that the productivity framework takes on a black-box characteristic, he argued that the numbers that have emerged have affected the narrative in the popular and financial press about innovation and affect the questions on which researchers focus.
If done correctly, Sichel said, the framework for measuring multifactor productivity produces (at least indirect) estimates of rates of innovation or technical change, both for the overall economy and within key sectors. In the “primal approach”6 that begins with a production function and information about outputs and inputs, the part of growth that is not explained by changes in quantity of inputs is attributed to multifactor productivity growth that reflects productivity improvements. The approach can be used to decompose multifactor productivity growth by key sec-
___________________
6The production function takes the form ΔYt = αΔKt + (1–α)ΔLt + Δmfpt, where Y = output, K = capital inputs, and L = labor inputs.
TABLE 2-1 Multifactor Productivity Growth for Selected Sectors
| Average Annual Percentage Change | ||||
|---|---|---|---|---|
| 1974-1995 | 1996-2003 | 2003-2010 | 2010-2015 | |
| Total | 0.6 | 2.1 | 0.7 | 0.4 |
| High Tech | 12.3 | 18.0 | 12.2 | 5.8 |
| Semiconductors | 28.0 | 47.0 | 27.7 | 6.6 |
| Computers | 15.7 | 13.7 | 8.6 | 8.3 |
| Communications | 1.7 | 0.4 | 0.6 | 3.1 |
| Intellectual Property | 2.1 | 2.9 | 2.0 | 1.6 |
| Software | 5.8 | 4.2 | 3.0 | 2.5 |
| R&D | 0.5 | 1.7 | 0.6 | 0.3 |
| ELA originals | 0.8 | 1.9 | 2.3 | 1.7 |
| Other | 0.3 | 1.4 | 0.4 | 0.3 |
NOTE: R&D = research and development; ELA = entertainment, literary, and artistic.
SOURCE: Workshop presentation by Dan Sichel, May 19, 2016; estimates derived using approach of Byrne et al. (2013) and data from Fernald (2012), updated by Sichel to 2015 with data from the Bureau of Economic Analysis, Bureau of Labor Statistics, and U.S. Census Bureau.
tors, as described by Byrne et al. (2013, 2015). Sichel noted an alternative way to measure multifactor productivity, which involves explaining price changes for an output in a particular sector, such as semiconductors. Price changes that are not explained by a weighted average of input costs also indicate multifactor productivity growth. The faster prices fall, the more rapid will be measured multifactor productivity growth.
The data that feed into these exercises are put together by the Bureau of Economic Analysis, the Bureau of Labor Statistics, and the U.S. Census Bureau. Table 2-1 presents rough first-pass estimates (from an upcoming paper) for the United States, over selected periods, of growth rates of multifactor productivity
If it is assumed that productivity figures provide reasonably good proxies for rates of innovation, then in these sectors, there is a clear pattern: a big step up in rates of productivity/innovation in the mid-1990s through the mid-2000s (emergence of the Internet, computerization, and so on) to 2.1 percent, followed by a step down, and then an even further step down since 2010. The same pattern observed for the high tech sectors is also present for intellectual property products and in other areas of the economy. Taken at face value, this means that rates of U.S. innovation, particularly in the past 5 years, have been exceptionally slow. This observed trend has colored the narrative of what is happening in the economy, as illustrated by macroeconomist Robert Gordon (Gordon, 2016). The slow pace of innovation is one of the factors Gordon cites for
why future prospects for improvements in productivity and living standards are so bleak in the United States.
Sichel argued that this accounting is only credible if the data feeding into the national system for measuring productivity are accurate. For example, if the rate of price decline of semiconductors is understated, so, too, will be the rate of multifactor productivity growth since the rate of multifactor productivity growth is being inferred from rates of decline in prices of key products. Further, if the rates of multifactor productivity growth are understated, the implicitly inferred rates of innovation in these sectors will be underestimated. Solow made a statement in the late 1980s about computers, which can be paraphrased to capture the current situation: we see innovation everywhere but in the productivity statistics.
According to Sichel, many people have a sense that the productivity numbers derived from official statistics may not be up to the measurement task, and particularly that price measurement has not kept up with rapidly changing goods and services. A set of papers convincingly documents the evidence, at least within the high tech area and for some intellectual property products. For example, research on semiconductors by Byrne et al. (2013) suggests that rates of price decline are understated by as much as 35 percentage points in recent years (see Figure 2-1). Dramatic misstatement of rates of price decline for semiconductors would lead to incorrect inferences about innovation in the sector. In addition, similar research (e.g., Corrado et al., 2011) has identified measurement problems with official statistics for a range of other high tech and intellectual property products as well, suggesting that mismeasurement of multifactor productivity is broader than just in semiconductors.
Once a revised semiconductor price measure is fed into the broad system of productivity measurement, the inferred rates of innovation change sharply. Sichel noted that the blue bars in Figure 2-2 are rates of multifactor productivity growth within the semiconductor sector by period, using official price measures. These data indicate a sector that had its heyday in the mid-1990s. The red bars reflect the corrected price measures and present, in turn, a quite different picture of what has happened with multifactor productivity (and, by extension, innovation) in this sector. Specifically, innovation in this sector has continued at a rapid pace—not quite as rapidly as during the second half of the 1990s, but nonetheless quite significantly.
With fully corrected statistics, Sichel argued that researchers and policy makers might be having a different conversation and asking different questions. The conclusion that innovation in the economy is very sluggish raises one set of questions, for example, about what to do about it. In contrast, the conclusion that innovation has been quite rapid but is not appearing in broad economic statistics raises a very different set of questions. They imply two very different lines of research, with a different set
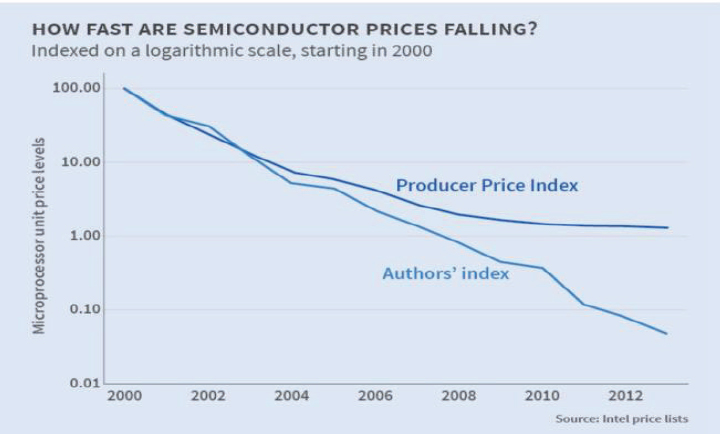
SOURCE: Workshop presentation by Dan Sichel, May 29, 2016; graph from the National Bureau of Economic Research, The NBER Digest (July 2015, p. 5). Available: http://www.nber.org/digest/jul15/jul15.pdf [August 2016]), which was adapted from Byrne et al. (2013, Fig. 9).
of policy interventions. Even though the broad analytical framework is a bit of a black box, Sichel noted, it is important to try to make progress to improve the sorts of inferences about innovation made from that broad system.
He suggested that to improve the accuracy of multifactor productivity measurement and, in turn, inferences about innovation in key sectors, work on improving measures of prices within key sectors needs to continue and to be incorporated into the measurement programs that feed into official statistics. He also suggested an expansion of the measurement system to better capture ongoing innovation activity.
Responding to Sichel’s presentation, Ashish Arora (Duke University) expressed concern about equating advances in multifactor productivity with advances in innovation. He pointed out that macroeconomic measurement is limited to revealing something about the rate at which inputs are being applied to economic production; this does not mean innovation in the conventional sense. Sichel responded that John Fernald (Fernald, 2012; Fernald and Jones, 2014) has been as careful as possible with aggregate data to account for influences such as changes in utilization that might affect multifactor productivity and that are not associated with
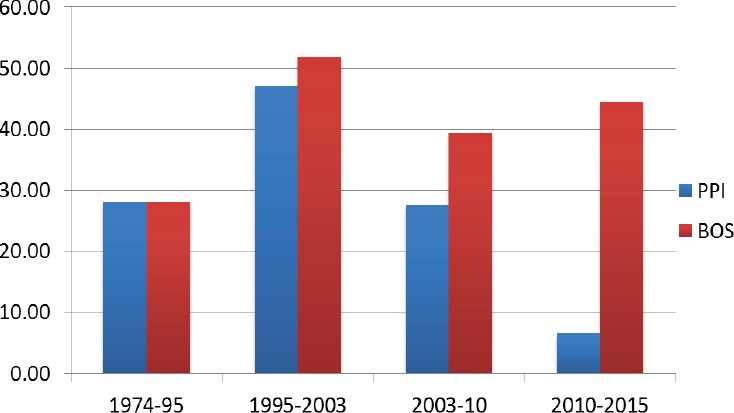
SOURCE: Workshop presentation by Dan Sichel, May 29, 2016; based on updating Byrne et al. (2013) using the Producer Price Index (PPI) and the Byrne et al. (2015) index (BOS) for semiconductor prices.
innovation—in other words, to construct a residual that is as close as one can get. Sichel acknowledged that productivity is not a perfect measure of innovation, but that innovation is typically viewed as one of the key factors driving it. While Sichel agreed with Arora that innovation is not the same as advances in human knowledge, he said semantic issues need to be worked out. Other factors that contribute to productivity change should also be looked at going forward by researchers. The advantage of multifactor productivity is that it offers a consistent framework within which to make comparisons across sectors and countries, and innovation is going to be one of the important factors driving those numbers.
Building on this exchange, Wesley Cohen (Duke University) pointed out that bridging the microlevel view often used by innovation researchers with the multifactor productivity view of macroeconomists reveals a need to measure additional multiple dimensions of productive processes. Technology and idea adoption, diffusion, and imitation (which can also show up in the productivity numbers) all need to be measured since productivity gains from innovation can be generated through any of these avenues. This information is necessary, Cohen said. National statistical agencies have occasionally taken on these tasks, but not necessarily in a systematic way.


