
3
Innovation Beyond R&D and Conventional Input Measures
Data on specific aspects of innovation—such as research and development (R&D) expenditures, patent applications, and citations—are often used as proxy levels of innovation activity within industries or countries. However, in the measurement community, it has long been understood that activities, both technical and nontechnical, including those that are not a directly measurable function of R&D and science, also play an important role in innovation (see, e.g., National Research Council, 2014).
The annual Business R&D and Innovation Survey (BRDIS)—conducted by the Census Bureau through an interagency agreement with the National Center for Science and Engineering Statistics (NCSES)—asks firms in manufacturing and service industries for information about newly introduced or improved products and processes, and about purchased R&D inflows and outflows, revenue from the sale of patents and patent licensing, and a number of activities related to intellectual property (IP). Some questions about innovative activities can be adequately addressed with current data sources such as BRDIS and the Community Innovation Survey (CIS), while others may require new or different kinds of data. For example, less is known about how innovation takes place in organizations that are not R&D active, as is often the case in the service sectors.
Questions addressed during the workshop related to this topic included the following:
- What models exist for assessing different kinds of (e.g., non-R&D) innovation?
- What is known about innovators acquiring inventions from external sources?
- How would better information about the division of innovative labor affect understanding of the propensity to innovate?
- How might surveys and alternative data sources be combined to improve the accuracy and interpretability of measures of different kinds and levels of innovation?
EXPANDING SURVEYS TO REVEAL ADDITIONAL INFORMATION ABOUT INNOVATION PROCESSES
Wesley Cohen (Duke University) discussed two prominent survey-based sources of innovation data—the CIS and the Division of Innovative Labor (DoIL) survey, the latter of which he cocreated with Ashish Arora and John Walsh (Arora et al., 2016a). The DoIL survey was designed to shed new light on the key sources of innovation and competitive advantage of American companies.1 In his presentation, Cohen addressed the question, discussed earlier by Gault and others, about what is meant by innovation and how surveys should be structured to measure it. He also reviewed substantive findings from the DoIL survey.
Cohen reported the top-level questions from the most recent CIS were (1) “Did your enterprise introduce a product innovation?”—meaning one or more new or significantly improved goods—and (2) “Were any of your product innovations new to your market or only to your enterprise?” or a “first in your country, Europe, or the world?” The CIS frames questions about innovation at the firm level. For example, regarding revenues and innovation, it asks what percentage of a firm’s total turnover in a given year was from new-to-market (NTM) innovations, new-to-the-firm innovations, and significantly improved products during the 3-year reference period.
The CIS and DoIL surveys generated the following estimates of the share of manufacturing firms introducing innovations for the 2007-2009 period in selected European countries and the United States:
New-to-Firm Innovation
– Germany: 49%
___________________
1While Arora et al. (2016a) focus on manufacturing, the project collected data from a number of software firms in other service-sector industries for a total of about 5,200 respondents. The response rate was about 30 percent, but the authors collected information on nonrespondents and were able to evaluate response bias in a number of ways.
– UK: 34%
– France: 28%
– U.S.: 42%
New-to-Market Innovation
– Germany: 23%
– UK: 17%
– France: 19%
– U.S.: 16%
Cohen said a key concern with the above statistics is how to interpret what respondents mean by new or significantly improved goods. A “yes” answer could indicate something comparatively trivial such as a new toothpaste formula, or something major, such as the first 3D printer. What respondents have in mind when answering these questions needs to be well understood in order to attach meaning to this kind of information.
Compared with the CIS, the DoIL is less broad in spirit. Its objective was to characterize the contours of what its developers call innovative labor and to emphasize the distinction between invention and innovation. The questions at the core of the survey were intended to determine to what extent innovators—companies introducing something new to the market, or commercializing new products or significantly improved products—acquire inventions from external sources and channels. The framework allows researchers to estimate and compare the value of externally acquired inventions by source—buyers, suppliers, another firm in the industry, universities, and to identify which channels—licensing, contracts, cooperative efforts—and the like—were exploited. Cohen reviewed some of the questions asked in the survey and the reasoning behind them.
In order to identify innovating firms, the DoIL survey asked: “In 2009, have you earned revenue from any new or significantly improved goods or services in [INDUSTRY] introduced since 2007, where ‘new’ means new to your firm?”
In order to focus on respondents’ most important innovations, the line of questioning continues with: “Of all the new or significantly improved products or services you brought to market in [RESPONDENT INDUSTRY] during the 3 years, 2007-2009, think of the one that accounts for the most revenue.”
Furthermore, to identify respondents as NTM innovators, the survey asks: “Did you introduce this innovation in your industry before any other company?”
This question structure builds directly on the definition of innovation from the Oslo Manual and from the CIS, Cohen pointed out. The major advance created by DoIL is that it identifies a specific line of business
for a given respondent. The survey is not for the firm as a whole, but is conducted at the business-unit level.
In addition to NTM innovators, DoIL enables identification of imitators—cases in which something new was introduced to the firm but which was not new to the industry. The question framing allows for calibration regarding what meets the threshold to classify as an innovation for a given purpose. Analysts can set the criteria—for example, the percentage of sales—for what is considered important.
Summary statistics reveal an NTM innovation rate in the United States of about 16 percent for the 2007-2009 period across all manufacturing industries, with innovation occurring disproportionately among large firms (38% versus 23% and 13%, respectively, for medium and small firms). There was also a wide range of innovation rates by industry: At the top end were instruments and electronics, at 37 percent and 33 percent, respectively; at the low end (8-9%) were wood, minerals, and metals. About 27 percent of respondents reported imitating, and these rates were more stable across industries and firm size relative to the innovation rate. The percentage of sales from NTM innovations was also highly skewed by industry (e.g., 31% for medical equipment and 5% for metals). For NTM innovators, the most important new-to-market innovation accounts for the bulk of all new-to-firm sales (about 70%).
Cohen said the survey asks respondents about the sources and channels from which the most important innovations (contributing to the overall design or the development of prototypes or conceptualizations of technology) originated. About 49 percent of respondents reported externally sourced inventions. The most pervasive source of innovations was customers; the most valuable ones originated from technology specialists, which include contractors, universities, and independent inventors. Innovations were acquired through market channels (e.g., licensing, contract, and equity acquisition) and nonmarket channels. The latter accounted for almost two-thirds of the cases, with cooperative efforts at 61 percent.
Returning to the question of where in the spectrum (from trivial to very important) a product innovation falls, Cohen suggested that surveys could do more to capture the relevant dimensions in measurable ways. Supplementary indicators of economic value and technical significance could be developed that permit assessment of the significance of innovations reported by respondents. DoIL indicators along these lines were constructed based on questions asking:
- the percentage of business unit sales due to the focal innovation;
- whether, in order to commercialize a focal innovation, the innovator: (1) developed new sales and distribution channels or (2)
- whether the focal innovation is patented by (1) the innovator or (2) an external source.
invested in new types of equipment or hired employees with skills different from existing employees; and
The last question is less a measure of economic value, since most patented inventions are never commercialized, and more a measure of technical novelty.
Cohen used Figure 3-1 to present findings about the percentage of business unit sales from focal innovation. The vertical axis is the percentage of innovating firms, and the horizontal axis indicates the percentage of sales accounted for by that group of innovating firms. For example, looking at the second-to-last bar on the right, about 8 percent of innovating firms report their most important new or significantly improved product accounted for more than 50 percent of sales.
Findings from the DoIL also indicate levels of investment in commercializing focal innovations (e.g., about 25% of respondents reported buying new equipment, hiring new personnel, and developing new distribution channels), as well as patent rates among NTM innovators (e.g., the rate is about 42% in manufacturing).
Cohen discussed findings about the correspondence between the percentage of sales due to focal innovation and other indicators. As shown in Figure 3-2, the degree to which focal innovations accounted for sales
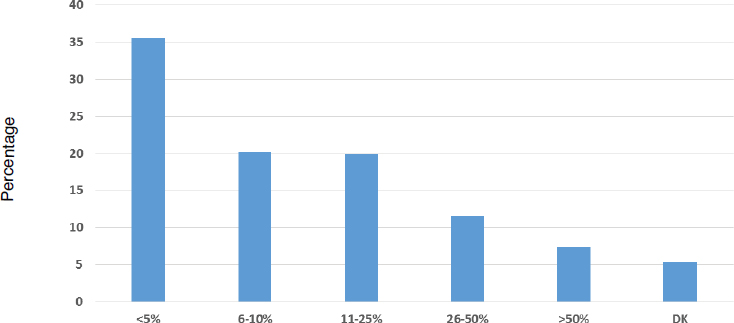
NOTE: N = 1,062 new-to-market innovators; DK = don’t know.
SOURCE: Workshop presentation by Wesley Cohen, May 19, 2016; data from Division of Innovative Labor Survey (see Arora et al., 2016a).
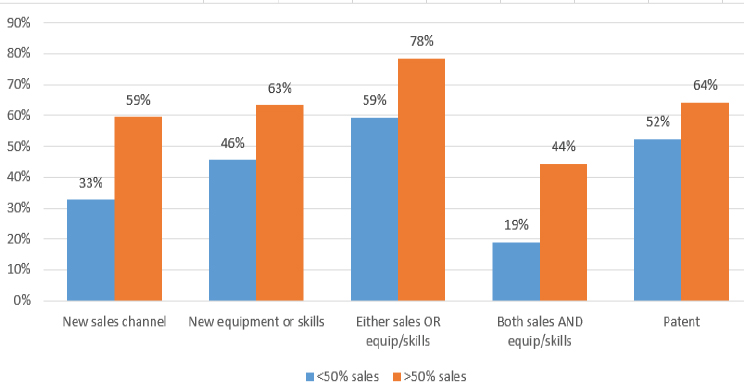
NOTES: N = 1,062 innovating firms. Y axis is the percentage of innovating firms in each category of the x axis. X axis categorizes other kinds of innovations, further classified by percentage of sales accounted for by the focal innovation (< 50% sales, > 50% sales).
SOURCE: Workshop presentation by Wesley Cohen, May 19, 2016; data from Division of Innovative Labor Survey (Arora et al., 2016a).
among innovating firms (less than or more than 50%) tended to correlate with other metrics. For example, looking at the second-to-last set of bars from the right, among firms whose innovation accounted for more than 50 percent of sales, 44 percent also indicated that they developed new distribution channels and invested in new sales and equipment. These different kinds of innovation are interrelated.
Cohen concluded that the observed high reliance on external sources for invention suggests that to understand drivers of innovation, researchers must consider the extent and implications of the “division of innovative labor.” He stated, “It’s not just large firms, it’s not just startups, it is not just universities.” Rather, measurement of the performance of the system as a whole must be focused on the relationships across them. He said his methodological conclusions were that (1) innovation measures focusing on a specific innovation offer accuracy and interpretability, and provide latitude and discretion to an analyst trying to understand various phenomena of interest; and (2) multiple measures tied to a specific innovation can reflect dimensions of economic and technical importance,
mitigating ambiguity surrounding such terms as “innovation” and “new or significantly improved.”
CHANGING DIVISIONS OF LABOR IN INNOVATION
Ashish Arora (Duke University) reinforced many of Cohen’s points, such as that thinking about innovation purely from the point of view of the innovating firm is misleading. Arora said he based his presentation on Simon Kuznets’ premise that the paramount feature distinguishing modern economic growth is the systematic application of scientific knowledge to the problem of human production.2
Arora made distinctions among invention, innovation, and knowledge. Early in the country’s history, for example, innovators in the railroad industry, the technically most sophisticated enterprise of its time, did very little inventing on their own. For the most part, they relied on outside sources and independent invention by employees or contractors. Exemplifying the times, describing the “duties of the patent department” at AT&T, T.D. Lockwood wrote in a 1995 letter:3
I am fully convinced that it has never, is not now, and never will pay commercially, to keep an establishment of professional inventors, or of men whose chief business it is to invent. . . . [T]he duties of the patent department. . . [should be]. . . first and foremost on examining patents or inventions submitted by the public for consideration and second on examining descriptions of inventions forwarded by the company’s employees.
Lockwood’s inclinations notwithstanding, “industrial research” did emerge, initially to deal with the problem of external invention. The country entered the golden age of American R&D during the 1950s through the 1970s; companies such as AT&T, Dow, DuPont, and IBM worked on a path of innovation-led growth relying largely on internal invention. At about this same time, Arora noted, many statistical agencies began developing their models of innovation measurement, which influenced methodological decisions.
Arora noted that fast-forwarding to more recent years, data from the National Science Foundation (see Figure 3-3) show a return to the pre golden age trend, as the share of privately funded R&D taking place in the economy by large firms has declined.4
___________________
2Nobel Prize Lecture, December 11, 1971. Available: http://www.nobelprize.org/nobel_prizes/economic-sciences/laureates/1971/kuznets-lecture.html [August 2016].
3Cited by Lamoreaux and Sokoloff (1999, p. 42).
4In absolute dollar terms, adjusted using the gross national product (GDP) implicit price deflator, R&D spending by large firms has increased over the period shown in Figure 3-3.
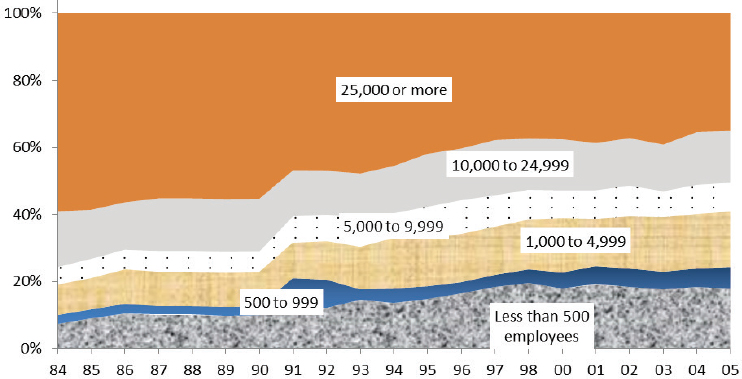
SOURCE: Workshop presentation by Ashish Arora, May 19, 2016; data from NCSES, Industrial Research and Development Information System, Historical Data 1953-2007, various tables. Available: http://www.nsf.gov/statistics/iris/search_hist.cfm?indx=11 [August 2016].
Other indicators, such as R&D award winners among Fortune 500 companies, paint a similar picture: large firms—the innovators getting products into the market—are not inventing the inputs themselves at the same rates they were 30-50 years ago.
Arora pointed to an interrelated trend, shown in Figure 3-4, in which the share of basic and applied research as a percentage of total R&D has been in steady decline since the mid-1980s as companies move away from the generation of new knowledge. They are still in the business of using inventions to produce innovations, but, Arora argued, these data indicate a growing separation between knowledge production and the use of that knowledge in invention and then innovation. Given the diminishing role of internal research in large private-sector companies, understanding the mechanisms of external knowledge production and spillovers from universities, startups, and government sources, as well as non-U.S. sources of invention and knowledge, is becoming increasingly important.5
Regarding the organizations doing the inventing, in the United States,
___________________
5Additionally, some companies are moving away from introducing new products and into financial engineering, globalization, and buying businesses (where innovations may be harder to detect and measure).
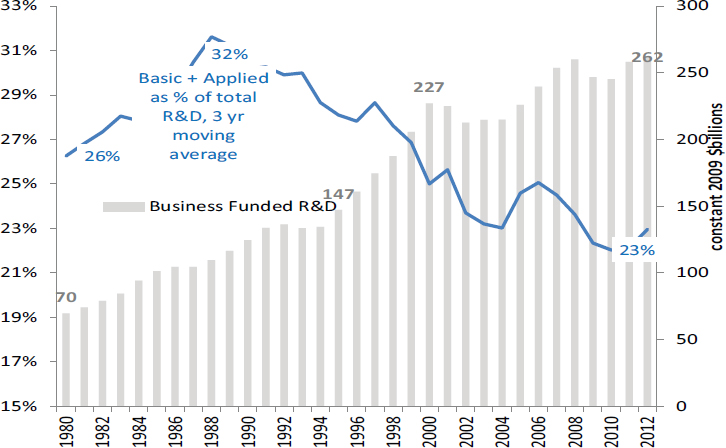
SOURCE: Workshop presentation by Ashish Aurora, May 19, 2016; data from the National Science Board, Science and Engineering Indicators 2016, Appendix Tables 4.6-4.8. Available: https://www.nsf.gov/statistics/2016/nsb20161/#/data [August 2016].
roughly one-half come from sources—suppliers, customers, other firms, consultants, independent inventors, and universities—that are external to the manufacturers who put them to use (Arora et al., 2016b). The channels through which inventions flow to innovators are market-based about one-third of the time. The other two-thirds flow through other informal means, which Arora speculated include public domain, stealing, or some combination. Some are collaborative, cooperative joint ventures. The National Science Board Science and Engineering Indicators publications provide information about the extent to which invention originates from science by showing the percentage of patents citing science and engineering literature.6
In open discussion, commenting on external sources of inventions (and inventive labor), Alfonso Gambardella (Bocconi University) noted an important distinction between market and nonmarket mechanisms.
___________________
6See, for example, the National Science Board, Science and Engineering Indicators 2016, Table 5-30. Available: https://www.nsf.gov/statistics/2016/nsb20161/#/report/chapter-5/outputs-of-s-e-research-publications-and-patents [August 2016].
Current data are geared to capturing the former (e.g., licensing of patents), while researchers have to be more creative with the data to glean information on the latter (e.g., taking advantage of relevant inputs that are in the public domain). The nonmarket-mediated mechanisms are still largely unknown in terms of understanding their role in economies. Cohen agreed that nonmarket mechanisms are important, noting that, for example, cooperative efforts in these sorts of relationships were shown to be extraordinarily high in the Cohen/Arora surveys. Co-invention, he said, probably accounts for the majority of invention, but little systematic data exist on these arrangements at an economy or sector-wide level.
Citations by U.S. patents to science and engineering articles have been trending up from about 16 percent in the early 2000s to well over 20 percent in more recent years. Arora said this provides some indication that innovative activity is not getting separated from the scientific or technical base, as some have argued.
Arora concluded that currently collected data tell a lot about the division of labor in invention, adoption, and innovation. The data currently can show how innovation systems are evolving in the U.S. economy. He suggested more could be done, especially through data linkages used to measure idea flows. He said this requires improved data on the sources of invention, sources of knowledge, and flows of external knowledge.
RESEARCH USING LONGITUDINAL BUSINESS DATA AND OTHER STATISTICAL AGENCY DATA THAT HELP MEASURE INNOVATION
Javier Miranda (U.S. Census Bureau) presented work measuring the high tech sector using administrative records at the Census Bureau. Picking up the discussion thread from Sichel’s presentation, Miranda argued that regardless of the productivity measurement issues, other outcomes show that different trends emerged for the high tech sector after 2000. His research (with coauthors John Haltiwanger, Ron Jarmin, and Ryan Decker) indicates a decline in the number of startups in the high tech sector and in the number of jobs generated by these startups (see Figure 3-5). Specifically, the number of startups that become superstar firms that generate a lot of jobs in the economy has declined over the period.
The secular decline in business startup rates over the 1981-2013 period—a 12 percent decline peak to peak between the recessions in the 1980s and the Great Recession—is a concern in that young firms disproportionately contribute to employment and productivity growth. But the answer to whether the economy or a given sector has become more or less innovative depends on what types of startups are in decline. Miranda argued that if it had been “mom and pop” businesses or mainstream
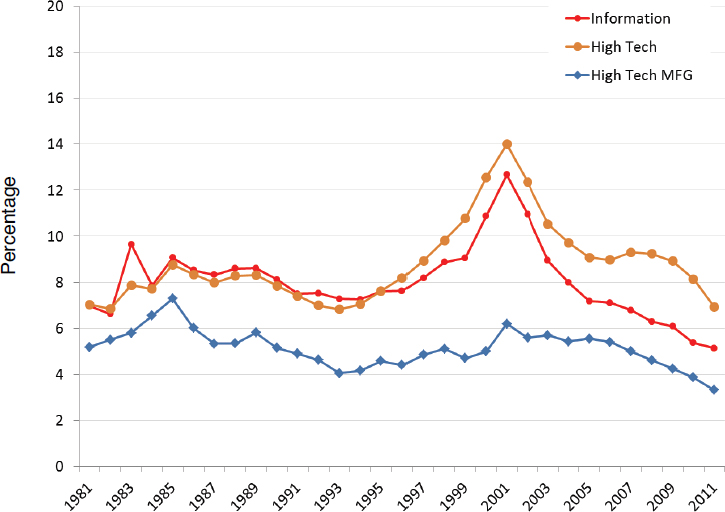
SOURCE: Workshop presentation by Javier Miranda, May 19, 2016; data from Decker et al. (2015).
businesses that are not very productive, then the decline might be less worrisome. However, if the decline has been in transformational entrepreneurs creating innovative businesses, then it would be a greater concern. Research by Miranda and his colleagues (e.g., Decker et al., 2015) found the decline in startup rates during the 1990s was driven mostly by fewer “mom and pop” businesses starting in the retail sector. After 2000, the trend appears to have been largely driven by a decline in transformational entrepreneurs, the type of businesses that historically have generated a lot of jobs.
Given that researchers do not have flags in the data distinguishing between startups by transformational entrepreneurs and mainstream or “lifestyle” entrepreneurs, they have examined measures of skew in the firm growth distribution. Miranda explained that the idea takes advantage of the fact that relatively few firms become superstars that generate a lot of jobs. In other words, a few innovative firms generate a disproportionate amount of new jobs. For the high tech sector—a composite
of industries (e.g., information services, computer and peripheral equipment, software publishers, computer system design, and related services) with more than 25 percent of its workers in science, technology, engineering, and mathematics (STEM)—Haltiwanger et al. (2014) found a high level of dynamism during the 1990s: entry of new firms coinciding with U.S. productivity growth. Around the time of the “dotcom bust” and the accession of China to the World Trade Organization, a sharp reversal and decline in high tech startup activity took place. Likewise, as shown in Figure 3-5, the decline in the share of employment in high tech jobs accounted for by young firms began in 2000 and, by 2011, it was about half of what it had been a decade earlier. The decline coincides with a slowdown in productivity growth as measured using official statistics (or, Miranda pointed out, using Fernald’s numbers cited by Sichel above).
Miranda focused on the firms that generated a lot of jobs, which he said requires looking beyond R&D data. He said measures of trends in STEM worker employment are used to help complete the picture. The research shows the importance of looking at measures of dispersion and skewness to understand what is happening in this sector. Statistical agencies are looking into different data products to get at this type of heterogeneity.
Kristin McCue (U.S. Census Bureau) reported on two emerging developments at the Census Bureau relevant to the study of innovation. The first involves enhancements to the Business Dynamics Statistics (BDS) Program that will provide useful information on innovative businesses; the second involves two new surveys of small, young firms designed to collect information about innovation that is not available from administrative records.
The extensions envisioned for the BDS Program—which produces data on job creation and destruction, establishment openings and closings, and numbers of startups and shutdowns, as well as the age and size of firms—is to produce a high tech industry measure based on the work of Hecker (2005). In the near term, statistics will be produced for a grouping of a set of industries with disproportionate STEM employment using the definition identified above by Miranda. Longer term, statistics may be produced by 4-digit North American Industrial Classification System (NAICS) codes so users can create their own groupings of high tech industries, she said.
The BDS Program is also looking to produce statistics on high-growth employers. The idea is to generate data on percentiles of employment-weighted growth distribution in order to be able to track the skewedness of the distribution over time and across sectors. There have also been efforts to create statistics on whether businesses and employees have been involved in patenting activity. This involves using the linked employer-
employee data to link inventors to their data in the census. For all of these products, the underlying linked microdata will be potentially accessible to researchers in the Census Bureau’s Federal Statistical Research Data Centers, she said.
Two new surveys will derive content from the NCSES Microbusiness Innovation Science and Technology Survey (MIST). One, the Micro BRDIS, is being developed by NCSES. The other, the Annual Survey of Entrepreneurs, includes modules of eight questions from the MIST Survey covering process and product innovation and R&D costs, funding, purchases, and employees. These are both surveys of small and young firms. As in past collaborations between agencies, such as between NCSES and Bureau of Economic Analysis in developing new data for adding R&D and intangibles into the National Income and Product Accounts, questions of data confidentiality are regularly dealt with.
DESIGN INNOVATION AS AN ALTERNATIVE OR COMPLEMENT TO R&D
Bruce Tether (University of Manchester) focused on design in his presentation, primarily “industrial design” as opposed to engineering design. He observed the latter is often thought of as an activity taking place within R&D, while the former typically is not. Tether cited a number of prominent examples of new product introductions driven by design: Ford’s Model T was replaced by the Model A in large part because people wanted a new, more varied product. There was nothing particularly innovative about it from a technological perspective. Similarly, Apple introduced the iMac computer with the intention of making computing fun and accessible: the innovation was in the presentation and user-interface, rather than in the underlying technology. In both cases, Tether said, understanding and responding to user needs and desires was central. Design also applies to services. For example, one way that Virgin Atlantic competes with larger airlines is by investing heavily in design to create a different customer experience.
So what, Tether asked, is design? He noted the term is as malleable as “innovation.” The traditional view is that design is something applied after difficult complex engineering decisions have been made, when the goal is to make a product look attractive: in this view, it is about outward appearance. Even if this were the extent of it, Tether argued that design matters. Its growing importance is indicated by a steady rise in the number of design patents issued since the mid-1980s, as shown in Figure 3-6: more than 20,000 design patents annually since 2006. The total number of patents has also risen substantially, so, as a share of patents, the share of
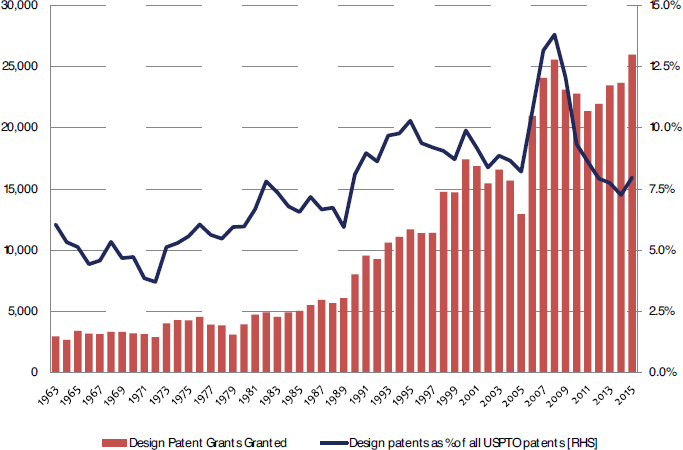
SOURCE: Workshop presentation by Bruce Tether, May 19, 2016; data from U.S. Patent and Trademark Office, Patent Technology Monitoring Team. Available: http://www.uspto.gov/web/offices/ac/ido/oeip/taf/us_stat.htm [August 2016].
design patents has only gone up marginally. Nonetheless, these data give some indication of the significance of appearance.
The nature of the big design patent-owning firms (e.g., Apple, Honda, LG, Microsoft, Nike, Procter & Gamble, and Samsung) indicates that there is a relationship with technologies, such that design goes beyond aesthetics. These companies have both utility and design patents. The modern view of design is that it brings together creativity through insights and integration of ideas. Tether suggested a good example is IDEO, a global design firm, which created a program for Bank of America called “Keep the Change” to entice people to save more (every time customers buy something with their debit card, the bank rounds up the purchase to the nearest dollar and transfers the difference from their checking into a savings account). This kind of innovation required a deep understanding of people’s needs and wants and how to realize them.
Tether provided statistics based on an Innobarometer survey, conducted in 2015, about the extent to which firms in various countries are
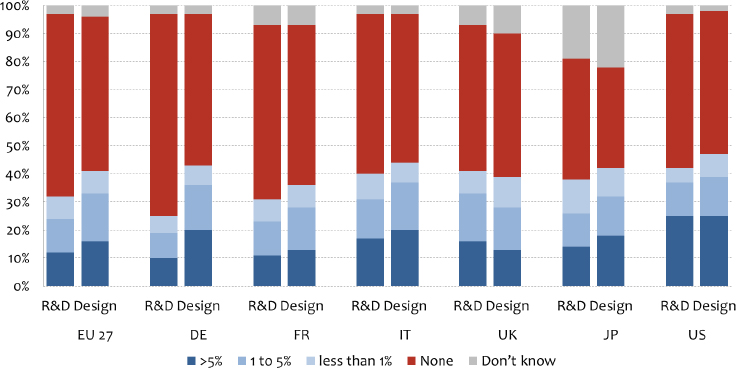
NOTES: “Intensity” refers to the share of turnover (or revenues) that is spent on R&D and design. The Y axis is the percentage of companies investing in R&D or design in 27 European Union countries (EU 27), Germany (DE), France (FR), Italy (IT), United Kingdom (UK), Japan (JP), and the United States (US).
SOURCE: Workshop presentation by Bruce Tether, May 19, 2016; data from Innobarometer 2015 (Montresor and Vezzani, 2015).
engaged in design and R&D.7 As shown in Figure 3-7, more than 40 percent of U.S. companies invested in design outside of R&D, a slightly higher share than the share of firms that invest in R&D. Similar findings were found for the EU-27 and for Japan.
Tether described how it is not only how much firms spend on design that matters but also the role of design in the firm. The Danish Design Centre developed a design ladder to indicate this. Firms can use design as a strategy, where it is a central feature in the business concept; as a process, where it is integrated early in product development; or as a last finish, to give the product form. Finally, he acknowledged, some firms do not use design at all.
Controlling for various factors—such as investments in R&D, investments in software, branding, the age and size of companies, sector, and country—research has found that firms that spend on design are
___________________
7Innobarometer is an annual survey sponsored by the European Commission on activities and attitudes related to innovation. Available: http://ec.europa.eu/growth/industry/innovation/facts-figures/innobarometer/ [August 2016].
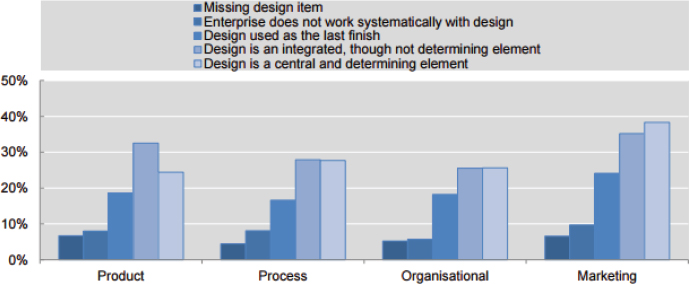
NOTE: Marginal effects obtained from probit model estimations, controlling for size and sector. Baseline = “don’t know/not relevant.” All coefficients are significant at the 5% level.
SOURCE: Workshop presentation by Bruce Tether, May 19, 2016; estimates from Galindo-Rueda and Millot (2015), using data from Statistics Denmark, based on Community Innovation Survey 2010 results for Denmark.
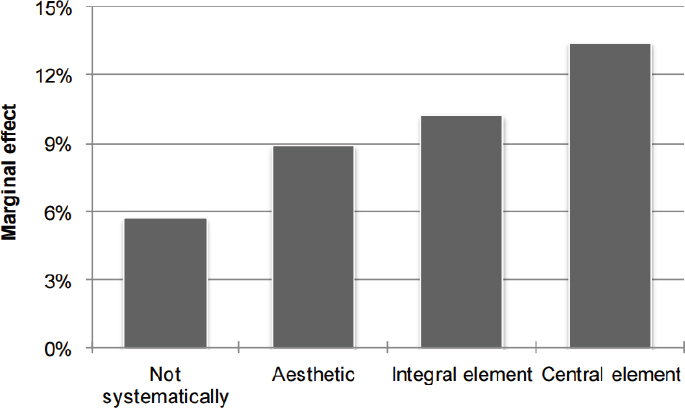
more likely to innovate and have higher sales from innovation. Work by Galindo-Rueda and Millot (2015) using the Danish CIS data reveal an increasing impact from using design more strategically. As shown in Figure 3-8, firms that use design in a centralized way are more likely to introduce innovations than those that do not use it or use it as add-on styling.
Another recent study using the Innobarometer survey (Montresor and Vezzani, 2015) found similar marginal effects on whether or not firms introduce product or service innovations in terms of the centrality of design. As shown in Figure 3-9, when design becomes more central, the probability of introducing innovations increases. There is also a marginal association with sales, although not necessarily a causal one. Again, where design is a central element, the share of sales linked to product/service innovations is higher.
Tether summarized his presentation with the following points:
- Design has mattered as a competitive weapon for a long time, and yet it has been on the fringes of innovation measurement and, as a result, is not well understood.
- Recent studies show that spending on design, and its role in the firm, affects the introduction of innovations. It is not adequate to measure just the spending on this input, it is also important to know where design is positioned in the firm.
SOURCE: Workshop presentation by Bruce Tether, May 19, 2016; estimates from Montresor and Vezzani (2015), using data from Innobarometer 2015.
- Design is increasingly seen as part of a process that integrates an understanding of users’ needs, which are not always explicit. Design relates to matters of appearance, and appearance matters (people make selection choices on the basis of how things look), but design now goes well beyond that.
- Design varies across different sectors. A lot of attention is focused on the high tech sectors, but that is only a small part of the economy. Design is important in low tech sectors and, increasingly, in services.
- Among the challenges in measurement are (1) there is no agreed-upon standard for defining design;8 (2) design is often hidden: two companies may invest the same amount, but this may not appear to be the case if one has design activity subsumed into R&D and marketing; (3) beyond the amount spent, the arrangement of the spending is also important—if spending is fragmented, it seems to have less impact than if it is concentrated;
___________________
8Guidelines for Collecting and Interpreting Design Data—A Proposal for a Future Barcelona Manual on Design prepared for the European Commission, June 2014, made some proposals for a standard. Available: http://www.bcd.es/site/unitFiles/4242/measuringdesignvalue.pdf [August 2016].
(4) the quality of design inputs (including key design staff) may matter more than the extent of investment; and (5) contingencies and complementarities are involved, as is usual in innovation studies, that determine when design is likely to be most effective.
AUTOMATION INNOVATIONS
Rob Seamans (President’s Council of Economic Advisors [CEA], on loan from New York University) presented on the need to track automation and the use of robotics across sectors of the economy in a way that informs employment and other policies. This dimension is crucial given the relationship between automation in manufacturing and services and employment and wages.
Seamans touched on a number of topics from the 2016 Economic Report of the President, which included a section on robotics and automation.9 Extensive evidence exists that automation leads to productivity growth (see, e.g., Bloom et al., 2012), but there has been little research on the robotics component of automation. Seamans cited a paper by Graetz and Michaels (2015) quantifying the shipment of robotics into different sectors of the economy in different countries from 1993 to 2007. This research finds that use of robotics led to, on average, a 0.36 percentage point increase in a country’s annual labor productivity growth, accounting for slightly more than one-tenth of overall GDP growth during that time. Although small, Seamans pointed out that its impact is similar in magnitude to that resulting from steam engines in the United Kingdom in the late 19th century—and about one-tenth of the productivity growth that occurred during this time period.
Robotics can either complement or substitute for labor. While macroeconomists tend to focus on top-line productivity growth, according to Seamans it is also important to know whether the use of robotics comes at the expense of labor, and, if so, whether policies exist to mitigate this potential downside. Seamans highlighted a few examples, including China’s Great Wall Motors Assembly Line, where robots have replaced workers who previously riveted parts onto cars. More generally, a large share of robotic shipments go to the automotive industry in such countries as China, Germany, and the United States, and most notably Japan, where there are high ratios of robots to workers. In this case, there might be more substitution than complementing, although, even then, the car robots are likely increasing the productivity of workers at higher plant managing levels. Another example that Seamans pointed to is Amazon’s investment
___________________
9Available: https://www.whitehouse.gov/administration/eop/cea/economic-report-of-the-President 2016 [August 2016].
in a company called Kiva Systems, which makes robots that take items to pickers located in a central location in the warehouse. These machines traverse aisles, locate items, and bring them to workers who then perform the higher-level task of figuring out what they need to pick in order to fill the order. These robots are performing an essentially complementary role that increases the productivity of the human pickers and order processors.
Data from the International Federation for Robotics (IFR) indicate that total annual shipments of industrial robotics began to increase rapidly around 2010, and they have nearly doubled since then.10 Similarly, beginning around 2011-2012, there was a large uptick in the number and rate of patents that cite the robot class. These trends suggest, according to Seamans, that the 0.36 percentage point contribution to productivity growth estimated by Graetz and Michaels (2015), which only included data up to 2007, may significantly understate current contributions.
The effects of automation on labor are likely to be geographically heterogeneous, given that automation affects industries differently and that some industries are more geographically concentrated than others. To illustrate this point, Seamans presented the number and share of workers in each county who work in industries receiving the most robotics shipments. Not surprisingly, large counties such as Los Angeles and Santa Clara have high numbers of potentially affected workers. In terms of the share of workers, counties in which the dominant employer is concentrated in a highly automated industry are at the top of the list. In Calhoun County, Arkansas (the home of three large aerospace and defense firms—Aerojet, General Dynamics, and Lockheed Martin), close to 100 percent of the workforce is potentially affected. Rates almost this high are also obtained in Bristol Bay, Alaska, which is dominated by canning and seafood processing, and Saluda County, South Carolina, home to large poultry and meat processing plants. From a policy maker’s perspective, Seamans said, these locations are interesting because robotics and automation are having large impacts (positive for some workers, negative for others) in the local economy.
Researchers have also examined the link between the occupational “threat of automation” and wages across industries. Data from Frey and Osborne (2013) show the probability of automation for each of about 700 types of occupations. BLS data on wages can be matched for each of those occupations, as shown in Figure 3-10. In the figure, each dot represents an occupation. Toward the left-hand side of the graph are occupations such as podiatry, civil engineering, the clergy, interior design, and human resources management, where jobs require skills such as manual dexterity
___________________
10Sander and Wolfgang (2014) have estimated that worldwide spending on robotics—$26.9 billion in 2015—will rise to $66.9 billion by 2025.
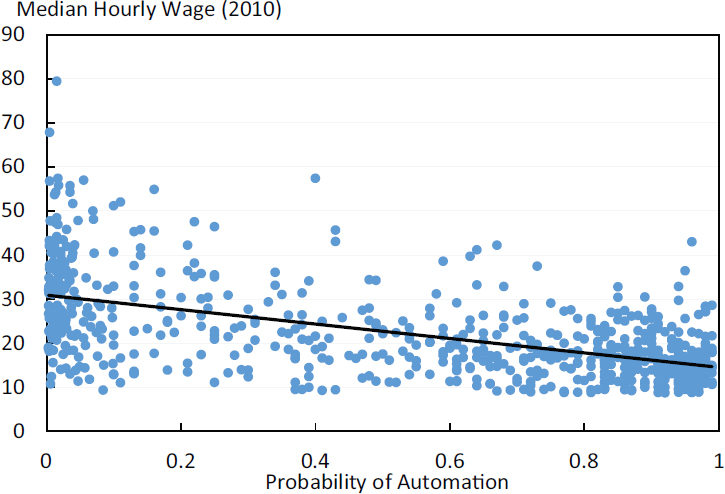
SOURCE: Workshop presentation by Rob Seamans, May 19, 2016; wage data from Bureau of Labor Statistics; probability of automation estimates from Frey and Osborne (2013); and President’s Council of Economic Advisors’ calculations.
or complex thinking that do not lend themselves easily to automation. On the right-hand side are occupations such as tax preparation, telemarketing, and cashier and office work where less manual dexterity is required or where there is more automatable thinking. Occupations that are easier to automate than others appear to have lower wages associated with them.
Seamans concluded that the topic warrants more research attention, given the recent uptick in robotics (whether measured in units, revenues, or patents), the potential impact on productivity growth and labor displacement, and the geographic diversity of these trends. Data on robotics shipments are available from the IFR at the country-industry-year level. There are also data on the probability of automation, produced by Frey and Osborne, McKinsey Global Institute, and others, as well as patent application data, particularly patents in the “robot” class. Seamans argued that none of these measures is at a granular enough level to provide information to help policy makers track how automation is affecting industries
and economies at a local level. Thus, in order to facilitate research on some of these important relationships, he suggested that NCSES could prioritize developing more detailed data indicating which industries are using robots, how much they are spending, and the extent to which robots are substituting or complementing workers. One possibility would be to systematically add questions to a U.S. survey along the lines of “Last year, how much money did your establishment spend on robotics?” and “Has your establishment considered using robotics instead of human labor?”
In discussion, Sheryl Winston Smith (Temple University) commented that robotics is an important input into machine learning; it is essentially a complement in production, but one that is not going to show up in robotics patenting data sources that would attribute the contribution to other categories. Seamans added it is the responsibility of policy makers to track affected industries and geographies, to anticipate the downstream effects of these innovations (e.g., they may boost productivity, but with potentially adverse effects on labor), and to consider appropriate policy responses.
This page intentionally left blank.


