
6
Regional Innovation Models and Data Needs
Introducing the workshop session on regional innovation models and data, Maryann Feldman (University of North Carolina) observed that the locus of innovative activity is inherently subnational—certainly substate and, in many cases, very local—and many spillovers and complementarities of innovative activity take place at the local level as well. Yet data collection is focused on aggregate, often national levels of geography. This workshop session was intended to provide guidance for addressing this disconnect and to highlight important work developing regional data infrastructures. Much of the focus was on entrepreneurship, one dimension of innovation.
REGIONAL MEASURES OF INNOVATION AND ENTREPRENEURSHIP
Catherine Fazio (Massachusetts Institute of Technology) began the session presenting estimates of the quantity and quality of entrepreneurship at localized levels. She began with the observation, based on research (e.g., Decker et al., 2015; Haltiwanger et al., 2014), that the benefit of startups for economic growth spring from a handful of fast-growing, young companies such that the distribution of the sources of job and wage growth is highly skewed. The policy challenge, as expressed by Robert Litan (2010), is to propel more startups that are capable of meteoric growth. The problem is the difficulty to predict at the time of founding which firms are likely to survive and grow. For example, in 1994, what
distinguished a startup bookstore that would remain unchanged for years (or go out of business) from Amazon? At the time of founding, it is typically difficult to discern any difference based on traditional metrics. The measurement challenge is how to identify and map growth potential from the start.
Fazio said traditional measures provide important information. For example, quantity-based measures from the Census Bureau’s Business Dynamics Statistics (BDS) document a 30-year decline in business dynamism. Figure 6-1 indicates a significant decline in the rate of firm entry, providing one measure that the U.S. economy has become less entrepreneurial over time.
In contrast, Figure 6-2 provides an indication that high-growth entrepreneurship is on the rise—so much so that there has been concern over whether or not there is a bubble and, in some places, even whether the bubble has now burst (Rosoff et al., 2015).
The above metrics lead to conflicting implications, Fazio explained. Measures that account for firms’ initial heterogeneity and growth ambi-
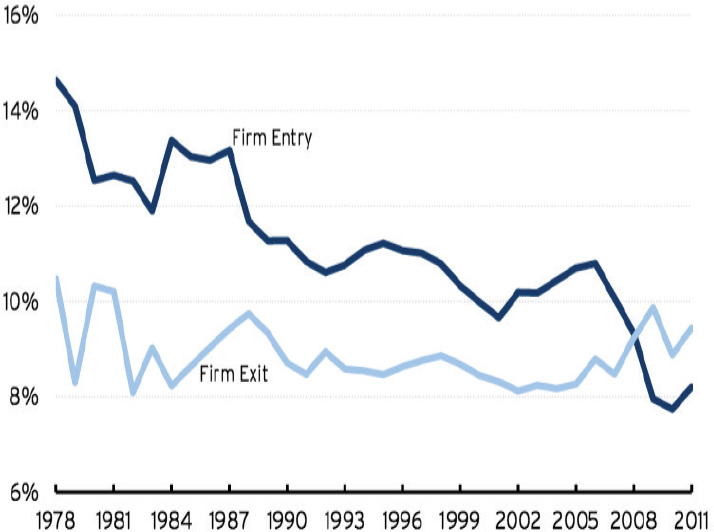
SOURCE: Workshop presentation by Catherine Fazio, May 20, 2016; figure from Hathaway and Litan (2014, figure 3), based on Business Dynamics Statistics data.
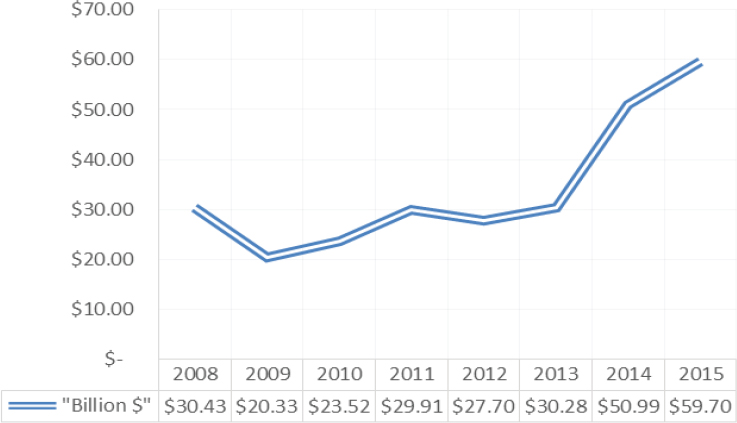
SOURCE: Workshop presentation by Catherine Fazio, May 20, 2016; data from The MoneyTree™ Report by PricewaterhouseCoopers and the National Venture Capital Association, based on data from Thomson Reuters. See https://www.pwcmoneytree.com/HistoricTrends/CustomQueryHistoricTrend [November 2016].
tion and potential are needed to fill the missing part of the story. To maximize the relevance and utility of data collection programs, the National Center for Science and Engineering Statistics (NCSES), OECD, and statistical agencies need to recognize that small to medium-sized enterprises (SMEs) and innovation-driven enterprises (IDEs) are different. To capture these differences, information systems should be broadened to include measures of entrepreneurial quality that enable policy makers to evaluate SMEs and IDEs at the time of formation.
Fazio proceeded to outline new approaches for measuring entrepreneurial quantity and quality and to describe findings emerging from research based on these measures. The quality measures attempt to estimate underlying growth potential of startups, drawing on characteristics observable at or near the time of founding, and deriving conditions that yield consistent population-level statistics. They include the Entrepreneurial Quality Index, designed to indicate the average growth potential of any given group of new firms; the Regional Entrepreneurship Cohort Potential Index, the number of startups within a region that relates to expected growth outcomes; and the Regional Entrepreneurship Accel-
eration Index, which is the ability of a region to convert entrepreneurial potential into realized growth (see Guzman and Stern, 2016). These measures generate novel characterizations of entrepreneurial ecosystems over time at different levels of geographic granularity, she said.
The approach described by Fazio builds on three interrelated insights to develop a new data source on innovation-driven entrepreneurship. The first is that business registration is a practical requirement for growth. Business registration represents, at the state level, a robust sample of entrepreneurs who are at similar foundational stages of their process. Business registers are comparable over time and place, but they do not include all data that are needed. They do not include nonregistered firms, sole proprietorships, unincorporated or self-employed people, or the household innovators described by von Hippel.
The second insight is that markers of entrepreneurial quality are observable at or near the time of business registration. Firms with the potential and ambition for meaningful growth outcomes often have different “startup characteristics,” some of which are directly observable within business registration records. Firms often aim for a certain level of growth and then strive to achieve it. For example, their growth ambitions are sometimes reflected in the names that they choose. The Corner Café has a different growth ambition than Akamai Technologies or Amazon, Fazio asserted. Patent filings made by early-stage ventures are also directly observable and may signal a new firm’s potential and ambition for growth. These kinds of characteristics captured by various data sources can be distilled into measures and then scored depending on whether those characteristics were exhibited or not.
The third insight highlighted by Fazio is that meaningful growth outcomes can be observed with a lag, creating the potential to map observed growth with characteristics. Rather than assuming a relationship, the relative importance of different factors can be investigated by developing a predictive model of growth or entrepreneurial quality based on startup characteristics. Among the findings from such a model (Fazio et al., 2016, Table 1): A startup that is a corporation is 400 percent more likely to grow compared to one that is not, and a startup named after a founder is 70 percent less likely to grow compared with one that is not. If a startup in the United States exhibits a combination of positively correlated characteristics—such as having patents and a registration in the state of Delaware—the probability of growth jumps astronomically. Such findings can be used to construct the underlying probability of growth at the time of founding for every registered firm.
Fazio described these startup characteristics as digital signatures of growth ambition and potential, not causal drivers. In a test of skewness among new firms using Estimated Entrepreneurial Quality, Fazio et al.
(2016, endnote 38) found that 65-72 percent of realized growth events fall within the top 5 percent of the model’s estimated entrepreneurial quality distribution, and 51 percent of realized growth events fall within the top 1 percent of the distribution of startups. In other words, growth potential is a key dimension of heterogeneity among newly founded firms.
Fazio turned to results from Guzman and Stern (2016) based on regional entrepreneurship cohort quality indexes (which can be used to estimate the expected number of growth events) and the ecosystem acceleration index (which indicates the ratio of realized to expected growth events in a region). These tools can be used to map where firms with high growth potential are being founded and located. In a Boston area analysis, for example, the Cambridge Innovation Center and the cluster of biotech lab spaces clustered along the Charles River appear prominently. When the above described quality-based measures of innovation-driven entrepreneurship are added to quantity measures, areas such as Kendall Square become more prominent, while areas with standard-type businesses become less so.
As a policy tool at the subnational level, these models enable evaluation of innovation-driven entrepreneurship at a more granular level than has been possible, Fazio observed. They permit more tailored analyses and could contribute to the development of more targeted policy interventions that can be tested through experiments. For regional policy makers, these analyses can help identify whether IDEs are being started, which firms have high potential, what that potential for growth is, and which sectors they are in (including potential opportunities for cluster-based IDE). Trends can be identified, such as where firms are locating, whether they are moving, if realized growth is matching expected growth, if the ecosystem is conducive to growth, and if there is coincidence with any government programs. Finally, she said, these analyses enable diagnosis of challenges and opportunities with respect to innovation-driven enterprises at a granular level.
Fazio concluded by identifying opportunities for collaboration among researchers, NCSES, and other statistical agencies to advance this research program. She suggested priority areas including: developing quarterly metrics of entrepreneurial quality as a regularly produced statistic for the United States; connecting entrepreneurial quality with alternative measures of performance via the Census Bureau’s Longitudinal Business Database (LBD) microdata; and extending the evidence base for innovation and entrepreneurship program evaluation.
More generally, Fazio concluded it would be possible to implement predictive analytics in statistical approaches to complement other data being collected on innovation—for example, to assess the entrepreneurial potential of patent-holding entities and to tailor entrepreneurial quality
measures to complement Science and Engineering Indicators with measures of local science-based entrepreneurship.
Following up on several of Fazio’s themes, Sheryl Winston Smith (Temple University) discussed microlevel foundations for measuring innovation and entrepreneurship using novel data created by financing programs on founders, startups, and early hiring characteristics. She shared insights about the changing face of regional innovation—who is involved, what types of businesses enter, where they are entering, and how they get launched—derived from research on seed accelerators. Early-stage financing has particular implications for who enters into science, technology, engineering, and mathematics (STEM) entrepreneurship and for the trajectories of these new ventures, she said.
A key question raised by Winston Smith is whether current measures are capturing modern entrepreneurial processes and new aspects of the ecosystem. If not, she asked, what types of novel data can be collected and analyzed in order to gain deeper insights? She discussed both the opportunities associated with new kinds of data—for example, sites that provide profiles of people, companies, or both, such as LinkedIn and CrunchBase—and caveats and cautions.
In the search for answers to the kinds of questions highlighted by Winston Smith, researchers can take advantage of the fact that launching ventures typically requires seed capital. Entrepreneurs with high-growth potential ventures typically reach a stage where they need formal outside equity financing. The traditional next step has been angel capital, particularly professional angel groups, which are regionally distributed.
Seed accelerators provide a distinctly different model. They operate on a short, finite time period, typically about 3 months. People apply to enter the accelerator events, and those who are accepted proceed as a cohort through intensive boot camp periods. The process culminates in pitch events—“demo days”—where founding teams pitch their proposals to a roomful of investors and potential acquirers. There are strong elements of mentorship and peer learning, but competition as well. Winston Smith cited a number of prominent companies that have gone through startup accelerators. Dropbox originated in a seed accelerator held by Y Combinator in Boston in 2007; Airbnb went through Y Combinator in Silicon Valley in 2009; and BB-8 started life with a company called Orbotix, now Sphero, that went through a Techstars seed accelerator program in Boulder in 2010.
Winston Smith cited several figures to provide a sense of the magnitude of the seed accelerator trend (Loeb, 2014). Companies that have gone through Techstars average about $1.6 million in outside venture capital financing after leaving. The average valuation of Techstars’ alumni is $4.3 million; the total value of the companies is more than $1.5 billion.
The total valuation of Y Combinator alumni companies is more than $65 billion. Eight Y Combinator companies are valued at more than $1 billion each. By comparison, angel-backed companies—the traditional source for early-stage financing—have a median premoney valuation of $3 million. For 2014, 870 angel deals involved about $1.65 billion in total rounds of financing (Angel Resource Institute, 2014). These figures indicate that accelerators are a phenomenon (or an innovation) on par with the impact that angel groups have traditionally held in the economy.
For measuring entrepreneurial activity, including the financing dimension, the issue of a skewed distribution rises to the fore once again. It is known ex ante that most firms—even most high-growth potential firms—that launch will fail. There are a few potentially very big successes and also a large middle distribution (Guzman and Stern, 2015). Issues also arise concerning typical milestones that are very rare events. An initial public offering (IPO) is a rare event; even venture capital (VC) funding is rare (about 4% of firms receive VC investments at some point). It is not the characteristic path of most new ventures, even among high-growth new ventures, she observed. In order to address policy questions, the full distribution of these phenomena needs to be understood. Intangibles—learning, competition, follow-on networks, and mentorship—may matter even more than the amount of financing. These things are hard to capture in terms of totals and averages.
Winston Smith addressed how incentives and institutional structures associated with different kinds of financing affect the growth trajectory of new ventures. She noted there may be regional implications for the entrepreneurial ecosystem, including short- and long-term impacts in terms of network and syndication ties, job creations, the recycling of founders’ successful and unsuccessful new startups, new investors, and new mentors. For startups, there are questions about people—the source of human capital behind these ventures. What prior experience, networks, background, and education (particularly STEM) do founders and hires bring to the table, she queried. What are the team’s funding and exit options (e.g., quitting or acquisition)? For some of these issues, it is particularly hard to get data from traditional sources. Information on failures and stagnation has to be tracked down because the stream of data typically ends along with the venture.
The accelerator process makes it possible to develop a novel microdata set to bear on some of these key questions. Winston Smith’s team has been able to assemble data on 25 cohorts from Y Combinator and Techstars (the two most established accelerators) covering the 2005–2011 period. They have been able to track every outcome associated with 394 startups, 933 founders, and more than 15,000 hires through 2016. The “census” of ventures that went through these two accelerator firms is
diverse, both geographically and by industry. The researchers also created a matched angel sample for a similar range of industries and geographic locations for the same time period.
One finding from the team’s comparison of the accelerator and angel data is that, while the accelerator events are located in a limited number of locations throughout the United States, the startups that apply to and are accepted into these programs come from a much broader set of locations. Hires from the successful startups are drawn from an even more widespread, global distribution. This means that the accelerator process is having an impact on the distribution of human capital in a large and powerful way, she said.
Winston Smith explained that data underlying the analysis include both established and novel methods (Web scraping) and hand collection. Sources such as CrunchBase, LinkedIn, CB Insights, and technology blogs were triangulated to trace the trajectory of startups from inception, to seeding by round, to various outcomes. For each startup and founding team, Winston Smith and her collaborators tracked outcomes on quits, acquisitions, VC follow-on funding, hiring (e.g., first hiring choices, timing, generalist versus specialist), and long-term growth.
Among the many findings emerging from the analysis is that entrepreneurs with STEM backgrounds make up about one-third of founding team members, another one-third have computer coding backgrounds, and about 54 percent have business backgrounds. Winston Smith et al. (2015) find that graduates from computer science programs have a particularly strong impact; even students who study other fields but go to universities that have strong computer science programs are much more likely to enter an accelerator event. Additionally, the researchers were interested in cohort heterogeneity. The distance between the founding team from the rest of the cohort can impact the trajectory of the different startups.
In terms of next steps, Winston Smith suggested that researchers would benefit from being able to generalize her team’s method to a broader group of accelerators since there is not a single model for all types of founders and startups. Increasing data coverage would allow researchers to scale up the analysis and compare findings based on established sources such as census data or the Kauffman Firm Survey.1 A set of best practices for this kind of research should also be developed, she said.
___________________
1The Ewing Marion Kauffman Foundation sponsored the Kauffman Firm Survey, which collected data from more than 4,900 businesses established in 2004, following them through 2011 (see Robb and Farhat, 2013). Kauffman is currently helping to support an Annual Survey of Entrepreneurs (ASE), conducted by the U.S. Census Bureau beginning in 2015 for 2014 data and with sufficient funding to collect data for a total of 3 years (see https://www.census.gov/programs-surveys/ase/about.html [August 2016]).
LESSONS FROM ADMINISTRATIVE AND OTHER DATA SOURCES ABOUT REGIONAL INNOVATION AND ENTREPRENEURSHIP
Rosemarie Ziedonis (Boston University) addressed the question about what can be learned from subnational, state, regional, and local government programs directed toward supporting innovative activity. Her focus was on distinguishing what she called “young gazelles in the waiting” from the majority of companies that fail along the way. It is difficult to predict which way a firm will go, but Ziedonis asserted that opportunities exist to analyze nascent companies using data, primarily administrative, that are already collected but not often easy to access.
Using the Michigan Economic Development Corporation’s loan programs as a case study, she described ongoing work by Zhao and Ziedonis (2012) that leverages data on a sample of 297 proposals from 241 startups seeking funding during the period 2002-2008. A typical applicant was a 4-year-old life science company. The idea behind this research, she said, is to test the effect of public R&D financing on recipient startups in terms of a range of outcomes: their survival (based on state business registry data), their ability to secure follow-on financing from venture capitalists and federal small business innovation research [SBIR] grants, their broader business activity (proxied by information gathered from news articles and elsewhere), and their production of patents. Preliminary findings suggest that among close-call applicants—those with similar merit scores, some of which lost out on loans by a small margin and some of which won by a small margin—those that were awarded financing experienced an increase of about 20 percent in the likelihood of survival 6 years following the competition and a higher likelihood of follow-on financing from venture capitalists and greater business expansion. This finding holds for the youngest companies and those that did not have prior SBIR funding and for those that were farther away from state hubs of entrepreneurial activity. No discernible impacts were found regarding the impact of receiving funding on patent-based outcome measures.
The method that she and Zhao employed allows for treatment effects to be estimated—not perfectly, but better than in most other options. The alternatives typically involve surveying successful recipients of these awards, which indeed can be useful. But, without the comparison group, it is difficult to make inferences about what would have happened to companies had they not received funding. This follow-up survey approach has been more commonly used with proprietary, applicant-level data for evaluating the effects of public R&D grants on postdocs, on the career paths of scientists, and, in several studies, on firm-level outcomes.
Thus, while their research illustrates a useful method for program evaluation, she stressed that they had atypical access to data—including
scores from a competition-based program—for an entire pool of loan applicants as well as outcome metrics for these young and small companies. Without access to Michigan government archives, the project would not have been possible. The challenge to scaling up this kind of effort is that it would require creating a clearinghouse wherein state economic development officials could, with confidence about confidentiality protection, deposit data that could be accessed by researchers. This kind of research also requires hard work on other aspects of data collection, she said. They compiled press releases and news articles capturing information about presentations, technical conferences, sales, contracts, and product development announcements.
Administrative data are extremely useful for measuring outcomes and for designing program evaluation studies. From a policy perspective, experiments of this sort reveal evidence about the marginal impact of funding—specifically, if financing allows new firms to remain in business. The approach facilitates analyses of the “stay rates” of entrepreneurial firms and consideration of which policy levers are most effective for promoting economic development. But, until this kind of data infrastructure becomes more broadly based, a number of important questions will go unanswered: Do the findings hold when smaller award sizes are involved? Do results differ for loan versus subsidy programs? And, do the results translate to other state and local environments? At this point, Ziedonis said, researchers have produced illuminating case studies, but it is hard to know how generalizable the results are.
During open discussion, Ben Martin praised the “handcrafted indicators” described by Fazio, Winston Smith, and Ziedonis. Returning to the dark-matter analogy—the aspects of innovation that are not well measured—he concluded that new lampposts were being built through this cutting-edge research. He added, however, that much of the work focuses on entrepreneurial activity and not broader aspects of innovation, and he asked about the relationship between the two. Owen-Smith responded that because much of what had been discussed involved STEM-based entrepreneurship, many of the outputs translate into innovations. Much of what these new firms produce involved traditional innovations—new products, new services, new technological products, or new applications that come to market. A lot of the relevance, he argued, is in understanding the entrepreneurial activity, and the next step would be to trace that to innovation outcomes.
Javier Miranda referred to the access issue. He acknowledged that access to census data and local datasets can be difficult, but he said the Census Bureau has in place a process for researcher use of data. Specifically, there are 23 Federal Statistical Research Data Center (FSRDC) locations created in cooperation with universities, nonprofit research institu-
tions, and government agencies. Also, the Census Bureau has a mandate to expand its data holdings beyond federal data, and the Evidence-Based Policymaking Commission (created through the Evidence-Based Policymaking Commission Act of 2016, known as the Ryan-Murray bill)2 is charged to consider what would be involved in establishing a clearinghouse for federal, state, and local administrative data to inform federal policies. He recognized that these are broad umbrellas, but there is the capacity to create leverage to begin coordinating data more systematically and in a way that researchers can have access.
Maryann Feldman presented research on regional innovation systems motivated by questions about the ways in which places change and evolve over time. She cited Durham, North Carolina, as one among thousands of possible case studies. There are many entrepreneurial firms located there, as well as accelerators and incubators. A major goal of recent research by Feldman and her team is to operationalize the entrepreneurial ecosystem,3 and to study it as a temporal spatial process.
Feldman noted the literature on regional economies is dominated by two theoretically distinct concepts: the industrial cluster and the regional innovation system. Industrial clusters are defined as “a concentration of inter-dependent firms within the same or adjacent industrial sectors in a small geographic area,” while innovation systems are “interacting knowledge generation and exploitation subsystems linked to global, national and other regional systems” (Asheim and Coenen, 2005, p. 1174). Cluster analysis is firm-centric and delineates how different types of firms interact with one another within a given industry and geographic space (Lowe, 2009; Porter, 1990; Renski et al., 2007).
In this literature, processes of change tend to be underexamined, she said. What is missing is the institutional richness of the systems of innovation and an understanding of all of the supports that touch entrepreneurial firms. To address this gap, Feldman and colleagues have engaged in in-depth data collection centered around Research Triangle Park, a large industrial park in between the campuses of the University of North Carolina, Duke University, and North Carolina State University. The site was very consciously created by public policy over a 60-year time period and is now defined by a configuration of firms that has evolved over time.
Research Triangle Park, which now consists of around 5,000 firms, was established near the cities of Durham and Raleigh. It has been filled
___________________
2See https://www.congress.gov/bill/114th-congress/house-bill/1831/text/pl [November 2016].
3A definition of the entrepreneurial ecosystem is “a set of interconnected entrepreneurial actors, . . institutions, . . entrepreneurial organizations . . . and entrepreneurial processes which formally and informally coalesce to connect, mediate and govern the performance within the local entrepreneurial environment” (Mason and Brown, 2014).
with a large number of startup firms. Even though it is a vibrant economy, the area does not make many lists of the top fast-growing regions in the country because most of them are compiled by metropolitan statistical areas (MSAs). Durham-Chapel Hill and Raleigh are two separate MSAs; if these MSAs were combined, the area’s population is about the same size as that of Austin, Texas.
Feldman, Nichola Lowe, and their research team have built a relational database (represented in Figure 6-3) in order to organize as much detail as possible about firms in the Park—the year they were established, their technology, annual events (e.g., merger, funding received, closure), job counts, and institutional supports. The cumulative effect of what makes a firm successful is the multiplicity of all of these factors and interventions by the many people who have touched them and influenced their behavior. The team triangulates data sources to establish
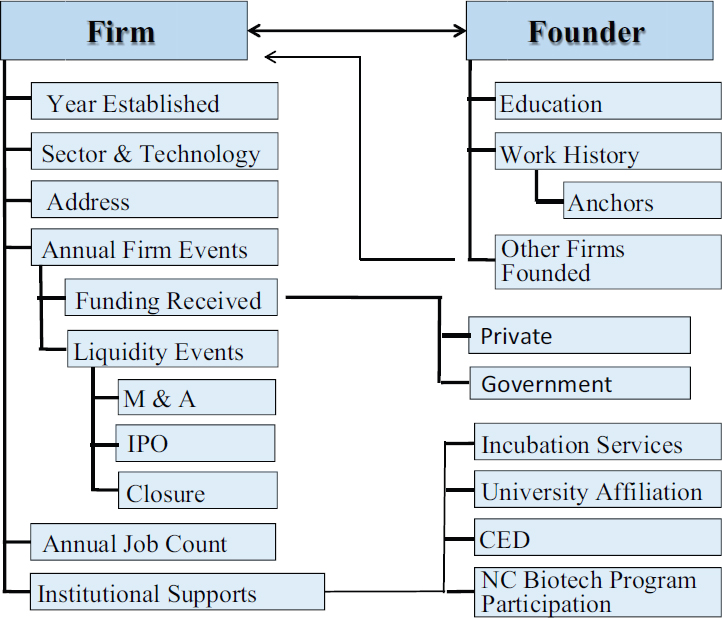
SOURCE: Workshop presentation by Maryann Feldman, May 20, 2016.
when a firm begins, its growth trend, and its innovative activity. State registries are used to identify firm births and to establish starting dates. Firm growth can be tracked in terms of annual employment, sales, and revenue, numbers.
Innovative activity is tracked using data on patents, U.S. Food and Drug Administration trials, and new product announcements using web-scraping methods, some of which has been automated by the team. For every firm, the researchers look at events such as funding raised (public and private), mergers and acquisitions (M&A), initial public offerings (IPOs), and participation in incubators and entrepreneurial support organization programs. To these firm-level data, geocoded addresses can be added to examine the development and growth of the region over time and to identify micro geographies where activity has developed.
Feldman pointed out that, early on, Research Triangle Park was not very interested in small entrepreneurial firms because they are unreliable tenants. Now, however, the Park is full of technology-intensive industries that include biotech firms spawned from corporations, many of which are traced back to two prominent pharmaceutical firms in the region, GlaxoSmithKline (GSK) and Burroughs Wellcome. These large companies have spun off more new firms than the adjacent universities. About 146 first-generation spawns alone came out of GSK.4 This in-depth analysis reveals a lot about how what large firms are doing affects entrepreneurial activity. For example, the data indicated that layoffs followed every M&A.
Feldman closed with several summary observations:
- Regional data are at present inadequate—there is not enough granularity; there are 2- to 3-year lags in publishing; and there are not enough data on the outcomes. For these reasons, her research projects have required hand-collected data.
- A new age of cyber-enabled research has begun. In addition to the growing richness of data housed at the Census Bureau’s FSRDCs, Feldman noted that the amount and detail of information that people will reveal about themselves on the web is amazing. And sometimes records can be matched across sources that create even greater richness of detail. New visualization techniques are also adding value to the data being generated and linked.
- State and local administrative records need to be better exploited. Feldman suggested that an equivalent of the Evidence-Based Policymaking Commission Act of 2016 for the state level would offer great research promise. At present, little is known about how much money is spent by state and local agencies on R&D pro-
___________________
4See DeBruyn (2015, image showing data compiled by Feldman and Lowe).
grams. For purposes of accountability, making such data available is becoming increasingly important.
During open discussion, Wesley Cohen reiterated points made by Winston Smith, Ziedonis, and Feldman about the importance of being able to track companies that fail and what happens to the entrepreneurs associated with them. He noted that many founders of biotech firms that fail go on to benefit from the experience in ways that aid future ventures or that help them move into other areas. A data infrastructure allowing individuals involved in these ventures to be followed would no doubt produce valuable insights. Feldman reported that, of the 5,000 firms in their study, about 40 percent exited through one mechanism or another. They are easy to track when they are involved in M&A. When firms are born, there are a lot of announcements and other signals; however, she said, deaths are typically quiet. One way to tell if a firm has gone out of business is if its business registration is not renewed. In her survey, individuals involved with disappearing firms are not captured when they leave the profession or the region. Data would have to be collected systematically on a more national scale to capture the career paths of everyone involved in Research Triangle Park ventures. Cohen agreed that being able to track where talented, often high-skilled and high-powered individuals go after firm death or other events would be highly important and interesting. Feldman noted that for some kinds of studies, census data such as the Longitudinal Employer-Household Dynamics Program provide a good platform. Owen-Smith added that their UMETRICS data allow for founders involved in failures to be tracked because the tool is organized around individuals and not locations. This is the case because the data usually include people’s entire career histories.
INNOVATION DATA AND ANALYSIS TO INFORM REGIONAL POLICY
Thomas Guevara (Economic Development Administration [EDA], U.S. Department of Commerce) said he spoke as a policy maker and consumer of information produced by the statistical agencies. His interest is in seeing boundaries pushed in terms of the capacity of data for informing and affecting policy and ultimately serving communities. He said his overarching premise is that the purpose of any government agency is to improve the quality of life for the citizens it serves.
When EDA started out as a public works agency 50 years ago, the perceived route to prosperity was to build more infrastructure. Implicit in this view is that prosperity is based on consumption. Guevara observed that researchers and policy makers are coming to realize that continuous
growth and prosperity is not going to be achieved simply by consuming. In that spirit, his agency adopted the following definition of economic development, drawing on Feldman et al. (2016, p. 10):
Economic development is defined as the expansion of capacities that contribute to the advancement of society through the realization of individual, firm and community potential. Economic development creates the conditions for growth and improved quality of life through innovation, lowered transaction costs, and the utilization of capabilities to responsibly produce and sell valuable goods and services.
The emphasis in this definition, he noted, is on human activity, behavior, and the way people work with one another with the resources they are given. With this in mind, EDA seeks to help communities understand their assets as well as their strengths and weaknesses, and the opportunities and threats that influence prospects for prosperity and improvement in quality of life. The agency works toward this goal by investing with local partners, he explained. It does not invest in businesses directly; rather, it provides grants to government entities and nonprofits, including universities, to take advantage of opportunities in local ecosystems. At the same time, the agency requires that businesses benefit directly from assets that they build and that they are maintained in the public trust.
Fundamentally, he said, EDA is about increasing capacity through the sponsorship of innovation-inducing activities and resources that are inputs to economic development. Guevara injected the view that underlying the innovation and development process, agency matters in terms of the ability of people to work together with scarce resources. And, he added, if agency—whether in the context of exchanging knowledge, discrete objects, or technology—matters, then complexity must be built into the measurement framework. This is the reason, in Guevara’s assessment, why the research reported on at the workshop by Feldman, Fazio, Ziedonis, and Winston Smith is essential, because it involves data that provide insights into how people work together. This, Guevara concluded, is the boundary that needs to be pushed if agencies such as EDA are to become effective at investing resources to achieve outcomes that result in prosperity and improved quality of life.
Guevara raised three questions related to improving the data infrastructure:
- What is known about agency’s role in inducing innovation?
- Can research and data collection methods be designed that ultimately lead to more precise “diagnosis and treatment” interventions for public investment, and better policy as a result?
- Can the principles that currently define complex adaptive systems lead to greater insights about how innovation emerges?
Much of what is known about the first question can be found in the research on complex adaptive systems (e.g., Holland, 2006). The second question addresses Guevara’s point about the absence of a systematic approach to data collection, analysis, and evidence to support policy and economic development. This relates directly to how the social science community does research: Researchers try things out, test and measure, and then hope to inform policy through a sense of what is learned from research findings. Learning results with some set of probabilities about what might be more likely to work and what might be less likely to work. The result is, hopefully, better policy, using health care as a great example of an ecosystem operating in a complex, adaptive system. Regarding the third question, Guevara asked whether the data being created by government agencies and in the private sector can provide the foundation for understanding innovation and its role alongside other factors in contributing to economic growth and improved well-being. He observed that some developments emerging from other disciplines—such as cluster mapping tools—may help to create new frameworks for evaluating measures of innovation and what people do to induce innovation in their environments.
During open discussion, Ziedonis pointed to growing evidence that direct intervention programs (such as those discussed by Guevara) also serve an informational role to the private capital market. While there is not a lot of consensus about why and how, research by Josh Lerner and others (e.g., Lerner and Kovner, 2015) has looked at various programs and attributed some impact on outcomes to certification whereby, when awards are won, a promising startup is declared in a sense. More research is needed, she added, about how this mechanism works. She questioned whether this is indicative of where money is being put to prototype and further develop things to a stage in which it becomes easier to communicate and actually attract private financing.


