2
Illustrative Models
A wide variety of model-based investigations have been carried out successfully in areas of potential interest to the National Geospatial-Intelligence Agency (NGA). This chapter describes five examples relevant to NGA’s mission:
- Pirate attacks. NGA provides support (human geography information, imagery analysis, cartography) to the Navy and other defense agencies fighting piracy at sea, as well as warnings to commercial ship captains.1
- Housing bubbles. Financial stresses are a key component of NGA’s megacities scenario (see Box 1.2).
- Disease outbreaks. NGA provides support for humanitarian assistance activities, such as base maps showing cultural places and communication, power, and transportation infrastructure in affected African countries during the outbreak of the Ebola virus disease.2
- Tensions in the Middle East. Human geography is a core geospatial intelligence capability, and it features in a variety of analyses of regional conflicts.3
- Food and water scarcity. Competing food, energy, and water demands are a driver for NGA’s Chinese water transfer scenario (see Box 1.2).
These examples are intended to illustrate how models have been used to help answer the sorts of questions NGA might ask, not to detail all of the elements and complexities of the particular model-based investigations. Each example includes representative forensics, tactical, or strategic questions that might guide a model-based investigation. Forensics questions guide investigations aimed at understanding why a particular event occurred. Tactical questions are aimed at supporting short-term decisions, such as the deployment of resources. Strategic questions are aimed at longer-term decisions and planning that could benefit from projections or scenarios of possible futures. These types of investigations are often related. For example, the results of forensics and tactical models may inform the development of strategic models, and strategic models may supply scenarios or initial conditions for tactical models.
___________________
1 See https://www.nga.mil/About/History/Pages/A-Generation-of-Geospatial-Intelligence.aspx.
2 See NGA Pathfinder Magazine 12(4):20-24, 2014 [online]. Available at https://www.nga.mil/MediaRoom/Pathfinder/Pages/Archive.aspx.
3 See NGA Pathfinder Magazine 14(1):10-11, 2016 [online]. Available at https://www.nga.mil/MediaRoom/Pathfinder/Pages/Archive.aspx.
EXAMPLE 1: PIRATE ATTACKS
Piracy around the Horn of Africa (Indian Ocean) costs the United States up to $16 billion per year (Hansen et al., 2011) and also hampers humanitarian efforts and endangers lives. Counterpiracy forces must allocate their limited assets (about 30 vessels) to protect several million square miles of ocean from thousands of pirates. For example, more than 2,000 pirates operated in Somalia alone in 2011 (Kirk, 2011). These pirates generally attack large commercial ships using small vessels that are highly vulnerable to rough ocean conditions.
Tactical Question: How should ships and aircraft be deployed to best protect commercial shipping from piracy?
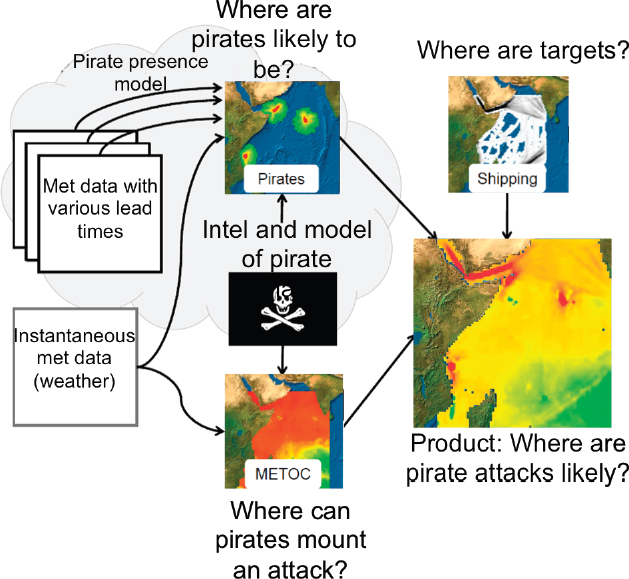
A key element of mitigation is to determine where the pirates are and when they will attack so that counterpiracy forces can be in the right place at the right time. The three conditions that must be met for a pirate attack to occur are (1) the presence of a vulnerable ship, (2) the presence of pirates, and (3) mild weather conditions (generally waves must be less than 1 m for the pirates to be able to board the ship under attack). Combining models of weather, commercial shipping, and recent pirate attacks, Naval Research Laboratory researchers developed a model for predicting where the pirates will be and when they are most likely to strike (Hansen et al., 2011). Later, the model was enhanced with historical weather data and an agent-based model of pirate behavior to create a Pirate Attack Risk Surface product (Slootmaker et al., 2013; see Figure 2.1). The product is validated using measures of reliability (e.g., events forecast with a 30 percent chance of occurring should occur about 30 percent of the time), and measures of sharpness (e.g., the region with a predicted high probability for pirate attack is smaller than the region covered in a climatological prediction). The results indicate that the model produces sharper forecasts than climatology, and that pirate attacks are more likely to occur in areas where the predicted probability of attack is high.
These models and products are continually evolving as shipping patterns and pirate behavior change. For example, the behavior model can be updated as pirates adapt to antipiracy efforts or change their capabilities. This product is briefed daily to the senior leadership of U.S. Naval Forces Central Command to support decision making on deploying antipiracy assets.
Strategic Question: what conditions lead to a greater risk of piracy?
This question calls for an examination of conditions that lead to increased piracy, and many different types of subsystem models could be used to address different aspects of the problem. For example, climate models could provide information on changing environmental conditions, which could then be input to models of water and food availability. Infrastructure models could examine the logistics associated with distribution of food, water, and aid. Societal models could reveal the dynamics of tribes, religion, and centralized government and the ability of these groups to enhance or reduce the conditions that make piracy attractive. Similar models could also be used to understand the creation, growth, and sustainment of organizations necessary to recruit, train, and supply pirates. The policies of insurance companies and countries that influence the availability of funds for ransom could also be factored into the analyses.
EXAMPLE 2: HOUSING BUBBLES
Economic bubbles are characterized by a boom and then a collapse of asset prices, accompanied by uncertainty about the fundamental value of the assets. The run-up is often fueled initially by demand and then largely by speculation. Because it is difficult to assess fundamental asset value, it is difficult to diagnose a bubble until it bursts.
Speculative asset price bubbles can be traced back as far as ancient Rome (e.g., Chancellor, 1999). A more recent example is the U.S. housing bubble of 2005–2008. Housing prices peaked in early 2006 then declined, reaching new lows in 2012. The credit crisis resulting from the burst of the housing bubble is considered one of the primary causes of the 2007–2009 economic recession in the United States (Holt, 2009), and it had ripple effects across the globe.
Strategic Question: How do various financial policies affect housing bubbles, such as the U.S. housing bubble of 2005–2008?
Recent advances in computing, data availability, and modeling have made it possible to combine microdata with agent-based modeling to study how the behavior of individual households and banks can produce bubbles at the aggregate level. In agent-based models, the agents (in this case, households and banks) interact directly with one another and with their economic environment, following autonomous decision rules. By studying the behavior of house prices in the periods leading up to and after the crisis, and investigating the importance of various factors that are amenable to policy interventions (e.g., central bank interest rate policies, leverage limits, creditworthiness limits, removal of refinancing restrictions, write-downs of mortgage principal, and subsidies to first-time homeowners), it may be possible to identify policies that could help prevent a bubble and promote financial stability.
Geanakoplos et al. (2012) combined several independent data sets on household behavior in the Washington,
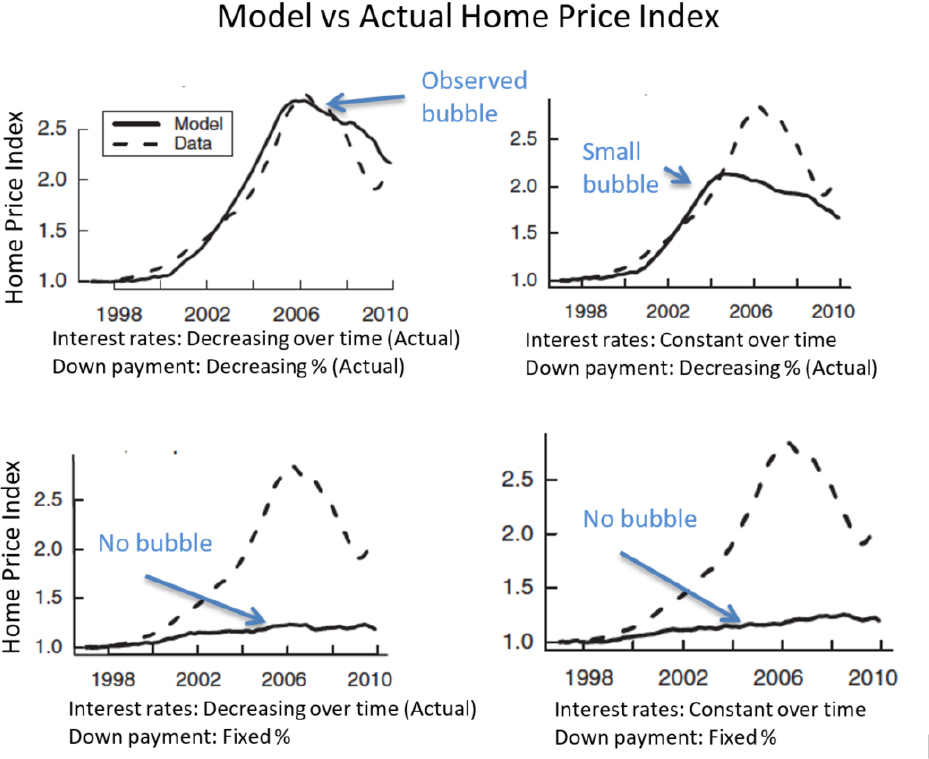
DC, metropolitan area and created an agent-based model of the 2005–2008 housing bubble and its aftermath. As shown in Figure 2.2, the model recreated the bubble given the actual interest rates and loan down payment (leverage) requirements (upper left). It also suggested that fixed interest rates would reduce but not eliminate the bubble (upper right), and that freezing the down payment required would significantly reduce the boom and eliminate the bust (lower panels).
An interesting feature of the U.S. housing bubble is its spatial variability—a handful of cities (e.g., Las Vegas, Miami, and Phoenix) experienced a relatively severe bubble, while other cities (e.g., Dallas) experienced very little rise in house prices. In Canada, Toronto experienced a large increase in house prices but no decline, and thus no bubble. More recently, large price increases in housing in London caused the Bank of England to express concern that that city could be in the middle of a bubble (the Guardian, July 15, 2014) and led to tightened lending standards for mortgages. Models of the type described above can be useful in determining whether price increases in specific cities present significant bubble risk.
EXAMPLE 3: DISEASE OUTBREAKS
In the 1800s, cholera epidemics were common in cities and were thought to be caused by noxious air emanating from rotting organic matter. John Snow mapped cholera death locations in the SoHo neighborhood of London during the 1854 outbreak and noticed a geographic concentration (now called a hotspot) of deaths with a water pump at the center (Snow, 1855). Snow persuaded city leaders to shut down the water pump, and the disease subsided. Snow’s map is an early example of how simple spatial context (distance to water pump) can be used to refine a disease model. Today, modelers consider spatial, spatiotemporal, temporal, and social contexts to study patterns of disease, as exemplified in the 2014 outbreak of Legionnaires’ disease in Portugal. Models are also used to address strategic and tactical questions related to the spread of disease, such as malaria. These examples are discussed below.
Legionnaires’ Disease
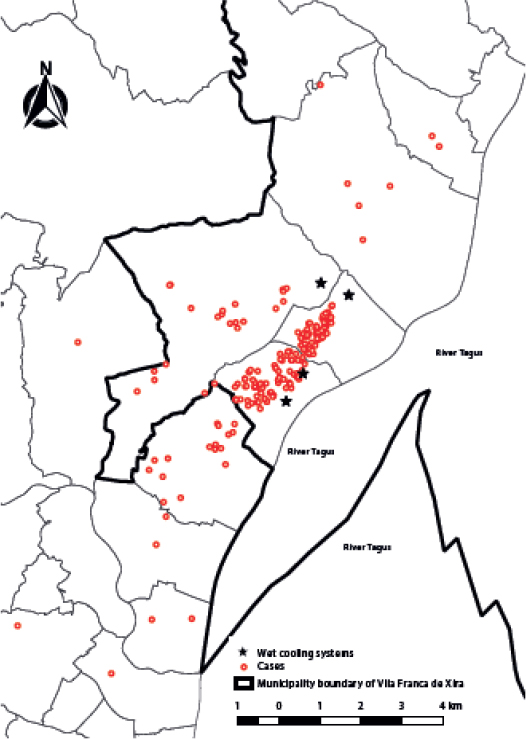
People contract Legionnaires’ disease by breathing in aerosols contaminated with Legionella bacteria. The bacteria grow in warm freshwater environments, such as hot tubs, showers, or air-conditioning units. Legionnaires’ disease usually strikes individuals, not groups. However, in November 2014, 18 patients with Legionnaires’ disease were admitted to two hospitals in the municipality of Vila Franca de Xira, Lisbon, within 24 hours. Within hours, the Portuguese Ministries of Health and Environment convened a multidisciplinary task force to control the outbreak (Shivaji et al., 2014).
Tactical Question: once an outbreak of Legionnaires’ disease occurs, how many cases are expected?
An early estimate of the expected number of cases can help public health officials deploy resources. Egan et al. (2011) used data from a number of historical outbreaks of Legionnaires’ disease to develop an empirical model that convolved infection time and incubation period distributions. In Portugal, the date of onset of symptoms reported by patients was used to estimate the period of exposure to the contaminated aerosols, and thus the date of the contaminant release (Shivaji et al., 2014). Using these results, health officials were able to estimate expected cases and revise their anticipated demand for ventilator systems, one element of the contingency plan for hospitals in the region.
Tactical and Forensic Question: What is the source of the bacteria causing the outbreak?
Legionnaires’ bacteria do not spread from person to person. A disease outbreak can usually be stopped by closing or thoroughly cleaning the source, and so rapid identification of the source is critical for containing the outbreak. In Portugal, analysis of the spatial distribution of the residences of affected individuals indicated that 90 percent lived within 3 km of a wet cooling system (Shivaji et al., 2014; see Figure 2.3). The task force hypothesized that the most likely source of infection was aerosolized release from one or more of these systems, and it used Egan et al.’s model to identify cases whose pattern of illness did not fit with this hypothesis. The patient who developed the earliest symptoms was found to have been involved in maintenance in the wet cooling system towers in the two weeks before onset of symptoms.
Malaria
Strategic Question: what is the expected impact of global warming on malaria?
Malaria is an infectious disease with one of the largest health burdens worldwide. In 2015, there were more than 200 million malaria cases worldwide, and malaria killed more than 400,000 people, most of them children under 5 years old in Africa.4 The impact is so great in African countries that a high incidence of malaria has been associated with reduced economic growth (Gallup and Sachs, 2001). Malaria is transmitted by mosquitos, which require specific environmental conditions to live. Thus, changes in temperature and precipitation affect the distribution and transmission of the disease.
The potential impact of a changing climate on malaria incidence has been studied through process-based and empirical models. Process-based models use equations that express the relationship between climatic variables and biological parameters (e.g., mosquito breeding, survival, and biting rates; Plasmodium parasite incubation rates). They are useful for analyzing the climate sensitivity of malaria risk, although at scales much larger than mosquito habitats. Process model results suggest that a small increase in temperature can greatly increase malaria
___________________
transmission (Caminade et al., 2014; Pascual and Bouma, 2009), potentially allowing expansion of malaria to higher-altitude areas and increasing the seasonal duration of malaria in some endemic areas. Empirical models are useful for defining the distribution limits of the disease, although they do not reveal the mechanisms driving climate sensitivity of malaria risk. Empirical models using recorded cases and observed temperature have confirmed the occurrence of malaria in higher altitudes with increased temperatures (Siraj et al., 2014).
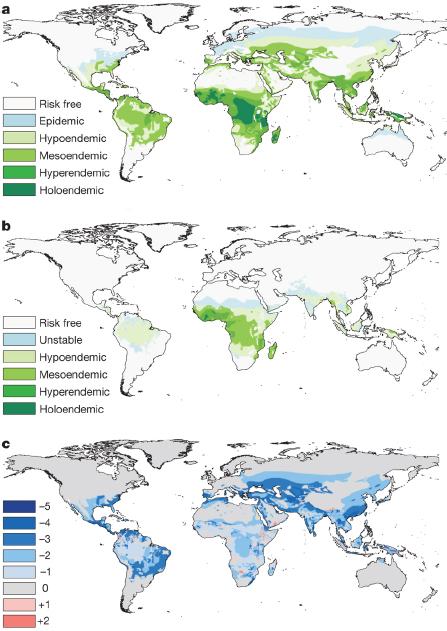
Current models generally overestimate the impact of climate change on the global distribution of malaria. In fact, despite significant increases in temperature, the range of malaria has decreased considerably over the past century, largely due to economic development and disease control efforts (Gething et al., 2010; see Figure 2.4). Climate-induced effects are more consistent with sparse observations in Africa and South America (Caminade et al., 2014), where socioeconomic conditions have resulted in limited interventions. Some areas where mitigation efforts have either been less intensive or been reduced have seen a resurgence of malaria (WHO, 2012). Thus, inclusion of socioeconomic factors with climate impacts is critical when using models to support policy decisions.
Tactical Question: Can likely outbreaks of malaria be forecast with enough lead time to position resources to mitigate the effects?
Early warning systems for outbreaks of malaria currently rely on monitoring the caseloads of malaria infections. Once a threshold is crossed in number of cases reported, alerts of an epidemic are issued, and resources are repositioned accordingly. As noted above, transmission and infection rates of malaria have been linked to rainfall and temperature variation. For example, epidemics usually emerge in Botswana in the 2 months following the November–February rainy season. This means that longer-term forecasts of temperature and rainfall could potentially lead to better warning systems for likely malaria outbreaks.
Early research (Thomson et al., 2006) has linked the emergence of epidemics to December–February seasonally averaged rainfall and sea-surface temperatures, which enables forecasts of epidemic risk with a month lead time. A growing body of research suggests that integrating monthly to seasonal forecasts of sea-surface temperatures, cumulative rainfall, and temperature variability could extend malaria early warnings 4 to 6 months (Jones and Morse, 2012; Lauderdale et al., 2014; MacLeod et al., 2015; Thomson et al., 2006; Tompkins and Di Giuseppe, 2015; see also NASEM, 2016a). Forecasting malaria outbreaks 2 to 6 months in advance would allow tactical positioning of malaria prevention programs (e.g., spraying pesticides) and resources (e.g., distributing prophylactic drug therapies for target groups during the malaria season, and shifting medical resources to ensure timely and effective care for infected individuals; Myers et al., 2000). Improved modeling capability could help to inform these types of resource allocation choices.
EXAMPLE 4: TENSIONS IN THE MIDDLE EAST
Tensions in the Middle East present a wide range of intelligence community challenges, such as characterizing the actors (e.g., ethnic groups, stakeholders, and emergent leaders) in covert groups and their relationships; assessing the potential for various types of attacks; and evaluating changes and trends in dynamic geopolitical environments. The data needed to tackle these challenges are so distributed and the situation is changing so rapidly that open-source data and rapid assessments are often key. With recent advances in language technology, social network analysis, dynamic network analysis, and agent-based models, it is now possible to develop models from open-source and other data in a semiautomated human-in-the-loop fashion in a matter of days (Carley et al., 2012a; see also Chapter 4).
Strategic Question: Is it possible to predict a violent revolutionary uprising, such as the Arab Spring?
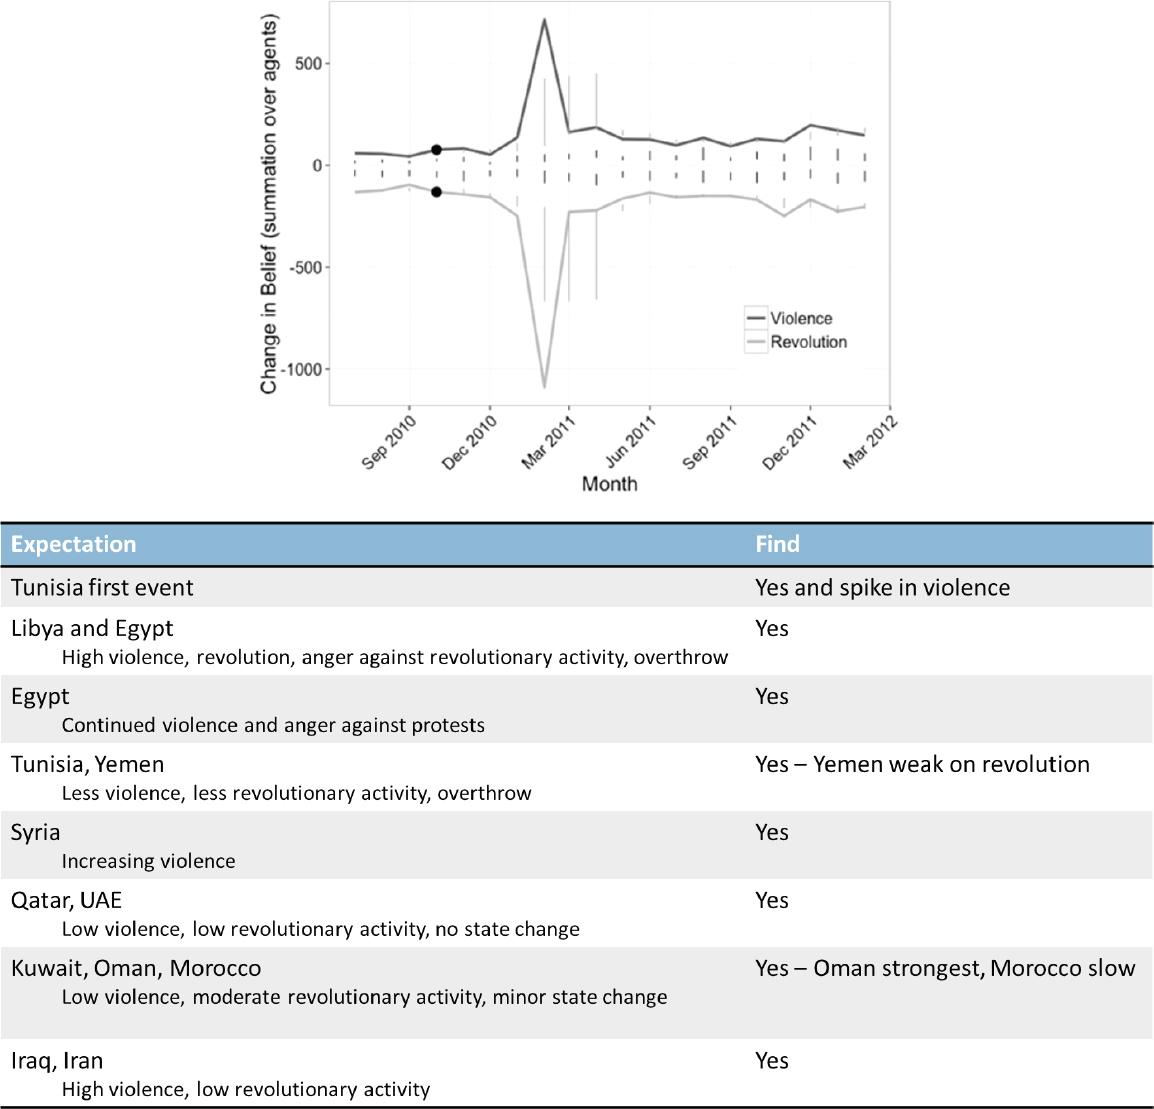
Predictive analysis is needed to position military forces, first responders, or humanitarian aid workers to mitigate or minimize the negative impacts of an uprising. Although such analysis is challenging, a piece of the puzzle can be addressed: Is there any signal in the open-source data that such an uprising is likely? Joseph et al. (2014) explored this question using newspaper articles and agent-based dynamic network simulation for 16 countries associated with the Arab Spring. Their analysis produced forecasts for each country, expressed as monthly trends in the change in two beliefs: the need for revolution (protests, riots, and government overthrows) and the need for
violence. The results were validated against historical data to determine whether the predicted trend first peaked in the months precipitating the violent revolutionary event, or whether there were no peaks or other eventualities. Figure 2.5 shows how the model fared against the key initiating events in these countries. The model correctly predicted revolution would not occur in the six countries only tangentially involved in the Arab Spring (low and sometimes decreasing revolutionary activity). In addition, the model correctly predicted revolution in three out of four countries whose governments were overthrown (high levels of revolutionary activity and high violence) and correctly predicted lower levels of revolutionary activity in six countries whose governments are still in place. An increase in relevant topics appearing in newspapers, a shift to more violent topics, and an increasingly dense network of actors were key to predictive skill.
It is important to recognize that these are very high-level predictions. For example, the model predicted that the peak in violence and revolutionary activity would occur in Tunisia prior to the other countries. It did not, however, predict the trigger event—the self-immolation of Mohamed Bouazizi, a street vendor, in response to his treatment by authorities.
Forensics Question: was the 2012 attack on the Benghazi consulate planned or the result of a spontaneous anti-U.S. protest?
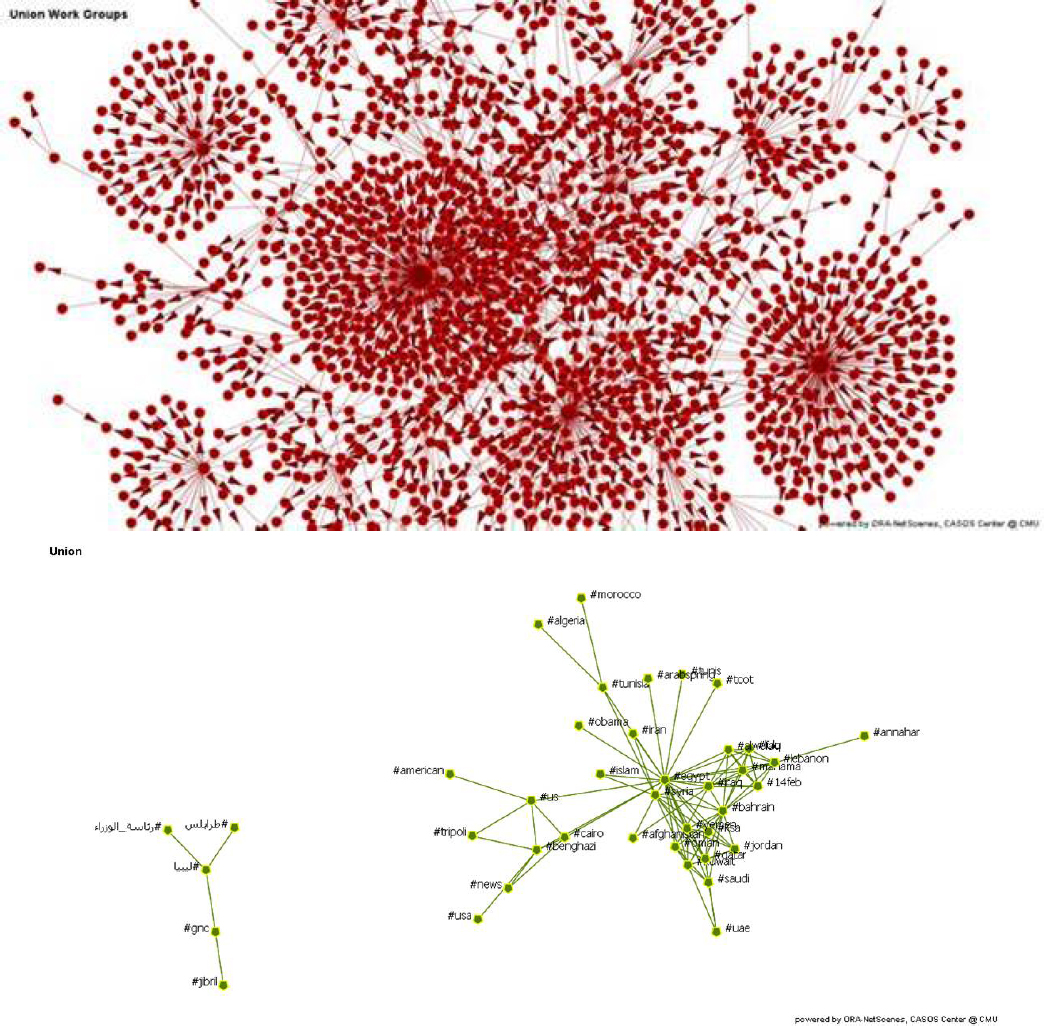
The same historical data and network models used in the Joseph et al. (2014) study predicted the September 2012 attack on the Cairo embassy, but not that on the Benghazi consulate. Network analytics can help show why. News and Twitter posts as the events were unfolding showed that the two events had very different footprints in the open-source data (Carley et al., 2014). A set of models for each attack was developed in less than 4 hours and then updated every 4 hours. Figure 2.6 shows a Twitter retweet social network (top) and a topic network based on hashtags (bottom) for Benghazi. Retweet networks are a common way of tracking tweeters of disproportional influence and the flow of a “story.” Hashtag networks are a common way of tracking the connection among ideas, and examining how the “story” changes across groups, locations, and time. These models showed that in Benghazi, and less so in Cairo, the key actors in the retweet network were news agencies. When the Benghazi consulate was attacked, news articles quickly appeared questioning the role of the movie The Innocence of Muslims on the attack. However, there was no mention of the movie prior to the event, and all references to the movie after the attack began with news agencies. Twitter data showed some mention of protest prior to the Cairo embassy attack, but none in the Benghazi consulate attack. The results suggest that the Cairo embassy attack was a spontaneous uprising, whereas the Benghazi attack was planned.
This example shows how network analytics and language technology can be combined for rapid forensic assessments in the immediate aftermath of the event. Key challenges include using sources from multiple languages (including recognized languages and variants used in social media tools, such as replacing certain sounds with numbers), reconciling differences in data in English and non-English press, identifying the key stakeholder groups and the relations among them, and merging data from diverse sources in near real time.
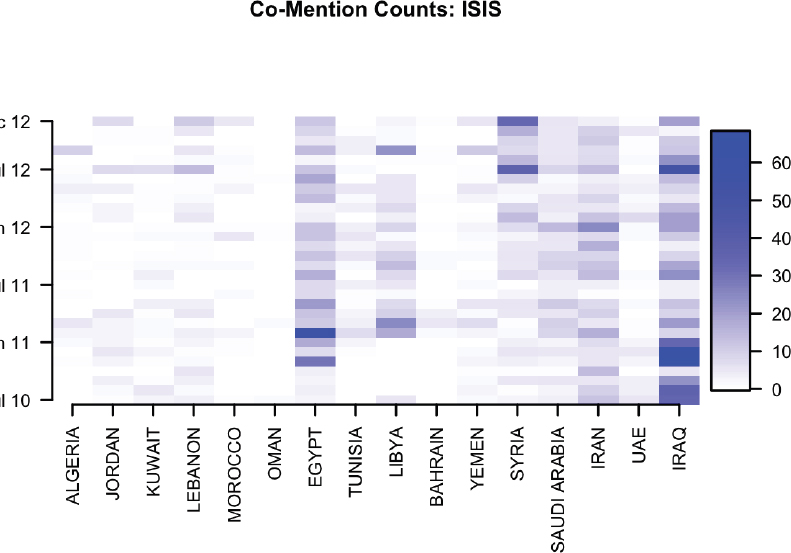
Tactical Question: what are the relations among the major ethnic and political groups surrounding the Islamic State in Iraq and Syria (ISIS)?
To determine how to respond to ISIS, it is important to know who are the key groups or actors, how they are related, the basis for their power, and which group can be expected to influence which other group. One might begin by developing a list of all relevant groups—terror groups, militias, political groups, and ethnic groups—and then using network models to identify the relations among the groups. With geospatial intelligence data, such an assessment can provide insight into which groups are highly relevant in which countries. For example, Figure 2.7 shows the prevalence of discussions about ISIS per country over time. Discussion about a group is generally a reasonable indicator of their presence in a region.
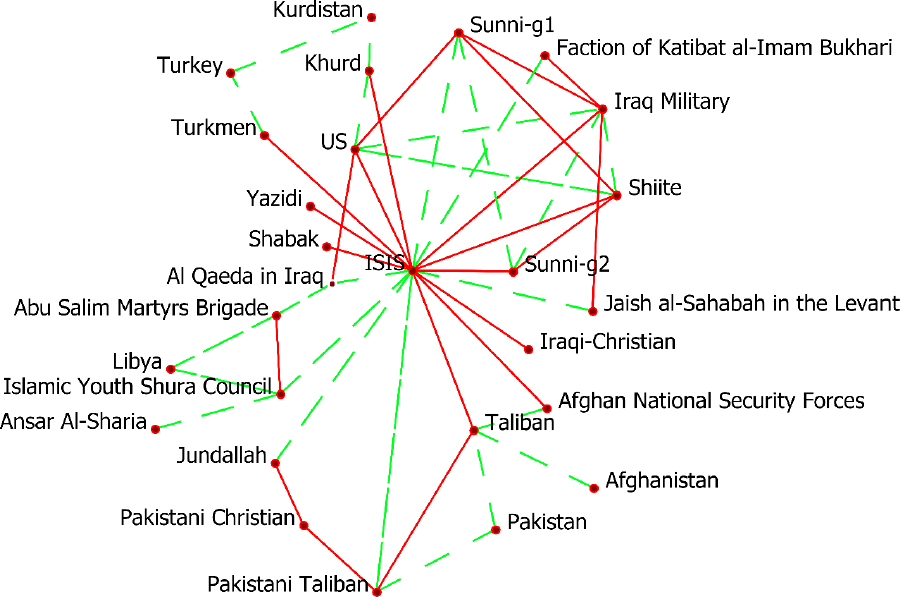
Network models can also provide insight on influence and power. For example, the copresence of particular groups in articles is often used as a measure of relations among those groups. Figure 2.8 is a network diagram illustrating alliances and hostilities of some key groups to ISIS, based on 75 online news articles and open-source reports discussing ISIS and its relation to various groups between January and October 2015. The diagram shows that ISIS has built alliances with a large number of groups, whereas the groups opposed to ISIS are less centrally coordinated and may be hostile or indifferent to one another.
Key challenges in such an analysis include setting the strength of and confidence in the links, understanding the basis for links and predicting changes in them (e.g., identifying and visualizing the underlying sociocognitive map), assessing regional differences in groups (e.g., Sunni groups have different concerns and different levels of commitment for or against ISIS and the Iraqi military, based on their level of religiosity and location), and identifying new groups as they emerge.
EXAMPLE 5: FOOD AND WATER SCARCITY
A growing population and increasing income, especially in the developing world, is increasing global demand for food, water, and energy. Agricultural demand, for example, is projected to increase 60 percent by 2050, relative to 2005 levels (FAO, 2012). These trends—along with the interdependent nature of food, energy, and water, as well as their sensitivity to external factors such as climate change—pose significant challenges for managing critical resources. For example, increasing the production of biofuels increases water demand and shifts water resources away from food production. Because decreases in food and water have the potential to exacerbate humanitarian crises (Clapper, 2015), understanding the future evolution of these systems and their interactions is critical.
Strategic Question: what regions are vulnerable to food and water shortages in the future due to interactions between food, energy, water, and climate?
Traditionally, energy, food, and water systems have been planned, developed, and analyzed independently. However, integrated assessment models, which couple representations of physical and social systems, are beginning to be used to understand some of the interconnections and interdependencies between water and other systems and to project future outcomes for food, energy, and water. For example, three integrated assessment models have recently been expanded to include water, enabling the impact of changes in population, income, technology, and climate on the supplies and demands for water, energy, and food to be assessed. Such models are used by a variety of government agencies (e.g., the U.S. Department of Energy and the U.S. Environmental Protection Agency) and
nongovernment organizations (e.g., the World Bank and ExxonMobil) to analyze the effect of technology, policy, and climate on economic systems.
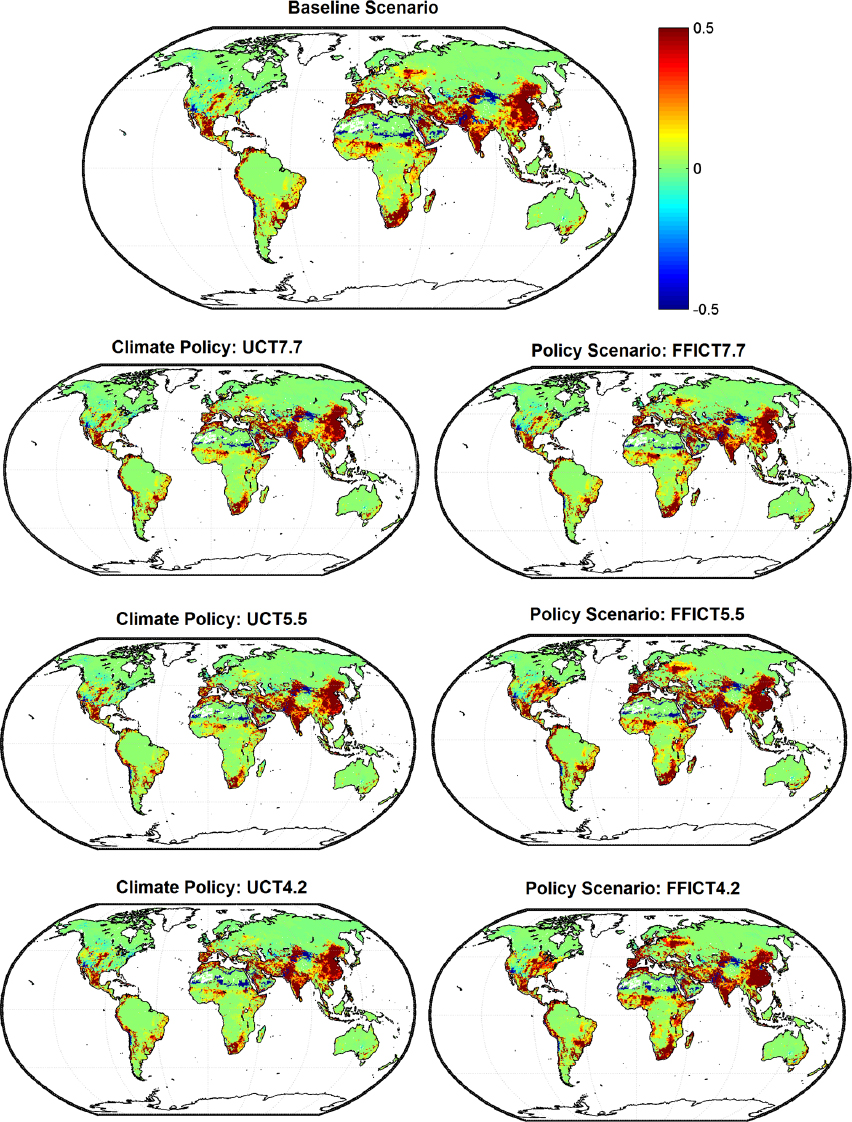
Analyses using these models have quantified the expected amount and distribution of future water scarcity around the world under different scenarios (Hanasaki et al., 2013; Hejazi et al., 2014; Schlosser et al., 2014). These studies calculated scarcity as the ratio of water desired (i.e., demand if water were unlimited and free) to the amount of water that is actually available. Water desired was determined using an integrated assessment model, which accounts for future changes in population, income, energy demand, agricultural demand, and other factors. Water supply was determined using hydrology models (e.g., monthly water balance models), which simulate runoff and streamflow under different climatic conditions. The results suggest that increases in water demand and changes in water availability in regions such as India and China may lead to increased water scarcity in those regions (e.g., Figure 2.9).
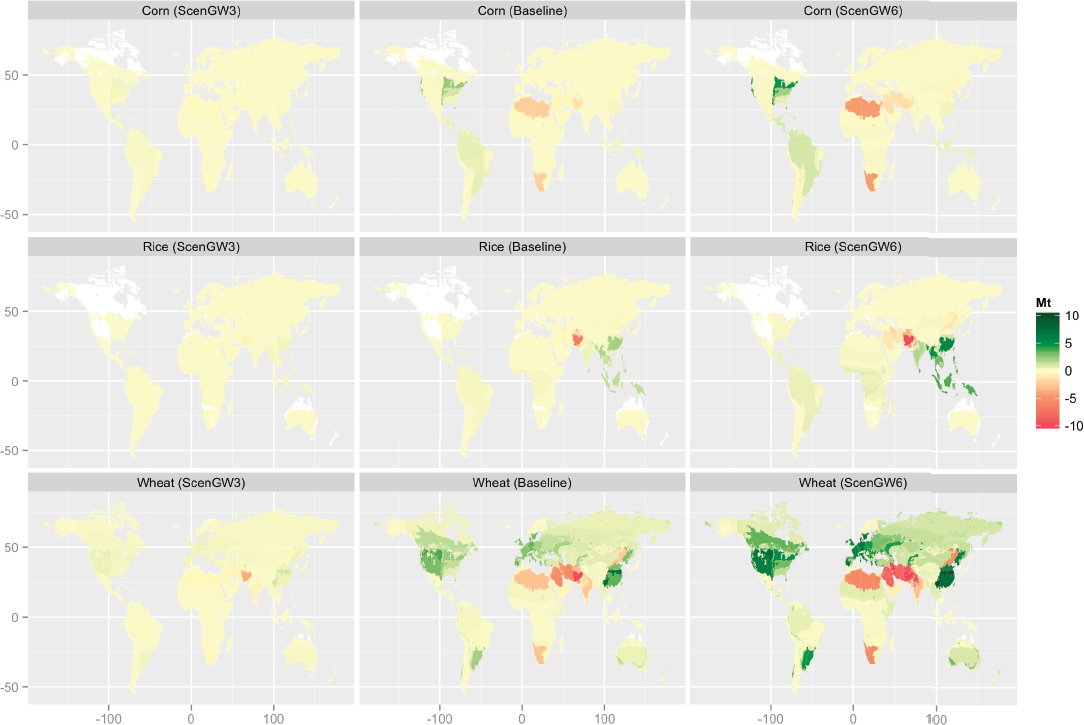
The same models were used by Kim et al. (2016) to examine the effect of limited water availability on agricultural systems, but in this case, water prices were adjusted to prevent the demand for water from exceeding the supply in any region. Thus, higher water prices in a particular region would indicate higher water scarcity, and cause reductions in the consumption of water-intensive goods and shifts in agriculture production. Figure 2.10 illustrates future shifts in the production of corn, rice, and wheat under three scenarios: lowest-cost groundwater, highest-cost groundwater, and baseline median estimates for groundwater cost. The figure shows that increased water scarcity forces the greatest shifts in the regional production of food, and that reductions in crop production in a water-scarce region are offset by increased crop production in regions with more abundant water.