
3
Model Foundations
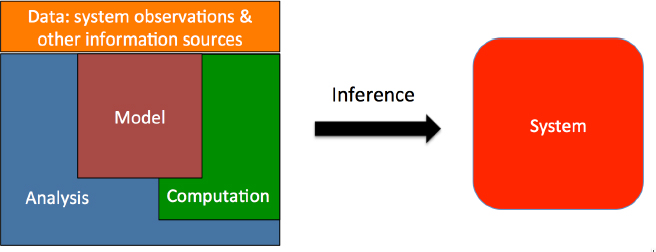
Models do not stand alone, but rather exist in an environment that includes the data available, the computational and data infrastructure, methods for analysis and model assessment, and tools for interpretation, visualization, and understanding. In addition, the system needs people skilled in choosing, tailoring, and running the models and interpreting their output. Together, these elements provide a basis for making inferences about real-world systems (e.g., Figure 3.1). This chapter provides an overview of these elements, using key issues and questions to illustrate how the National Geospatial-Intelligence Agency (NGA) could think about them from a practical standpoint. The first section focuses on models, including whether to develop new models or use existing models and what types of models to use in the investigation. The second section focuses on data, including sources and methods for handling them in the analysis. The third section covers assessment of a model’s connection to the real-world system, with particular emphasis on verification, validation, and uncertainty quantification. The fourth section examines what types of computation (e.g., high performance, data intensive, and spatial) are necessary for an investigation. The fifth section includes a discussion of tradeoffs among these elements, which influence the type of information provided, the time or cost required to provide it, and the ability of end users to analyze and understand the results. The chapter ends with a brief summary and conclusions.
MODELS
The complexity of real-world physical–social systems makes it virtually impossible for NGA to build and maintain all the models that would be useful for producing geospatial intelligence. Consequently, an overarching question to be addressed before embarking on any modeling approach is the following:
Can “off-the-shelf” models be used in the investigation, or do new models have to be developed?
Developing a model from scratch makes it possible to produce output that directly addresses the goals of a model-based investigation. Relatively simple models can be easier to build than to adapt from existing models. In contrast, development of complex models is often a resource-intensive, experts-only task, requiring design, coding, debugging, testing, verification, validation, and documentation. If these tasks are not done thoroughly, the resulting model or software might be usable only by the developers and may become fragile or unusable when those individuals move on to other assignments. Using existing model output or previously developed models can greatly reduce the costs of the investigation. Previously developed models will also likely have undergone some quality checking, verification, and comparison to actual system data. However, because they were developed for a different purpose, existing models or model output will likely need some adaptation or augmentation for the investigation at hand. Advantages and disadvantages of developing models, combining existing or new models, using existing model output, and running an existing model are outlined below.
Developing models. If appropriate system models are not available, they will have to be developed. Model development takes into account the purpose of the model, the system to be explored, computational and data constraints on the investigation, and the acceptability of the various approximations available. Model purposes include exploring the range of possible outcomes, making predictions, developing theory, explaining phenomena, and filling in missing data. Choices about the model development include the following:
- Which phenomena and behaviors need to be captured in the model, recognizing that it is not necessary or feasible to model everything;
- The granularity, resolution, or fidelity needed to properly represent (for the model’s purposes) each of those phenomena or behaviors, and whether this varies with space and/or time;
- Issues of representation, such as spatial and temporal dependencies (e.g., autocorrelation and heterogeneity) that need to be captured, whether the model should be deterministic or stochastic, and whether it should be steady state or evolving according to physical, social, or empirical rules;
- What aspects of the model should be based on empirical data, which should be based on theory or rules, and what level of empiricism is acceptable; and
- How the submodels will be combined, including what types of coupling and feedbacks are necessary.
Models may also be developed within a preestablished modeling framework, which avoids having to create the full infrastructure and all metrics from scratch. With this approach, the model developer first selects a framework that has the features needed for visualization, metrics, and data handling (e.g., Stella or i-Think for system dynamics, NetLogo or Repast for an agent-based model, and ORA or R for a network model). Then the model is built in the framework, the analysis is carried out, and the results are presented as images, maps, diagrams, or other visual depictions. In general, modeling frameworks that are interoperable with many other tools and that have a wide range of allowable input–output formats are preferred.
NGA deals with systems that evolve in time and space, and it also needs to make sense of large volumes of empirical intelligence data. Example questions associated with some of these issues are discussed below.
Does the investigation require analysis methods to account for spatial, space-time, or network dependence structure?
Perhaps all models and data of interest to NGA have a spatial, space-time, or group or social network dependence structure. Examples include geospatial data, social media data, specialized spatial data or geo network models, or output from a social system model evolving in a spatial environment. If the system exhibits spatial or network dependence, standard statistical approaches that rely on independence of the observations and entities will not be appropriate for analysis. Rather, specialized methods are used for spatial analysis (Shekhar et al., 2011), machine learning (Bishop, 2006), and network analysis (Kolaczyk and Csárdi, 2014; Scott, 2013; Wassermand and Faust, 1994). Use of these methods requires computational approaches that can deal with space-time data and systems, huge databases and intricate calculations for estimating network properties, or specialized metrics and algorithms, such as those developed for spatial network data.
Are empirical models, process models, or some combination needed for the investigation?
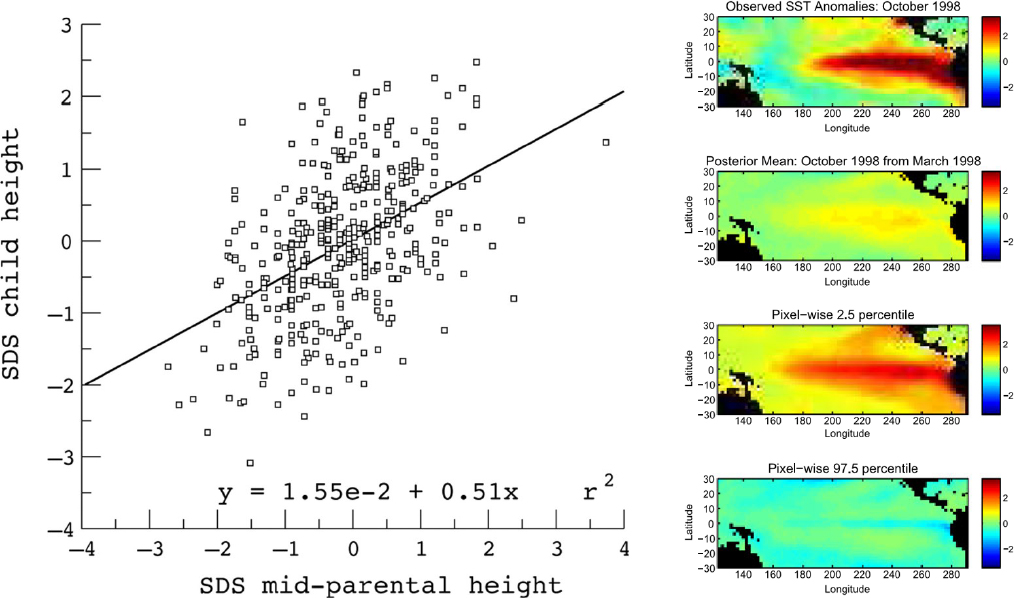
Empirical models combine system data with simple mathematical models to lend insight about the system. A simple empirical model relating the heights of parents to those of their offspring is shown in Figure 3.2 (left). A more complicated dynamic empirical model of sea-surface temperatures, which produced a reasonably accurate forecast of the 1997 El Niño event, is shown in Figure 3.2 (right). Empirical models are often used for describing “normal” behavior, which is helpful for detecting anomalies. The Legionnaires’ disease example in Chapter 2 used empirical concepts to help locate the geographic source of the outbreak.
In contrast to empirical models that do not attempt to represent the inner workings of a system, process models are typically built to simulate the processes and behavior of physical or social systems, which often evolve over time. Such models, which can be based on theory (e.g., equations of fluid flow) and/or rough rules (e.g., presumed response of individuals to a situation for which no data exist), examine the possible responses of a system to changes in conditions. Components can be coupled to allow two-way interaction, and interactions that determine the response of a system to a disturbance (feedbacks) should be represented. Developing process models is typically demanding and involved. If many components and feedbacks are required to represent the system, model development will require substantial labor, time, and computing resources.
Model run time is also an important consideration, because model-based analyses can require anywhere from tens to millions of model runs or be so complex that days to months are required to complete the simulation. Run time can be reduced by increasing computational resources and efficiency or by developing reduced models. Reduced models use coarser, simpler, or fewer representations of processes than a full model. They could be based on simpler mathematical representations (e.g., reduced-order models; Willcox and Peraire, 2002), a few processes (e.g., motivated metamodels; Davis and Bigelow, 2003), or a response surface trained on an ensemble of full model runs (e.g., emulators; Sacks et al., 1989). Developing a reduced model that captures only the most important features for the application at hand may prove advantageous for analyses that require many model runs or long simulation times.
Most computational models are not based solely on first principles; rather, they contain many empirical specifications and parameters that help define the system being studied. As understanding increases, the number of components and feedbacks that are represented in the model, rather than specified empirically, tends to increase (e.g., Figure 3.3). Such complex models strike a balance between retaining process fidelity (consistency of subsystem models with observations of process-specific variables) and system calibration (consistency of the system with observations of system-level variables). Complex model systems can be relatively brittle and challenging to construct, but the effort is warranted by the confidence that the calibration does not drive the system out of consistency with observations at the process level. In other words, the model will not produce the right answer for the wrong reasons, simply by tuning.
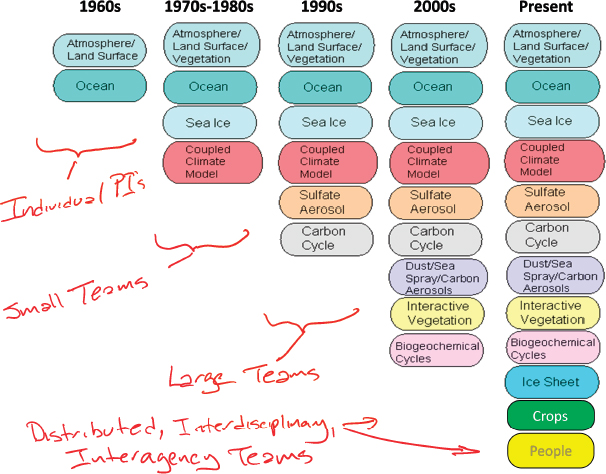
Combining models. Models built for different purposes, using different techniques, or simulating different types of subsystems are often combined into a larger model of a real-world system. The ability to use diverse models together is referred to interoperability, and the selection and combination of relevant models to generate meaningful results is referred to as composability. Combining multiple models allows more aspects of the system to be modeled and explored, supporting the formulation of additional conclusions, but it also requires more teamwork, because a team of model developers is often needed for each submodel (e.g., Figure 3.3). Having an arsenal of subsystem models (e.g., representing different processes and containing different levels of detail or resolution) that could be combined for different purposes could make it easier for NGA to rapidly provide information on emerging threats. Consequently, a key question is the following:
How should multiple models be combined for the investigation?
Combining multiple models to represent a complex system is challenging because the behavior of a complex system cannot be expressed as a sum of the behaviors of the components or subsystems; complex interactions and feedbacks between processes can dominate system evolution. Effectively representing the information that must travel between subsystem models to establish feedbacks and interactions also poses semantic and software challenges. For example, common, compatible representation and language are needed to correctly align dynamics and express information in coupled domains. In addition, most models are not designed to be used in plug-and-play architectures, and standards and protocols for interoperability and composability (covering technology, syntax, semantics, etc.) need to be developed (Davis and Andersen, 2004; Hofmann, 2004). Finally, significant software challenges arise from building, executing, and analyzing a complex model—often containing submodels with different spatial and temporal domains, different resolutions, and different data sources—in a distributed computing environment. Combining these models often involves a data fusion exercise.
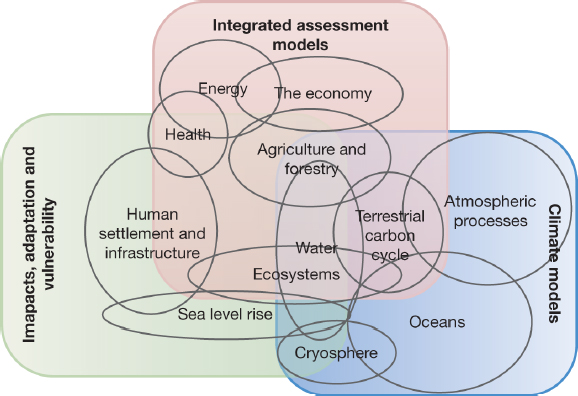
Obtaining useful results from combined models depends on appropriately capturing the interactions among the different subsystems, which may be used in parallel, as inputs of one subsystem for another, or as joint contributors to a third (see Appendix A). Figure 3.4 illustrates the linkages among diverse submodels that must be properly represented in a comprehensive model of the human–climate system. A key consideration is how strongly the subsystem models being combined are expected to couple and interact with one another. The pirate example in Chapter 2 illustrates one-way coupling, because outputs of the weather and wave model serve as input to the pirate behavior model, but the pirate activity does not feed back to the weather model. In the housing bubble example, households, banks, and their economic environment all interact with one another as the system evolves.
Using existing model output. Perhaps the simplest way to exploit a model is to use output from previous model runs. For example, existing weather and wave forecasts were used to help predict the likelihood of pirate activity (see Chapter 2). A key disadvantage of using existing model output is the lack of control and the lack of knowledge about what went into the model, especially when documentation about the quality assurance and assessment procedures is sparse. In some cases, the model developers may be available to discuss these procedures as well as the pros and cons of using their model output for the investigation at hand. They may even be willing to carry out additional runs to support the investigation.
Analyses of model output from a coherent ensemble—such as a collection of model runs from different models that simulate the same system, or a collection of model runs that systematically vary model inputs or parameters—can provide a fuller picture of the behavior of that system. And when multiple models provide similar results, confidence in the results increases. Knowing that an ensemble of model runs will be required will affect how a model is selected or developed for the investigation. Consequently, a relevant question is the following:
Will model-based analyses require ensembles of model runs?
A number of climate investigations make use of model output collected in the Coupled Model Intercomparison Project repository.1 For example, Tebaldi and Knutti (2007) and Smith et al. (2009) used the output to develop hierarchical models to project future climate behavior and to quantify uncertainty in the projections. Such approaches have also found success in weather forecasting (Raftery et al., 2005). Precomputed ensembles of model runs are also used for model calibration (Higdon et al., 2008; Kennedy and O’Hagan, 2001), sensitivity analysis (Helton, 1993; Saltelli et al., 2008), uncertainty propagation and analysis (Oakley and O’Hagan, 2002; Spanos and Ghanem, 1989), and approximate Bayesian computation (Beaumont, 2010; Fearnhead and Prangle, 2012). For example, both the pirate and the housing bubble examples in Chapter 2 make use of sensitivity analyses produced from ensembles of model runs. The availability of computational resources will affect how such ensemble-based analyses are carried out.
When models are empirically driven, as in the Middle East example in Chapter 2, an ensemble can be created using bootstrapping and sampling techniques. For simulation models, these ensembles are created by varying the parameters through a distribution and the results can be thought of as showing the range of what is feasible. For more empirical models, such as network models, the ensembles are created by sampling from existing data and can be thought of as showing the robustness of the metrics and model result to missing data.
Setting up and running an existing model. When a model is useful, but the existing output is not appropriate for the investigation, a new computational run or ensemble of model runs can be specified and carried out. An input file (or files) typically specifies initial and boundary conditions, along with key model parameters. Once initialized, the model can be run, producing a file (or files) containing the model’s output. Scripting languages, such as python or R, can be used to carry out runs over different input configurations, producing output for sensitivity studies or other analysis. The DAKOTA software from Sandia National Laboratory (Eldred et al., 2007) has utilities for managing many model runs on a variety of computing systems, as well as a collection of analysis capabilities to process the resulting model output.
Existing models can be run using an iterative approach, in which the results of the model run (or ensemble of model runs) are used to determine a new input setting (or settings) for the next model run. Examples of analysis methods that make use of this iterative running of models include the following:
___________________
- Analysis methods for inverse problems (Kaipio and Somersalo, 2006; Tarantola, 2005),
- Model calibration and optimization approaches (Eldred et al., 2007), and
- Data assimilation approaches (Courtier et al., 1994; Evensen, 2009).
Iterative methods have proven effective for successive computational model runs that can be carried out relatively quickly (e.g., fractions of a second, or minutes). If the investigation requires a complex model with a large set of inputs, even high-performance computing resources may not be sufficient to make this approach feasible. Strategies to speed the required iterations include linearization (e.g., Kaipio and Somersalo, 2006), use of reduced models, and use of adjoint or derivative information to facilitate the parameter search (Butler and Estep, 2013; Martin et al., 2012).
DATA
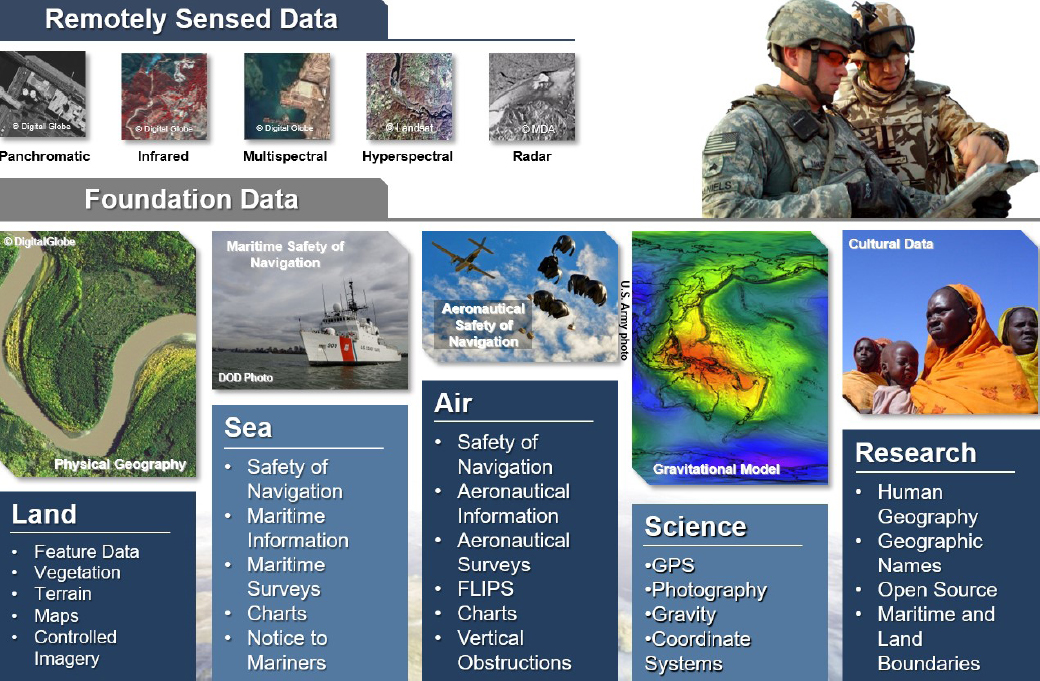
Data—measurements or observations of the real-world system—link the model to the real-world system it is intended to represent. Nearly all data of interest to NGA have a geographic or locational component (see Figure 3.5). However, the sheer variety of these data—collected at different scales and for different purposes and stored in different formats—poses challenges for finding relevant, high-quality data, integrating them into a model-based investigation, and accounting for their nature in the analysis. Example questions concerning data sources and methods for ingesting data into the analysis are discussed below.
What data are available for the investigation?
NGA’s geospatial intelligence mission is focused on places and activities outside of the United States. A wealth of environmental data is readily available from satellites, scientific sampling campaigns (e.g., Argo ocean floats), and intergovernmental agreements (e.g., meteorological and hydrologic data from the World Meteorological Organization), particularly at global and regional scales. Higher-resolution environmental data as well as data for areas with limited scientific infrastructure (e.g., Africa) are comparatively sparse. Relevant social system data are available from experiments (e.g., natural experiments for observing social systems under different conditions [Rutter, 2007]), administrative and economic records, newspapers, and social media. For social media data, it may be difficult to determine what data are available as well as what data can be extracted and by whom. For many types of data, access is restricted due to privacy, confidentiality, competitive advantage, or national security issues.
It is important to understand how the data were collected, their potential sources of error and bias, and their quality, especially for data that are directly relevant to the key questions of interest. For remotely sensed data and imagery, which are central to NGA investigations, it is necessary to account for positional accuracy, blurring properties, registration errors, and spatiotemporal resolution to properly integrate the data into a model-based analysis. In addition, data products derived from these sources (e.g., land cover classification) will have their own uncertainties that may need to be accounted for in subsequent analyses.
When data collected from diverse sources are used, care has to be taken to account for the temporal, spatial, or sociocultural contexts of the data so that the data can be used collectively in a model. Particular data sources may have biases, errors, or uncertainties that are not known a priori. Tailored models that account for the possibility of systematic errors, biases, and outliers in some data sources may be needed to better represent the uncertainty. This will reduce the chance that otherwise plausible conclusions are discarded because they are not consistent with an unreliable information source.
The quality and accuracy of the available data can also affect how the model-based investigation is scoped as well as the robustness of the conclusions. If high-quality, directly relevant data are available, it may be preferable to use simpler, data-driven models to answer key questions. The use of directly relevant, but diverse, data can also lead to more robust conclusions; and capturing that diversity may require more detailed modeling and analyses. If only indirect system data are available, inverse models or other model-based analysis approaches are required to make inferences about features of interest in the real-world system. Special computing infrastructure and methods may be required to search through various sources of data and associated metadata, determine what data may be useful for a particular investigation as well as their nature and pedigree, and store particularly relevant data and analyses for future investigations.
How will data be ingested in the model-based analysis?
The nature of the data drives how it is handled in a model-based investigation. Data may be massive, requiring special cyberinfrastructure (cloud, high-performance, or high-throughput computing) to process; they may be streamed at a high rate, requiring specialized analysis approaches to carry out estimation tasks with a single pass through the data; they might accrue over time (e.g., hourly or daily), requiring data assimilation; they might be observations from a single experiment, requiring an inverse analysis; and they might not exist at all, requiring expert judgment to inform the models. Often modeling approaches, analysis methods, and computational infrastructure need to be developed in concert to efficiently leverage the data being collected for the investigation.
Ingesting geospatial information into models raises special considerations. For example, many physical process models, such as general circulation models, use a spherical reference frame to specify locations on the surface of Earth. However, geospatial intelligence applications require more accurate representations of Earth, such as ellipsoid representations and nonparametric representations that use land-based geodetic reference points for localization. In addition, general circulation models often use raster-type data to organize geospatial information
as a matrix of cells (e.g., in a latitude–longitude grid), each of which contains an information value such as temperature. In contrast, geospatial information comes in many forms, including raster (grid), vector (e.g., objects such as points, lines, and polygons), and network (e.g., a collection of nodes and edges to represent a mathematical graph). For example, a map of water bodies in vector format may use points to represent locations of wells, line strings to represent center lines of rivers, and polygons to represent the footprint of lakes. An urban street map in graph format may include nodes to represent road intersections and edges to represent the road segments connecting adjacent intersections.
Data often require some form of preprocessing to be useful to a modeling effort. For example, the Middle East example in Chapter 2 used processed text data from newspapers, Twitter, and other media to determine linkages among social and political entities. Most sensors record electronic quantities, such as voltage, that need to be processed and modeled to turn them into properties reflective of the real-world system, such as temperature. In climate and weather modeling, it is common to produce data products, which combine raw measurements with modeling to yield something close to raw observations, but interpolated over a regular, spatial grid. Figure 3.2 (right) is an example of such a data product.
A number of methods can be used to ingest data into the model. Perhaps the most basic approach is to “preingest” the data within the model itself, producing model results that have been constrained to match known databases. The model has to be set up appropriately for the investigation (e.g., specify initial and boundary conditions), but a formal model calibration and uncertainty assessment may not be required. An example of this approach is the MCNP-X model (Hendricks et al., 2008), which simulates the transport of nuclear particles through specified materials. The code makes use of a large, vetted database of nuclear cross-section experiments, and so it is not necessary to determine scattering properties of various nuclear particles in different media.
More commonly, some form of analysis is used to combine a model with system observations (and perhaps expert judgment). In cases where the observations are fixed (e.g., static, historical measurements), model calibration approaches (Kennedy and O’Hagan, 2001) and inverse methods (Tarantola, 2005) can be used to estimate uncertain model parameters or uncertain initial or boundary conditions. Uncertainty quantification tools such as model emulation (Conti et al., 2009; Sacks et al., 1989) and sensitivity analyses are often useful in such exercises. In cases where the model needs to be updated repeatedly to produce time-sensitive predictions, data assimilation techniques are used to infuse data into the model. U.S. numerical weather models, which produce weather forecasts every 6 hours, are a classic example.
MODEL ASSESSMENT
In any model-based investigation, it is crucial to understand the strengths and weaknesses in the model’s connection to the real-world system. The processes of verification and validation have a long history in supporting the broader task of model assessment, particularly in the engineering and physical sciences (NRC, 2007b, 2012; Oberkampf and Roy, 2010; Oberkampf et al., 2004; Pace, 2004). Verification assesses the adequacy of the computational model’s fidelity to the mathematical model, and validation assesses the adequacy of the computational model’s representation of the real-world system. When data are not available for quantitative comparison, assessment may include comparing different modeling approaches or qualitatively comparing model results with process understanding to map out what features of the model are trustworthy and how the model and reality will likely differ. Uncertainty quantification also supports model assessment by estimating uncertainties in model-based predictions (e.g., Smith, 2013). Example questions concerning these model assessment tasks are discussed below.
How will verification, validation, and uncertainty quantification be carried out to support model assessment?
How model assessment tasks are carried out depends on the properties of the model, the availability of relevant data, and the nature of the key questions in the investigation. Verification can be a demanding and involved process
for large-scale computational models of physical processes, which use iterative algorithmic schemes to solve large systems of differential equations (Oberkampf and Roy, 2010; Roache, 2002). In contrast, verification is less of an issue for empirical models, because the mathematical representations are relatively simple and tested in software. Validation of empirical models focuses on how representative the data used to estimate parameters are for the key questions of the investigation. Here, standard model checking approaches from the statistical and machine learning literature are relevant, such as holding aside some data for final checking. Uncertainty quantification is typically built into the models (e.g., statistical models commonly produce prediction and parameter uncertainties). Models can also be built to facilitate assessment, in particular by constructing them to export data into the same analysis tools used for the relevant real-world data. Many modeling frameworks have such built-in analysis toolkits.
In extrapolative (i.e., new, outside of previously tested or observed conditions) settings, validation and uncertainty quantification can be challenging; this holds for speculative models of social systems as well as for process-based models based on well-understood theory. This is because common approaches assume some form of process stationarity (i.e., tomorrow will be like yesterday) and continuity (the system changes slowly in time and space) to estimate model errors and quantify prediction uncertainties. When the real-world system has evolved to a new regime, making present behavior unlike past behavior, these approaches for validation and uncertainty quantification are not appropriate. Examples of assessments of agent-based models appear in the work of North and Macal (2007).
In dynamic environments, the model needs to be updated repeatedly with new data. The methods required to assess these models are often relatively intricate, requiring approaches to update estimates and uncertainties, often in real time, and often involving large volumes (e.g., gigabytes to terabytes) of data. However, the repeated arrival of new data presents an opportunity to directly compare model predictions to reality.
Models built for different purposes or using different frameworks are often used in a multimodeling framework as a form of validation and/or confidence building. In particular, if all models suggest the same outcome, then one can have greater confidence in it. Using multiple models from diverse theoretical traditions can provide a more nuanced solution that is not biased toward a single theoretical viewpoint. However, such multimodel frameworks require teamwork to build.
A related challenge is the assessment of models that combine separate subsystem models. Even if assessment methods may have been applied to the separate subsystems, their interaction will likely lead to new behavior. Once coupled, the full system model will need to be assessed to ensure that couplings and interactions are sufficiently realistic and capture the key features of the real-world system. Software quality checks are also helpful since errors and bugs may creep in as subsystem models are combined.
How large will the difference between prediction and reality likely be?
Uncertainty quantification is commonly associated with the task of attaching uncertainties to model-based predictions. Uncertainties arise from a variety of sources, including (1) measurement errors in the data, (2) uncertainty in model inputs (e.g., initial conditions, boundary conditions, and forcings), (3) uncertainty in model parameter settings, and (4) differences between the conceptual model and the real-world system (structural errors). A variety of approaches are used to estimate and represent uncertainty (NRC, 2012). In prediction-focused investigations, uncertainty quantification might involve a detailed analysis, using probability distributions to quantify prediction uncertainties. In more exploratory investigations, uncertainty quantification might involve a sensitivity analysis, exploring a range of possible model outcomes to understand the effect of input and parameter uncertainty. With sensitivity analyses, it is important to consider how changing multiple inputs simultaneously affects the resulting model output (Saltelli et al., 2008). Also, sensitivity analysis exploring different resolutions of modeling (if possible) can help model developers determine the level of resolution required for the investigation (Davis et al., 2008).
The impact of structural errors depends in part on the nature of the system. Nonstationary behavior is common in complex systems, particularly in social systems in which a single, random event can catalyze new system
behavior. Models that track historic data may not be able to track future observations with similar accuracy if the system exhibits such nonstationary behavior, with the system state evolving from one regime to another. In fact, calibrating the model using historic data may lead to less accurate predictions in this new regime. In such cases, models are more useful for exploring future possibilities than for making quantitative statements about prediction uncertainty. Identifying such extrapolative situations is often difficult, but it is crucial for realistic model assessment.
Estimating uncertainty due to structural error is an active area of research (NRC, 2012). In some cases, biases induced by structural errors can be corrected by applying an artificial adjustment factor, effectively adding more empiricism to the model (Bayarri et al., 2007; Kennedy and O’Hagan, 2001). Such artificial adjustments may improve forecast skill (accuracy), but they also undermine the integrity of the model. Patterns of bias depend on the state of the system, and so there is no guarantee that the bias correction will be appropriate under different conditions.
More physically motivated model adjustments for structural errors have also been proposed (Oliver et al., 2015). Perhaps the most popular approach combines results from multiple models, each of which may be consistent with the observations but yields different predictions. The spread of results from these models may better capture uncertainties about what will happen in the real-world system than any one model. Multimodel ensembles, in which different models run the same scenario using identical protocols, are commonly used in climate studies to convey uncertainty in the future climate (IPCC, 2013). This approach, which attempts to discern structural uncertainty in the model representations, is distinct from the more common ensemble methods used to capture uncertainty in inputs (initial conditions or empirical parameters).
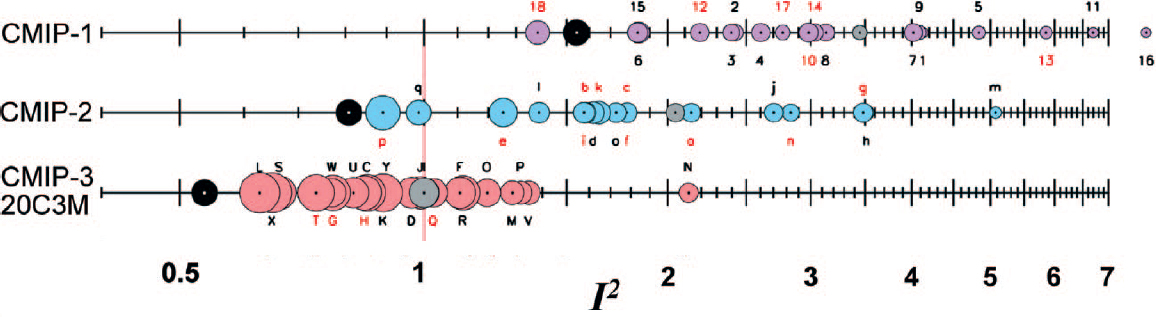
Combined results from multiple models can also produce more accurate predictions. For example, while each of the approximately 20 climate models in the Coupled Model Intercomparison Project (CMIP) had its own biases, the prediction accuracy of the mean across all the models was better than that of any individual model (Reichler and Kim, 2008; see Figure 3.6). Related ideas appear in statistics, where shrinking noisy estimates towards the group average leads to more accurate predictions (Efron and Morris, 1977), and in machine learning, where the adaptive boosting method combines several “weak” models to produce a “strong” algorithm (Schapire, 2003).
Although such model combination approaches have demonstrated some improvement in predicting past observations, there is no assurance of their benefit in more extrapolative settings, where the system state may have moved to a new regime. Indeed, all of the models may have a common bias that will never be removed by
averaging. Moreover, the effectiveness of combined predictions can be eroded by a variety of factors, such as a lack of independence, lack of diversity, and social influence (Lorenz et al., 2011).
Some important features of a model-based investigation that could affect uncertainty quantification include the following (NRC, 2012):
- The amount and relevance of the available system observations,
- The accuracy and uncertainty accompanying the system observations,
- Changes in the sensor technology used to collect data or in the way the sensor technology operates,
- Human cognitive biases in collecting and coding data,
- The complexity of the system being modeled,
- The degree of extrapolation required for the prediction relative to the available observations and the level of empiricism encoded in the model,
- The existence of model parameters that require calibration using the available system observations,
- The computational demands (run time and computing infrastructure) of the computational model,
- The accuracy of the computational model’s solution relative to that of the mathematical model (numerical error), and
- The accuracy of the computational model’s solution relative to that of the true system (structural error).
COMPUTATIONAL ENVIRONMENT
The computational infrastructure—including processors, software, memory, storage, connectivity, algorithms, and data structures—affects how modeling, analyses, and data can be used to support an investigation. For example, digital computing played a key role in the development of weather and climate models (see Box 1.3). The demands of models being used can also drive the requirements for computational resources. Large-scale computational models, such as the weather models mentioned above, are designed to run on compute-intensive high-performance computing systems for hours or days, running on thousands of processors, holding huge state vectors in distributed memory and storage, making use of specialized graphical processing units, and producing high volumes of model output that require specialized data storage capability (see Appendix B). At the other end of the spectrum, some system dynamics models and empirical models can be programmed quickly and run on a laptop or smaller devices.
In addition, the data and analysis requirements surrounding the model (e.g., data assimilation, inverse modeling, and sensitivity analysis) make additional demands on the computational infrastructure. For example, some analyses require a large number of computationally demanding model runs to be carried out. Whether the model runs are carried out serially or in parallel depends on the processing availability. Also, how much of the model output can be stored for later use and analysis depends on the available storage. Other data-intensive analyses involve preprocessing huge volumes of model output or system observations, which often requires special infrastructure for holding, processing, and visualizing the data.
Given these considerations, a question for NGA is the following:
What computational infrastructure is required?
A model might be computationally intensive, with code that leverages the specific connectivity and processing features of a high-performance system. It might be data intensive, with massive or streaming data, requiring specialized file and buffering systems. It might require an integrated digital environment, in which computing, data storage, and visualization systems are linked by software and high-performance networks. It may also be necessary to push data or analysis products to personal tablets or phones, making some form of cloud data or computing environment necessary. Major types of computational infrastructure are summarized below.
High-Performance Computing
Large-scale computational models of physical processes (e.g., material behavior, weather and climate, and subsurface flow) have driven the requirements and design for high-performance computing over the past half century. Traditional high-performance computing could be labeled computationally intensive, in that its design was heavily oriented toward facilitating computation (such as for partial differential equations or signal analysis) as opposed to, say, intensive throughput of data. This focus of traditional high-performance computing is evident from the LAPACK benchmarking of such systems, measuring the time required to solve large, dense systems of linear equations with little or no data input or output.
Increased resolution, inclusion of additional processes in the model, and use of growing amounts of physical observations and data products have driven advances in the size and speed of modern high-performance computing environments. Applications require a high degree of parallelism and fast communication between processors to ensure that information is quickly and appropriately transferred across spatial and temporal domains to accurately solve large, dense systems of equations and many other iterative computations. Thus, high-performance computing and compute-intensive software platforms (e.g., MPI, OpenMP) provide extremely fast facilities for coordinating tasks running on different processors. The hardware architectures (e.g., infiniband) provide fast, high-volume links connecting processors and main memories. However, the interconnection bandwidth between main memory and secondary disk storage is much lower than that among processors and main memory. This limits interactions between main memories and secondary disks to initial loading of data and storage of the final result and a few intermediate states. It also limits the volume of data that can be processed to the size of main memories, even though the secondary disk storage may hold much larger data sets.
Although many of the technologies used in high-performance computing are based on commodity components (see Appendix B), the design of the computing system is application specific. In general, a center seeking to acquire high-performance computing will design a benchmark of test cases to resemble the expected workload over the next 2 to 5 years. Standard benchmarks (e.g., High Performance LINPACK, and High Performance Conjugate Gradients)2 are unlikely to be sufficient because there is often an appreciable gap between theoretical peak performance and actual sustained performance (referred to as percent of peak, which is commonly in the 1 percent to 10 percent range). The benchmark is used to design a system with appropriate performance levels and size for processing, input and output, networking, and storage. These different subsystems may come from different vendors and require the services of an integrator. The acquisition will also include specifications for all the needed software and libraries, including large-scale schedulers to manage the workload of many jobs on a large system.
Data-Intensive Computing
The modern deluge of data (e.g., from social media, automated transaction records, remotely sensed data, scanner data, text, and computational model output) has motivated the conception and expansion of data-intensive computing. Unlike the computationally intensive computing model commonly used for physical process models, data-intensive computing focuses on exploiting (1) massive parallelism to carry out common data analysis tasks, such as searching, organizing, aggregating, analyzing, and modeling; (2) visualizing big data with large volume, high update rate, and tremendous variety; and (3) heuristic algorithms to support data compression and to estimate global behavior from local activity.
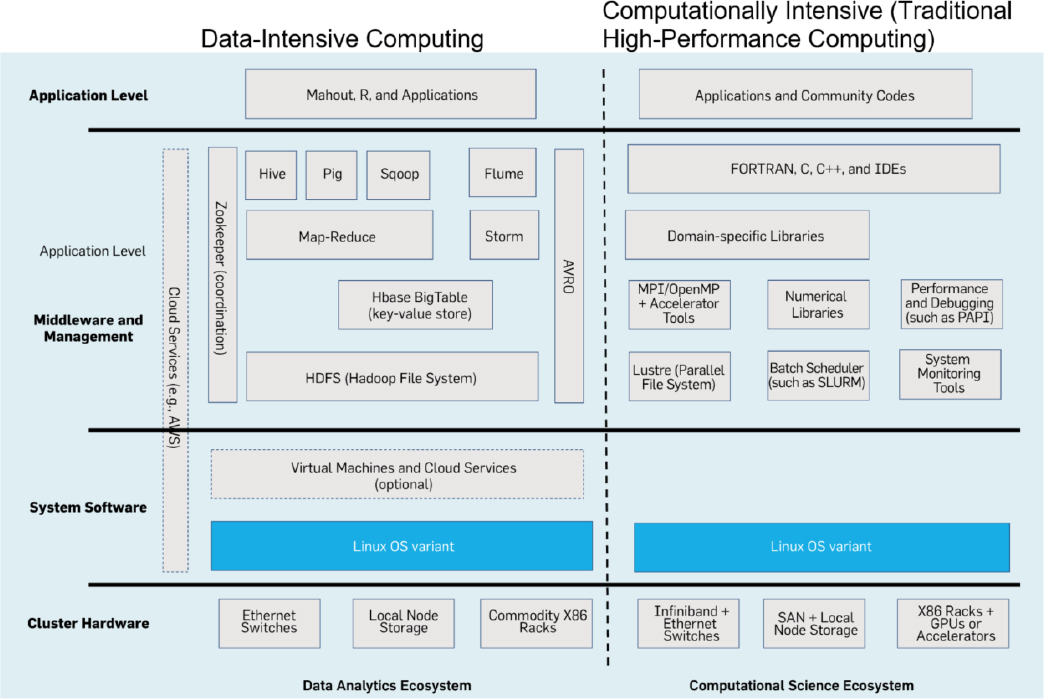
A dominant paradigm for data-intensive computing comes from Google’s MapReduce programming model and architecture (Dean and Ghemawat, 2008), which supports high-bandwidth communication between main memories and secondary disk storage. Apache Hadoop, an open-source implementation based on MapReduce, is commonly used by companies leveraging big data. The Apache Hadoop project has evolved to include additional
___________________
subprojects that bolster processing and analysis capabilities; these include Hive, Pig, and Sqoop (see Figure 3.7). These paradigms work especially well for problems that can be easily parallelized, such as text mining. For complex networks, however, these paradigms are less effective because their use often requires heuristic compression techniques, which eliminate key structural elements. Moreover, for streaming data where iterative network analytics are needed (such as analyzing the Twitter firehose), the MapReduce tasks are too coarse grained. In such cases, a SPARK approach or techniques that use the graphics cards or specialized chips designed for network metrics may be more effective. Finally, when data volume is so massive that it requires a cluster of machines and interactive queries of the data, the overhead of running MapReduce will be noticeable.
The MapReduce paradigm carries out operations on data residing on a distributed file system by distributing a task over the data set, carrying out the tasks locally on the separate data pieces, collecting the distributed intermediate results, then producing the final result. This approach is efficient for embarrassingly parallel tasks,
where there is no need to share information between the operations being carried out on the separate pieces of the data until the operations are complete. Such operations have proven useful in text mining applications where summaries of massive text or data sources are created to serve as raw material for analyses. This paradigm is not efficient for iterative applications because separate, distributed operations will generally need to share information regarding nearness and dependence. New data-intensive software platforms (e.g., Apache Spark) are emerging to improve performance of iterative tasks, which are common in spatial and compute-intensive applications. These new platforms are better for network models and for social media analytics.
Spatial Computing
Spatial computing covers computing in spatial, temporal, and spatiotemporal spaces. Models and data with spatial or space-time-dependent structures do not fit easily into either data-intensive or traditional high-performance computing-based analysis frameworks for a number of reasons, such as the following:
- It is difficult to divide many spatial analysis tasks into equal subtasks that impose comparable costs to different processors because of spatial data diversity and spatial variability in data density. Data density (e.g., number of houses per unit area) varies substantially from rural to urban areas, and so standard data division techniques (e.g., random, round robin, hashing, and geographic space partitioning) are not ideal.
- The computational load associated with spatial data types (e.g., line strings, polygons, and polygon collections) varies greatly with the shape, spatial context, and query restrictions of the elements, thereby reducing the effectiveness of standard data division techniques. In addition, it is often more expensive to move a data element (e.g., a polygon with thousands of edges) than it is to process it locally using filter-and-refine approaches that leverage spatial indices and minimum orthogonal bounding rectangles. This makes common dynamic load balancing and data-partitioning schemes inefficient (Shekhar et al., 1996, 1998).
- Many spatial computations (e.g., shortest path computation and parameter estimation for spatial autoregression) are difficult to decompose into independent tasks suitable for data-intensive computing architectures. Achieving optimal spatial decomposition for load balancing has been proven to be difficult computationally (Wang and Armstrong, 2009).
The need for efficient manipulation and scalable analysis of spatial big data on distributed archives has spawned a vigorous research effort focusing on spatial modeling within compute- and data-intensive cyberinfrastructures. This effort has led to an increasing array of new technologies (e.g., geographic information system [GIS] Tools for Hadoop, SpatialHadoop, cyberGIS, and GABBS) exploiting spatial characteristics and parallelism of both data and computation. High-performance networks, such as those at multiple-hundred gigabytes across distributed archives, are needed for data-intensive modeling.
The development of cyberinfrastructure and cyberGIS capabilities could enable both compute- and data-intensive geospatial modeling (Wang et al., 2014). Tools for geospatial problem solving and decision making are typically designed for individual user groups and there is limited coupling between various data and models. A digital discovery environment would provide: (1) a well-defined set of computational and data objects and services for model-based investigations and simple ways of combining them in complex coupled models, and (2) user-friendly and interoperable ways to add new data or computation objects and services, and to allocate cyberinfrastructure resources and services. The cyberGIS community has made solid progress on developing such an environment to meet the needs of various geospatial communities (Wang et al., in press).
Cloud Computing
The National Institute of Standards and Technology defines cloud computing as an approach “for enabling convenient, on-demand network access to a shared pool of configurable computing resources (e.g., networks, servers, storage, applications, and services) that can be rapidly provisioned and released with minimal management effort or service provider interaction” (Mell and Grance, 2011). Data access, delivery, and computing power from shared computational resources are supplied as required by the users. Common uses of cloud computing include email, Dropbox, Google drive, and online search engines.
The computational infrastructure behind the cloud is primarily data-intensive computing. For such applications (e.g., mapping), distributed content delivery networks allow data to be pushed out to large numbers of users as necessary. Some hosted high-performance resources are also available from the cloud (e.g., Amazon Cloud and the U.S. Department of Defense High Performance Computing Modernization Program). Such systems are able to supply the necessary compute cycles for high-demand users, and they may also facilitate sharing of large spatial data sets with users that have limited computational, storage, and communication resources. For example, NGA and the Polar Geospatial Center are increasing access to high-resolution polar imagery from Digital Globe satellites using cloud computing platforms at the University of Minnesota and National Center for Supercomputing Applications.3
With cloud computing, users pay only when they need it, and there is no need to purchase and maintain computing infrastructure. However, security and reliability have to be handled differently than in-house high-performance computing. A somewhat recent assessment of cloud computing for science appears in the report of Yelick et al. (2011).
Whether the supercomputing resources are hosted on the cloud or in data centers, the architecture needs to accommodate the computing requirements of the application. For example, many data-mining applications can leverage the MapReduce model, using embarrassingly parallel programs that can be hosted on huge server farms such as Amazon or Microsoft Azure. In contrast, many physical process models require highly parallel, computationally intensive high-performance architectures. Consequently, as new modeling and analysis approaches are considered, it will be helpful to ask the following:
Should the modeling and analysis leverage special features of the cyberinfrastructure?
Generally, models and analyses that explicitly leverage features of the available cyberinfrastructure have greater capacity, capability, and speed. For example, climate models that use cutting-edge high-performance computing can run at higher resolution or include more detail in the modeling, perhaps yielding results that are more like the real-world system of interest. Similarly, analysis approaches that use data-intensive computing can handle a much larger data volume and rate for constructing empirical models or carrying out inference, potentially producing faster and more comprehensive results.
For applications that require real-time computation in the field (e.g., models used to support battlefield decisions), limitations on both computational power and data access have to be overcome. The load on the communication channel to centralized cloud computers can be reduced by enhancing the computing power on board sensor platforms such as unmanned aerial vehicles and aircraft. Specialized high-performance computing platforms (e.g., FPGA and GPU clusters) and custom software (e.g., signal processing algorithms designed for FPGA) provide a means to increase communication without exceeding weight or power restrictions on aerial platforms.
Adapting data, models, and analyses to specialized access modes and cyberinfrastructure has costs. In addition to the cost of hosting the infrastructure or “renting” it via cloud services, model development and use is generally more difficult and takes longer, and the infrastructure has its own maintenance requirements. Also, models must evolve with the infrastructure. Consequently, the utility of adapting the model and methods to new access modes
___________________
3 See https://www.whitehouse.gov/blog/2015/09/02/using-new-elevation-data-explore-arctic.
and supercomputing architectures will depend on features and commonalities of the investigations NGA will carry out.
TRADEOFFS
A key part of any model-based analysis is managing tradeoffs between the various features of the available models and analysis methods, balancing the available resources to address the key questions of the investigation. Table 3.1 lists examples of resources and features of the real-world system that must be balanced in any model-based investigation.
TABLE 3.1 Example Factors Affecting the Balance Between Resources, Key Questions, and Features of the Real-World System
| Available Resources | Key Questions and Features of the Real-World System |
|---|---|
|
|
A key property of a model’s impact on the investigation is its fidelity to the real-world system being modeled. Higher-fidelity models capture a larger number of important subsystem behaviors and linkages present in the real-world system, with greater mathematical and computational accuracy, and they are also typically higher resolution. In contrast, low-fidelity models are crude, sometimes empirically constructed, yielding simple representations of only a few system processes (e.g., the left frame of Figure 3.2). Data and computational requirements for high- and low-fidelity models can be vastly different. Higher-fidelity models generally require more data and at a higher level of detail, more sophisticated analysis methods to bring the model in line with the real-world system, more demanding computations to run the models and carry out analyses, and more time and expertise for assessment.
Lower-fidelity models can produce accurate predictions in some situations, such as when the real-world system is dominated by a small number of processes. When system behavior becomes more complex, with contributions from multiple interacting processes, high-fidelity models are required to produce realistic simulations. This additional realism is particularly important for characterizing uncertainty in extrapolative settings, where the model must explore plausible, uncertain future outcomes.
From the perspective of empirical models (i.e., statistics and machine learning), fitting additional features in the data affects the error in the resulting model predictions. The error can be decomposed into bias and variance. The bias is the mismatch between the model and reality, and the variance is a measure of the size of random fluctuations in the data. More complex models can be overfit to the training data, following the random fluctuations in the data. Managing the complexity of an empirical model depends on the bias–variance tradeoff, a well-covered topic in the literature (e.g., Hastie et al., 2009). Consequently, a key question is the following:
How do modeling tradeoffs affect fidelity to the real-world system?
Answering this question requires balancing the quality of the answer with the time and other resources available to obtain it. If time for the investigation is short, the available resources can be marshaled to produce a quick,
approximate answer, rather than a more complete answer months or years later. If ample time is available, a greater investment in expertise, high-fidelity modeling, data collection, and analysis methods can be made to address and explore key questions.
In addition, the features and requirements of the investigation can help determine the appropriate level of fidelity. For example, if specific, highly accurate predictions are required (as for the wave prediction model in the pirate example of Chapter 2), then a commensurate level of model fidelity and data will be required. Similarly, more extrapolative or exploratory investigations will likely require higher-fidelity modeling, as well as sufficient computing resources to carry out extensive sensitivity studies.
SUMMARY AND CONCLUSIONS
In a model-based investigation, the key questions should drive the focus of the analysis (e.g., prediction or understanding) and the type of model needed (e.g., process or empirical). For NGA, which often must produce geospatial intelligence quickly, timeliness of results is also a consideration for model selection. A model based on a simple, quick approach may be more useful than one that is more comprehensive but slow. In such cases, it may be possible to utilize existing models or model output, which would both speed the investigation and reduce its cost. However, NGA would have no control over, and perhaps insufficient information about, what went into the model. Building new models from scratch or from a combination of subsystem models would allow NGA to target the behaviors and processes of interest, but it would also require significant time, effort, and expertise. Because models of complex systems are highly multidisciplinary, experts will commonly have to be drawn from modeling groups across the country.
The need to work in multidisciplinary teams of experts is particularly important when combining models, because the robustness of the results depends on getting both the subsystem models and the model linkages right. Multiple subsystem models are often needed to represent the relevant features of a real-world system. However, simply combining models that accurately capture subsystem behaviors will not yield a model that accurately captures the behavior of the larger system, unless the connections among subsystem models are appropriately represented. Combining models is challenging but would give NGA some flexibility in model development. In particular, a collection of subsystem models that could be used in a variety of larger models would be adaptable and less expensive to develop and maintain than a few megamodels.
All models are abstractions of real-world systems, and they must be assessed to determine their adequacy in reflecting real-world behaviors, in the context of supporting specific decision making. How the assessment is carried out depends in part on the purpose of the model. For example, a model used to make high-consequence, specific predictions (e.g., the load of a beam in a structure) requires rigorous validation and uncertainty quantification procedures so users can determine how much trust to place in the predictions. In contrast, a model built to explain phenomena may undergo more qualitative procedures for the validation assessment. However, even a largely qualitative model assessment would be useful for communicating results, strengths, and limitations of a model-based analysis. Such communication is particularly important when the users are not involved in the modeling, as is the case for decision makers who use the geospatial intelligence produced by NGA.
Likewise, it is important to understand the sources of uncertainty in the investigation and to communicate the overall level of uncertainty to users. When relevant historical data are available to repeatedly test model-based predictions against the real-world system outcome, there are a variety of methods available to estimate and represent uncertainty. In contrast, it is difficult to quantify uncertainty in models of systems with processes that are evolving or changing to a new state. Methods for dealing with these uncertainties and for communicating uncertainty in model results are active areas of research. If NGA uses an existing model, it may be possible to work with the model developers to understand how uncertainty is represented or even to have uncertainty expressed in a way that is useful to NGA. In addition, if a collection of different models and methods produces similar results, NGA may have higher confidence in those results.
The nature of the data (e.g., how it was collected, sources of errors, accuracy, and volume) available for a model-based investigation influences model selection and drives how it is handled in the analysis. For example, it may be preferable to use simple, data-driven models if high-quality data that are directly relevant to the questions of interest are available. Specialized cyberinfrastructure and big data techniques are needed to handle large volumes of geospatial data collected at different scales from different sources and for different purposes.
The computational infrastructure needed depends on the type of model being run. In general, large-scale, physical process models use traditional high-performance computing for models that require large numbers of processors, fast communication between processors, and large volumes of data in memory and storage (e.g., climate models); they use data-intensive computing for models that analyze massive amounts or streaming data by dividing the work into separate, parallel tasks (e.g., preprocessing of tweets in the Benghazi consulate example in Chapter 2). Cloud computing is a potential pathway for accessing the computational infrastructure—data-intensive or traditional high-performance computing—required for the modeling and analysis effort, as well as providing on-demand data or analysis products (e.g., online search engines). Specialized software platforms are usually required for large-scale models with spatial dependence, because the analysis tasks (e.g., hotspot analysis) cannot be easily parallelized. In general, models that explicitly leverage available computational infrastructure have greater capacity, capability, and speed, although they are more costly to develop and maintain.
This page intentionally left blank.


