
Appendix F
Changes in the WIC Food Packages and Program Participation
To determine whether regulatory changes made to the Special Supplemental Nutrition Program for Women, Infants, and Children (WIC) food packages are associated with coincident changes in program participation, the committee compared the number of WIC participants with data to the number of individuals eligible for program participation at the state level (USDA/FNS, 2015a). The resulting proportion of participants reflects both the program generosity (the income limit for participation in the program) as well as the number of categorically and income-eligible individuals by state and year, with the eligibility calculations including adjustments for income eligibility or eligibility through participation in other programs as well as other adjustments made to the Current Population Survey Annual Social and Economic Supplement data (USDA/FNS, 2015b). The committee plotted these trends and estimated models of these program coverage rates, that is, the number of participants/number eligible by state and year as a function of the share of the year the new package was in effect for, state-fixed effects, and some controls for the state of the economy (the unemployment rate), and, in some specifications, year-fixed effects and program participation rates per-person in the state (participation rates in the Temporary Assistance for Needy Families [TANF] program and the Supplemental Nutrition Assistance Program [SNAP] and participation rates in the regular, extended and emergency Unemployment Compensation program [Bitler and Hoynes, 2016]). The state-fixed effects controlled for time invariant differences in state participation among WIC eligibles, and the year-fixed effects controlled for national-level shocks. The committee included these in the model because there was variation in the exact
month of implementation of the 2009 food package change across states, with New York and Delaware implementing in January and many other states not implementing until the regulatory deadline (dates are reported in Appendix F of USDA/FNS, 2012). The models were estimated by both ordinary least squares and weighted least squares methods, with the eligibility totals used as weights to produce population-representative results. The data span the period from 2006 to 2012. The variance/covariance matrices and associated inference allow for arbitrary within-state correlations of the error terms.1 Note that the eligibility shares were only available for all WIC participants rather than by eligibility category.
Figure 1-3 of the phase I report (NASEM, 2016) shows the time series of the aggregate national program coverage rate components—the national total number of participants by calendar year and the national total number of eligibles by calendar year. There is little evidence that the number of participants in 2009 changes any more than the number of eligible persons. Figure F-1 shows coverage rates (take-up by eligible individuals) for selected states. Again, coverage does not seem to move systematically in 2009. The raw correlation between the annual coverage rate and the share of the year a state had the new package in place is 0.031 (i.e., holding everything else constant, implementing the new package everywhere would be associated with a 3.1 percentage point increase in the coverage rate relative to a pre-2009 rate of 61 percentage points). However, 2009 marks the end of the Great Recession (using the National Bureau of Economic Research ending date); 2009 also marks the peak year for the number of WIC eligibles in the data (see NASEM, 2016, Figure 1-3) suggesting the importance of adjusting these comparisons for the business cycle. Further, associated with the stimulus, there were expansions in the generosity of SNAP benefits (which ended in November 2013), expansions in the Federal Medical Assistance Percentages matching rate for Medicaid expenditures, and a stimulus-associated TANF emergency fund. Since categorically eligible individuals who participate in any of these programs are automatically eligible for WIC, there is possible concern that failing to control for effects of other programs might bias estimates of the effects of the initial rollout of the new food package. The committee therefore estimated a series of regressions with the unemployment rate and unemployment insurance recipiency per capita as well as SNAP and TANF caseloads per capita as controls in addition to state- and year-fixed effects (regression results and controls in Tables F-1 and F-2).
__________________
1 The standard errors are produced using the software package Stata 13.1 and are adjusted for arbitrary correlation of the error terms within state, using a method known as robust clustering. When the independent variable is constant across states or when regression errors are correlated within states, standard errors computed the standard way are inappropriate for hypothesis tests (Rogers, 1993). Robust-clustering corrects standard errors and makes them appropriate for hypothesis testing.
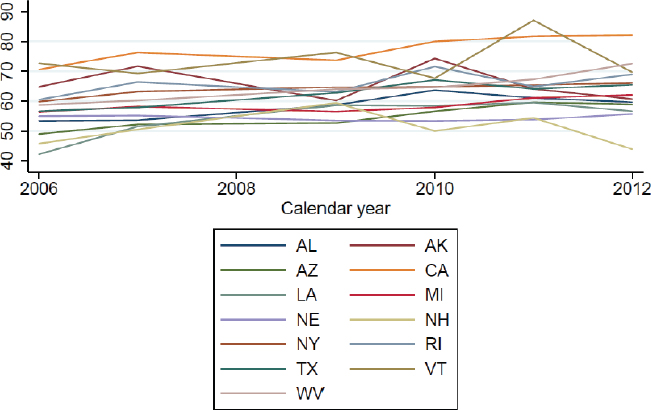
SOURCES: USDA/FNS, 2011, 2013, 2014, 2015a; Bitler and Hoynes, 2016.
Table F-1 shows the findings controlling for year-fixed effects. However, despite the fact that there is variation across states within 2009 which allows the effect of partial year implementation to be identified in a model with year-fixed effects, another approach might leave out the year-fixed effects. The latter is not the preferred approach because the period before implementation plus most of the period of partial implementation occurred in the middle of the Great Recession. The committee tried to adjust for this with various controls, but prefers the models with year-fixed effects. For comparison, a version without year-fixed effects is also presented (see Table F-2) (thus columns 1 through 3 are the same as in Table F-1).
Once controlling for state-fixed differences and time effects, or alternatively, the unemployment rate, the coefficient on the share of the year for which the new package was in effect falls in magnitude and it is no longer statistically significant. This also holds if we add controls for the monthly average of Aid to Families with Dependent Children/TANF and SNAP caseloads per capita. Table F-2 also illustrates that even without controlling for year-fixed effects, the effect of the implementation of the 2009 food package is small and statistically insignificant. These results suggest no significant difference comparing participation before to participation after implementation of the new food package, with and without the year-fixed
TABLE F-1 Regression Results and Controls, Total WIC Participation per Eligible Individual, 2006–2012
| Regression Number | |||||||
|---|---|---|---|---|---|---|---|
| 1 | 2 | 3 | 4 | 5 | 6 | 7 | |
| Regression Results | |||||||
| Share of year with new package | 0.031a (0.007) | 0.032a (0.008) | 0.013 (0.015) | 0.014 (0.017) | 0.015 (0.018) | 0.013 (0.017) | 0.013 (0.017) |
| Unemployment rate | 0.787 (0.502) | 0.971a (0.466) | 1.52a (0.413) | 1.21a (0.536) | |||
| Regression Controls | |||||||
| Year-fixed effects | N | N | N | Y | Y | Y | Y |
| State-fixed effects | N | Y | Y | Y | Y | Y | Y |
| TANF cases per capita | N | N | N | N | Y | Y | Y |
| SNAP cases per capita | N | N | N | N | Y | Y | Y |
| Unemployment insurance recipiency per capita | N | N | N | N | N | Y | Y |
| Births per capita | N | N | N | N | N | N | Y |
NOTES: SNAP = Supplemental Nutrition Assistance Program; TANF = Temporary Assistance for Needy Families. Each column represents a separate regression, and there is one observation per state-year combination. N = 357. The baseline mean for the participation rate is 0.608, and the baseline mean for the unemployment rate is 0.074. The key dependent variable is the state-by-year count of participants in WIC divided by an estimate of the number of WIC eligibles, using a series of reports on WIC-eligible estimation. The key independent variable is the share of each year during which a state had implemented the new food packages taken from USDA/FNS, 2012. The regressions are weighted by the total number of eligibles, and variance-covariance matrices allow for arbitrary autocorrelation within state (implemented using state clustering in Stata version 13.1).
a P < .05.
SOURCE: USDA/FNS, 2012.
TABLE F-2 Regression Results and Controls, Total WIC Participation per Eligible Individual, 2006–2012, Omitting Year Effects
| Regression Number | |||||||
|---|---|---|---|---|---|---|---|
| 1 | 2 | 3 | 4 | 5 | 6 | 7 | |
| Regression Results | |||||||
| Share of year with new package | 0.031a (0.007) | 0.032a (0.008) | 0.013 (0.015) | 0.015 (0.011) | 0.011 (0.018) | 0.008 (0.016) | –0.007 (0.012) |
| Unemployment rate | 0.493a (0.166) | 0.509a (0.149) | 1.40a (0.411) | 0.801b (0.474) | |||
| Regression Controls | |||||||
| Year-fixed effects | N | N | N | N | N | N | N |
| State-fixed effects | N | Y | Y | Y | Y | Y | Y |
| TANF cases per capita | N | N | N | N | Y | Y | Y |
| SNAP cases per capita | N | N | N | N | Y | Y | Y |
| Unemployment insurance recipiency per capita | N | N | N | N | N | Y | Y |
| Births per capita | N | N | N | N | N | N | Y |
NOTES: SNAP = Supplemental Nutrition Assistance Program; TANF = Temporary Assistance for Needy Families. Each column represents a separate regression, and there is one observation per state-year combination. N = 357. The baseline mean for the participation rate is 0.608, and the baseline mean for the unemployment rate is 0.074. The key dependent variable is the state-by-year count of participants in WIC divided by an estimate of the number of WIC eligibles, using a series of reports on WIC-eligible estimation. The key independent variable is the share of each year during which a state had implemented the new food packages taken from USDA/FNS, 2012. The regressions are weighted by the total number of eligibles, and variance-covariance matrices allow for arbitrary autocorrelation within state (implemented using state clustering in Stata version 13.1).
a P < .05.
b P < .10.
SOURCE: USDA/FNS, 2012.
effects and other program participation rates. Further, the coefficients on the share of the year the new package was in effect are small in magnitude, with a typical estimate being 0.014 (again, on a pre-2009 baseline mean of 0.61 or 61 percentage points).
REFERENCES
Bitler, M., and H. Hoynes. 2016. The more things change, the more they stay the same? The safety net and poverty in the Great Recession Journal of Labor Economics 34(s1):part 2.
NASEM (National Academies of Sciences, Engineering, and Medicine). 2016. Review of WIC food packages: Proposed framework for revisions: Interim report. Washington, DC: The National Academies Press. doi: 10.17226/21832.
Rogers, W. H. 1993. Regression standard errors in clustered samples. Stata Technical Bulletin 13:19–23. Reprinted in Stata Technical Bulletin Reprints, vol. 3, pp. 88–94. College Station, TX: Stata Press.
USDA/FNS (U.S. Department of Agriculture/Food and Nutrition Service). 2011. National and state-level estimates of Special Supplemental Nutrition Program for Women, Infants, and Children (WIC) eligibles and program reach, 2000–2009. Alexandria, VA: USDA/FNS. http://www.fns.usda.gov/sites/default/files/WICEligibles2000-2009Vol1.pdf (accessed August 31, 2016).
USDA/FNS. 2012. Special Supplemental Nutrition Program for Women, Infants, and Children (WIC) erroneous payments to vendors: Annual estimates for FY 2011. Alexandria, VA: USDA/FNS. http://www.fns.usda.gov/sites/default/files/WICErroneousPayment_2011.pdf (accessed August 26, 2016).
USDA/FNS. 2013. National and state-level estimates of Special Supplemental Nutrition Program for Women, Infants, and Children (WIC) eligibles and program reach, 2010. Alexandria, VA: USDA/FNS. http://www.fns.usda.gov/sites/default/files/WICEligibles2010Vol1.pdf (accessed August 24, 2016).
USDA/FNS. 2014. National and state-level estimates of the Special Supplemental Nutrition Program for Women, Infants, and Children (WIC) eligibles and program reach, 2011, volume I. Alexandria, VA: USDA/FNS. http://www.fns.usda.gov/sites/default/files/WICEligibles2011Volume1.pdf (accessed May 22, 2016).
USDA/FNS. 2015a. National and state-level estimates of the Special Supplemental Nutrition Program for Women, Infants, and Children (WIC) eligibles and program reach, 2012, vol. I. Alexandria, VA: USDA/FNS. http://www.fns.usda.gov/sites/default/files/ops/WICEligibles2012-Volume1.pdf (accessed August 24, 2016).
USDA/FNS. 2015b. WIC eligibility requirements. Alexandria, VA: USDA/FNS. http://www.fns.usda.gov/wic/wic-eligibility-requirements (accessed July 13, 2016).


