

NOTES: CVV = cash value voucher; DGA = Dietary Guidelines for Americans.
NOTES: CVV = cash value voucher; DGA = Dietary Guidelines for Americans.
NOTES: CVV = cash value voucher; DGA = Dietary Guidelines for Americans.
NOTES: CVV = cash value voucher; DGA = Dietary Guidelines for Americans.
NOTES: CVV = cash value voucher; DGA = Dietary Guidelines for Americans.
| WIC Food Category | DGA Food Group | Current | Revised | Change in Proportion of DGA Recommendation (%)a | DGA 2,600 Kcal Food Patternb | |||
|---|---|---|---|---|---|---|---|---|
| Units/d | WIC Maximum Allowance | Proportion of the DGA Recommendation (%)a | WIC Maximum Allowance | Proportion of the DGA Recommendation (%)a | ||||
| Total fruit | Total fruit | c-eq | 1.0 | 52 | 0.9 | 44 | −9 | 2.0 |
| Juice, 100% | Fruit, as juice | c-eq | 0.6 | 60 | 0.3 | 27 | −33 | 1.0 |
| Fruit, 67% of CVVc | Fruit, whole | c-eq | 0.4 | 45 | 0.6 | 61 | 16 | 1.0 |
| Total vegetables | Total vegetables | c-eq | 0.5 | 13 | 0.5 | 13 | 0 | 3.5 |
| Vegetables, 43% of CVVd | c-eq | 0.2 | 6 | 0.3 | 9 | 2 | 3.5 | |
| Legumes (as vegetable)e | Legumes (beans and peas) | c-eq | 0.3 | 71 | 0.2 | 47 | −24 | 0.4 |
| Total dairy | Total dairy | c-eq | 2.9 | 98 | 2.1 | 71 | −27 | 3.0 |
| Milk | c-eq | 2.9 | 98 | 2.1 | 71 | −27 | 3.0 | |
| Total grains | Total grains | oz-eq | 1.7 | 19 | 2.0 | 22 | 3 | 9.0 |
| Breakfast cerealf | Refined grains | oz-eq | 1.0 | 22 | 0.6 | 13 | −8 | 4.5 |
| Breakfast cereal | Whole grains | oz-eq | 0.2 | 17g | 0.6 | 31g | 14 | 4.5 |
| Whole wheat bread | Whole grains | oz-eq | 0.5 | 0.8 | ||||
| Total protein foods | Total protein foods | oz-eq | 1.6 | 25 | 0.9 | 14 | −11 | 6.5 |
| Peanut butter | Nuts, seeds, and soy | oz-eq | 1.2 | 168 | 0.4 | 56 | −112 | 0.7 |
| Eggs | Meat, poultry, and eggs | oz-eq | 0.4 | 9 | 0.4 | 9 | 0 | 4.4 |
| Fish | Seafood | oz-eq | 0.0 | 0 | 0.1 | 8 | 8 | 1.4 |
NOTES: c-eq = cup-equivalent; CVV = cash value voucher; DGA = Dietary Guidelines for Americans; oz-eq = ounce-equivalent.
a Percentages represent the proportion of the recommended food pattern amount in the corresponding row of the DGA food pattern column. Values may not be replicable from the table due to rounding.
b The 2,600-kcal food pattern was applied to evaluate this package. This kcal level most closely matched the calculated Estimated Energy Requirement (EER) for pregnant WIC-participating women in National Health and Nutrition Examination Survey (NHANES) 2005–2012. In the current WIC food packages, pregnant women and partially breastfeeding women receive the same benefits.
c Assumes that 67 percent of the CVV is used to purchase fruits, based on redemption data from Texas and Wyoming. A weighted composite cost of fruit ($0.55/c-eq) was developed, based on the most commonly consumed fruits (bananas, apples, oranges, berries, grapes, melon [watermelon was used in this case]) from an average of Massachusetts, Texas, and Wyoming redemption data. Only fresh fruit was included as all states allow fresh forms; Economic Research Service (ERS) 2013 price data were updated with a Consumer Price Index to 2015 values.
d Assumes that 33 percent of the CVV is used to purchase vegetables, based on redemption data from Texas and Wyoming. A weighted composite cost of vegetables ($0.55/c-eq) was developed, based on the most commonly consumed vegetables (tomatoes, avocados, potatoes, peppers, lettuce) from an average of Massachusetts, Texas, and Wyoming redemption data. Only fresh vegetables were included as all states allow fresh forms; ERS 2013 price data were updated with a Consumer Price Index to 2015 values. Because potatoes were not yet available in Wyoming, the same proportion of potatoes was assumed for this state as for Texas.
e Legumes can also be assessed as a protein, but they were placed in the vegetable group because a higher proportion of individuals had low intakes of vegetables across WIC-participating subgroups compared to protein.
f In the current food packages, a ratio of 81 percent refined grains and 19 percent whole grains was applied, based on redemption data; in the revised packages, a ratio of 50 percent refined grains and 50 percent whole grains was applied to account for the requirement that all cereals meet the whole grain-rich criteria.
g To compare the food package contribution to the DGA recommended amounts of whole grains, the whole grain portion of breakfast cereal was added to the whole grain contribution of bread.
SOURCES: USDA/ARS, 2014; USDA/FNS, 2014; USDA/HHS, 2016.
TABLE T-1b Proportion of 2015–2020 DGA Recommended Amounts of Food Groups in the Current and Revised Food Packages for Pregnant Women as Redeemeda: Food Package V-A
| WIC Food Category | DGA Food Group | Units/d | Current | Revised | Change in Proportion of DGA Recommendation (%)b | DGA 2,600 Kcal Food Patternc | ||
|---|---|---|---|---|---|---|---|---|
| WIC Redeemed Amounts of the Maximum Allowance | Proportion of the DGA Recommendation (%)b | WIC Redeemed Amounts of the Maximum Allowance | Proportion of the DGA Recommendation (%)b | |||||
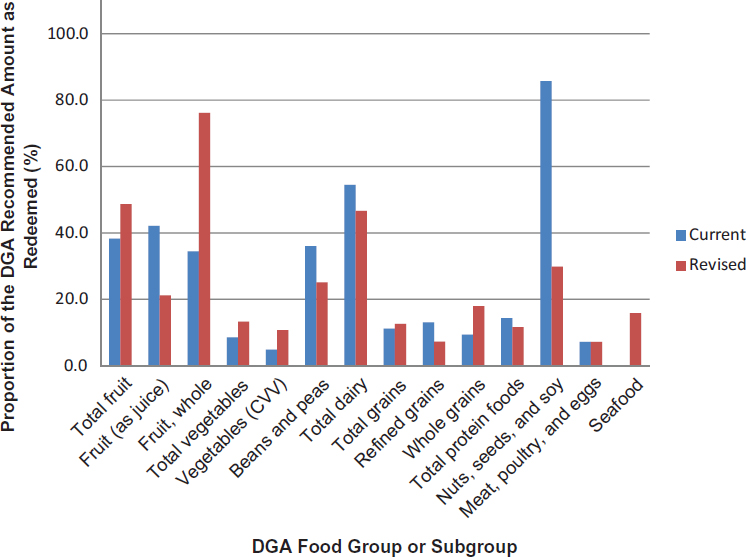
| Total fruit | Total fruit | c-eq | 0.8 | 38 | 0.7 | 33 | −5 | 2.0 |
| Juice, 100% | Fruit, as juice | c-eq | 0.4 | 42 | 0.2 | 21 | −21 | 1.0 |
| Fruit, 67% of CVVd | Fruit, whole | c-eq | 0.3 | 34 | 0.5 | 46 | 11 | 1.0 |
| Total vegetables | Total vegetables | c-eq | 0.3 | 9 | 0.3 | 9 | −1 | 3.5 |
| Vegetables, 33% of CVVe | c-eq | 0.2 | 5 | 0.2 | 6 | 2 | 3.5 | |
| Legumes (as vegetable)f | Legumes (beans and peas) | c-eq | 0.1 | 36 | 0.1 | 25 | −11 | 0.4 |
| Total dairy | Total dairy | c-eq | 1.6 | 55 | 1.4 | 47 | −8 | 3.0 |
| Milk | c-eq | 1.6 | 55 | 1.4 | 47 | −8 | 3.0 | |
| Total grains | Total grains | oz-eq | 1.0 | 11 | 1.1 | 13 | 1 | 9.0 |
| Breakfast cerealg | Refined grains | oz-eq | 0.6 | 13 | 0.3 | 4 | −9 | 4.5 |
| Breakfast cereal | Whole grains | oz-eq | 0.1 | 9.3h | 0.3 | 18h | 15 | 4.5 |
| Whole wheat bread | Whole grains | oz-eq | 0.3 | 0.5 | ||||
| Total protein foods | Total protein foods | oz-eq | 0.9 | 14 | 0.6 | 9 | −5 | 6.5 |
| Peanut butter | Nuts, seeds, and soy | oz-eq | 0.6 | 86 | 0.2 | 30 | −56 | 0.7 |
| Eggs | Meat, poultry, and eggs | oz-eq | 0.3 | 7 | 0.3 | 7 | 0 | 4.4 |
| Fish | Seafood | oz-eq | 0.0 | 0 | 0.1 | 5 | 5 | 1.4 |
NOTES: c-eq = cup-equivalent; CVV = cash value voucher; DGA = Dietary Guidelines for Americans; oz-eq = ounce-equivalent.
a Applies redemption factors presented in Appendix R, Table R-5.
b Percentages represent the proportion of the recommended food pattern amount in the corresponding row of the DGA food pattern column. Values may not be replicable from the table due to rounding.
c The 2,600-kcal food pattern was applied to evaluate this package. This kcal level most closely matched the calculated Estimated Energy Requirement (EER) for pregnant WIC-participating women in National Health and Nutrition Examination Survey (NHANES) 2005–2012. In the current WIC food packages, pregnant women and partially breastfeeding women receive the same benefits.
d Assumes that 67 percent of the CVV is used to purchase fruits, based on redemption data from Texas and Wyoming. A weighted composite cost of fruit ($0.55/c-eq) was developed, based on the most commonly consumed fruits (bananas, apples, oranges, berries, grapes, melon [watermelon was used in this case]) from an average of Massachusetts, Texas, and Wyoming redemption data. Only fresh fruit was included as all states allow fresh forms; Economic Research Service (ERS) 2013 price data were updated with a Consumer Price Index to 2015 values.
e Assumes that 33 percent of the CVV is used to purchase vegetables, based on redemption data from Texas and Wyoming. A weighted composite cost of vegetables ($0.55/c-eq) was developed, based on the most commonly consumed vegetables (tomatoes, avocados, potatoes, peppers, lettuce) from an average of Massachusetts, Texas, and Wyoming redemption data. Only fresh vegetables were included as all states allow fresh forms; ERS 2013 price data were updated with a Consumer Price Index to 2015 values. Because potatoes were not yet available in Wyoming, the same proportion of potatoes was assumed for this state as for Texas.
f Legumes can also be assessed as a protein, but they were placed in the vegetable group because a higher proportion of individuals had low intakes of vegetables across WIC-participating subgroups compared to protein.
g In the current food packages, a ratio of 81 percent refined grains and 19 percent whole grains was applied, based on redemption data; in the revised packages, a ratio of 50 percent refined grains and 50 percent whole grains was applied to account for the requirement that all cereals meet the whole grain-rich criteria.
h To compare the food package contribution to the DGA recommended amounts of whole grains, the whole grain portion of breakfast cereal was added to the whole grain contribution of bread.
SOURCES: USDA/ARS, 2014; USDA/FNS, 2014; USDA/HHS, 2016.
TABLE T-2a Proportion of 2015–2020 DGA Recommended Amounts of Food Groups in the Current and Revised Food Packages for Partially Breastfeeding Women Assuming Full Redemption: Food Package V-Ba
| WIC Food Category | DGA Food Group | Units/d | Current | Revised | Change in Proportion of DGA Recommendation (%)b | DGA 2,600-Kcal Food Patternc | ||
|---|---|---|---|---|---|---|---|---|
| WIC Maximum Allowance | Proportion of the DGA Recommendation (%)b | WIC Maximum Allowance | Proportion of the DGA Recommendation (%)b | |||||
| Total fruit | Total fruit | c-eq | 1.0 | 52 | 1.3 | 64 | 12 | 2.0 |
| Juice, 100% | Fruit, as juice | c-eq | 0.6 | 60 | 0.3 | 27 | −33 | 1.0 |
| Fruit, 67% of CVVd | Fruit, whole | c-eq | 0.4 | 45 | 1.0 | 102 | 57 | 1.0 |
| Total vegetables | Total vegetables | c-eq | 0.5 | 13 | 0.7 | 19 | 6 | 3.5 |
| Vegetables, 33% of CVVe | c-eq | 0.2 | 0.2 | 0.4 | 14 | 5 | 3.5 | |
| Legumes (as vegetable)f | Legumes (beans and peas) | c-eq | 0.3 | 71 | 0.2 | 47 | −24 | 0.4 |
| Total dairy | Total dairy | c-eq | 2.9 | 98 | 2.1 | 71 | −27 | 3.0 |
| Milk | c-eq | 2.9 | 98 | 2.1 | 71 | −27 | 3.0 | |
| Total grains | Total grains | oz-eq | 1.7 | 19 | 2.0 | 22 | 3 | 9.0 |
| Breakfast cerealg | Refined grains | oz-eq | 1.0 | 22 | 0.6 | 13 | −8 | 4.5 |
| Breakfast cereal | Whole grains | oz-eq | 0.2 | 17h | 0.6 | 31h | 14 | 4.5 |
| Whole wheat bread | Whole grains | oz-eq | 0.5 | 0.8 | ||||
| Total protein foods | Total protein foods | oz-eq | 1.6 | 25 | 1.1 | 17 | −7 | 6.5 |
| Peanut butter | Nuts, seeds, and soy | oz-eq | 1.2 | 168 | 0.4 | 56 | −112 | 0.7 |
| Eggs | Meat, poultry, and eggs | oz-eq | 0.4 | 9 | 0.4 | 9 | 0 | 4.4 |
| Fish | Seafood | oz-eq | 0.0 | 0 | 0.3 | 23 | 23 | 1.4 |
NOTES: c-eq = cup-equivalent; CVV = cash value voucher; DGA = Dietary Guidelines for Americans; oz-eq = ounce-equivalent.
a This table compares the current food package V (provided to both pregnant and partially breastfeeding women) to the revised food package V-B for partially breastfeeding women only.
b Percentages represent the proportion of the recommended food pattern amount in the corresponding row of the DGA food pattern column. Values may not be replicable from the table due to rounding.
c The 2,600 kcal food pattern was applied to evaluate this package. This kcal level most closely matched the calculated Estimated Energy Requirement (EER) for breastfeeding WIC-participating women in National Health and Nutrition Examination Survey (NHANES) 2005–2012.
d Assumes that 67 percent of the CVV is used to purchase fruits, based on redemption data from Texas and Wyoming. A weighted composite cost of fruit ($0.55/c-eq) was developed, based on the most commonly consumed fruits (bananas, apples, oranges, berries, grapes, melon [watermelon was used in this case]) from an average of Massachusetts, Texas, and Wyoming redemption data. Only fresh fruit was included as all states allow fresh forms; Economic Research Service (ERS) 2013 price data were updated with a Consumer Price Index to 2015 values.
e Assumes that 33 percent of the CVV is used to purchase vegetables, based on redemption data from Texas and Wyoming. A weighted composite cost of vegetables ($0.55/c-eq) was developed, based on the most commonly consumed vegetables (tomatoes, avocados, potatoes, peppers, lettuce) from an average of Massachusetts, Texas, and Wyoming redemption data. Only fresh vegetables were included as all states allow fresh forms; ERS 2013 price data were updated with a Consumer Price Index to 2015 values. Because potatoes were not yet available in Wyoming, the same proportion of potatoes was assumed for this state as for Texas.
f Legumes can also be assessed as a protein, but were placed in the vegetable group because a higher proportion of individuals had low intakes of vegetables across WIC-participating subgroups compared to protein.
g In the current food packages, a ratio of 81 percent refined grains and 19 percent whole grains was applied, based on redemption data; in the revised packages, a ratio of 50 percent refined grains and 50 percent whole grains was applied to account for the requirement that all cereals meet the whole grain-rich criteria.
h To compare the food package contribution to the DGA recommended amounts of whole grains, the whole grain portion of breakfast cereal was added to the whole grain contribution of bread.
SOURCES: USDA/ARS, 2014; USDA/FNS, 2014; USDA/HHS, 2016.
TABLE T-2b Proportion of 2015–2020 DGA Recommended Amounts of Food Groups in the Current and Revised Food Packages for Partially Breastfeedinga Women as Redeemedb: Food Package V-B
| WIC Food Category | DGA Food Group | Units/d | Current | Revised | Change in Proportion of DGA Recommendation (%)c | DGA 2,600-Kcal Food Patternd | ||
|---|---|---|---|---|---|---|---|---|
| WIC Redeemed Amounts of the Maximum Allowance | Proportion of the DGA Recommendation (%)c | WIC Redeemed Amounts of the Maximum Allowance | Proportion of the DGA Recommendation (%)c | |||||
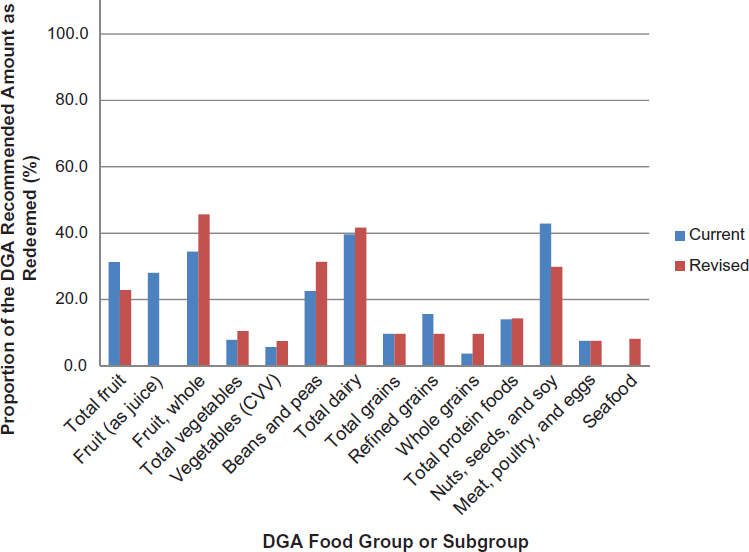
| Total fruit | Total fruit | c-eq | 0.8 | 38 | 1.0 | 49 | 10 | 2.0 |
| Juice, 100% | Fruit, as juice | c-eq | 0.4 | 42 | 0.2 | 21 | −21 | 1.0 |
| Fruit, 67% of CVVe | Fruit, whole | c-eq | 0.3 | 34 | 0.8 | 76 | 42 | 1.0 |
| Total vegetables | Total vegetables | c-eq | 0.3 | 9 | 0.5 | 13 | 5 | 3.5 |
| Vegetables, 33% of CVVf | c-eq | 0.2 | 5 | 0.4 | 11 | 6 | 3.5 | |
| Legumes (as vegetable)g | Legumes (beans and peas) | c-eq | 0.1 | 36 | 0.1 | 25 | −11 | 0.4 |
| Total dairy | Total dairy | c-eq | 1.6 | 55 | 1.4 | 47 | −8 | 3.0 |
| Milk | c-eq | 1.6 | 55 | 1.4 | 47 | −8 | 3.0 | |
| Total grains | Total grains | oz-eq | 1.0 | 11 | 1.1 | 13 | 1 | 9.0 |
| Breakfast cerealh | Refined grains | oz-eq | 0.6 | 13 | 0.3 | 7 | −6 | 4.5 |
| Breakfast cereal | Whole grains | oz-eq | 0.1 | 9i | 0.3 | 18i | 9 | 4.5 |
| Whole wheat bread | Whole grains | oz-eq | 0.3 | 0.5 | ||||
| Total protein foods | Total protein foods | oz-eq | 0.9 | 14 | 0.8 | 12 | −3 | 6.5 |
| Peanut butter | Nuts, seeds, and soy | oz-eq | 0.6 | 86 | 0.2 | 30 | −56 | 0.7 |
| Eggs | Meat, poultry, and eggs | oz-eq | 0.3 | 7 | 0.3 | 7 | 0 | 4.4 |
| Fish | Seafood | oz-eq | 0.0 | 0 | 0.2 | 16 | 16 | 1.4 |
NOTES: c-eq = cup-equivalent; CVV = cash value voucher; DGA = Dietary Guidelines for Americans; oz-eq = ounce-equivalent.
a This table compares the current food package V (provided to both pregnant and partially breastfeeding women) to the revised food package V-B for partially breastfeeding women only.
b Applies redemption factors presented in Appendix R, Table R-5.
c Percentages represent the proportion of the recommended food pattern amount in the corresponding row of the DGA food pattern column. Values may not be replicable from the table due to rounding.
d The 2,600 kcal food pattern was applied to evaluate this package. This kcal level most closely matched the calculated Estimated Energy Requirement (EER) for breastfeeding WIC-participating women in National Health and Nutrition Examination Survey (NHANES) 2005–2012.
e Assumes that 67 percent of the CVV is used to purchase fruits, based on redemption data from Texas and Wyoming. A weighted composite cost of fruit ($0.55/c-eq) was developed, based on the most commonly consumed fruits (bananas, apples, oranges, berries, grapes, melon [watermelon was used in this case]) from an average of Massachusetts, Texas, and Wyoming redemption data. Only fresh fruit was included as all states allow fresh forms; Economic Research Service (ERS) 2013 price data were updated with a Consumer Price Index to 2015 values.
f Assumes that 33 percent of the CVV is used to purchase vegetables, based on redemption data from Texas and Wyoming. A weighted composite cost of vegetables ($0.55/c-eq) was developed, based on the most commonly consumed vegetables (tomatoes, avocados, potatoes, peppers, lettuce) from an average of Massachusetts, Texas, and Wyoming redemption data. Only fresh vegetables were included as all states allow fresh forms; ERS 2013 price data were updated with a Consumer Price Index to 2015 values. Because potatoes were not yet available in Wyoming, the same proportion of potatoes was assumed for this state as for Texas.
g Legumes can also be assessed as a protein, but were placed in the vegetable group because a higher proportion of individuals had low intakes of vegetables across WIC-participating subgroups compared to protein.
h In the current food packages, a ratio of 81 percent refined grains and 19 percent whole grains was applied, based on redemption data; in the revised packages, a ratio of 50 percent refined grains and 50 percent whole grains was applied to account for the requirement that all cereals meet the whole grain-rich criteria.
i To compare the food package contribution to the DGA recommended amounts of whole grains, the whole grain portion of breakfast cereal was added to the whole grain contribution of bread.
SOURCES: USDA/ARS, 2014; USDA/FNS, 2014; USDA/HHS, 2016.
| WIC Food Category | DGA Food Group | Units/d | Current | Revised | Change in Proportion of DGA Recommendation (%)a | DGA 2,300 Kcal Food Patternb | ||
|---|---|---|---|---|---|---|---|---|
| WIC Maximum Allowance | Proportion of the DGA Recommendation (%)a | WIC Maximum Allowance | Proportion of the DGA Recommendation (%)a | |||||
| Total fruit | Total fruit | c-eq | 0.8 | 42 | 0.6 | 30 | −14 | 2.0 |
| Juice, 100% | Fruit, as juice | c-eq | 0.4 | 40 | 0.0 | 0 | −40 | 1.0 |
| Fruit, 67% of CVVc | Fruit, whole | c-eq | 0.4 | 45 | 0.6 | 61 | 12 | 1.0 |
| Total vegetables | Total vegetables | c-eq | 0.3 | 12 | 0.5 | 16 | 4 | 3.0 |
| Vegetable, 33% of CVVd | c-eq | 0.2 | 7 | 0.3 | 10 | 3 | 3.0 | |
| Legumes (as vegetable)e,f | Legumes (beans and peas) | c-eq | 0.1 | 44 | 0.2 | 59 | 15 | 0.3 |
| Total dairy | Total dairy | c-eq | 2.1 | 71 | 2.1 | 71 | 0 | 3.0 |
| Milk | c-eq | 2.1 | 71 | 2.1 | 71 | 0 | 3.0 | |
| Total grains | Total grains | oz-eq | 1.2 | 16 | 1.2 | 16 | 0 | 7.5 |
| Breakfast cerealg | Refined grains | oz-eq | 1.0 | 26 | 0.6 | 16 | −10 | 3.8 |
| Breakfast cereal | Whole grains | oz-eq | 0.2 | 6 | 0.6 | 16 | 10 | 3.8 |
| Total protein foods | Total protein foods | oz-eq | 1.3 | 20 | 1.2 | 19 | −1 | 6.3 |
| Peanut butterf | Nuts, seeds, and soy | oz-eq | 0.6 | 84 | 0.4 | 56 | −28 | 0.7 |
| Eggs | Meat, poultry, and eggs | oz-eq | 0.4 | 9.5 | 0.4 | 9.5 | 0 | 4.2 |
| Fish | Seafood | oz-eq | 0.0 | 0 | 0.1 | 8 | 8 | 1.4 |
NOTES: c-eq = cup-equivalent; CVV = cash value voucher; DGA = Dietary Guidelines for Americans; oz-eq = ounce-equivalent.
a Percentages represent the proportion of the recommended food pattern amount in the corresponding row of the DGA food pattern column. Values may not be replicable from the table due to rounding.
b The 2,300 kcal food pattern was applied to evaluate this package. This kcal level most closely matched the calculated Estimated Energy Requirement (EER) for nonbreastfeeding postpartum WIC-participating women in National Health and Nutrition Examination Survey (NHANES) 2005–2012.
c Assumes that 67 percent of the CVV is used to purchase fruits, based on redemption data from Texas and Wyoming. A weighted composite cost of fruit ($0.55/c-eq) was developed, based on the most commonly consumed fruits (bananas, apples, oranges, berries, grapes, melon [watermelon was used in this case]) from an average of Massachusetts, Texas, and Wyoming redemption data. Only fresh fruit was included as all states allow fresh forms; Economic Research Service (ERS) 2013 price data were updated with a Consumer Price Index to 2015 values.
d Assumes that 33 percent of the CVV is used to purchase vegetables, based on redemption data from Texas and Wyoming. A weighted composite cost of vegetables ($0.55/c-eq) was developed, based on the most commonly consumed vegetables (tomatoes, avocados, potatoes, peppers, lettuce) from an average of Massachusetts, Texas, and Wyoming redemption data. Only fresh vegetables were included as all states allow fresh forms; ERS 2013 price data were updated with a Consumer Price Index to 2015 values. Because potatoes were not yet available in Wyoming, the same proportion of potatoes was assumed for this state as for Texas.
e Legumes can also be assessed as a protein, but they were placed in the vegetable group because a higher proportion of individuals had low intakes of vegetables across WIC-participating subgroups compared to protein.
f For the current food package, assumes 50 percent legumes and 50 percent peanut butter; for the revised package, the proportion provided on a monthly basis was calculated.
g In the current food packages, a ratio of 81 percent refined grains and 19 percent whole grains was applied, based on redemption data; in the revised packages, a ratio of 50 percent refined grains and 50 percent whole grains was applied to account for the requirement that all cereals meet the whole grain-rich criteria.
SOURCES: USDA/ARS, 2014; USDA/FNS, 2014; USDA/HHS, 2016.
TABLE T-3b Proportion of 2015–2020 DGA Recommended Amounts of Food Groups in the Current and Revised Food Packages for Postpartum Women as Redeemeda: Food Package VI*
| WIC Food Category | DGA Food Group | Units/d | Current | Revised | Change in Proportion of DGA Recommendation (%)b | DGA 2,300-Kcal Food Patternc | ||
|---|---|---|---|---|---|---|---|---|
| WIC Redeemed Amounts of the Maximum Allowance | Proportion of the DGA Recommendation (%)b | WIC Redeemed Amounts of the Maximum Allowance | Proportion of the DGA Recommendation (%)b | |||||
| Total fruit | Total fruit | c-eq | 0.6 | 31 | 0.5 | 23 | -8 | 2.0 |
| Juice, 100% | Fruit, as juice | c-eq | 0.3 | 28 | 0 | 0 | −28 | 1.0 |
| Fruit, 67% of CVVd | Fruit, whole | c-eq | 0.3 | 34 | 0.5 | 46 | 11 | 1.0 |
| Total vegetables | Total vegetables | c-eq | 0.2 | 8 | 0.3 | 10 | 3 | 3.0 |
| Vegetables, 33% of CVVe | c-eq | 0.2 | 6 | 0.2 | 8 | 2 | 3.0 | |
| Legumes (as vegetable)f,g | Legumes (beans and peas) | c-eq | 0.1 | 23 | 0.1 | 31 | 9 | 0.3 |
| Total dairy | Total dairy | c-eq | 1.2 | 40 | 1.2 | 42 | 2 | 3.0 |
| Milk | c-eq | 1.2 | 40 | 1.2 | 42 | 2 | 3.0 | |
| Total grains | Total grains | oz-eq | 0.7 | 10 | 0.7 | 9 | −1 | 7.5 |
| Breakfast cerealh | Refined grains | oz-eq | 0.6 | 16 | 0.3 | 9 | −7 | 3.8 |
| Breakfast cereal | Whole grains | oz-eq | 0.1 | 4 | 0.3 | 9 | 5 | 3.8 |
| Total protein foods | Total protein foods | oz-eq | 0.9 | 14 | 0.9 | 14 | 0 | 6.3 |
| Peanut butterg | Nuts, seeds, and soy | oz-eq | 0.3 | 43 | 0.2 | 30 | −13 | 0.7 |
| Eggs | Meat, poultry, and eggs | oz-eq | 0.3 | 8 | 0.3 | 8 | 0 | 4.2 |
| Fish | Seafood | oz-eq | 0.0 | 0 | 0.1 | 8 | 8 | 1.4 |
NOTES: c-eq = cup-equivalent; CVV = cash value voucher; DGA = Dietary Guidelines for Americans; oz-eq = ounce-equivalent.
* Some values in this table are corrected from the original prepublication.
a Applies redemption factors presented in Appendix R, Table R-5.
b Percentages represent the proportion of the recommended food pattern amount in the corresponding row of the DGA food pattern column. Values may not be replicable from the table due to rounding.
c The 2,300 kcal food pattern was applied to evaluate this package. This kcal level most closely matched the calculated Estimated Energy Requirement (EER) for nonbreastfeeding postpartum WIC-participating women in National Health and Nutrition Examination Survey (NHANES) 2005–2012.
d Assumes that 67 percent of the CVV is used to purchase fruits, based on redemption data from Texas and Wyoming. A weighted composite cost of fruit ($0.55/c-eq) was developed, based on the most commonly consumed fruits (bananas, apples, oranges, berries, grapes, melon [watermelon was used in this case]) from an average of Massachusetts, Texas, and Wyoming redemption data. Only fresh fruit was included as all states allow fresh forms; Economic Research Service (ERS) 2013 price data were updated with a Consumer Price Index to 2015 values.
e Assumes that 33 percent of the CVV is used to purchase vegetables, based on redemption data from Texas and Wyoming. A weighted composite cost of vegetables ($0.55/c-eq) was developed, based on the most commonly consumed vegetables (tomatoes, avocados, potatoes, peppers, lettuce) from an average of Massachusetts, Texas, and Wyoming redemption data. Only fresh vegetables were included as all states allow fresh forms; ERS 2013 price data were updated with a Consumer Price Index to 2015 values. Because potatoes were not yet available in Wyoming, the same proportion of potatoes was assumed for this state as for Texas.
f Legumes can also be assessed as a protein, but were placed in the vegetable group because a higher proportion of individuals had low intakes of vegetables across WIC-participating subgroups compared to protein.
g For the current food package, assumes 43 percent legumes and 57 percent peanut butter, based on prescription data from the PC 2014 Food Package Report (USDA/FNS, 2016).
h In the current food packages, a ratio of 81 percent refined grains and 19 percent whole grains was applied, based on redemption data; in the revised packages, a ratio of 50 percent refined grains and 50 percent whole grains was applied to account for the requirement that all cereals meet the whole grain-rich criteria.
SOURCES: USDA/ARS, 2014; USDA/FNS, 2014; USDA/HHS, 2016.
| WIC Food Category | DGA Food Group | Units/d | Current | Revised | Change in Proportion of DGA Recommendation (%)a | DGA 2,600-Kcal Food Patternb | ||
|---|---|---|---|---|---|---|---|---|
| WIC Maximum Allowance | Proportion of the DGA Recommendation (%)a | WIC Maximum Allowance | Proportion of the DGA Recommendation (%)a | |||||
| Total fruit | Total fruit | c-eq | 1.0 | 52 | 1.7 | 84 | 32 | 2.0 |
| Juice, 100% | Fruit, as juice | c-eq | 0.6 | 60 | 0.3 | 27 | −33 | 1.0 |
| Fruit, 67% of CVVc | Fruit, whole | c-eq | 0.4 | 45 | 1.4 | 142 | 97 | 1.0 |
| Total vegetables | Total vegetables | c-eq | 0.5 | 13 | 0.9 | 25 | 11 | 3.5 |
| Vegetables, 33% of CVVd | c-eq | 0.2 | 6 | 0.7 | 20 | 14 | 3.5 | |
| Legumes (as vegetable)e | Legumes (beans and peas) | c-eq | 0.3 | 71 | 0.2 | 47 | −24 | 0.4 |
| Total dairy | Total dairy | c-eq | 3.6 | 119 | 2.1 | 71 | −47 | 3.0 |
| Milk | c-eq | 3.2 | 107 | 2.1 | 71 | −36 | 3.0 | |
| Cheese | c-eq | 0.4 | 12 | 0.0 | 0 | −12 | 3.0 | |
| Total grains | Total grains | oz-eq | 1.7 | 19 | 2.0 | 22 | 3 | 9.0 |
| Breakfast cerealf | Refined grains | oz-eq | 1.0 | 22 | 0.6 | 13 | −8 | 4.5 |
| Breakfast cereal | Whole grains | oz-eq | 0.2 | 17g | 0.6 | 31g | 14 | 4.5 |
| Whole wheat bread | Whole grains | oz-eq | 0.5 | 0.8 | ||||
| Total protein foods | Total protein foods | oz-eq | 3.3 | 50 | 2.1 | 33 | −17 | 6.5 |
| Peanut butter | Nuts, seeds, and soy | oz-eq | 1.2 | 168 | 0.4 | 56 | −112 | 0.7 |
| Eggs | Meat, poultry, and eggs | oz-eq | 0.8 | 18 | 0.8 | 18 | 0 | 4.4 |
| Fish | Seafood | oz-eq | 1.0 | 70 | 0.7 | 47 | −23 | 1.4 |
NOTES: c-eq = cup-equivalent; CVV = cash value voucher; DGA = Dietary Guidelines for Americans; oz-eq = ounce-equivalent.
a Percentages represent the proportion of the recommended food pattern amount in the corresponding row of the DGA food pattern column. Values may not be replicable from the table due to rounding.
b The 2,600-kcal food pattern was applied to evaluate this package. This kcal level most closely matched the calculated Estimated Energy Requirement (EER) for WIC-participating women coded as breastfeeding in National Health and Nutrition Examination Survey (NHANES) 2005–2012.
c Assumes that 67 percent of the CVV is used to purchase fruits, based on redemption data from Texas and Wyoming. A weighted composite cost of fruit ($0.55/c-eq) was developed, based on the most commonly consumed fruits (bananas, apples, oranges, berries, grapes, melon [watermelon was used in this case]) from an average of Massachusetts, Texas, and Wyoming redemption data. Only fresh fruit was included as all states allow fresh forms; Economic Research Service (ERS) 2013 price data were updated with a Consumer Price Index to 2015 values.
d Assumes that 33 percent of the CVV is used to purchase vegetables, based on redemption data from Texas and Wyoming. A weighted composite cost of vegetables ($0.55/c-eq) was developed, based on the most commonly consumed vegetables (tomatoes, avocados, potatoes, peppers, lettuce) from an average of Massachusetts, Texas, and Wyoming redemption data. Only fresh vegetables were included as all states allow fresh forms; ERS 2013 price data were updated with a Consumer Price Index to 2015 values. Because potatoes were not yet available in Wyoming, the same proportion of potatoes was assumed for this state as for Texas.
e Legumes can also be assessed as a protein, but they were placed in the vegetable group because a higher proportion of individuals had low intakes of vegetables across WIC-participating subgroups compared to protein.
f In the current food packages, a ratio of 81 percent refined grains and 19 percent whole grains was applied, based on redemption data; in the revised packages, a ratio of 50 percent refined grains and 50 percent whole grains was applied to account for the requirement that all cereals meet the whole grain-rich criteria.
g To compare the food package contribution to the DGA recommended amounts of whole grains, the whole grain portion of breakfast cereal was added to the whole grain contribution of bread.
SOURCES: USDA/ARS, 2014; USDA/FNS, 2014; USDA/HHS, 2016.
TABLE T-4b Proportion of 2015–2020 DGA Recommended Amounts of Food Groups in the Current and Revised Food Packages for Postpartum Women as Redeemeda: Food Package VII
| WIC Food Category | DGA Food Group | Units/d | Current | Revised | Change in Proportion of DGA Recommendation (%)b | DGA 2,600-Kcal Food Patternc | ||
|---|---|---|---|---|---|---|---|---|
| WIC Redeemed Amounts of the Maximum Allowance | Proportion of the DGA Recommendation (%)b | WIC Redeemed Amounts of the Maximum Allowance | Proportion of the DGA Recommendation (%)b | |||||
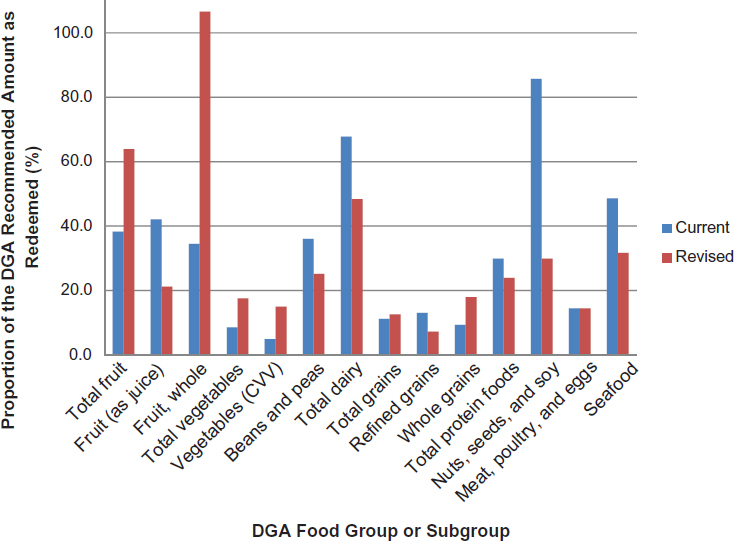
| Total fruit | Total fruit | c-eq | 0.8 | 38 | 1.3 | 64 | 26 | 2.0 |
| Juice, 100% | Fruit, as juice | c-eq | 0.4 | 42 | 0.2 | 21 | −21 | 1.0 |
| Fruit, 67% of CVVd | Fruit, whole | c-eq | 0.3 | 34 | 1.1 | 107 | 72 | 1.0 |
| Total vegetables | Total vegetables | c-eq | 0.3 | 9 | 0.6 | 18 | 9 | 3.5 |
| Vegetables, 33% of CVVe | c-eq | 0.2 | 5 | 0.5 | 15 | 10 | 3.5 | |
| Legumes (as vegetable)f | Legumes (beans and peas) | c-eq | 0.1 | 36 | 0.1 | 25 | −11 | 0.4 |
| Total dairy | Total dairy | c-eq | 2.0 | 68 | 1.4 | 48 | −19 | 3.0 |
| Milk | c-eq | 1.8 | 59 | 1.4 | 48 | −11 | 3.0 | |
| Cheese | c-eq | 0.2 | 8 | 0.0 | 0 | −8 | 3.0 | |
| Total grains | Total grains | oz-eq | 1.0 | 11 | 1.1 | 13 | 1 | 9.0 |
| Breakfast cerealg | Refined grains | oz-eq | 0.6 | 13 | 0.3 | 7 | −5.8 | 4.5 |
| Breakfast cereal | Whole grains | oz-eq | 0.1 | 9h | 0.3 | 18h | 8.6 | 4.5 |
| Whole wheat bread | Whole grains | oz-eq | 0.3 | 0.5 | ||||
| Total protein foods | Total protein foods | oz-eq | 1.9 | 30 | 1.6 | 24 | −6 | 6.5 |
| Peanut butter | Nuts, seeds, and soy | oz-eq | 0.6 | 86 | 0.2 | 30 | −56 | 0.7 |
| Eggs | Meat, poultry, and eggs | oz-eq | 0.6 | 14 | 0.6 | 14 | 0 | 4.4 |
| Fish | Seafood | oz-eq | 0.7 | 49 | 0.5 | 32 | −17 | 1.4 |
NOTES: c-eq = cup-equivalent; CVV = cash value voucher; DGA = Dietary Guidelines for Americans; oz-eq = ounce-equivalent.
a Applies redemption factors presented in Appendix R, Table R-5.
b Percentages represent the proportion of the recommended food pattern amount in the corresponding row of the DGA food pattern column. Values may not be replicable from the table due to rounding.
c The 2,600-kcal food pattern was applied to evaluate this package. This kcal level most closely matched the calculated Estimated Energy Requirement (EER) for WIC-participating women coded as breastfeeding in National Health and Nutrition Examination Survey (NHANES) 2005–2012.
d Assumes that 67 percent of the CVV is used to purchase fruits, based on redemption data from Texas and Wyoming. A weighted composite cost of fruit ($0.55/c-eq) was developed, based on the most commonly consumed fruits (bananas, apples, oranges, berries, grapes, melon [watermelon was used in this case]) from an average of Massachusetts, Texas, and Wyoming redemption data. Only fresh fruit was included as all states allow fresh forms; Economic Research Service (ERS) 2013 price data were updated with a Consumer Price Index to 2015 values.
e Assumes that 33 percent of the CVV is used to purchase vegetables, based on redemption data from Texas and Wyoming. A weighted composite cost of vegetables ($0.55/c-eq) was developed, based on the most commonly consumed vegetables (tomatoes, avocados, potatoes, peppers, lettuce) from an average of Massachusetts, Texas, and Wyoming redemption data. Only fresh vegetables were included as all states allow fresh forms; ERS 2013 price data were updated with a Consumer Price Index to 2015 values. Because potatoes were not yet available in Wyoming, the same proportion of potatoes was assumed for this state as for Texas.
f Legumes can also be assessed as a protein, but they were placed in the vegetable group because a higher proportion of individuals had low intakes of vegetables across WIC-participating subgroups compared to protein.
g In the current food packages, a ratio of 81 percent refined grains and 19 percent whole grains was applied, based on redemption data; in the revised packages, a ratio of 50 percent refined grains and 50 percent whole grains was applied to account for the requirement that all cereals meet the whole grain-rich criteria.
h To compare the food package contribution to the DGA recommended amounts of whole grains, the whole grain portion of breakfast cereal was added to the whole grain contribution of bread.
SOURCES: USDA/ARS, 2014; USDA/FNS, 2014; USDA/HHS, 2016.
TABLE T-5a Proportion of 2015–2020 DGA Recommended Amounts of Food Groups in the Current and Revised Food Packages for Children Ages 2 to Less Than 5 Years Assuming Full Redemption: Food Package IV-Ba
| WIC Food Category | DGA Food Group | Units/d | Current | Revised | Change in % of DGA Recommendationb | DGA 1,300-Kcal Food Patternc | ||
|---|---|---|---|---|---|---|---|---|
| WIC Redeemed Amounts of the Maximum Allowance | Proportion of the DGA Recommendation (%)b | WIC Redeemed Amounts of the Maximum Allowance | Proportion of the DGA Recommendation (%)b | |||||
| Total fruit | Total fruit | c-eq | 0.9 | 69 | 0.8 | 60 | −8 | 1.3 |
| Juice, 100% | Fruit, as juice | c-eq | 0.5 | 107 | 0.3 | 53 | −53 | 0.5j |
| Fruit, 67% of CVVd | Fruit, whole | c-eq | 0.3 | 43 | 0.5 | 65 | 22 | 0.8 |
| Total vegetables | Total vegetables | c-eq | 0.3 | 19 | 0.3 | 22 | 3 | 1.5 |
| Vegetables, 33% of CVVe | c-eq | 0.2 | 11 | 0.2 | 16 | 5 | 1.5 | |
| Legumes (as vegetable)f,g | Legumes (beans and peas) | c-eq | 0.13 | 177 | 0.08 | 120 | −56 | 0.1 |
| Total dairy | Total dairy | c-eq | 2.1 | 85 | 1.9 | 75 | −11 | 2.5 |
| Milk | c-eq | 2.1 | 85 | 1.9 | 75 | −11 | 2.5 | |
| Total grains | Total grains | oz-eq | 2.3 | 50 | 2.0 | 44 | −6 | 4.5 |
| Breakfast cerealh | Refined grains | oz-eq | 1.0 | 43 | 0.6 | 27 | −17 | 2.3 |
| Breakfast cereal | Whole grains | oz-eq | 0.2 | 58i | 0.6 | 61i | 3 | 2.3 |
| Whole wheat bread | Whole grains | oz-eq | 1.1 | 0.8 | ||||
| Total protein foods | Total protein foods | oz-eq | 1.0 | 29 | 1.2 | 33 | 5 | 3.5 |
| Peanut butterg | Nuts, seeds, and soy | oz-eq | 0.6 | 167 | 0.4 | 111 | −56 | 0.4 |
| Eggs | Meat, poultry, and eggs | oz-eq | 0.4 | 17 | 0.4 | 17 | 0 | 2.4 |
| Fish | Seafood | oz-eq | 0.0 | 0 | 0.1 | 19 | 19 | 0.6 |
NOTES: c-eq = cup-equivalent; CVV = cash value voucher; DGA = Dietary Guidelines for Americans; oz-eq = ounce-equivalent.
a The DGA apply to individuals ages 2 years and older; therefore, although food package IV-A is also issued to younger children, food groups can only be evaluated for food package IV-B.
b Percentages represent the proportion of the recommended food pattern amount in the corresponding row of the DGA food pattern column. Values may not be replicable from the table due to rounding.
c A pattern of 1,300 kcal was selected for this age group because (1) the latter level reflects increases in body weights for young children and was considered too high for normal weight children in this age group, particularly in light of efforts to reduce and/or contain the prevalence of childhood obesity, and (2) the 1,300-kcal pattern was applied in both the previous WIC food package review (IOM, 2006) and the Child and Adult Food Care Program (CACFP) report (IOM, 2011) and should similarly be appropriate for current WIC-participating children of the same ages.
d Assumes that 67 percent of the CVV is used to purchase fruits, based on redemption data from Texas and Wyoming. A weighted composite cost of fruit ($0.55/c-eq) was developed, based on the most commonly consumed fruits (bananas, apples, oranges, berries, grapes, melon [watermelon was used in this case]) from an average of Massachusetts, Texas, and Wyoming redemption data. Only fresh fruit was included as all states allow fresh forms; Economic Research Service (ERS) 2013 price data were updated with a Consumer Price Index to 2015 values.
e Assumes that 33 percent of the CVV is used to purchase vegetables, based on redemption data from Texas and Wyoming. A weighted composite cost of vegetables ($0.55/c-eq) was developed, based on the most commonly consumed vegetables (tomatoes, avocados, potatoes, peppers, lettuce) from an average of Massachusetts, Texas, and Wyoming redemption data. Only fresh vegetables were included as all states allow fresh forms; ERS 2013 price data were updated with a Consumer Price Index to 2015 values. Because potatoes were not yet available in Wyoming, the same proportion of potatoes was assumed for this state as for Texas.
f Legumes can also be assessed as a protein, but they were placed in the vegetable group because a higher proportion of individuals had low intakes of vegetables across WIC-participating subgroups compared to protein.
g For the current food package, assumes 50 percent legumes and 50 percent peanut butter; for the revised package, the proportions of each provided per month were calculated.
h In the current food packages, a ratio of 81 percent refined grains and 19 percent whole grains was applied, based on redemption data; in the revised packages, a ratio of 50 percent refined grains and 50 percent whole grains was applied to account for the requirement that all cereals meet the whole grain-rich criteria.
i To compare the food package contribution to the DGA recommended amounts of whole grains, the whole grain portion of breakfast cereal was added to the whole grain contribution of bread.
j Equivalent to 4 oz per day, the lower end of AAP guideline of not more than 4–6 ounces per day.
SOURCES: IOM, 2006, 2011; USDA/ARS, 2014; USDA/FNS, 2014, 2016; USDA/HHS, 2016.
TABLE T-5b Proportion of 2015–2020 DGA Recommended Amounts of Food Groups in the Current and Revised Food Packages for Children Ages 2 to Less Than 5 Years as Redeemeda: Food Package IV-Bb
| WIC Food Category | DGA Food Group | Units/d | Current | Revised | Change in % of DGA Recommendationc | DGA 1,300-Kcal Food Patternd | ||
|---|---|---|---|---|---|---|---|---|
| WIC Redeemed Amounts of the Maximum Allowance | Proportion of the DGA Recommendation (%)c | WIC Redeemed Amounts of the Maximum Allowance | Proportion of the DGA Recommendation (%)c | |||||
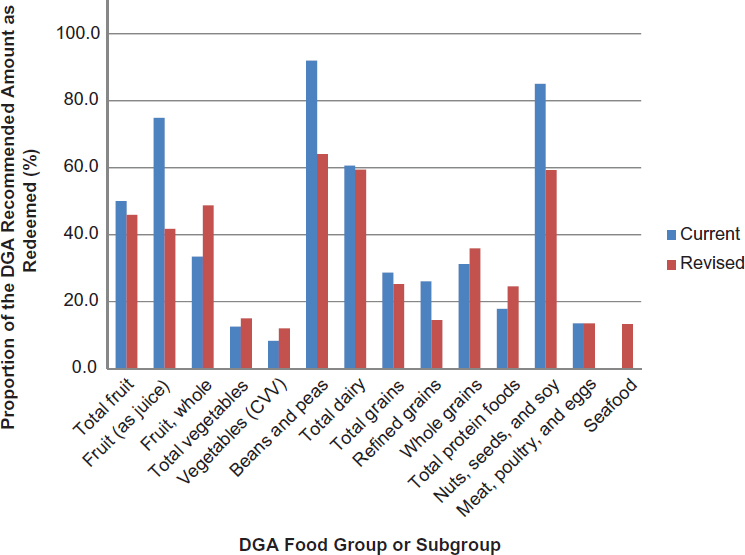
| Total fruit | Total fruit | c-eq | 0.6 | 50 | 0.6 | 46 | −4 | 1.3 |
| Juice, 100% | Fruit, as juice | c-eq | 0.4 | 75 | 0.2 | 42 | −33 | 0.5k |
| Fruit, 67% of CVVe | Fruit, whole | c-eq | 0.3 | 33 | 0.4 | 49 | 15 | 0.8 |
| Total vegetables | Total vegetables | c-eq | 0.2 | 13 | 0.2 | 15 | 2 | 1.5 |
| Vegetables, 33% of CVVf | c-eq | 0.1 | 8 | 0.2 | 12 | 4 | 1.5 | |
| Legumes (as vegetable)g,h | Legumes (beans and peas) | c-eq | 0.06 | 92 | 0.04 | 64 | −28 | 0.1 |
| Total dairy | Total dairy | c-eq | 1.5 | 61 | 1.5 | 59 | −1 | 2.5 |
| Milk | c-eq | 1.5 | 61 | 1.5 | 59 | −1 | 2.5 | |
| Total grains | Total grains | oz-eq | 1.3 | 29 | 1.1 | 25 | −3 | 4.5 |
| Breakfast cereali | Refined grains | oz-eq | 0.6 | 26 | 0.3 | 14 | −12 | 2.3 |
| Breakfast cereal | Whole grains | oz-eq | 0.1 | 31j | 0.3 | 36j | 30 | 2.3 |
| Whole wheat bread | Whole grains | oz-eq | 0.6 | 0.5 | ||||
| Total protein foods | Total protein foods | oz-eq | 0.6 | 18 | 0.9 | 25 | 7 | 3.5 |
| Peanut butterh | Nuts, seeds and soy | oz-eq | 0.3 | 85 | 0.2 | 59 | −26 | 0.4 |
| Eggs | Meat, poultry, eggs | oz-eq | 0.3 | 14 | 0.3 | 14 | 0 | 2.4 |
| Fish | Seafood | oz-eq | 0.0 | 0 | 0.1 | 13 | 13 | 0.6 |
NOTES: c-eq = cup-equivalent; CVV = cash value voucher; DGA = Dietary Guidelines for Americans; oz-eq = ounce-equivalent.
a Applies redemption factors presented in Appendix R, Table R-5.
b The DGA apply to individuals ages 2 years and older; therefore, although food package IV-A is also issued to younger children, food groups can only be evaluated for food package IV-B.
c Percentages represent the proportion of the recommended food pattern amount in the corresponding row of the DGA food pattern column. Values may not be replicable from the table due to rounding.
d A pattern of 1,300 kcal was selected for this age group because (1) the latter level reflects increases in body weights for young children and was considered too high for normal weight children in this age group, particularly in light of efforts to reduce and/or contain the prevalence of childhood obesity, and (2) the 1,300-kcal pattern was applied in both the previous WIC food package review (IOM, 2006) and the CACFP report (IOM, 2011) and should similarly be appropriate for current WIC participating children of the same ages.
e Assumes that 67 percent of the CVV is used to purchase fruits, based on redemption data from Texas and Wyoming. A weighted composite cost of fruit ($0.55/c-eq) was developed, based on the most commonly consumed fruits (bananas, apples, oranges, berries, grapes, melon [watermelon was used in this case]) from an average of Massachusetts, Texas, and Wyoming redemption data. Only fresh fruit was included as all states allow fresh forms; Economic Research Service (ERS) 2013 price data were updated with a Consumer Price Index to 2015 values.
f Assumes that 33 percent of the CVV is used to purchase vegetables, based on redemption data from Texas and Wyoming. A weighted composite cost of vegetables ($0.55/c-eq) was developed, based on the most commonly consumed vegetables (tomatoes, avocados, potatoes, peppers, lettuce) from an average of Massachusetts, Texas, and Wyoming redemption data. Only fresh vegetables were included as all states allow fresh forms; ERS 2013 price data were updated with a Consumer Price Index to 2015 values. Because potatoes were not yet available in Wyoming, the same proportion of potatoes was assumed for this state as for Texas.
g Legumes can also be assessed as a protein, but they were placed in the vegetable group because a higher proportion of individuals had low intakes of vegetables across WIC-participating subgroups compared to protein.
h For the current food package, assumes 43 percent legumes and 57 percent peanut butter, based on prescription data from the PC 2014 Food Package Report (USDA/FNS, 2016).
i In the current food packages, a ratio of 81 percent refined grains and 19 percent whole grains was applied, based on redemption data; in the revised packages, a ratio of 50 percent refined grains and 50 percent whole grains was applied to account for the requirement that all cereals meet the whole grain-rich criteria.
j To compare the food package contribution to the DGA recommended amounts of whole grains, the whole grain portion of breakfast cereal was added to the whole grain contribution of bread.
k Equivalent to 4 oz per day, the lower end of the AAP guideline of not more than 4–6 ounces per day.
SOURCES: IOM, 2006, 2011; USDA/ARS, 2014; USDA/FNS, 2014, 2016; USDA/HHS, 2016.
TABLE T-6a Proportion of Dietary Reference Intakes or DGA Limits Provided by the Current and Revised Food Packages for Pregnant and Partially Breastfeeding Women Assuming Full Redemption: Food Packages V-A and V-B*
| Nutrient | EAR/AIa (19–30y/31–50y) | Current | Revised | % Change, Pregnant | % Change, Partial BF | |||
|---|---|---|---|---|---|---|---|---|
| Amount | % DRI | Amount, Pregnant | Amount, Partial BF | % DRI, Pregnant | ||||
| Higher Priority | ||||||||
| Iron (mg) | 22 | 14 | 62 | 13.0 | 13 | 59 | −4 | −1 |
| Choline (mg) | 450b | 74.9 | 17 | 78.6 | 87 | 17 | +5 | +17 |
| Potassium (mg) | 4,700b | 1,837 | 39 | 1,473 | 1,688 | 31 | −20 | −8 |
| Fiber (g) | 28b | 8.0 | 29 | 7.4 | 9.3 | 27 | −7 | +16 |
| Sodium (mg) | 1,500b | 727 | 48 | 572 | 592 | 38 | −21 | −19 |
| Saturated fat (g) | 29 | 8.5 | 29 | 5.7 | 5.9 | 19 | −34 | −31 |
| Added sugars (g) | 65.6 | 7.4 | 11 | 7.5 | 7.5 | 11 | +1 | +1 |
| Middle Priority | ||||||||
| Folate (µg DFE) | 520 | 473 | 91 | 442 | 460 | 85 | −7 | −3 |
| Lower Priority | ||||||||
| Magnesium (mg) | 290/300 | 198 | 68/68 | 150.3 | 164 | 52/50 | −24 | −17 |
| Vitamin A (µg RAE) | 550 | 646 | 117 | 544.7 | 564 | 99 | −16 | −13 |
| Zinc (mg) | 9.5 | 6.6 | 69 | 5.5 | 5.7 | 58 | −16 | −13 |
| Vitamin C (mg) | 70 | 72.2 | 103 | 57.4 | 78.0 | 82 | −20 | +8 |
| Vitamin B6 (mg) | 1.6 | 1.3 | 79 | 1.2 | 1.3 | 73 | −8 | +3 |
| Vitamin D (IU) | 400 | 291 | 73 | 229 | 237 | 57 | −21 | −19 |
| Calcium (mg) | 800 | 1,029 | 129 | 796 | 811 | 100 | −23 | −21 |
| Nutrient | EAR/AIa (19–30y/31–50y) | Current | Revised | % Change, Pregnant | % Change, Partial BF | |||
|---|---|---|---|---|---|---|---|---|
| Amount | % DRI | Amount, Pregnant | Amount, Partial BF | % DRI, Pregnant | ||||
| Other | ||||||||
| Energy (kcal) | 2,625c | 787 | 30 | 614 | 677 | 23 | −22 | −14 |
| Protein (g) | 71 (RDA)d | 39 | 55 | 30.3 | 32 | 43 | −23 | −17 |
| Phosphorus (mg) | 580 | 976 | 168 | 762 | 793 | 131 | −22 | −19 |
| Copper (mg) | 0.8 | 0.4 | 55 | 0.3 | 0.4 | 44 | −21 | −7 |
| Selenium (µg) | 49 | 31.6 | 65 | 31.0 | 36 | 63 | −2 | +12 |
| Thiamin (mg) | 1.2 | 0.9 | 76 | 0.8 | 0.9 | 68 | −11 | −6 |
| Riboflavin (mg) | 1.2 | 1.8 | 148 | 1.5 | 1.5 | 123 | −17 | −14 |
| Niacin (mg) | 14 | 9.9 | 71 | 8.7 | 9.7 | 62 | −13 | −2 |
| Vitamin B12 (µg) | 2.2 | 4.4 | 198 | 3.8 | 4.0 | 175 | −12 | −7 |
| Vitamin E (mg) | 12 | 3.6 | 30 | 2.6 | 3.0 | 22 | −26 | −17 |
NOTES: BF = breastfeeding; DFE = dietary folate equivalents; DGA = Dietary Guidelines for Americans; DRI = Dietary Reference Intake; EAR/AI = Estimated Average Requirement/Adequate Intake; RAE = retinol activity equivalents; RDA = Recommended Dietary Allowance. Shading indicates nutrients to limit. See Chapter 5 for description of nutrient priorities.
* Some values in this table are corrected from the original prepublication version.
a Values represent the EAR/AI for pregnant women.
b Indicates AI.
c Value is the median estimated energy requirement (EER) calculated by the committee. Values differ slightly from those in Chapter 4 because EER values for that chapter were re-calculated in a different statistical program to generate percentiles. The means are equivalent for the two analyses.
d The RDA (provided in units of g/d) was used for evaluation of the food package content because the EAR is provided in units of g/kg/d.
SOURCE: USDA National Nutrient Database for Standard Reference, Release 28 (USDA/ARS, 2016).
TABLE T-6b Proportion of Dietary Reference Intakes or DGA Limits Provided by the Current and Revised Food Packages for Pregnant and Partially Breastfeeding Women as Redeemeda: Food Packages V-A and V-B*
| Nutrient | EAR/AIb (19–30y/31–50y) | Current | Revised | % Change, Pregnant | % Change, Partial BF | |||
|---|---|---|---|---|---|---|---|---|
| Amount | % DRI | Amount, Pregnant | Amount, Partial BF | % DRI, Pregnant | ||||
| Higher Priority | ||||||||
| Iron (mg) | 22 | 8.2 | 37 | 7.3 | 7.6 | 33 | −10 | −7 |
| Choline (mg) | 450c | 57.4 | 13 | 60 | 66 | 13 | +4 | +16 |
| Potassium (mg) | 4,700c | 1,096 | 23 | 983 | 1,143 | 21 | −10 | +4 |
| Fiber (g) | 28c | 4.9 | 17 | 4.7 | 6.0 | 17 | −4 | 24 |
| Sodium (mg) | 1,500c | 416 | 28 | 356 | 370 | 24 | −14 | −11 |
| Added sugars (g) | 66 | 4.3 | 6.6 | 4.3 | 4.3 | 7 | 0 | 0 |
| Saturated fat (g) | 29 | 6.0 | 21 | 3.7 | 3.9 | 13 | −38 | −36 |
| Middle Priority | ||||||||
| Folate (µg DFE) | 520 | 283 | 54 | 251 | 265 | 48 | −11 | −6 |
| Lower Priority | ||||||||
| Magnesium (mg) | 290/300 | 114 | 39/38 | 96 | 106 | 33/32 | −16 | −7 |
| Vitamin A (µg RAE) | 550 | 381 | 69 | 341 | 355 | 62 | −11 | −7 |
| Zinc (mg) | 9.5 | 3.8 | 40 | 3.4 | 3.5 | 36 | −11 | −8 |
| Vitamin C (mg) | 70 | 50.8 | 73 | 42 | 58 | 61 | −17 | –14 |
| Vitamin B6 (mg) | 1.6 | 0.8 | 48 | 0.7 | 0.8 | 44 | −8 | +6 |
| Nutrient | EAR/AIb (19–30y/31–50y) | Current | Revised | % Change, Pregnant | % Change, Partial BF | |||
|---|---|---|---|---|---|---|---|---|
| Amount | % DRI | Amount, Pregnant | Amount, Partial BF | % DRI, Pregnant | ||||
| Vitamin D (IU) | 400 | 168 | 42 | 148 | 154 | 37 | −12 | −8 |
| Calcium (mg) | 800 | 581 | 73 | 517 | 528 | 65 | −11 | −9 |
| Other | ||||||||
| Energy (kcal) | 2,625d | 468 | 18 | 396 | 442 | 15 | −15 | −5 |
| Protein (g) | 71 (RDA)e | 22.4 | 32 | 19.6 | 21.1 | 28 | −13 | −6 |
| Phosphorus (mg) | 580 | 559 | 96 | 493 | 515 | 85 | −12 | −8 |
| Copper (mg) | 0.8 | 0.3 | 32 | 0.2 | 0.3 | 28 | −15 | –2 |
| Selenium (µg) | 49 | 19 | 39 | 21 | 24 | 42 | 6 | +22 |
| Thiamin (mg) | 1.2 | 0.5 | 45 | 0.5 | 0.5 | 40 | −10 | −4 |
| Riboflavin (mg) | 1.2 | 1.0 | 86 | 0.9 | 1.0 | 78 | −10 | −7 |
| Niacin (mg) | 14 | 5.8 | 41 | 5.0 | 5.7 | 36 | −14 | −1 |
| Vitamin B12 (µg) | 2.2 | 2.5 | 116 | 2.4 | 2.5 | 108 | −7 | −2 |
| Vitamin E (mg) | 12 | 2.1 | 17 | 1.6 | 1.8 | 13 | −23 | −12 |
NOTES: BF = breastfeeding; DFE = dietary folate equivalents; DGA = Dietary Guidelines for Americans; DRI = Dietary Reference Intake; EAR/AI = Estimated Average Requirement/Adequate Intake; IU = international units; RAE = retinol activity equivalents; RDA = Recommended Dietary Allowance. Shading indicates nutrients to limit. See Chapter 5 for description of nutrient priorities.
* Some values in this table are corrected from the original prepublication version.
a Applies redemption factors presented in Appendix R, Table R-5.
b Values represent the EAR/AI for pregnant women.
c Indicates an AI.
d Value is the median estimated energy requirement (EER) calculated by the committee. Values differ slightly from those in Chapter 4 because EER values for that chapter were re-calculated in a different statistical program to generate percentiles. The means are equivalent for the two analyses.
e The RDA (provided in units of g/d) was used for evaluation of the food package content because the EAR is provided in units of g/kg/d.
SOURCE: USDA National Nutrient Database for Standard Reference, Release 28 (USDA/ARS, 2016).
TABLE T-7a Proportion of Dietary Reference Intakes or DGA Limits Provided by the Current and Revised Food Packages for Postpartum Women Assuming Full Redemption: Food Package VI*
| Nutrient | EAR/AI (19–30y/31–50y) | Current | Revised | % Change | ||
|---|---|---|---|---|---|---|
| Amount | % DRI | Amount | % DRI | |||
| Higher Priority | ||||||
| Calcium (mg) | 800 | 739 | 92 | 766 | 96 | +4 |
| Potassium (mg) | 4,700a | 1,302 | 28 | 1,356 | 29 | +4 |
| Fiber (g) | 25a | 5.7 | 23 | 6.4 | 25 | +12 |
| Sodium (mg) | 1,500a | 527 | 35 | 512 | 34 | −3 |
| Added sugars (g) | 59 | 6.9 | 12 | 7.5 | 13 | +9 |
| Middle Priority | ||||||
| Folate (µg DFE) | 320 | 425 | 133 | 436 | 136 | +3 |
| Vitamin D (IU) | 400 | 213 | 53 | 229 | 57 | +8 |
| Iron (mg) | 8.1 | 12 | 152 | 12.3 | 152 | 0 |
| Saturated fat (g) | 26 | 6.4 | 25 | 5.6 | 21 | −13 |
| Lower Priority | ||||||
| Magnesium (mg) | 255/265 | 132 | 52/50 | 134 | 52/50 | +2 |
| Vitamin A (µg RAE) | 500 | 522 | 104 | 537 | 107 | +3 |
| Vitamin C (mg) | 60 | 57 | 95 | 40.3 | 67 | −30 |
| Copper (mg) | 0.7 | 0.3 | 42 | 0.3 | 43 | +4 |
| Zinc (mg) | 6.8 | 5.2 | 76 | 5.2 | 77 | +2 |
| Thiamin (mg) | 0.9 | 0.7 | 81 | 0.8 | 84 | +4 |
| Nutrient | EAR/AI (19–30y/31–50y) | Current | Revised | % Change | ||
|---|---|---|---|---|---|---|
| Amount | % DRI | Amount | % DRI | |||
| Vitamin B6 (mg) | 1.1 | 1.1 | 97 | 1.1 | 101 | +3 |
| Vitamin B12 (µg) | 2 | 3.6 | 180 | 3.8 | 192 | +7 |
| Riboflavin (mg) | 0.9 | 1.4 | 153 | 1.4 | 160 | +5 |
| Niacin (mg) | 11 | 8.0 | 72 | 8.0 | 73 | +1 |
| Other | ||||||
| Energy (kcal) | 2,350b | 572 | 24 | 543 | 23 | −5 |
| Protein (g) | 46 (RDA)c | 28 | 60 | 28.4 | 62 | +3 |
| Phosphorus (mg) | 580 | 690 | 119 | 718 | 124 | +4 |
| Selenium (µg) | 45 | 25 | 56 | 28 | 61 | +10 |
| Choline (mg) | 425a | 71 | 17 | 75 | 18 | +5 |
| Vitamin E (mg) | 12 | 2.5 | 20 | 2.3 | 19 | −6 |
NOTES: DFE = dietary folate equivalents; DGA = Dietary Guidelines for Americans; DRI = Dietary Reference Intake; EAR/AI = Estimated Average Requirement/Adequate Intake; RAE = retinol activity equivalents; RDA = Recommended Dietary Allowance. Shading indicates nutrients to limit. See Chapter 5 for description of nutrient priorities.
* Some values in this table are corrected from the original prepublication version.
a Indicates AI.
b Value is the median estimated energy requirement (EER) calculated by the committee. Values differ slightly from those in Chapter 4 because EER values for that chapter were re-calculated in a different statistical program to generate percentiles. The means are equivalent for the two analyses.
c The RDA (provided in units of g/d) was used for evaluation of the food package content because the EAR is provided in units of g/kg/d.
SOURCE: USDA National Nutrient Database for Standard Reference, Release 28 (USDA/ARS, 2016).
TABLE T-7b Proportion of Dietary Reference Intakes or DGA Limits Provided by the Current and Revised Food Packages for Postpartum Women as Redeemeda: Food Package VI*
| Nutrient | EAR/AI (19–30y/31–50y) | Current | Revised | % Change | ||
|---|---|---|---|---|---|---|
| Amount | % DRI | Amount | % DRI | |||
| Higher Priority | ||||||
| Calcium (mg) | 800 | 421 | 53 | 451 | 56 | +7 |
| Potassium (mg) | 4,700b | 796 | 17 | 839 | 18 | +5 |
| Fiber (g) | 25b | 3.7 | 15 | 4.0 | 16 | +9 |
| Sodium (mg) | 1,500b | 307 | 24 | 299 | 20 | −2 |
| Added sugars (g) | 58.7 | 4.0 | 7 | 4.1 | 7 | +3 |
| Middle Priority | ||||||
| Folate (µg DFE) | 320 | 257 | 80 | 245 | 77 | −5 |
| Vitamin D (IU) | 400 | 124 | 31 | 136 | 34 | +10 |
| Iron (mg) | 8.1 | 7.5 | 93 | 6.9 | 85 | −9 |
| Saturated fat (g) | 26 | 3.7 | 15 | 3.4 | 13 | −9 |
| Lower Priority | ||||||
| Magnesium (mg) | 255/265 | 78 | 31/29 | 80 | 31/30 | +3 |
| Vitamin A (µg RAE) | 500 | 312 | 62 | 317 | 63 | 1 |
| Vitamin C (mg) | 60 | 40.7 | 68 | 29 | 47 | −30 |
| Copper (mg) | 0.7 | 0.2 | 26 | 0.2 | 27 | +4 |
| Zinc (mg) | 6.8 | 3.1 | 45 | 3.1 | 45 | 0 |
| Thiamin (mg) | 0.9 | 0.4 | 48 | 0.4 | 48 | −1 |
| Nutrient | EAR/AI (19–30y/31–50y) | Current | Revised | % Change | ||
|---|---|---|---|---|---|---|
| Amount | % DRI | Amount | % DRI | |||
| Vitamin B6 (mg) | 1.1 | 0.7 | 60 | 0.7 | 60 | −1 |
| Vitamin B12 (µg) | 2 | 2.1 | 106 | 2.2 | 111 | +5 |
| Riboflavin (mg) | 0.9 | 0.8 | 91 | 0.9 | 95 | +5 |
| Niacin (mg) | 11 | 4.8 | 43 | 4.6 | 42 | −4 |
| Other | ||||||
| Energy (kcal) | 2,350c | 349 | 15 | 330 | 14 | −5 |
| Protein (g) | 46 (RDA)d | 16 | 35 | 17 | 37 | +6 |
| Phosphorus (mg) | 580 | 402 | 69 | 428 | 74 | +7 |
| Selenium (µg) | 45 | 16 | 35 | 18 | 39 | +12 |
| Choline (mg) | 425b | 56 | 13 | 58 | 14 | +4 |
| Vitamin E (mg) | 12 | 1.5 | 13 | 1.4 | 12 | −7 |
NOTES: DFE = dietary folate equivalents; DGA = Dietary Guidelines for Americans; DRI = Dietary Reference Intake; EAR/AI = Estimated Average Requirement/Adequate Intake; RAE = retinol activity equivalents; RDA = Recommended Dietary Allowance. Shading indicates nutrients to limit. See Chapter 5 for description of nutrient priorities.
* Some values in this table are corrected from the original prepublication version.
a Indicates AI.
b Applies redemption factors presented in Appendix R, Table R-5.
c Value is the median estimated energy requirement (EER) calculated by the committee. Values differ slightly from those in Chapter 4 because EER values for that chapter were re-calculated in a different statistical program to generate percentiles. The means are equivalent for the two analyses.
d The RDA (provided in units of g/d) was used for evaluation of the food package content because the EAR is provided in units of g/kg/d.
SOURCE: USDA National Nutrient Database for Standard Reference, Release 28 (USDA/ARS, 2016).
TABLE T-8a Proportion of Dietary Reference Intakes or DGA Limits Provided by the Current and Revised Food Packages for Fully Breastfeeding Women Assuming Full Redemption: Food Package VII*
| Nutrient | EAR/AI (19–30y/31–50y) | Current | Revised | % Change | ||
|---|---|---|---|---|---|---|
| Amount | % DRI | Amount | % DRI | |||
| Higher Priority | ||||||
| Potassium (mg) | 5,100a | 1,958 | 38 | 1,853 | 36 | −5 |
| Fiber (g) | 29a | 8.0 | 28 | 11.1 | 38 | 38 |
| Sodium (mg) | 1,500a | 1,007 | 67 | 657 | 44 | −35 |
| Saturated fat (g) | 28 | 12.8 | 44 | 7.3 | 26 | −43 |
| Added sugars (g) | 62.3 | 6.6 | 10 | 6.7 | 11 | +1 |
| Middle Priority | ||||||
| Folate (µg DFE) | 450 | 487 | 108 | 485 | 108 | 0 |
| Vitamin D (IU) | 400 | 371 | 93 | 253 | 63 | −32 |
| Calcium (mg) | 800 | 1,232 | 154 | 810 | 101 | −34 |
| Lower Priority | ||||||
| Vitamin A (µg RAE) | 900 | 754 | 84 | 609 | 68 | −19 |
| Magnesium (mg) | 255/265 | 214 | 84/81 | 176 | 69/66 | −18 |
| Zinc (mg) | 10.4 | 7.7 | 74 | 6.1 | 59 | −21 |
| Vitamin C (mg) | 100 | 72 | 72 | 98 | 98 | +36 |
| Vitamin B6 (mg) | 1.7 | 1.4 | 83 | 1.5 | 87 | +5 |
| Copper (mg) | 1 | 0.5 | 48 | 0.5 | 48 | 0 |
| Thiamin (mg) | 1.2 | 0.9 | 78 | 0.9 | 74 | −6 |
| Nutrient | EAR/AI (19–30y/31–50y) | Current | Revised | % Change | ||
|---|---|---|---|---|---|---|
| Amount | % DRI | Amount | % DRI | |||
| Other | ||||||
| Energy (kcal) | 2,492b | 918 | 37 | 764 | 31 | −17 |
| Protein (g) | 71 (RDA)c | 52.3 | 74 | 36.9 | 52 | −29 |
| Iron (mg) | 6.5 | 14.4 | 221 | 14.1 | 217 | −2 |
| Phosphorus (mg) | 580 | 1,178 | 203 | 841 | 145 | −29 |
| Selenium (µg) | 59 | 63.5 | 108 | 47.9 | 81 | −25 |
| Riboflavin (mg) | 1.3 | 2.0 | 153 | 1.6 | 122 | −20 |
| Niacin (mg) | 13 | 12.7 | 98 | 11.1 | 85 | −13 |
| Choline (mg) | 550a | 147 | 27 | 156 | 28 | +6 |
| Vitamin B12 (µg) | 2.4 | 5.6 | 234 | 4.3 | 180 | −23 |
| Vitamin E (mg) | 16 | 4.0 | 25 | 2.9 | 18 | −27 |
NOTES: DFE = dietary folate equivalents; DGA = Dietary Guidelines for Americans; DRI = Dietary Reference Intake; EAR/AI = Estimated Average Requirement/Adequate Intake; RAE = retinol activity equivalents; RDA = Recommended Dietary Allowance. Shading indicates nutrients to limit. See Chapter 5 for description of nutrient priorities.
* Some values in this table are corrected from the original prepublication version.
a Indicates AI.
b Value is the median estimated energy requirement (EER) calculated by the committee. Values differ slightly from those in Chapter 4 because EER values for that chapter were re-calculated in a different statistical program to generate percentiles. The means are equivalent for the two analyses.
c The RDA (provided in units of g/d) was used for evaluation of the food package content because the EAR is provided in units of g/kg/d.
SOURCE: USDA National Nutrient Database for Standard Reference, Release 28 (USDA/ARS, 2016).
TABLE T-8b Proportion of Dietary Reference Intakes or DGA Limits Provided by the Current and Revised Food Packages for Fully Breastfeeding Women as Redeemeda: Food Package VII*
| Nutrient | EAR/AI (19–30y/31–50y) | Current | Revised | % Change | ||
|---|---|---|---|---|---|---|
| Amount | % DRI | Amount | % DRI | |||
| Higher Priority | ||||||
| Potassium (mg) | 5,100b | 1,181 | 23 | 1,291 | 25 | +9 |
| Fiber (g) | 29b | 4.9 | 17 | 7.4 | 26 | +52 |
| Sodium (mg) | 1,500b | 608 | 41 | 425 | 28 | −30 |
| Saturated fat (g) | 28 | 7.8 | 27 | 5.0 | 18 | −36 |
| Added sugars (g) | 62.3 | 3.9 | 6 | 3.8 | 6 | −1 |
| Middle Priority | ||||||
| Folate (µg DFE) | 450 | 293 | 65 | 285 | 63 | −3 |
| Vitamin D (IU) | 400 | 223 | 56 | 171 | 43 | −23 |
| Calcium (mg) | 800 | 717 | 90 | 545 | 68 | −24 |
| Lower Priority | ||||||
| Vitamin A (µg RAE) | 900 | 456 | 51 | 397 | 44 | −13 |
| Magnesium (mg) | 255/265 | 125 | 49/47 | 117 | 46/44 | −7 |
| Zinc (mg) | 10.4 | 4.6 | 44 | 3.9 | 37 | −16 |
| Vitamin C (mg) | 100 | 51 | 51 | 73 | 73 | +43 |
| Vitamin B6 (mg) | 1.7 | 0.9 | 51 | 1.0 | 56 | +9 |
| Copper (mg) | 1 | 0.3 | 29 | 0.3 | 32 | +12 |
| Thiamin (mg) | 1.2 | 0.6 | 46 | 0.5 | 45 | −2 |
| Nutrient | EAR/AI (19–30y/31–50y) | Current | Revised | % Change | ||
|---|---|---|---|---|---|---|
| Amount | % DRI | Amount | % DRI | |||
| Other | ||||||
| Energy (kcal) | 2,492c | 559 | 22 | 515 | 21 | −8 |
| Protein (g) | 71 (RDA)d | 31.7 | 45 | 25.0 | 35 | −21 |
| Iron (mg) | 6.5 | 8.8 | 136 | 8.2 | 126 | −7 |
| Phosphorus (mg) | 580 | 698 | 120 | 566 | 98 | −19 |
| Selenium (µg) | 59 | 41.4 | 70 | 33.0 | 56 | −20 |
| Riboflavin (mg) | 1.3 | 1.2 | 92 | 1.1 | 81 | −12 |
| Niacin (mg) | 13 | 7.7 | 60 | 6.7 | 52 | −13 |
| Choline (mg) | 550b | 114 | 21 | 120 | 22 | +6 |
| Vitamin B12 (µg) | 2.4 | 3.4 | 143 | 2.8 | 115 | −19 |
| Vitamin E (mg) | 16 | 2.4 | 15 | 1.9 | 12 | −19 |
NOTES: DFE = dietary folate equivalents; DGA = Dietary Guidelines for Americans; DRI = Dietary Reference Intake; EAR/AI = Estimated Average Requirement/Adequate Intake; RAE = retinol activity equivalents; RDA = Recommended Dietary Allowance. Shading indicates nutrients to limit. See Chapter 5 for description of nutrient priorities.
* Some values in this table are corrected from the original prepublication version.
a Applies redemption factors presented in Appendix R, Table R-5.
b Indicates AI.
c Value is the median estimated energy requirement (EER) calculated by the committee. Values differ slightly from those in Chapter 4 because EER values for that chapter were re-calculated in a different statistical program to generate percentiles. The means are equivalent for the two analyses.
d The RDA (provided in units of g/d) was used for evaluation of the food package content because the EAR is provided in units of g/kg/d.
SOURCE: USDA National Nutrient Database for Standard Reference, Release 28 (USDA/ARS, 2016).
TABLE T-9a Proportion of Dietary Reference Intakes or DGA Limits Provided by the Current and Revised Food Packages for Infants Ages 6 to Less Than 12 Months Assuming Full Redemption: Food Package II*
| Nutrient | EAR/AI | Current Amount | Revised Amount | % Change | ||||||
|---|---|---|---|---|---|---|---|---|---|---|
| FF 6–11 mo | BF/FF 6–11 mo | BF 6–11 mo | FF 6–11 mo | BF/FF 6–11 mo | BF 6–11 mo | FF 6–11 mo | BF/FF 6–11 mo | BF 6–11 mo | ||
| Priority | ||||||||||
| Iron (mg) | 6.9a | 20.9 | 17.0 | 14.1 | 13.2 | 9.3 | 8.9 | −37 | −45 | −37 |
| Zinc (mg) | 2.5a | 5.9 | 4.1 | 3.3 | 4.8 | 2.9 | 1.8 | −19 | −28 | −46 |
| Other | ||||||||||
| Energy (kcal) | 727b | 621 | 409 | 300 | 559 | 347 | 156 | −10 | −15 | −48 |
| Protein (g) | 11 (RDA)c | 13.5 | 8.8 | 13.4 | 12.1 | 7.4 | 6.0 | −10 | −16 | −55 |
| Fiber (g) | ND | 3.7 | 3.7 | 5.9 | 2.7 | 2.7 | 3.2 | −29 | −29 | −45 |
| Calcium (mg) | 260 | 604 | 404 | 208 | 504 | 304 | 126 | −17 | −25 | −39 |
| Magnesium (mg) | 75 | 69 | 52 | 58 | 57 | 41 | 31 | −17 | −22 | −47 |
| Phosphorus (mg) | 275 | 388 | 266 | 220 | 324 | 202 | 118 | −17 | −24 | −46 |
| Potassium (mg) | 700 | 830 | 599 | 669 | 765 | 534 | 338 | −8 | −11 | −50 |
| Copper (mg) | 0.22 | 0.52 | 0.35 | 0.28 | 0.46 | 0.29 | 0.15 | −11 | −16 | −48 |
| Selenium (µg) | 20 | 18 | 13 | 14 | 14 | 8.7 | 7.1 | −22 | −31 | −49 |
| Vitamin C (mg) | 50 | 71 | 49 | 46 | 71 | 49 | 23 | 0 | 0 | −50 |
| Thiamin (mg) | 0.30 | 0.70 | 0.52 | 0.35 | 0.52 | 0.34 | 0.22 | −26 | −35 | −38 |
| Riboflavin (mg) | 0.40 | 0.92 | 0.63 | 0.47 | 0.77 | 0.48 | 0.26 | −16 | −24 | −45 |
| Niacin (mg) | 4 | 9.7 | 7.4 | 7.5 | 7.0 | 4.7 | 4.2 | −28 | −37 | −44 |
| Nutrient | EAR/AI | Current Amount | Revised Amount | % Change | ||||||
|---|---|---|---|---|---|---|---|---|---|---|
| FF 6–11 mo | BF/FF 6–11 mo | BF 6–11 mo | FF 6–11 mo | BF/FF 6–11 mo | BF 6–11 mo | FF 6–11 mo | BF/FF 6–11 mo | BF 6–11 mo | ||
| Vitamin B6 (mg) | 0.30 | 0.29 | 0.16 | 0.09 | 0.29 | 0.16 | 0.04 | 0 | 0 | −61 |
| Folate (µg DFE) | 80 | 158 | 105 | 62 | 139 | 86 | 35 | −12 | −18 | −43 |
| Choline (mg) | 150 | 100 | 63 | 60 | 95 | 58 | 28 | −5 | −8 | −54 |
| Vitamin B12 (µg) | 0.5 | 2.1 | 1.4 | 1.2 | 1.6 | 1.0 | 0.7 | −22 | −31 | −46 |
| Vitamin A (µg RAE) | 500 | 550 | 358 | 262 | 550 | 358 | 131 | 0 | 0 | −50 |
| Vitamin E (mg) | 5 | 7.0 | 4.4 | 2.2 | 6.5 | 3.9 | 1.2 | −7 | −11 | −45 |
| Vitamin D (IU) | 400 | 313 | 192 | 58 | 282 | 160 | 36 | −10 | −16 | −39 |
| Added sugars (g) | NA | 0.5 | 0.3 | 0.0 | 0.5 | 0.3 | 0.0 | 0 | 0 | 0 |
| Saturated fat (g) | NA | 11 | 5.9 | 1.4 | 11 | 5.8 | 0.6 | −1 | −2 | −57 |
| Sodium (mg) | 370 | 157 | 93 | 64 | 155 | 91 | 29 | −1 | −2 | −55 |
NOTES: BF = breastfeeding; DFE = dietary folate equivalents; DGA = Dietary Guidelines for Americans; DRI = Dietary Reference Intake; EAR/AI = Estimated Average Requirement/Adequate Intake; FF = formula-feeding; RAE = retinol activity equivalents; RDA = Recommended Dietary Allowance. Shading indicates nutrients to limit. See Chapter 5 for description of nutrient priorities.
* Some values in this table are corrected from the original prepublication version.
a Indicates EAR.
b Value is the median estimated energy requirement (EER) calculated by the committee.
c The RDA (provided in units of g/d) was used for evaluation of the food package content because the EAR is provided in units of g/kg/d.
SOURCE: USDA National Nutrient Database for Standard Reference, Release 28 (USDA/ARS, 2016).
TABLE T-9b Proportion of Dietary Reference Intakes or DGA Limits Provided by the Current and Revised Food Packages for Infants Ages 6 to Less Than 12 Months as Redeemeda: Food Package II*
| Nutrient | EAR/AI | Current Amount | Revised Amount | % Change | ||||||
|---|---|---|---|---|---|---|---|---|---|---|
| FF 6–11 mo | BF/FF 6–11 mo | BF 6–11 mo | FF 6–11 mo | BF/FF 6–11 mo | BF 6–11 mo | FF 6–11 mo | BF/FF 6–11 mo | BF 6–11 mo | ||
| Priority | ||||||||||
| Iron (mg) | 6.9b | 13.8 | 10.2 | 6.6 | 10.7 | 7.1 | 5.1 | −22 | −30 | −22 |
| Zinc (mg) | 2.5b | 4.7 | 2.9 | 1.4 | 4.2 | 2.5 | 1.0 | −9 | −15 | −29 |
| Other | ||||||||||
| Energy (kcal) | 727c | 513 | 313 | 134 | 496 | 296 | 90 | −3 | −5 | −33 |
| Protein (g) | 11 (RDA)d | 11 | 6.8 | 4.9 | 11 | 6.4 | 3.0 | −4 | −6 | −39 |
| Fiber (g) | ND | 1.8 | 1.8 | 2.9 | 1.7 | 1.7 | 2.0 | −8 | −8 | −32 |
| Calcium (mg) | 260 | 490 | 302 | 95 | 451 | 263 | 72 | −8 | −13 | −24 |
| Magnesium (mg) | 75 | 50 | 34 | 27 | 47 | 32 | 18 | −6 | −8 | −32 |
| Phosphorus (mg) | 275 | 308 | 194 | 94 | 285 | 171 | 65 | −8 | −12 | −30 |
| Potassium (mg) | 700 | 637 | 420 | 315 | 641 | 424 | 204 | 1 | 1 | −35 |
| Copper (mg) | 0.22 | 0.42 | 0.26 | 0.13 | 0.41 | 0.25 | 0.08 | −3 | −5 | −33 |
| Selenium (µg) | 20 | 13.8 | 8.9 | 5.4 | 12.3 | 7.3 | 3.7 | −11 | −18 | −31 |
| Vitamin C (mg) | 50 | 58 | 36 | 23 | 61 | 39 | 15 | –5 | –8 | −37 |
| Thiamin (mg) | 0.30 | 0.52 | 0.35 | 0.16 | 0.45 | 0.28 | 0.13 | −14 | −20 | −23 |
| Riboflavin (mg) | 0.40 | 0.73 | 0.46 | 0.21 | 0.67 | 0.41 | 0.15 | −7 | −12 | −29 |
| Niacin (mg) | 4 | 6.9 | 4.8 | 3.2 | 5.9 | 3.7 | 2.3 | −15 | −22 | −28 |
| Nutrient | EAR/AI | Current Amount | Revised Amount | % Change | ||||||
|---|---|---|---|---|---|---|---|---|---|---|
| FF 6–11 mo | BF/FF 6–11 mo | BF 6–11 mo | FF 6–11 mo | BF/FF 6–11 mo | BF 6–11 mo | FF 6–11 mo | BF/FF 6–11 mo | BF 6–11 mo | ||
| Vitamin B6 (mg) | 0.30 | 0.27 | 0.15 | 0.03 | 0.27 | 0.15 | 0.02 | 0 | 0 | −46 |
| Folate (µg DFE) | 80 | 129 | 79 | 30 | 123 | 74 | 21 | −5 | −7 | −29 |
| Choline (mg) | 150 | 86 | 51 | 24 | 85 | 50 | 15 | −1 | −1 | −38 |
| Vitamin B12 (µg) | 0.5 | 1.6 | 1.0 | 0.5 | 1.4 | 0.8 | 0.3 | −11 | −18 | −29 |
| Vitamin A (µg RAE) | 500 | 461 | 281 | 134 | 479 | 299 | 85 | –4 | –6 | −37 |
| Vitamin E (mg) | 5 | 5.9 | 3.5 | 1.1 | 5.8 | 3.4 | 0.7 | −2 | −3 | −31 |
| Vitamin D (IU) | 400 | 272 | 158 | 25 | 259 | 145 | 20 | −5 | −8 | −22 |
| Added sugars (g) | NA | 0.4 | 0.2 | 0.0 | 0.4 | 0.2 | 0.0 | 0 | 0 | 0 |
| Saturated fat (g) | NA | 10.0 | 5.5 | 0.5 | 9.9 | 5.4 | 0.3 | 0 | −1 | −41 |
| Sodium (mg) | 370 | 140 | 80 | 26 | 141 | 89 | 16 | –1 | –1 | −40 |
NOTES: AI = adequate intake; BF = breastfeeding; DFE = dietary folate equivalents; DGA = Dietary Guidelines for Americans; DRI = Dietary Reference Intake; EAR/AI = Estimated Average Requirement/Adequate Intake; FF = formula-feeding; RAE = retinol activity equivalents; RDA = Recommended Dietary Allowance. Shading indicates nutrients to limit. See Chapter 5 for description of nutrient priorities.
* Some values in this table are corrected from the original prepublication version.
a Applies redemption factors presented in Appendix R, Table R-5.
b Indicates EAR.
c Value is the median estimated energy requirement (EER) calculated by the committee.
d The RDA (provided in units of g/d) was used for evaluation of the food package content because the EAR is provided in units of g/kg/d.
SOURCE: USDA National Nutrient Database for Standard Reference, Release 28 (USDA/ARS, 2016).
| Nutrient | EAR/AI | Current | Revised | % Change | ||
|---|---|---|---|---|---|---|
| Amount | % DRI | Amount | % DRI | |||
| Priority | ||||||
| Fiber (g) | 19a | 7.1 | 38 | 6.3 | 33 | −11 |
| Potassium (mg) | 3,000a | 1,267 | 42 | 1,007 | 34 | −20 |
| Added sugars (g) | NA | 8.4 | NA | 7.1 | NA | −16 |
| Saturated fat (g) | NA | 11.9 | NA | 9.1 | NA | −23 |
| Sodium (mg) | 1,000a | 587 | 59 | 472 | 47 | −20 |
| Other | ||||||
| Energy (kcal) | 917b | 725 | 79 | 577 | 63 | −20 |
| Protein (g) | 13 (RDA)c | 29 | 224 | 23 | 177 | −21 |
| Calcium (mg) | 500 | 717 | 143 | 542 | 108 | −24 |
| Iron (mg) | 3 | 13 | 445 | 13 | 420 | −6 |
| Magnesium (mg) | 65 | 138 | 212 | 106 | 163 | −23 |
| Phosphorus (mg) | 380 | 690 | 182 | 534 | 140 | −23 |
| Zinc (mg) | 2.5 | 5.5 | 221 | 4.7 | 188 | −15 |
| Copper (mg) | 0.26 | 0.4 | 161 | 0.3 | 129 | −20 |
| Selenium (µg) | 17 | 35 | 207 | 30 | 177 | −15 |
| Vitamin C (mg) | 13 | 56 | 429 | 47 | 360 | −16 |
| Thiamin (mg) | 0.4 | 0.8 | 211 | 0.7 | 181 | −15 |
| Riboflavin (mg) | 0.4 | 1.4 | 345 | 1.1 | 284 | −18 |
| Niacin (mg) | 5 | 8.9 | 179 | 8.3 | 166 | −7 |
| Vitamin B6 (mg) | 0.4 | 1.1 | 268 | 1.0 | 252 | −6 |
| Folate (µg DFE) | 120 | 430 | 358 | 412 | 343 | −4 |
| Choline (mg) | 200a | 71.4 | 36 | 127 | 64 | 78 |
| Vitamin B12 (µg) | 0.7 | 3.8 | 546 | 3.3 | 474 | −13 |
| Vitamin A (µg RAE) | 210 | 417 | 199 | 380 | 181 | −9 |
| Vitamin E (mg) | 5 | 1.1 | 22 | 2.7 | 55 | +148 |
| Vitamin D (IU) | 400 | 254 | 63 | 192 | 48 | −25 |
NOTES: DFE = dietary folate equivalents; DGA = Dietary Guidelines for Americans; DRI = Dietary Reference Intake; EAR/AI = Estimated Average Requirement/Adequate Intake; RAE = retinol activity equivalents; RDA = Recommended Dietary Allowance. Shading indicates nutrients to limit. See Chapter 5 for description of nutrient priorities.
* Some values in this table are corrected from the original prepublication version.
a Indicates AI.
b Value is the median estimated energy requirement (EER) calculated by the committee.
c The RDA (provided in units of g/d) was used for evaluation of the food package content because the EAR is provided in units of g/kg/d.
SOURCE: USDA National Nutrient Database for Standard Reference, Release 28 (USDA/ARS, 2016).
| Nutrient | EAR/AI | Current | Revised | % Change | ||
|---|---|---|---|---|---|---|
| Amount | % DRI | Amount | % DRI | |||
| Priority | ||||||
| Fiber (g) | 19b | 4.3 | 23 | 4.0 | 21 | −8 |
| Potassium (mg) | 3,000b | 888 | 30 | 770 | 26 | −13 |
| Added sugars (g) | NA | 5.4 | NA | 4.5 | NA | −18 |
| Saturated fat (g) | NA | 8.6 | NA | 7.6 | NA | −12 |
| Sodium (mg) | 1,000b | 385 | 38 | 333 | 33 | −14 |
| Other | ||||||
| Energy (kcal) | 917c | 491 | 54 | 421 | 46 | −14 |
| Protein (g) | 13 (RDA)d | 20 | 154 | 18 | 135 | −12 |
| Calcium (mg) | 500 | 516 | 103 | 441 | 88 | −14 |
| Iron (mg) | 3 | 8.1 | 270 | 7.1 | 237 | −12 |
| Magnesium (mg) | 65 | 88.9 | 137 | 74 | 114 | −17 |
| Phosphorus (mg) | 380 | 479 | 126 | 409 | 108 | −15 |
| Zinc (mg) | 2.5 | 3.6 | 145 | 3.2 | 128 | −12 |
| Copper (mg) | 0.26 | 0.3 | 104 | 0.2 | 90 | −14 |
| Selenium (µg) | 17 | 25 | 144 | 23 | 133 | −8 |
| Vitamin C (mg) | 13 | 40 | 306 | 35 | 267 | −13 |
| Thiamin (mg) | 0.4 | 0.5 | 134 | 0.5 | 113 | −15 |
| Riboflavin (mg) | 0.4 | 1.0 | 241 | 0.8 | 208 | −14 |
| Niacin (mg) | 5 | 5.3 | 107 | 4.8 | 96 | −10 |
| Vitamin B6 (mg) | 0.4 | 0.7 | 172 | 0.6 | 158 | −8 |
| Folate (µg DFE) | 120 | 264 | 220 | 237 | 197 | −10 |
| Choline (mg) | 200b | 55 | 27 | 101 | 50 | 84 |
| Vitamin B12 (µg) | 0.7 | 2.6 | 376 | 2.3 | 333 | −12 |
| Vitamin A (µg RAE) | 210 | 281 | 134 | 256 | 122 | −9 |
| Vitamin E (mg) | 5 | 0.7 | 14 | 1.7 | 34 | +143 |
| Vitamin D (IU) | 400 | 186 | 46 | 153 | 38 | −18 |
NOTES: DFE = dietary folate equivalents; DGA = Dietary Guidelines for Americans; DRI = Dietary Reference Intake; EAR/AI = Estimated Average Requirement/Adequate Intake; RAE = retinol activity equivalents; RDA = Recommended Dietary Allowance. Shading indicates nutrients to limit. See Chapter 5 for description of nutrient priorities.
* Some values in this table are corrected from the original prepublication version.
a Applies redemption factors presented in Appendix R, Table R-5.
b Indicates AI (used when EAR could not be determined).
c Value is the median estimated energy requirement (EER) calculated by the committee.
d The RDA (provided in units of g/d) was used for evaluation of the food package content because the EAR is provided in units of g/kg/d.
SOURCE: USDA National Nutrient Database for Standard Reference, Release 28 (USDA/ARS, 2016).
TABLE T-11a Proportion of Dietary Reference Intakes or DGA Limits Provided by the Current and Revised Food Packages for Children Ages 2 to Less Than 5 Years Assuming Full Redemption: Food Package IV-B*
| Nutrient | EAR/AI children 1–3 y | EAR/AI children 4–8 y | Current | Revised | % Change | ||||
|---|---|---|---|---|---|---|---|---|---|
| Amount | % DRI children 1–3 y | % DRI children 4–5 y | Amount | % DRI children 1–3 y | % DRI children 4–5 y | ||||
| Priority | |||||||||
| Fiber (g) | 19a | 25a | 7.1 | 38 | 29 | 6.3 | 33 | 25 | −11 |
| Potassium (mg) | 3,000a | 3,800a | 1,357 | 45 | 36 | 1,262 | 42 | 33 | −7 |
| Added sugars (g) | 32.5 | 32.5 | 6.9 | 21 | 21 | 7.5 | 23 | 23 | +9 |
| Saturated fat (g) | 14 | 14 | 6.6 | 47 | 47 | 5.2 | 37 | 37 | −20 |
| Sodium (mg) | 1,000a | 1,200a | 639 | 64 | 53 | 534 | 53 | 44 | −16 |
| Other | |||||||||
| Energy (kcal) | 917b | 1,517b | 648 | 71 | 43 | 557 | 61 | 37 | −14 |
| Protein (g) | 13 (RDA)c | 19 (RDA)c | 31 | 236 | 162 | 27.1 | 208 | 143 | −12 |
| Calcium (mg) | 500 | 800 | 787 | 157 | 98 | 705 | 141 | 88 | −10 |
| Iron (mg) | 3 | 4.1 | 14 | 449 | 328 | 13 | 424 | 310 | −5 |
| Magnesium (mg) | 65 | 110 | 154 | 237 | 140 | 132 | 203 | 120 | −14 |
| Phosphorus (mg) | 380 | 405 | 762 | 201 | 188 | 678 | 178 | 167 | −11 |
| Zinc (mg) | 2.5 | 4 | 5.7 | 227 | 142 | 5.2 | 206 | 129 | −9 |
| Copper (mg) | 0.26 | 0.34 | 0.3 | 134 | 102 | 0.3 | 114 | 87 | −15 |
| Selenium (µg) | 17 | 23 | 32 | 187 | 138 | 29 | 169 | 125 | −9 |
| Nutrient | EAR/AI children 1–3 y | EAR/AI children 4–8 y | Current | Revised | % Change | ||||
|---|---|---|---|---|---|---|---|---|---|
| Amount | % DRI children 1–3 y | % DRI children 4–5 y | Amount | % DRI children 1–3 y | % DRI children 4–5 y | ||||
| Vitamin C (mg) | 13 | 22 | 60 | 458 | 271 | 51 | 388 | 229 | −15 |
| Thiamin (mg) | 0.4 | 0.5 | 0.8 | 206 | 165 | 0.8 | 188 | 151 | −9 |
| Riboflavin (mg) | 0.4 | 0.5 | 1.4 | 353 | 282 | 1.3 | 336 | 268 | −5 |
| Niacin (mg) | 5 | 6 | 9.0 | 179 | 150 | 8.4 | 169 | 140 | −6 |
| Vitamin B6 (mg) | 0.4 | 0.5 | 1.1 | 277 | 222 | 1.1 | 270 | 216 | −2 |
| Folate (µg DFE) | 120 | 160 | 431 | 359 | 269 | 418 | 349 | 261 | −3 |
| Choline (mg) | 200a | 250a | 77 | 38 | 31 | 77 | 38 | 31 | 0 |
| Vitamin B12 (µg) | 0.7 | 1 | 3.6 | 514 | 360 | 3.6 | 514 | 360 | 0 |
| Vitamin A (µg RAE) | 210 | 275 | 532 | 253 | 194 | 501 | 238 | 182 | −6 |
| Vitamin E (mg) | 5 | 6 | 3.0 | 60 | 50 | 2.5 | 51 | 42 | −16 |
| Vitamin D (IU) | 400 | 400 | 213 | 53 | 53 | 202 | 51 | 51 | −5 |
NOTES: DFE = dietary folate equivalents; DGA = Dietary Guidelines for Americans; DRI = Dietary Reference Intake; EAR/AI = Estimated Average Requirement/Adequate Intake; RAE = retinol activity equivalents; RDA = Recommended Dietary Allowance. Shading indicates nutrients to limit. See Chapter 5 for description of nutrient priorities.
* Some values in this table are corrected from the original prepublication version.
a Indicates AI.
b Value is the median estimated energy requirement (EER) calculated by the committee.
c The RDA (provided in units of g/d) was used for evaluation of the food package content because the EAR is provided in units of g/kg/d.
SOURCE: USDA National Nutrient Database for Standard Reference, Release 28 (USDA/ARS, 2016).
TABLE T-11b Proportion of Dietary Reference Intakes or DGA Limits Provided by the Current and Revised Food Packages for Children Ages 2 to Less Than 5 Years as Redeemeda: Food Package IV-B*
| Nutrient | EAR/AI children 1–3 y | EAR/AI children 4–8 y | Current | Revised | % Change | ||||
|---|---|---|---|---|---|---|---|---|---|
| Amount | % DRI children 1–3 y | % DRI children 4–5 y | Amount | % DRI children 1–3 y | % DRI children 4–5 y | ||||
| Priority | |||||||||
| Fiber (g) | 19b | 25b | 4.3 | 23 | 17 | 4.0 | 21 | 16 | −8 |
| Potassium (mg) | 3,000b | 3,800b | 927 | 31 | 24 | 940 | 31 | 25 | +1 |
| Added sugars (g) | 32.5 | 32.5 | 4.3 | 13 | 13 | 4.6 | 14 | 14 | +9 |
| Saturated fat (g) | 14 | 14 | 4.5 | 32 | 32 | 3.9 | 27 | 27 | −13 |
| Sodium (mg) | 1,000b | 1,200b | 412 | 41 | 34 | 367 | 37 | 31 | −11 |
| Other | |||||||||
| Energy (kcal) | 917c | 1,517c | 423 | 46 | 28 | 388 | 42 | 26 | −8 |
| Protein (g) | 13 (RDA)d | 19 (RDA)d | 21 | 158 | 108 | 20 | 153 | 104 | −3 |
| Calcium (mg) | 500 | 800 | 543 | 109 | 68 | 539 | 108 | 67 | −1 |
| Iron (mg) | 3 | 4.1 | 8.2 | 272 | 199 | 7.2 | 240 | 176 | −12 |
| Magnesium (mg) | 65 | 110 | 99 | 152 | 90 | 92 | 142 | 84 | −7 |
| Phosphorus (mg) | 380 | 405 | 513 | 135 | 127 | 501 | 132 | 124 | −2 |
| Zinc (mg) | 2.5 | 4 | 3.7 | 146 | 92 | 3.4 | 137 | 86 | −6 |
| Copper (mg) | 0.26 | 0.34 | 0.21 | 83 | 63 | 0.2 | 75 | 57 | −10 |
| Selenium (µg) | 17 | 23 | 21 | 124 | 92 | 21 | 122 | 90 | −2 |
| Nutrient | EAR/AI children 1–3 y | EAR/AI children 4–8 y | Current | Revised | % Change | ||||
|---|---|---|---|---|---|---|---|---|---|
| Amount | % DRI children 1–3 y | % DRI children 4–5 y | Amount | % DRI children 1–3 y | % DRI children 4–5 y | ||||
| Vitamin C (mg) | 13 | 22 | 43 | 327 | 193 | 38 | 289 | 171 | −12 |
| Thiamin (mg) | 0.4 | 0.5 | 0.5 | 128 | 102 | 0.5 | 117 | 94 | −9 |
| Riboflavin (mg) | 0.4 | 0.5 | 1.0 | 239 | 191 | 1.0 | 238 | 191 | 0 |
| Niacin (mg) | 5 | 6 | 5.3 | 107 | 89 | 4.9 | 97 | 81 | −9 |
| Vitamin B6 (mg) | 0.4 | 0.5 | 0.7 | 177 | 142 | 0.7 | 171 | 137 | −4 |
| Folate (µg DFE) | 120 | 160 | 263 | 219 | 164 | 241 | 200 | 150 | −9 |
| Choline (mg) | 200b | 250b | 58 | 29 | 23 | 59 | 29 | 23 | +1 |
| Vitamin B12 (µg) | 0.7 | 1 | 2.4 | 342 | 240 | 2.4 | 349 | 244 | +2 |
| Vitamin A (µg RAE) | 210 | 275 | 357 | 170 | 130 | 344 | 164 | 125 | −4 |
| Vitamin E (mg) | 5 | 6 | 1.8 | 36 | 30 | 1.5 | 31 | 25 | −14 |
| Vitamin D (IU) | 400 | 400 | 148 | 37 | 37 | 151 | 38 | 38 | +2 |
NOTES: DFE = dietary folate equivalents; DGA = Dietary Guidelines for Americans; DRI = Dietary Reference Intake; EAR/AI = Estimated Average Requirement/Adequate Intake; RAE = retinol activity equivalents; RDA = Recommended Dietary Allowance. Shading indicates nutrients to limit. See Chapter 5 for description of nutrient priorities.
* Some values in this table are corrected from the original prepublication version.
a Applies redemption factors presented in Appendix R, Table R-5.
b Indicates AI.
c Value is the median estimated energy requirement (EER) calculated by the committee.
d The RDA (provided in units of g/d) was used for evaluation of the food package content because the EAR is provided in units of g/kg/d.
SOURCE: USDA National Nutrient Database for Standard Reference, Release 28 (USDA/ARS, 2016).
| Food Package | Recommended Intake | Current Intake (Mean) | Amount in Food Package | ||||
|---|---|---|---|---|---|---|---|
| Current | Revised, 33% Veg | Difference from Current | Revised, 100% Veg | Difference from Current | |||
| IV | 1.5 | 0.65 | 0.19 | 0.22 | +0.04 | 0.59 | +0.40 |
| V-B | 3.5 | 0.94 | 0.30 | 0.46 | +0.17 | 1.23 | +0.93 |
| VII | 3.5 | 0.94 | 0.30 | 0.61 | +0.32 | 1.68 | +1.38 |
NOTES: Food group amounts based on the food package food group profiles, as presented in Chapter 3, Tables 3-1, 3-3, and 3-4.
| Food Package | AI | Current Intake (Mean) | Amount in Food Package | ||||
|---|---|---|---|---|---|---|---|
| Current | Revised, 33% Veg | Difference from Current in FP | Revised, 100% Veg | Difference from Current | |||
| IV | 19 | 8.5,12* | 4.31 | 3.98 | −0.33 | 4.42 | +0.11 |
| V-B | 29 | 16 | 4.89 | 6.05 | +1.16 | 6.96 | +2.07 |
| VII | 29 | 16 | 4.89 | 7.42 | +2.53 | 8.70 | +3.81 |
NOTES: Nutrient data based on the food package nutrient profiles developed using the method described in Appendix R.
* Values represent mean intake for children ages 1 to less than 2 years, ages 2 to less than 5 years.
REFERENCES
IOM (Institute of Medicine). 2006. WIC food packages: Time for a change. Washington, DC: The National Academies Press.
IOM. 2011. Child and Adult Care Food Program: Aligning dietary guidance for all. Washington, DC: The National Academies Press.
USDA/ARS (U.S. Department of Agriculture/Agricultural Research Service). 2005–2012. What we eat in America, NHANES 2005–2012. Beltsville, MD: USDA/ARS. http://www.ars.usda.gov/services/docs.htm?docid=13793 (accessed December 15, 2016).
USDA/ARS. 2014. Food patterns equivalents database 2011–12: Methodology and user guide. Beltsville, MD: USDA/ARS. http://www.ars.usda.gov/SP2UserFiles/Place/80400530/pdf/fped/FPED_1112.pdf (accessed August 31, 2016).
USDA/ARS. 2016. USDA National Nutrient Database for Standard Reference. Release 28. Beltsville, MD: USDA/ARS. https://www.ars.usda.gov/northeast-area/beltsville-md/beltsville-human-nutrition-research-center/nutrient-data-laboratory/docs/usda-nationalnutrient-database-for-standard-reference/ (accessed November 11, 2016).
USDA/FNS (U.S. Department of Agriculture/Food and Nutrition Service). 2014. Special Supplemental Nutrition Program for Women, Infants and Children (WIC): Revisions in the WIC food packages; final rule, 7 C.F.R. § 246.
USDA/FNS. 2016. WIC participant and program characteristics 2014: Food package report. Alexandria, VA: USDA/FNS. http://www.fns.usda.gov/wic-participant-and-program-characteristics-2014-food-package-report (accessed August 30, 2016).
USDA/HHS (U.S. Department of Agriculture/U.S. Department of Health and Human Development). 2016. 2015–2020 Dietary Guidelines for Americans. Washington, DC: U.S. Government Printing Office. https://health.gov/dietaryguidelines/2015 (accessed August 29, 2016).


