
Appendix U
The Regulatory Impact Analysis (Complete)
This appendix presents a regulatory impact analysis (RIA) for the proposed revisions to the Special Supplemental Nutrition Program for Women, Infants, and Children (WIC) food packages. This RIA was guided by the overall structure and analytic approach presented in the 2007 Revisions to the WIC Food Package Interim Rule and associated appendix (USDA/FNS, 2007a,b), along with those prepared for the Proposed Rule and Final Rule (USDA/FNS, 2006, 2014a). Unlike WIC RIAs found in the Federal Register, this analysis is not part of the federal rulemaking process nor has it been reviewed by the U.S. Department of Agriculture (USDA), the Office of Budget and Program Analysis, the Office of Management and Budget, or any other federal entity. Accordingly, all estimates should be considered provisional.
An overview of the types of estimates in this RIA is presented in Box U-1. Throughout this appendix, the committee compares the projected costs of the proposed revised food packages (assuming all recommendations are fully implemented) to the projected costs of the current set of food packages (assuming the current regulations remain intact). Estimated costs are based on the forecasted program participation levels, calculated redemption of each food package item, and inflated prices of each food package item. Unless otherwise noted, cost differences describe how much more the revised food packages would save or cost program-wide, as compared to the current food package.
KEY CONSIDERATIONS
Assumptions underlie this analysis. Some—such as how program participation and prices are projected to change through fiscal year (FY) 2022—pertain to one specific component of the analysis and are described in detail later in this appendix (see “Cost Estimate Methodology” section). Other assumptions affect the interpretation of the estimated costs and cost differences. Three such broad considerations are the representativeness of the available data, timing of implementation, and food package nomenclature.
Representativeness of the Available Data
A number of factors affect the total food costs to the WIC program, including interstate variation in food prices, caseload composition, and cost-containment practices (USDA/ERS, 2005). Accurate estimates of total food costs, therefore, need to be based on data that capture this variability. To project the cost effects associated with specific changes to the food packages, data need to provide insight into how each individual food item within each specific food package contributes to the total food costs. At the present, this level of granularity does not exist in data sources representative of the entire WIC program.
The data and assumptions used throughout this analysis are primarily based on WIC agency and administrative data sources. These include the participation data from the WIC Participant and Program Characteristics 2014: Food Package Report (USDA/FNS, 2016a), national participation levels presented on the USDA’s Food and Nutrition Services (USDA-FNS) website (USDA/FNS, 2016b), redemption data from six de-identified state agencies provided to the committee by USDA-FNS, redemption data provided to the committee from six individual state agencies, and a 2014 report detailing redemption in three states as they transitioned to the electronic benefit transfer (EBT) food benefit issuance method (USDA/ERS, 2014).
The committee estimated total food costs and cost differences by integrating the available WIC data sources, some of which were from a relatively small number of state agencies. This analysis assumes the data are representative of the WIC population at large. The committee, however, recognizes that the cost estimates calculated are not identical to costs derived from FNS administrative data. For FY2015, the committee estimated the per-participant food cost to be $37.091 per month, based on assumptions about prices per unit, substitutions of allowable options, and redemption of each food package item. USDA-FNS, however, reported the FY2015 per-participant food costs to be $43.37 per month. The committee was unable to discern what component(s) of its analysis led to this difference, because some of the data available to the committee were de-identified and the majority of the data represented only a small portion of states and territories. The estimates presented in this RIA should be interpreted in context of these limitations.
__________________
1 A per participant cost of $37.27 per month was presented previously in this report. This higher estimate reflects the $1 increase in women’s cash value voucher, which was implemented in FY2016 (from $10 to $11). The committee used this monthly per participant cost to assess the cost neutrality of the revised food packages, because it reflects current regulations. The $37.09 estimate, in contrast, reflects the regulations existed in FY2015.
Timing of Implementation
The magnitude of the cost effects and stability of the projections in this analysis are largely defined by the timeframe evaluated. The exact timing of when the revised food packages will be implemented, however, depends on a number of factors, including when the federal regulations are put forth and how quickly state agencies can operationalize the changes. For the purposes of this analysis, the committee assumes that the earliest implementation of the revised food packages could occur would be April 1, 2018, approximately 15 months after the release of this consensus report. Food cost estimates for both the current and revised food packages are projected through FY2022. This RIA, therefore, encompasses a 54-month period.2
The committee assumes within each state agency all proposed food package changes will be fully implemented at one time, but that across the WIC program, state agencies may begin offering the revised food packages at different times. As such, two sets of cost projections were generated: unadjusted and phased in. Unadjusted estimates assume that all agencies fully implement the revised food packages on April 1, 2018. Phased-in estimates, in contrast, account for states implementing the revised food packages at different times. The phased-in scenario assumes that states with EBT systems operational as of the August 2016 EBT Detail Status Report (USDA/FNS, 2016c) would be early implementers of the proposed food package changes (i.e., those implementing the changes on April 1, 2018).3 The remaining state agencies would have up to 18 additional months to implement the proposed food package changes (i.e., implemented by October 1, 2019). As evidenced by the final implementation dates from the previous food package revision (USDA/FNS, 2012), most state agencies instituted changes on the regulatory deadline, rather than before or after. This analysis assumes the same will occur for these proposed revisions. Accordingly, the phased-in cost differences between the current food packages and proposed revised food packages are 33.3 percent of the unadjusted cost differences for FY2018 (6 months) and FY2019 (12 months), and 100 percent of the unadjusted differences thereafter. The dates and rates of implementation used in this RIA are not intended to be prescriptive or to be the committee’s recommended timeline for implementation, but rather are the committee’s informed assumptions necessary for this analysis.
__________________
2 The fiscal year starts October 1. April 1, 2018, is halfway through FY2018.
3 This estimate was calculated by identifying agencies that have implemented EBT statewide as of August 2016 (USDA/FNS, 2016c) and determining what proportion of participants are served by those agencies from total participation administrative data (USDA/FNS, 2016b). For FY2015, EBT states serve 34.3 percent of WIC participants. Given this, the assumption for the phased-in estimate is that one-third of participants would be served by an “early implementer” state agency. This assumption only affects the phased-in estimates, not the unadjusted estimates.
Food Package Nomenclature
The WIC food packages are specific to the age, life stage, physiological state, and, if applicable, breastfeeding status of the participant. Several of the broad food package categories (both current and revised) are actually composed of two or more specific food package types. Both the quantity of foods and the food items prescribed in each specific food package can differ within a broad food package category. Infants ages 6 to less than 12 months receiving food package II, for example, may be prescribed food package II-BF, fully breastfed; II-BF/FF partially (mostly) breastfed; or II-FF, fully formula fed. Currently, food package II-BF recipients are prescribed infant food meat (77.5 ounces), infant cereal (24 ounces), and jarred infant food vegetables and fruits (256 ounces). In contrast, food package II-BF/FF recipients are currently prescribed infant formula, infant cereal (24 ounces), and jarred infant food vegetables and fruits (128 ounces). Food package II-FF recipients are prescribed the same quantity of complementary foods as II-BF/FF recipients, but they are prescribed more infant formula. These types of differences exist across all specific food packages and must be accounted for when estimating food package costs.
As Table U-1 highlights, the proposed revisions largely leave the current structure of the food packages unchanged. There are, however, three important considerations:
- Food package V is currently a single food package prescribed to both pregnant women and partially (mostly) breastfeeding women, up to 1 year postpartum. Under the proposed revisions, it would be split into two distinct food packages, V-A for pregnant women and V-B for partially (mostly) breastfeeding women.
- Revised food package I-BF/FF-A for a partially (mostly) breastfed infant, age 0 to less than 1 month, may not ultimately be operationalized as separate from food package I-BF/FF-B for a partially (mostly) breastfed infant, age 1 to less than 4 months. Under the proposed revisions, infants issued food package I-BF/FF-A could potentially be prescribed the same amount of formula as food package I-BF/FF-B, on a case-by-case basis. In implementing the proposed revisions, it may be decided to consolidate the two food packages and align the naming structure across the infant food packages (i.e., I-BF/FF-A for infants ages 0 to less than 4 months, I-BF/FF-B for infants ages 4 to less than 6 months). The committee chose to keep the revised food package I-BF/FF-A separate in this analysis because the proposed revision maintains the provision that issuing infant formula to breastfed infants in the first month of life should not be standard. The committee expects that infants
TABLE U-1 Current and Revised Food Packages and Corresponding Participant Categories
| Food Package | Abbreviation of Specific Food Package | Applicable Version of the Food Packages | Participant Category |
|---|---|---|---|
| I | I-BF-A | Current, revised | Fully breastfed infants, ages 0 to less than 4 months |
| I-BF-B | Current, revised | Fully breastfed infants, ages 4 to less than 6 months | |
| I-BF/FF-A | Current, reviseda | Partially (mostly) breastfed infants,b ages 0 to less than 1 month | |
| I-BF/FF-B | Current, revised | Partially (mostly) breastfed infants,b ages 1 to less than 4 months | |
| I-BF/FF-C | Current, revised | Partially (mostly) breastfed infants,b ages 4 to less than 6 months | |
| I-FF-A | Current, revised | Fully formula-fed infants, ages 0 to less than 4 months | |
| I-FF-B | Current, revised | Fully formula-fed infants, ages 4 to less than 6 months | |
| II | II-BF | Current, revised | Fully breastfed infants, ages 6 to less than 12 months |
| II-BF/FF | Current, revised | Partially breastfed infants, ages 6 to less than 12 months | |
| II-FF | Current, revised | Fully formula-fed infants, ages 6 to less than 12 months | |
| III | IIIc | Current, revised | Infants, children, and women with a qualifying conditiond |
| IV | IV-A | Current, revised | Children, ages 1 to less than 2 years |
| IV-B | Current, revised | Children, ages 2 to less than 5 years | |
| V | V | Current | Pregnant women |
| Partially (mostly) breastfeeding women,b up to 1-year postpartum | |||
| V-A | V-A | Revised | Pregnant women |
| V-B | V-B | Revised | Partially (mostly) breastfeeding women,b up to 1-year postpartum |
| VI | VI | Current, revised | Nonbreastfeeding postpartum women, up to 6-months postpartum |
| Partially (minimally) breastfeeding women,e up to 6-months postpartum | |||
| VII | VII | Current, revised | Fully breastfeeding women, up to 1-year postpartum |
| N/A | N/A | Current, revised | Partially (minimally) breastfeeding women, more than 6-months postpartume |
a Despite revised food packages I-BF/FF-A and I-BF/FF-B having the same maximum (“up to”) amount for infant formula, the two food packages remain separate in this analysis. The committee supports issuance of infant formula to food package I-FF/BF-A recipients only on a case-by-case basis after a breastfeeding assessment. Accordingly, the committee assumes the average quantity of infant formula prescribed in food package I-BF/FF-A to be less than the average amount prescribed to I-BF/FF-B recipients. Food package I-BF/FF-A may not ultimately be operationalized as separate from food package I-BF/FF-B for partially (mostly) breastfed infants, ages 1 to less than 4 months.
b The parenthetical “mostly” is determined by the amount of formula provided to the infant through the WIC program. Women and their infants are classified as partially (mostly) breastfeeding if the infant’s formula prescription does not exceed the monthly maximum allowance for the age-specific BF/FF food packages.
c Food package III recipients are prescribed food packages appropriate to their age and physiological state. There are specific food packages for women, infants, and children within food package III that correspond to specific food packages I, II, IV, V, VI, and VII.
d Participants prescribed food package III have one or more medically documented qualifying conditions that require use of a WIC formula. Recipients are eligible to receive WIC formula (i.e., infant formula, exempt infant formula, and WIC-eligible nutritionals) and supplementary foods.
e The parenthetical “minimally” is determined by the amount of formula provided to the infant through the WIC program. Women and infants are classified as partially (minimally) breastfeeding if the infant’s formula prescription exceeds the monthly maximum allowance for the age-specific BF/FF food packages but does not exceed the full amount allowed in the age-specific fully formula-fed food packages. Women who are minimally breastfeeding less than 6 months postpartum receive food package VI, along with breastfeeding support. Women who are minimally breastfeeding and with infants more than 6 months of age that receive more formula than is allowed for a partially breastfed infant do not receive a food benefit. These women, however, are eligible to continue to receive other benefits through WIC, such as breastfeeding support, nutrition education, and health and social services referrals (USDA/FNS, 2013). This group of participants is included in one of the committee’s assumption regarding the revised food package cost estimates, and is therefore included in the above table.
- Food package “N/A” is listed as a food package because it is included in an assumption about how participation is expected to change with the revised food packages. Women who are minimally breastfeeding more than 6-months postpartum do not receive a food benefit (referred to herein as “food package N/A”), but are still eligible to continue to receive breastfeeding support, nutrition education, health and social services referrals, and other program benefits (USDA/FNS, 2013a). These program participants do not contribute to the total food costs of the program. The committee assumes that preventing premature classification of mother–infant dyads as fully formula fed is likely to shift dyads toward the partially (mostly) breastfeeding food packages. This projected participant shift includes women more than 6-months postpartum.
issued the revised food package I-BF/FF-A would continue to be prescribed only small quantities of infant formula, markedly less than what is prescribed to food package I-BF/FF-B recipients.
ACTION
Nature
This RIA was conducted by the Committee to Review WIC Food Packages as part of a National Academies of Sciences, Engineering, and Medicine (the National Academies) consensus study.
Need
The WIC program serves low-income, nutritionally at-risk pregnant women, breastfeeding and nonbreastfeeding postpartum women, and children younger than 5 years of age. The program provides participants with nutritious supplemental foods, breastfeeding support, nutrition education, and referrals to health and social services. Supplemental foods are intended to be appropriate for the participants’ life stage and are designed to provide specific nutrients that current nutrition research indicates are lacking in the diets of WIC’s target population groups (7 C.F.R. § 246). Given the nature and funding of the program, the supplemental foods must provide these specific nutrients to participants in a manner that is both effective and economical. To ensure this, regulatory language explicitly defines the specifications and amount of each authorized food item.
In 2006, an Institute of Medicine (IOM) committee offered its first set of recommended changes to the quantity and types of foods included in the WIC food packages (IOM, 2006). The recommended revisions aligned the food benefit with the 2005 Dietary Guidelines for Americans (DGA) and
the American Academy of Pediatrics’ (AAP’s) infant feeding guidelines, and led to the first major revisions to the WIC food packages since the inception of the program. A decade has passed since the IOM’s first set of recommendations and with it has come advances in nutrition research and insight into the effects of WIC generally and the food package changes specifically. Congress asked the USDA, which administers the WIC program, to review and update the food packages to be consistent with the current (2015–2020) DGA.4 To accomplish this, USDA-FNS asked the National Academies to recommend revisions to the food packages to align with current research and dietary guidance, be culturally suitable to the increasingly diverse WIC population, be relatively cost-neutral compared to current food packages, be efficient for nationwide distribution, and be nonburdensome to state and local agencies that administer the program.
Affected Parties
The proposed changes to the food packages affect a broad range of individuals and entities associated with the WIC program, including, but not limited to, USDA-FNS; the 90 agencies that administer WIC and their associated staff; authorized vendors; food producers, manufacturers, and distributors; and program participants.
EFFECT
The proposed changes to the food packages are consistent with the DGA, current recommendations of the AAP, and other recently-available scientific evidence. Revisions also consider the Dietary Reference Intakes (DRIs). The proposed changes take into account the nutrient and food group intake, health status, and cultural needs of the program participant population, while simultaneously considering the efficiency and efficacy of program operations and administration. The analyses and sections that follow describe the potential economic impact of the proposed revisions.
Background
Piloted by the USDA-FNS in 1972, WIC was established as a permanent program in 1975 (P.L. 94-105, 1975). While its mission has remained the same—to “safeguard the health of low-income women, infants, and children up to age 5 who are at nutritional risk”—WIC’s goals have evolved over time. Goals currently include promoting and supporting successful long-term breastfeeding; providing WIC participants with a wider variety
__________________
4 References to the DGA in this appendix are specific to 2015-2020 unless otherwise noted.
of foods, including vegetables, fruits, and whole grains; and providing WIC state agencies greater flexibility in prescribing food packages to accommodate cultural food preferences of WIC participants (USDA/FNS, 2014b). WIC supports the national health goals of Healthy People 2020, specifically those related to birth weight, childhood and adult weight, and breastfeeding prevalence (NWA, 2013; HHS, 2015).
WIC is funded through discretionary grants that are appropriated by Congress on an annual basis. Grants are administered to 90 WIC state agencies, which include agencies in each of the 50 states, the District of Columbia, 5 territories, and 34 Indian Tribal Organizations (USDA/FNS, 2015a). WIC is not an entitlement program and is not guaranteed unlimited funds. The maximum number of eligible women, infants, and children who can be served has the potential to be limited by the amount of funding appropriated in a given year. In 2014, the WIC program served an average of approximately 8.2 million women, infants, and children on a monthly basis through its 1,900 local agencies in 10,000 clinic sites (USDA/FNS, 2015a). Approximately 50 percent of infants and 40 percent of pregnant women in the United States benefit from WIC services (USDA/FNS, 2015a; personal communication, J. Hirschman, USDA-FNS, October 15, 2014).
Participants in the WIC program must meet eligibility criteria for life stage, income, and nutritional risk in order to receive benefits. Specifically, applicants must be: (1) women who are pregnant and up to 6-months postpartum, or, if breastfeeding, 1-year postpartum; infants or children up to 5 years of age; (2) at or below 185 percent of federal poverty guidelines or enrolled in Temporary Assistance for Needy Families, Supplemental Nutrition Assistance Program, or Medicaid; and (3) at nutritional risk (e.g., anemia, obesity, underweight, high-risk pregnancy). WIC participants receive a range of benefits, including nutrition education, breastfeeding support, health and social services referrals, and nutritious supplemental foods. The supplemental foods provided in the WIC food packages are designed to provide specific nutrients determined to be lacking in the diets of the WIC target population (7 C.F.R. § 246).
The composition of the food packages offered to participants remained relatively unchanged throughout the first 30 years of the program, aside from enhancing the breastfeeding food package in 1992. In 2006, an IOM committee proposed the first significant revisions to the WIC food packages, at the request of USDA-FNS (IOM, 2006). Most, but not all, of the 2006 IOM report recommendations were fully implemented, which dramatically changed the food benefit offerings. While most were instituted by fall of 2009 in accordance with the Interim Rule (USDA/FNS, 2007c), some changes have taken up to 6 years to be implemented.
A decade has passed since the first set of recommended changes to the WIC food packages. In that time, the WIC population has changed in
ways that reflect demographic changes across the United States, which have included declining birthrates (CDC, 2015) and population growth coming from immigration, temporary and permanent residency, and other population shifts (DHS, 2014). Shifts have also occurred in the public’s attention to food production, sustainability, and food systems. Since 2006, the DGA, which serve as a foundation for the WIC food packages, have undergone two revisions. Changes have also been seen in the administration of the WIC program. During this period, many state agencies have made significant updates to their Management Information Systems, moving toward more efficient, Web-based technologies. Some states have migrated to an EBT card to issue food benefits, which is required of all state agencies by 2020. Research has been conducted that provides insight into the effect of WIC generally and the food package changes specifically. Given the changing landscape of participants, advances in science, and lessons learned from the previous revision to the food packages, an opportunity exists to further refine and enhance the WIC food packages.
The USDA-FNS charged the National Academies’ current Committee to Review WIC Food Packages to conduct a two-phase evaluation of the WIC food packages and develop recommendations for revising the packages to be consistent with the current DGA and to consider the health and cultural needs of a diverse WIC population while remaining cost neutral, efficient for nationwide distribution, and nonburdensome to administration in national, state, and local agencies.
Summary of Proposed Changes and Benefits
In 2014, USDA-FNS contracted with the National Academies to conduct a comprehensive examination of the WIC food packages in relation to the best science available on food and nutrient intake relative to needs, food security and operational factors, and make recommendations for future improvements in the types and quantities of foods provided. The food package revisions recommended in this report reflect the consensus of an expert committee. Compared to the current food packages, the proposed revisions do the following:
- Provide supplemental quantities of foods across food packages. The committee’s concept of the word supplemental, as described in Chapter 6 of this report, is that the amounts of nutrients and food groups in the WIC packages should provide a moderate proportion of an individual’s requirement for a particular nutrient or recommended amount of a food group. The current food packages provide widely varying proportions of required nutrients (5 to 400 percent of DRIs) and DGA food groups (0 to 190 percent
- Align the food packages with the DGA. Analyses presented in the DGA indicate that vegetable consumption across all age groups (ages 2 years and older) and fruit consumption among adolescents and adults do not currently meet the recommended intake ranges. To support the recommended dietary shift toward more vegetables and (mainly whole) fruits put forth in the DGA, the proposed food package revisions provide larger cash value vouchers (CVVs) to children and women and allow for additional CVV value to be substituted for juice.6 The DGA also report that average seafood intake falls well below what is recommended for all age groups. To support the DGA’s recommendation to increase seafood intake, the revised food packages include fish in all children’s and women’s food packages. Furthermore, DGA analyses also indicate that while most age groups’ consumption of total grains is within the recommended intake ranges, average refined grain consumptions exceeds
of recommended intake). In developing the revised food packages, the committee sought to balance the food package offerings. While it did not create or apply a strict definition of “supplemental,” the committee considered that a supplemental amount was less than 100 percent of recommended amounts of nutrients and food groups. Therefore, adjustments were made to the extent permitted by marketplace options.5 The primary exception to this is for fully formula-fed infants less than 6 months of age (food packages I-FF-A and I-FF-B), as no other household food is appropriate for substitution in instances of formula insufficiency. For these food packages, the committee emphasizes the need to tailor the food package to meet the specific needs of the infant.
__________________
5 One of the challenges the committee faced in developing revised food packages that provided supplemental quantities of foods was the standard container sizes of products currently available on the market. Infant cereal, as will be discussed later in this appendix, serves as an illustrative example. The committee aimed to provide more infant cereal to fully breastfed infants in food package II than to their partially breastfed and fully formula-fed counterparts, because of greater need for certain micronutrients from complementary foods. Infant cereal, however, is typically available in 8- and 16-ounce containers, which would provide infants with 50 and 100 percent of recommended infant cereal intake, respectively. As such, either all food package II recipients would receive the same amount of infant cereal at a supplemental quantity (i.e., 8 ounces per month = 50 percent of recommended intake), or fully breastfed infants would receive 100 percent of the recommended amount of infant cereal. While the revisions better align with the concept of supplemental, it was not always possible to provide all nutrients and food groups in quantities less than 100 percent of the recommended amounts across all food packages.
6 The DGA currently apply to individuals ages 2 years and older. The revised food package IV-A for children ages 1 to less than 2 years, was modeled after the revisions to food package IV-B for children ages 2 to less than 5 years. Proposed revisions to the infant food package are discussed in the next section.
- Align the food packages with current dietary guidance for infants. To better align food package II (infants ages 6 to less than 12 months) with current complementary feeding recommendations from the AAP, the quantity of infant cereal, jarred infant food vegetables and fruits (for fully breastfed infants only), and jarred infant food meat (for fully breastfed infants only) prescribed in food package II are revised. Additional options for substitutions (CVV for some or all of the jarred infant food vegetables and fruits; canned fish for infant food meat) are also provided to encourage redemption and consumption.
- Enhance food packages for any level of breastfeeding. The proposed revisions to the food packages are intended to encourage breastfeeding. Revised food packages V-B and VII are enhanced to support and incentivize both partial (mostly) and full breastfeeding to the extent possible within the cost-containment parameters. The proposed revisions also clarify the maximum amount of formula that may be prescribed to a partially breastfed infant in the first 30 days of life through individual nutrition tailoring. The proposed revision would create an opportunity for mother–infant dyads that would otherwise be categorized as fully formula-fed to achieve and maintain a partially breastfeeding status within the program.
recommend intake limits and average whole grain consumption falls well below recommended intake ranges for nearly every age group. The revised food packages support the DGA’s recommendation of daily intake of whole grains being at least half of total grain intake by recommending that all ready-to-eat (RTE) breakfast cereal provided by WIC meet the “whole grain-rich” criteria and by recommending that additional whole grain substitutes (e.g., cornmeal, buckwheat, teff) be added as state options.
The committee is proposing changes to each of the food packages, along with changes to the specifications of select authorized food items. The proposed food package revisions, and the corresponding rationale and anticipated benefits, are outlined in the sections that follow.
Food Package I—Infants Under 6 Months
Proposed revision Modify/clarify what constitutes partial (mostly) breastfeeding in the first 30 days.
- After a breastfeeding assessment by a competent professional authority, an infant can be prescribed up to 364 fluid ounces of
- The infant’s mother is eligible to be prescribed food package V-B (partially [mostly] breastfeeding woman).
infant formula and still be classified as a partially (mostly) breastfed infant (food package I-BF/FF-A).
Rationale and benefit The current rule was intended to encourage women who initiated breastfeeding to do so exclusively, while allowing a small amount of infant formula as a supplement. Under this provision, infants receiving more than 104 fluid ounces of reconstituted infant formula in the first month of life are considered fully formula fed, even if the provision of infant formula is substantially less than the amount that can be prescribed in food package I-FF-A (full nutrition benefit = 806 fluid ounces). The proposed revision is intended to support partial breastfeeding and to prevent premature categorization of the dyad as fully formula-fed. This recommendation is not intended to undermine the success of states or local agencies that have identified the resources needed to support breastfeeding. Rather, it is meant to bolster the importance of the support and counseling needed to establish and sustain breastfeeding in the immediate postpartum period. The proposed revision maintains the federal requirement that routine issuance of infant formula in the first month is not standard; it would give state agencies and WIC staff greater flexibility to tailor food package I-BF/FF-A and to support women who choose to partially (mostly) breastfeed their infants.
Proposed revision Allow tailoring of all prescribed infant formula quantities.
- Across all infant food packages, the maximum formula quantities should be considered “up to” amounts. All formula prescribed to infants should be tailored to the individual needs of the infant.
- The amount of formula that can be prescribed in food package I-BF/FF-A and I-BF/FF-B is up to 364 fluid ounces (monthly maximum allowances of 388 fluid ounces reconstituted liquid concentrate, 384 fluid ounces ready-to-feed, or 435 fluid ounces reconstituted powder).
- The amount of formula that can be provided in food package I-BF/FF-C is up to 442 fluid ounces (monthly maximum allowances of 460 fluid ounces, reconstituted liquid concentrate, 474 fluid ounces ready-to-feed or 522 fluid ounces reconstituted powder).
- The amount of formula that can be prescribed in food package I-FF-A is up to 806 fluid ounces (monthly maximum allowances of 823 fluid ounces, reconstituted liquid concentrate, 832 fluid ounces ready-to-feed, or 870 fluid ounces reconstituted powder).
- The amount of formula that can be prescribed in food package I-FF-B is up to 884 fluid ounces (monthly maximum allowances of 896 fluid ounces reconstituted liquid concentrate, 913 fluid ounces ready-to-feed or 960 fluid ounces reconstituted powder).
Rationale and benefit The current WIC policy guidelines state that the maximum monthly allowance of infant formula should not be used as the standard for issuance unless the mother is not breastfeeding the infant at all (USDA/FNS, 2016d). The committee, however, recommends formula prescriptions be tailored to the individual needs of the infant. This proposed revision would give clinics greater flexibility to tailor the infant formula quantities prescribed to all infants who are not fully breastfed. Aside from food package I-BF/FF-A (previously described), the maximum quantities are unchanged.
Food Package II—Infants Ages 6 to Less Than 12 Months
Proposed revision Allow tailoring of all prescribed infant formula quantities.
- Similar to food package I, across all infant food packages, the maximum formula quantities should be considered “up to” amounts. All formula prescribed to infants should be tailored to the individual needs of the infant.
- The amount of formula that can be provided in food package II-BF/FF is up to 312 fluid ounces (monthly maximum allowances of 315 fluid ounces reconstituted liquid concentrate, 338 fluid ounces ready-to-feed, or 384 fluid ounces reconstituted powder).
- The amount of formula that can be provided in food package II-FF is up to 624 fluid ounces (monthly maximum allowances of 630 fluid ounces reconstituted liquid concentrate, 643 fluid ounces ready-to-feed, or 696 fluid ounces reconstituted powder).
Rationale and benefit Rationale and benefits of allowing tailoring of the prescribed infant formula quantities are the same as for younger infants. See “Food Package I—Infants Under 6 Months” for details.
Proposed revision Reduce the quantity of infant cereal prescribed in food package II.
- Food package II-BF recipients are prescribed 16 ounces of infant cereal per month.
- Food packages II-BF/FF and II-FF recipients are prescribed 8 ounces infant cereal per month.
Rationale and benefit
- The amount of infant cereal currently prescribed in food package II provides approximately 150 percent of the amount recommended by the AAP (AAP, 2014). Reducing the amount of infant cereal prescribed in food package II aligns with the concept of supplemental.
- Infant cereals are a favored first food and are good sources of zinc and iron. Because fully breastfed infants are not likely to receive zinc and iron from infant formula, food package II-BF recipients are prescribed more infant cereal per month compared to their partially (mostly) breastfed and fully formula-fed counterparts.
Proposed revision Reduce the quantity of jarred infant food vegetables and fruits provided to fully breastfed infants; offer CVV substitution option to all food package II recipients.
- Food package II-BF recipients are prescribed 128 ounces jarred infant food vegetables and fruits per month.
- All food package II recipients can substitute a $10 or $20 CVV for half or all of the jarred infant food vegetables and fruits, respectively.
- The CVV can be used to purchased vegetables and fruits in all forms allowed by the state agency (i.e., fresh, frozen, canned) except dried.
Rationale and benefit
- The IOM committee (2006) that put forth the first set of recommended food package changes did not provide nutrient-based rationale for the selected quantity of jarred infant food vegetables and fruits for food package II-BF recipients. Rather, it stated, “to encourage or promote full breastfeeding, the recommended amounts of [infant] food fruits and vegetables are more generous for fully breastfed infants than other infants” (page 103).
- The AAP does not provide specific intake recommendations for infant food vegetables and fruits, but it does acknowledge they are useful for transitioning infants to solid foods (AAP, 2014).
- Public comments indicated that 256 ounces of jarred infant food vegetables and fruits per month can exceed the need of the infant.
- The reduction of jarred infant food vegetables and fruits brings the fully breastfed infant’s food package in better alignment with the concept of supplemental. Other incentives for full breastfeeding have been included in other aspects of the mother–infant dyad’s
- Jarred infant food is retained in food package II as a convenient, shelf-stable form of vegetables and fruits for infants. The options for partial or complete substitution of jarred infant food vegetables and fruits with CVVs are intended to help participants meet their cultural needs and personal preferences. Caregivers can use the vegetables and fruits purchased with the CVV to prepare infant foods of varying textures that are suitable to the infant’s developmental stage.
- Participants may be able to buy more servings of fruits or vegetables using the CVV compared to the jarred varieties.
food packages. For example, the quantity and variety of foods available to the breastfeeding mother during the infant’s first 6 months are greater compared to the postpartum (nonbreastfeeding) package (increasing proximal incentives) and extend for 12 as opposed to 6 months (increasing distal incentives).
Proposed revision Reduce the quantity of jarred infant food meat prescribed; offer canned fish substitution option.
- Food package II-BF recipients are prescribed 40 ounces of jarred infant food meat per month.
- Food package II-BF recipients have the option of substituting four jars (10 ounces) of infant food meat with 10 ounces of canned fish per month.
Rationale and benefit
- The AAP (2014) recommends provision of 1 to 2 ounces of meat per day, which corresponds to 30 to 60 ounces per month. Currently, food package II-BF provides 130 percent of the maximum of this recommended range.
- Redemption of jarred infant food meat is particularly low; published data and public comments indicate that it is not a preferred infant food.
- The committee considered, but could not identify nutritionally equivalent but preferred alternatives to jarred infant food meat suitable for inclusion in the WIC food packages. For these reasons, jarred infant food meat is retained in food package II-BF, at a reduced quantity.
- The option of substituting canned fish for some of the jarred infant food meat provides participants with a choice that better meets their cultural needs and personal preferences, while still providing key nutrients and within cost-containment parameters. Canned fish
provides slightly more iron and some (but less) zinc per ounce and costs approximately half as much per ounce compared to jarred infant food meat. Because the nutrient profiles of jarred infant food meat and canned fish are not equivalent, the proposed revision does not allow for full substitution.
Food Package III—Participants with Qualifying Conditions
Proposed revision Clarify the role of WIC formula in food package III.
- Food package III recipients are permitted access to foods in the package that are appropriate for their age, physiological state, and medical condition without the requirement of a WIC formula (i.e., infant formula, exempt formula, WIC-eligible nutritionals).
Rationale and benefit
- The proposed revision is intended to facilitate the issuance of a food package appropriate for participants with qualifying conditions, without the provision of unnecessary items.
- Public comments indicated that a WIC formula in addition to supplemental foods for food package III recipients may not be necessary in all cases. The proposed revision would allow participants to be prescribed supplemental food(s) that qualifies them for food package III with medical documentation (e.g., whole milk for older children and women) without being required to be prescribed a WIC formula.
- The proposed revision upholds the provision in the current rule that states’ health care providers providing oversight of the medical management of the participant may refer to the WIC registered dietitian and/or qualified nutritionist for identifying appropriate supplemental foods (excluding WIC formula) and their prescribed amounts, as well as the length of time the supplemental foods are required by the participant.
Food Package IV—Children Ages 1 to Less Than 5 Years
Proposed revision Reduce the amount of juice prescribed; offer a CVV substitution option.
- Children are prescribed 64 fluid ounces of juice per month.
- A $3 CVV can be substituted for the 64 ounces of juice.
Rationale and benefit
- The role of juice in the food package has historically been to provide a source of vitamin C (which overlaps with one of the roles of the CVV) and is a convenient means of providing fruit to children.
- The amount of juice in the current packages for children provides more than 100 percent of the lower end of the AAP recommended limit of 4 ounces per day (AAP, 2014). The reduction of juice, therefore, better aligns with the concept of supplemental.
- The AAP (2014) recommends that most fruit intake should be from whole fruit because whole fruit also contributes fiber and other plant-based compounds that are removed during processing. The DGA include a recommendation that at least half of fruit intake should be from whole fruit, and state that most individuals in the United States “would benefit from increasing intakes of fruit, mostly whole fruit” (USDA/HHS, 2016). The option for CVV substitution aligns with both the AAP and DGA recommendations and allows recipients to select from options that may better meet their cultural needs and personal preferences.
- All juice offered through the WIC program (across food packages) would be 64 fluid ounces, decreasing vendor burden and streamlining options across food packages.
- The cost savings from the reduction of juice allows for other revisions across the food packages.
Proposed revision Reduce the amount of milk prescribed to children; specify substitution options.
- Food package IV-A recipients are prescribed 12 quarts of milk per month. Food package IV-B recipients are prescribed 14 quarts of milk per month.
- Children can substitute up to 4 quarts of milk per month, choosing either to substitute 2 quarts of yogurt for 2 quarts for milk or to substitute 1 pound of cheese and 1 quart of yogurt for 4 quarts of milk.
- Soy-based yogurt substitute and soy-based cheese substitute are allowable yogurt and cheese substitution options, respectively, for individuals with lactose intolerance, a milk allergy, or who consume a vegan diet. Soy-based yogurt and cheese substitutes must meet calcium and protein specifications (described later).
Rationale and benefit
- Milk in the current food packages provides what the committee considered a greater than supplemental amount of dairy (e.g.,
- The committee received public comments requesting a reduction in the amount of milk prescribed. Comments requesting reductions indicated that participants are unable to use the amount of milk provided and that milk is not always compatible with cultural needs or personal preferences.
- The revised food package IV-B provides 75 percent of the recommended amounts of dairy for children ages 2 to less than 5 years. Because the DGA food patterns do not apply to children ages 1 to less than 2 years, the committee considered that the dairy needs for this group are likely lower than those for children ages 2 to less than 5 years. Milk prescribed in food package IV-A, therefore, is 2 quarts less than the amount provided in food package IV-B.
- The two substitution options are structured to allow full redemption of fluid milk in gallon and half gallon sizes, and eliminate the single quart (“dangling quart”) of milk, which public comments indicated was difficult to find and is often more expensive.
- The option for substitution of two quarts of yogurt in place of two quarts of milk may improve intakes for participants who prefer dairy in this form. Soy options are allowable for participants with lactose intolerance, a milk allergy, and those who consume a vegan diet. The options are intended to provide participants with flexibility to select substitutions that better meet cultural needs and personal preferences.
85 percent of the recommended dairy amount for children ages 2 to less than 5 years). At the same time, intakes of dairy foods, were below recommended amounts. These data suggest that redemption of milk and/or consumption of redeemed amounts of milk are less than optimal.
Proposed revision Limit the whole grain bread option to 100% whole wheat bread; expand list of whole grain options that states may choose to allow; provide a range of allowable sizes; reduce the maximum amount of bread prescribed.
- Food packages IV recipients are prescribed 16 to 24 ounces of 100% whole wheat bread or other allowable whole grain options per month.
- In addition to current whole grain options, states may authorize corn masa flour (nonwhole grain), cornmeal, teff, and buckwheat (specifications described later). States should authorize as many options as cost constraints allow.
Rationale and benefit
- Very few states offer whole grain bread options other than 100% whole wheat. Identification of suitable whole grain breads (greater than 50% whole grain) can be challenging for participants. Restricting authorized breads to 100% whole-wheat aligns with the current practices of most state agencies and reduces state agency burden to identify allowable whole grain options.
- When the current food packages were first introduced, the 16-ounce size of bread was uncommon in the marketplace. Manufacturers had to create this size of bread specifically for WIC participants and vendors had to stock it. This created vendor, manufacturer, and participant burden. The allowable bread size range allows for the purchase of more commonly available sizes of products, including bread ranging in size from 22- to 24-ounce. The range would also eliminate the need for manufacturers to create WIC-specific product sizes. Decreasing participant burden and expanding options may also increase availability and promote intake of whole grains, for which intake is below recommended amounts across most WIC participant groups.
- The proposed revisions would slightly reduce the amount of whole wheat bread and allowable options provided to children, from a maximum 32 ounces per month in the current package to a maximum of 24 ounces in the revised food package. This slight reduction helps to offset the cost of offering the range of bread sizes across food packages.
- Additional whole wheat bread substitutions are added as state options (corn masa flour [nonwhole grain], cornmeal, teff, and buckwheat) to provide culturally appropriate alternatives, which in turn, may help to promote intake.
Proposed revision Create a quarterly rotation of legumes, peanut butter, and fish; clarify authorized types of legumes and canned fished.
- Food package IV recipients are prescribed legumes, peanut butter, and fish in a rotation over the course of 3 months.
- The rotation consists of 1 pound (16 ounces of dry or 64 ounces canned [four 15- to 16-ounce cans]) of legumes, 16–18 ounces of peanut butter, and 10 ounces of canned fish.
- State agencies must authorize both dried and canned legumes.
- Authorized canned fish may be packed in water or currently authorized sauces and flavorings. Oil-packed is no longer authorized.
Rationale and benefit
- The amount of peanut butter prescribed in the current food packages provides 167 percent of recommend amounts of the protein food subgroup of nuts, seeds, and soy, and the amount of legumes provides approximately 177 percent of recommended amounts of beans and peas for children. Both items exceed what the committee considers to be a supplemental amount.
- The proposed revision specifies that state agencies must authorize both canned and dried legumes. According to the 2015 Food Policy Options report, 85 percent of WIC state agencies have already authorized canned legumes (USDA/FNS, 2015b). Therefore, the committee considered this change an administratively feasible strategy with the potential to promote redemption and consumption.
- Authoritative groups recommend consumption of 1.0 to 1.7 ounces of lower-mercury fish per day by children ages 1 to 4 years (AAP, 2014; FDA/EPA, 2014; USDA/HHS, 2016). Intake of seafood was either low or uncommon across subgroups of WIC participants. As such, the committee considered it important to include fish in additional food packages as costs allowed.
- In the revised food package IV, legumes, peanut butter, and fish are rotated on a quarterly basis in order to provide supplemental amounts and amounts that better align with participant preferences. Although the amount of fish offered in the food packages is small compared to DGA recommended amounts of seafood (19 percent for children), it is a significant improvement over the current packages that offer no fish. It also introduces this food into participants’ diets.
- In the revised food packages, canned fish may be water packed, and may include the same sauces and flavorings that are currently allowed as a state option. Oil packed is no longer authorized. Water-packed varieties are more nutrient dense because water-packed fish is lower in energy but contains the same amounts of key nutrients per serving.
Proposed revision Increase the CVV. Food package IV recipients are prescribed a $12 vegetable and fruit CVV per month.
Rationale and benefit
- The CVV offers participants the most flexibility to meet their cultural food preferences and provides them with access to two food
- The current amount of the CVV permits participants to purchase less than one serving of fruits or vegetables per day. Based on the committee’s composite cost for vegetables and fruits most commonly purchased among WIC participants,7 $23 would be required for individuals who consumed a 1,300-kcal diet to meet half of the recommended intakes of vegetables and fruits.
- The committee increased the CVV across food packages to the extent possible within cost-neutral restrictions.
groups (vegetables and fruits) and nutrients (potassium and fiber) for which intakes were inadequate.
Food Package V-A—Pregnant Women
Proposed revision Create separate food packages for pregnant and partially (mostly) breastfeeding women.
- Pregnant women are issued food package V-A, which is different from food package V-B for partially (mostly) breastfeeding women, up to 1-year postpartum.
Rationale and benefit One of the committee’s objectives with the revised food packages was to promote and incentivize any level of breastfeeding. To do this within cost-neutral parameters, food package V was divided into two distinct food packages.
Proposed revision Reduce the amount of juice prescribed; offer a CVV substitution option.
- Pregnant women are prescribed 64 fluid ounces of juice per month.
- A $3 CVV can be substituted for the 64 ounces of juice.
Rationale and benefit The rationale and benefits are comparable to those presented for the children’s food package. See “Food Package IV—Children Ages 1 to Less Than 5 Years” for details.
Proposed revision Reduce the amount of milk prescribed; specify substitution options.
- All women are prescribed 16 quarts of milk per month.
__________________
7 Based on the vegetable and fruit composite ($0.55 per cup-equivalent) applied in this report, which considered the vegetables and fruits most commonly purchased by WIC participants in Massachusetts, Texas, and Wyoming.
- Food package V-A recipients can substitute up to 4 quarts of milk per month, choosing either to substitute 2 quarts of yogurt for 2 quarts for milk or to substitute 1 pound of cheese and 1 quart of yogurt for 4 quarts of milk.
- Soy-based yogurt substitute and soy-based cheese are authorized yogurt and cheese substitution options, respectively, for individuals with lactose intolerance, a milk allergy, or who consume a vegan diet. Authorized soy-based yogurt and cheese must meet calcium and protein specifications (described later).
Rationale and benefit
- For women who are pregnant, postpartum, or breastfeeding, the Estimated Average Requirement (EAR) for calcium is 800 mg, and the corresponding DGA recommendation for the intake of dairy, which is the major dietary source of calcium, is 3 cup-equivalents per day. Therefore, it is reasonable to provide the same quantity of the key food group for this nutrient (dairy) across food packages for women. As revised, the food packages for women provide 71 percent of the recommended amounts of dairy. The revised food packages for women provide approximately 100 percent of the calcium EAR for women.
- Rationale and benefits of the milk substitution options are the same as for children. See “Food Package IV—Children Ages 1 to Less Than 5 Years” for details.
Proposed revision Limit the whole grain bread option to 100% whole wheat bread; expand the list of whole grain options states may choose to authorize; provide a range of authorized sizes.
- Food packages V-A recipients are prescribed 16 to 24 ounces of 100% whole wheat bread or authorized whole grain options per month.
- In addition to current whole grain options, states may authorize corn masa flour (nonwhole grain), cornmeal, teff, and buckwheat (specifications described later). States should authorize as many options as cost constraints allow.
Rationale and benefit Rationale and benefits of the revisions to the whole grain bread and associated substitution options are the same as for children. See “Food Package IV—Children Ages 1 to Less Than 5 Years” for details.
Proposed revision Create a quarterly rotation of legumes, peanut butter, and fish; clarify authorized types of legumes and canned fish.
- Food package V-A recipients are prescribed legumes, peanut butter, and fish in a rotation over the course of 3 months.
- Food package V-A recipients are prescribed 2 pounds (32 ounces of dry or 128 ounces canned [eight 15- to 16-ounce cans]) of legumes, 16 to 18 ounces of peanut butter, and 10 ounces canned fish on a quarterly basis. States may decide to issue 2 pounds of legumes in 1 month (to create a quarterly rotation with tuna) or spread the legumes over 2 months. Peanut butter may only be issued once per quarter. State agencies must authorize both dried and canned legumes.
- Authorized canned fish may be packed in water or currently authorized sauces and flavorings. Oil packed is no longer authorized.
Rationale and benefit
- Legumes are key sources of many nutrients (potassium, fiber, and folate) for which intakes below recommended amounts were prevalent across participant subgroups. Therefore, legumes are a valuable component of the WIC food packages. Provision of 2 pounds of dry legumes (or eight 15- to 16-ounce cans) every 3 months brings the amount prescribed closer to what is considered supplemental for women: between 47 and 59 percent of the DGA recommended amount.
- The amount of peanut butter in the current food packages for women provides up to 168 percent of recommended amounts. In the proposed revisions to the food packages, the same quantities of peanut butter currently provided every month will still be provided but only once every 3 months, which brings the prescription in better alignment with the concept of supplemental.
- Authoritative groups recommend consumption of 1.0 to 1.7 ounces of lower-mercury fish per day by pregnant and breastfeeding women (FDA/EPA, 2014; AHA, 2015; USDA/HHS, 2016).
- Inasmuch as intake of seafood was either low or uncommon across subgroups of WIC participants, the committee considered it important to include fish in additional food packages as costs allowed. Although the amount of fish offered in the food packages is small compared to DGA recommended amounts of seafood, it is a significant improvement over the current packages that offer no fish.
- Canned fish may be packed in water and may include the same sauces and flavorings that are currently allowed as a state option.
- In the revised food package V-A, legumes, peanut butter, and fish are rotated on a quarterly basis in order to provide supplemental amounts, and amounts that better align with participant preferences. Although the amount of fish offered in the food packages is small compared to DGA recommended amounts of seafood, it is a significant improvement over the current packages that offer no fish.
Oil-packed is no longer authorized. Water-packed varieties are more nutrient dense because water-packed fish is lower in energy but contains the same levels of key nutrients per serving.
Proposed revision Increase the CVV. Food package V-A recipients are prescribed a $15 vegetable and fruit CVV per month.
Rationale and benefit Rationale and benefits of the increase in CVV are the same as for children. See “Food Package IV—Children Ages 1 to Less Than 5 Years” for details. In addition:
- The CVV provides access to vitamins A and C, folate, and other nutrients for which intakes were inadequate.
- Based on the committee’s composite cost for vegetables and fruits most commonly purchased among WIC participants, $45 would be required for individuals who consumed a 2,600-kcal diet to meet half of the recommended intakes of vegetables and fruits.
Food Package V-B—Partially (Mostly) Breastfeeding Women Up to 1-Year Postpartum
Proposed revision Create separate food packages for pregnant and partially (mostly) breastfeeding women.
- Pregnant women are issued food package V-A, which is different from food package V-B for partially (mostly) breastfeeding women, up to 1-year postpartum.
Rationale and benefit
- One of the committee’s objectives with the revised food packages was to promote and incentivize any level of breastfeeding. To do this within cost-neutral parameters, food package V was divided into two distinct food packages.
Proposed revision Reduce the amount of juice prescribed; offer a CVV substitution option.
- Partially (mostly) breastfeeding women are prescribed 64 fluid ounces of juice per month. A $3 CVV can be substituted for the 64 ounces of juice.
Rationale and benefit The rationale and benefits are comparable to those presented for the children’s food package. See “Food Package IV—Children Ages 1 to Less Than 5 Years” for details.
Proposed revision Prescribe legumes and peanut butter on a quarterly rotation; clarify authorized types of legumes.
- Food package V-B recipients are prescribed 2 pounds (32 ounces of dry or 128 ounces canned [eight 15- to 16-ounce cans]) of legumes and 16 to 18 ounces of peanut butter on a quarterly basis. States may decide to issue 2 pounds of legumes in 1 month or spread the legumes over 2 months. Peanut butter may only be issued once per quarter.
- State agencies must authorize both dried and canned legumes.
Rationale and benefit The rationale and benefits are comparable to those presented for the pregnant women’s food package. See “Food Package V-A—Pregnant Women” for details.
Proposed revision Add fish to the food package.
- Women receiving food package V-B are prescribed 10 ounces of canned fish per month.
- Authorized canned fish may be packed in water or currently authorized sauces and flavorings. Oil packed is no longer authorized.
Rationale and benefit
- Provision of canned fish on a monthly basis, rather than on a quarterly rotating basis, is intended to incentivize the partial (mostly) breastfeeding food package.
- Rationale and benefits for inclusion of fish in food package V-B are comparable to those presented for the pregnant women’s food package. See “Food Package V-A—Pregnant Women” for details.
Proposed revision Reduce the amount of milk prescribed; specify substitution options.
- All women are prescribed 16 quarts of milk per month.
- Food package V-B recipients can substitute up to 4 quarts of milk per month, choosing either to substitute 2 quarts of yogurt for 2 quarts for milk or to substitute 1 pound of cheese and 1 quart of yogurt for 4 quarts of milk.
- Soy-based yogurt substitute and soy-based cheese are authorized yogurt and cheese substitution options, respectively, for individuals with lactose intolerance, a milk allergy, or who consume a vegan diet. Authorized soy-based yogurt and cheese must meet calcium and protein specifications (described later).
Rationale and benefit The rationale and benefits are comparable to those presented for the pregnant women’s food package. See “Food Package V-A—Pregnant Women” for details.
Proposed revision Limit the whole grain bread option to 100% whole wheat bread; expand list of whole grain options that states may choose to authorize; provide a range of authorized sizes.
- Food packages V-B recipients are prescribed 16 to 24 ounces of 100% whole wheat bread or authorized grain options per month.
- In addition to current whole grain options, states may authorize corn masa flour (nonwhole grain), cornmeal, teff, and buckwheat (specifications described later). States should authorize as many options as cost constraints allow.
Rationale and benefit Rationale and benefits of the revisions to the whole grain bread and associated substitution options are the same as for children. See “Food Package IV—Children Ages 1 to Less Than 5 Years” for details.
Proposed revision Increase the CVV. Food package V-B recipients are prescribed a $25 vegetable and fruit CVV per month.
Rationale and benefit
- Provision of a larger CVV compared to the postpartum and partially (minimally) breastfeeding food package (food package VI) is intended to incentivize the partial (mostly) breastfeeding food package.
- Rationale and benefits of the increase in CVV are the same as for pregnant women. See “Food Package V-A—Pregnant Women” for details.
Food Package VI—Nonbreastfeeding Postpartum Women, Up to 6-Months Postpartum and Partially (Minimally) Breastfeeding Women, Up to 6-Months Postpartum
Proposed revision Eliminate juice.
- Postpartum and partially (minimally) breastfeeding women, up to 6-months postpartum, are no longer prescribed juice through food package VI.
Rationale and benefit Juice was removed from food package VI to achieve cost-neutrality and to increase the relative value of the partially (V-B) and fully (VII) breastfeeding packages. To compensate for the reduced juice, the CVV for food package VI was increased (described later).
Proposed revision Align milk prescription across women’s food packages; specify substitution options.
- All women are prescribed 16 quarts of milk per month.
- Food package VI recipients can substitute up to 4 quarts of milk per month, choosing either to substitute 2 quarts of yogurt for 2 quarts for milk or to substitute 1 pound of cheese and 1 quart of yogurt for 4 quarts of milk.
- Soy-based yogurt substitute and soy-based cheese are authorized yogurt and cheese substitution options, respectively, for individuals with lactose intolerance, a milk allergy, or who consume a vegan diet. Authorized soy-based yogurt and cheese must meet calcium and protein specifications (described later).
Rationale and benefit The rationale and benefits are comparable to those presented for pregnant women. See “Food Package V-A—Pregnant Women” for details.
Proposed revision Create a quarterly rotation of legumes, peanut butter, and fish; clarify authorized types of legumes and canned fished.
- Food package V-A recipients are prescribed legumes, peanut butter, and fish in a rotation over the course of 3 months.
- Food package VI recipients are prescribed 2 pounds (32 ounces of dry or 128 ounces canned [eight 15- to 16-ounce cans]) of legumes, 16 to 18 ounces of peanut butter, and 10 ounces of canned fish on a quarterly basis. States may decide to issue 2 pounds of legumes in 1 month (to create a quarterly rotation with peanut butter and canned fish) or spread the legumes over 2 months. Peanut butter may only be issued once per quarter.
- State agencies must authorize both dried and canned legumes.
- Authorized canned fish may be packed in water or currently authorized sauces and flavorings. Oil packed is no longer authorized.
Rationale and benefit The rationale and benefits are comparable to those presented for the pregnant women’s food package. See “Food Package V-A—Pregnant Women” for details.
Proposed revision Increase the CVV. Food package VI recipients are prescribed a $15 vegetable and fruit CVV per month.
Rationale and benefit Rationale and benefits of the increase in CVV are the same as for pregnant women. See “Food Package V-A—Pregnant Women” for details.
Food Package VII—Fully Breastfeeding Women, Up to 1-Year Postpartum
Proposed revision Reduce the amount of juice prescribed; offer a CVV substitution option. Fully breastfeeding women are prescribed 64 fluid ounces of juice per month. A $3 CVV can be substituted for the 64 ounces of juice.
Rationale and benefit The rationale and benefits are comparable to those presented for the children’s food package. See “Food Package IV—Children Ages 1 to Less Than 5 Years” for details.
Proposed revision Reduce the amount of milk prescribed; specify substitution options.
- All women are prescribed 16 quarts of milk per month.
- Food package VII recipients can substitute up to 6 quarts of milk per month, choosing either to substitute 2 quarts of yogurt for 2 quarts of milk or to substitute 1 pound of cheese and 1 quart of yogurt for 4 quarts of milk or to substitute 2 pounds of cheese for 6 quarts of milk.
- Soy-based yogurt substitute and soy-based cheese are authorized yogurt and cheese substitution options, respectively, for individuals
with lactose intolerance, a milk allergy or who consume a vegan diet. Authorized soy-based yogurt and cheese must meet calcium and protein specifications (described later).
Rationale and benefit
- The retention of additional substitution options is intended to incentivize the fully breastfeeding food package.
- The rationale and benefits are comparable to those presented for the pregnant women’s food package. See “Food Package V-A—Pregnant Women” for details.
Proposed revision Limit the whole grain bread option to 100% whole wheat bread; expand list of whole grain options that states may choose to authorize; provide a range of authorized sizes.
- Food packages VII recipients are prescribed 16–24 ounces of 100% whole wheat bread or authorized whole grain options per month.
- In addition to current whole grain options, states may authorize corn masa flour (nonwhole grain), cornmeal, teff, and buckwheat (specifications described later). States should authorize as many options as cost constraints allow.
Rationale and benefit Rationale and benefits of the revisions to the whole grain bread and associated substitution options are the same as for children. See “Food Package IV—Children Ages 1 to Less Than 5 Years” for details.
Proposed revision Prescribe legumes and peanut butter on a quarterly rotation; clarify authorized types of legumes.
- Food package VII recipients are prescribed 2 pounds (32 ounces of dry or 128 ounces canned [eight 15- to 16-ounce cans]) of legumes and 16 to 18 ounces of peanut butter on a quarterly basis. States may decide to issue 2 pounds of legumes in 1 month or spread the legumes over 2 months. Peanut butter may only be issued once per quarter.
- State agencies must authorize both dried and canned legumes.
Rationale and benefit The rationale and benefits are comparable to those presented for the pregnant women’s food package. See “Food Package V-A—Pregnant Women” for details.
Proposed revision Reduce fish in the food package; modify specifications.
- Women receiving food package VII are prescribed 20 ounces of canned fish per month.
- Authorized canned fish may be packed in water or currently authorized sauces and flavorings. Oil packed is no longer authorized.
Rationale and benefit
- Fully breastfeeding women are prescribed the greatest quantity of fish on a monthly basis in order to incentivize the food package.
- The fish provision was slightly reduced from 30 ounces per month in the current food package to 20 ounces per month in the revised food package in order to achieve cost neutrality and allow for a monthly provision of fish in the partially breastfeeding package.
- Rationale and benefits for maintaining fish in food package VII are comparable to those presented for the pregnant women’s food package. See “Food Package V-A—Pregnant Women” for details.
Proposed revision Increase the CVV. Food package VII recipients are prescribed a $35 vegetable and fruit CVV per month.
Rationale and benefit
- Provision of the largest monthly CVV compared to all other food packages is intended to incentivize the fully breastfeeding food package.
- Rationale and benefits of the increase in CVV are the same as for pregnant women. See “Food Package V-A—Pregnant Women” for details.
Other Provisions (Not Specific to a Single Food Package)
Proposed revision Modify specifications for milk. Only unflavored milk is permitted. All other specifications remain unchanged.
Rationale and benefit
- The proposed revision aligns the milk offering with Child and Adult Care Food Program (CACFP) provision of milks to children less than 5 years of age. The specification reduces the amount of added sugars that can be provided through the WIC food packages.
- At present, flavored milk is offered in 6 percent of states and 40 percent of Indian Tribal Organizations (ITOs), which together cover 3 percent of WIC participants (USDA/FNS, 2015b). At least one ITO is removing flavored milk from its food list to align with CACFP policy (personal communication, D. Tipton, Chickasaw Nation WIC, July 2016). Therefore, the recommendation is not expected to cause a significant disruption in administration of food packages nationally.
Proposed revision Increase federal minimum vegetable stocking requirement; increase number of vegetable and fruit forms states must authorize.
- Require WIC vendors to stock a minimum of three varieties of vegetables and two varieties of fruits.
- States must authorize fresh and at least one additional form (frozen, canned, and/or dried) of vegetables and fruits.
Rationale and benefit
- The committee foresees the need to provide participants with a greater variety of options, given the larger CVVs and opportunities to substitute juice and jarred infant food vegetables and fruits with CVVs.
- The proposed revision seeks to enhance the amount and forms of vegetables and fruits available in WIC authorized stores, while minimizing burden on small vendors.
- The increased vegetable requirement is intended to encourage participants to prioritize the use of the CVV for vegetables.
Proposed revision Increase soy substitution options; specify nutrient profiles of soy options.
- Soy-based yogurt and cheese are authorized yogurt and cheese substitution options, respectively, for individuals with lactose intolerance, a milk allergy, or who consume a vegan diet.
- Soy-based yogurt must contain at least 250 mg of calcium and 6.5 grams of protein per 8 ounce serving.
- Soy-based cheese must contain at least 250 mg of calcium and 6.5 grams of protein per 1.5-ounce serving.
- In addition to current standards for authorized soy-based beverages, the total sugars content should be as low as possible, not to exceed 12 grams per 8-ounce serving.
- Authorized tofu must contain a minimum of 200 milligram of calcium per 100 grams of tofu. Calcium-set is no longer part of the specification. Authorized tofu may not contain added fats, sugars, oils, or sodium.
Rationale and benefit
- The soy substitutions for yogurt or cheese are intended to meet the needs of individuals with lactose intolerance, a milk allergy, or who consume a vegan diet. The soy-based options in the food packages serve as milk substitutions. As such, the revised specification ensures that items in the food packages provide an amount of calcium as close to the amount in a serving of milk as reasonable, considering marketplace options.
- Sugars in soy-based beverages are 100 percent added; added sugars intakes are excessive in the WIC population, therefore the committee considered it important to apply a limit that considers nationwide availability of these products.
Proposed revision Create a range of authorized yogurt sizes; reduce the total sugars limit.
- At the discretion of the state agency, the yogurt quart substitution may range from 30 to 32 ounces to accommodate the smaller container sizes (approximately 5 ounces).
- In addition to the current specifications, authorized yogurts must contain no more than 30 grams total sugars per 8-ounce serving (≤3.75 grams total sugars per ounce).
Rationale and benefit
- The yogurt container sizes commonly available in the marketplace vary in total ounces, especially the single serving sizes. The proposed range of ounces of yogurt that substitutes for 1 quart of milk would allow for smaller container sizes to be authorized as a state option. State agencies would need to determine if provision of the smaller containers is within cost-containment parameters.
- The availability of yogurts that contain 30 grams or less of total sugars per 8-ounce serving has expanded substantially in recent years. The reduced total sugar limits for yogurt is more closely aligned with the DGA.
Proposed revision Modify the bread specifications; expand the list of state options for substitutions; specify specific nutrient parameters.
- Whole grain bread is no longer permitted; only 100% whole wheat bread is permitted.
- In addition to current whole grain options, states may authorize corn masa flour (nonwhole grain), teff, and buckwheat (specifications described later). States should authorize as many options as cost constraints allow.
- Cornmeal (including blue) meeting the FDA standard of identity (21 C.F.R. 137.260) and that is in alignment with USDA specifications for cornmeal in School Meal Programs (USDA-CNP-01-2008) may also be added as an option.
- Once available in the marketplace, states are encouraged to offer folic acid fortified corn masa flour and tortillas made with folic acid-fortified corn masa flour.
Rationale and benefit
- Very few states offer whole grain bread options other than 100% whole wheat. From the participant’s perspective, identification of suitable whole grain breads (more than 50 percent whole grain) is challenging. As such, restricting to 100% whole wheat bread aligns with most current state WIC authorized food lists.
- Culturally appropriate alternatives are provided as state options. The selected options correspond to nutritionally appropriate items that participants and WIC staff expressed an interest in adding to the food packages. The expanded list allows state agencies to tailor their offerings to better accommodate the cultural needs and personal preferences of WIC clientele.
Proposed revision Changing whole grain specification of authorized breakfast cereals.
- In addition to meeting current nutrient specifications, all ready-to-eat cereals on a state agency’s authorized food list must adhere to the “whole grain-rich” criteria as outlined by USDA-FNS for the School Lunch Program (USDA/FNS, 2014c).
Rationale and benefit
- The committee’s analysis of NHANES data indicated that intakes of whole grains continue to be poor and intakes of refined-grains
- Whole grain cereal options have expanded substantially since the last review of the WIC food packages, removing marketplace availability as a barrier to access. Launches of whole grain products including cereal (wheat and other grains) doubled between 2006 and 2011 (Oldways, 2015).
- Two large national manufacturers of RTE breakfast cereals produce at least 14 different types of RTE cereals that meet the current WIC whole grain criteria (which is similar to the whole grain rich criteria), including 4 gluten-free whole grain varieties.
- The previous committee to review WIC food packages (IOM, 2006) recommended that all breakfast cereals provided through WIC be whole grain (that is, the grain component is at least 50 percent whole grain) to align with the 2005 DGA. Since 2005, the DGA have consistently specified that at least half of grain intake should be from whole grains. The DGA specifically state that intake of refined grains should be limited, although individuals (particularly women capable of becoming pregnant) who consume all grains as whole should include some sources fortified with folic acid as a means of preventing neural tube defects. RTE, fortified whole grain cereals are an example such a source (USDA/HHS, 2016).
excessive across the WIC subgroups studied. Focusing on whole grains in the WIC food packages may also improve acceptability of whole grains for the longer term. This change increases the amount of whole grains in the food packages. This change also aligns WIC specifications with those of CACFP (USDA/FNS, 2014c).
Proposed revision Modify the specifications for canned fish.
- Authorized canned fish may be packed in water. Pack may include bones or skin. Added sauces and flavorings, such as tomato sauce, mustard, lemon, are authorized at the state agency’s option. May be regular or lower in sodium content. Oil-packed is no longer authorized.
Rationale and benefit
- Water-packed varieties are more nutrient dense because water-packed fish is lower in energy but contains the same levels of key nutrients per serving.
- Few states currently offer oil-packed fish. The effect of this specification, therefore, is expected to have little effect on participant choice.
Summary of Key Provisions
The anticipated effects of the proposed food package revisions on four broad stakeholder groups—the USDA/federal government, state and local agencies, vendors and industry, and WIC participants—are summarized in Table U-2. The overall projected net cost difference are also noted; a detailed evaluation of the cost effects is presented in the section that follows Table U-2. The direction and magnitude of the presented cost differences are dependent on the committee’s assumptions. The cost effects of alternative assumptions are evaluated in the “Uncertainties” section of this appendix.
COST
Proposed Revisions to the Benefit
Unadjusted Estimates of Food Costs and Total Cost Differences
Table U-3 presents unadjusted food cost estimates for the current and revised food packages. The total unadjusted food costs from FY2018 through FY2022 are estimated to be $17.7 billion (averaging $3.93 billion per year) for the current food packages and $17.4 billion (averaging $3.87 billion per year) for the revised food packages. Over the course of FY2018 through FY2022, the proposed revisions are projected to lead to a total unadjusted cost savings of $263 million, as compared to the current food packages.
Phased-in Cost Differences
Table U-4 presents the phased-in cost differences between the current and revised food packages, from FY2018 through FY2022. Assuming phased-in implementation across the WIC program inherently decreases the projected total cost savings. The total phased-in cost savings for FY2018 through FY2022 are approximately $42 million less than the total unadjusted cost savings ($220.4 million versus $262.8 million). The estimated cost differences not only reflect changes to the type and quantity of items in the specific food packages, but also the proportion of participants who are prescribed each food package. The cost savings in food package I in FY2021 and FY2022, for example, is driven by the anticipated 5 percent shift of fully formula-fed mother–infant dyads to the partially (mostly) breastfeeding participant categories, due to the incentives incorporated in to the revised food packages (see the “Participation” subsection in the section “Cost Estimate Methodology” for additional details about this assumption).
TABLE U-2 Summary of Key Revisions
| Current Rules, Proposed Revisions, and Projected Net Cost Differences* | Effect of the Proposed Revision | |||
|---|---|---|---|---|
| USDA/Federal Government | State/Local Agencies | Vendors/Industry | WIC Participants | |
Current rule: State agencies have the option to prescribe breastfed infants up to 104 fl oz of infant formula (not more than one can of powdered infant formula) during the first 30 days of life, on a case-by-case basis. Proposed revision: Breastfed infants can be prescribed up to 364 fl oz of infant formula during the first 30 days of life, on a case-by-case basis after a breastfeeding assessment by a competent professional authority, and remain categorically classified as a partially breastfed infant. (Net cost effect: savings) |
The cost of food package I-BF/FF-A itself may slightly increase, depending on how frequently competent professional authorities identify need for issuance of formula beyond 104 fl oz. The anticipated shift in fully formula-fed dyads toward the partial (mostly) breastfeeding food packages is expected to largely offset additional costs of the infant formula. | At the staff and clinic level, the proposed revision is expected to provide greater flexibility in tailoring the partially (mostly) breastfed infant’s food package and create opportunities to support partial breastfeeding in dyads who would otherwise be considered fully formula-fed. Management Information Systems will need to be updated. State and local agencies will encounter a short-term burden of retraining staff. | The effect on vendors or industry is anticipated to be minimal. The anticipated shift in fully formula-fed dyads to the partial (mostly) breastfeeding food packages may reduce the amount of infant formula purchased by WIC participants with their food benefit. | The revision is intended to allow more flexibility for women and infants in the first month, as opposed to the current situation in which only two options are available (fully breastfeeding or fully formula-feeding). The proposed revision is intended to provide security for women who may try to breastfeed in the immediate postpartum period but are not yet certain they can succeed. |
| Current rule: The maximum monthly allowance of formula should not be used as the standard for issuance unless the mother is not breastfeeding the infant at all. Proposed revision: The quantity of infant formula prescribed to infants should be tailored based on needs. All maximum monthly allowances for infant formula should be considered “up to” amounts. (Net cost effect: minimal) |
The cost effect of the proposed revision will depend on the extent to which infant formula tailoring occurs. If minimal tailoring occurs, the cost effects would be minimal. If it is fully executed, the proposed revision would result in a cost savings. | At the staff and clinic level, the proposed revision is expected to provide greater flexibility in tailoring the amount of formula provided to infants. Management Information Systems will need to be updated. State and local agencies will encounter a short-term burden of retraining staff. | The effect on the vendors will depend on the amount of infant formula tailoring that occurs. If minimal tailoring occurs, the effect on infant formula sales would be minimal. Full execution is likely to result in a decrease of infant formula sales to WIC participants using their food benefit. | Participants would still have access to the quantities of infant formula currently being offered by WIC. The proposed revision, however, would help participants receive the amount of infant formula needed to meet their infants’ needs. |
| Current rule: All food package II recipients are prescribed 24 oz of infant cereal per month Proposed revision: Food package II-BF recipients are prescribed 16 oz of infant cereal per month; II-FF and II-BF/FF |
The proposed revision would reduce the cost of food package II. This reduction helps offset costs elsewhere in the food packages. | Administrative burden is expected to be minimal. State agencies currently authorize 8 oz infant cereal containers; some state agencies also authorize 16 oz containers. Management Information Systems will need to be updated. State and local agencies will | The proposed revision may result in reduced infant cereal sales to WIC participants. It is not anticipated to affect stocking requirements. | Although infants will receive less infant cereal under the revised food package, the amount provided is more consistent with current complementary feeding recommendations. |
| Current Rules, Proposed Revisions, and Projected Net Cost Differences* | Effect of the Proposed Revision | |||
|---|---|---|---|---|
| USDA/Federal Government | State/Local Agencies | Vendors/Industry | WIC Participants | |
| recipients are prescribed 8 oz per month (Net cost effect: savings) |
encounter a short-term burden of retraining staff and communicating the change to participants when the revisions are initially implemented. | |||
| Current rule: Food package II-BF recipients are prescribed 256 oz of jarred infant food vegetables and fruits per month. All other food package II recipients receive 128 oz of jarred infant food vegetables and fruits. Up to 16 oz of jarred infant food fruits can be substituted with fresh bananas, one banana per 4 oz jar. Proposed revision: All infants receiving food package II are prescribed 128 oz of jarred infant food vegetables and fruits. |
Despite the decrease in jarred infant vegetable and fruit issuance to fully breastfed infants, the option for CVV substitution is expected to lead to an increase in redemption, thereby increasing costs to the program. | Administrative burden is expected to be minimal. Management Information Systems will need to be updated, but overall it will improve Management Information Systems efficiency by authorizing the same vegetable and fruit varieties for all CVVs. State and local agencies will encounter | The proposed revision may result in slight reductions in jarred infant food vegetable and fruit sales to WIC participants, but it may increase fresh, frozen, and/or canned vegetables and fruits via the CVV. This is not anticipated to affect stocking requirements. | The proposed revision is intended to provide fully breastfed infants with a supplemental quantity of infant food vegetables and fruits, in the absence of definitive guidance on recommended intake. The CVV substitution option provides participants the opportunity to prepare their own infant food vegetables and fruits, which can be used to better meet diverse cultural needs, personal preferences, and the infant’s developmental stage. Participants may be able to buy more servings of vegetables or fruit using the CVV compared to the jarred varieties. |
| A CVV can be prescribed for partial substitution ($10 for 64 oz jarred infant food vegetables and fruits) or complete substitution ($20 for the 128 oz). The CVV can be used to purchased vegetables and fruits in all forms authorized by the state agency (i.e., fresh, frozen, canned) except dried. (Net cost effect: increase) |
a short-term burden of retraining staff and communicating the change to participants when the revisions are initially implemented. State and local agencies will also face an administrative burden developing educational messages and materials related to selecting and preparing vegetables and fruits appropriate for complementary feeding. | of vegetables or fruit using the CVV compared to the jarred varieties. | ||
| Current rule: Food package II-BF recipients are prescribed 77.5 oz of infant food meat per month. Proposed revision: Food package II-BF recipients are prescribed 40 oz of infant food meat per month. Ten oz of canned fish can be substituted for 4 jars (10 oz) of infant food meat per month. (Net cost effect: savings) |
Because redemption of infant food meat is low, reducing the amount prescribed is expected to result in slight cost savings. The option for substitution of canned fish may slightly increase redemption in this category. Given that canned fish is currently less expensive per oz than jarred infant food meat, increase in redemption may be offset by the slightly lower price. | Implementation of the proposed revision will require training WIC staff and participants of the change and new substitution option. Management Information Systems will need to be updated. | The revision may reduce the amount of infant food meat purchased by WIC participants. The substitution option may slightly increase the amount of canned fish purchased by WIC participants. | The proposed revision addresses participants’ feedback about the quantity and preference in the infant food meat category, while still providing key nutrients to fully breastfed infants. The substitution option provides participants with greater flexibility in this food category. |
| Current Rules, Proposed Revisions, and Projected Net Cost Differences* | Effect of the Proposed Revision | |||
|---|---|---|---|---|
| USDA/Federal Government | State/Local Agencies | Vendors/Industry | WIC Participants | |
| Current rule: Food package III is reserved for participants who have one or more qualifying conditions that require an exempt infant formula or WIC-eligible nutritional (formerly WIC-eligible medical food) to supplement their nutrition needs, as determined by the participant’s health care professional. Proposed revision: Participants with a qualifying condition in which a WIC formula is not medically necessary are still eligible to receive appropriate supplementary foods through food package III. (Net cost effect: minimal) |
Clarifies that WIC formula is not an absolute requirement of food package III. The cost effects of the proposed revision will be minimal, as the number of applicable participants is expected to be extremely small. | Administrative burden increases in the short term. Management Information Systems will need to be updated. | No impact. | Some participants receiving food package III may be prescribed a package that is more appropriate for their needs. |
| Current rule: Children are prescribed 128 fl oz of juice per month; pregnant, partially (mostly) breastfeeding, and fully breastfeeding women are prescribed 144 fl oz of juice per month; postpartum and partially (minimally) breastfeeding women are prescribed 96 fl oz of juice per month. Proposed revision: Children, pregnant women, partially (mostly) breastfeeding women, and fully breastfeeding women are prescribed 64 fl oz of juice per month. Recipients may opt to substitute a $3 CVV for the 64 fl oz of juice. Postpartum and partially (minimally) breastfeeding women no longer receive juice. (Net cost effect: savings) |
The reduction in juice prescribed would reduce the costs of the food packages. This reduction helps offset costs elsewhere in the food packages. | Implementation of the proposed revision will require training WIC staff and participants of the change and new substitution option. Management Information Systems will need to be updated. | Less juice would be purchased with the WIC food benefits. The minimum stocking requirements for juice would be simplified, as all participants prescribed juice would receive 64 fl oz (or frozen equivalent). | The proposed revision provides a supplemental amount of juice, which can help participants meet their daily fruit intake goals. The CVV substitution option allows participants greater flexibility to tailor their food package for personal preferences. The reduction and eliminations (food package VI) of juice from the food packages also allowed for larger CVVs across all food packages provided to children and women. |
| Current Rules, Proposed Revisions, and Projected Net Cost Differences* | Effect of the Proposed Revision | |||
|---|---|---|---|---|
| USDA/Federal Government | State/Local Agencies | Vendors/Industry | WIC Participants | |
| Current rule: Food package IV and VI recipients are prescribed 16 qt of milk per month. Food package V recipients are prescribed 22 qt of milk per month. Food package VII recipients are prescribed 24 qt of milk per month. Three qt of milk can be substituted for 1 lb of cheese, with the maximum amount of cheese being 1 lb for food packages IV, V, and VI and 2 lb for food package VII. Food package VII recipients are also prescribed 1 lb of cheese as a separate food package category. At state agency option, 1 qt of yogurt may be substituted for 1 qt of milk for women and children in food packages III–VII. | The proposed revisions would reduce the costs of the food packages. This reduction helps offset costs elsewhere in the food packages. | The administrative burden is expected to be short term, as the revision changes quantities rather than adding new items. It will require training WIC staff and participants of the changes and revised substitution options. Management Information Systems will need to be updated. | The total amount of milk purchased by WIC participants with their food benefit is expected to decrease. The revised quantities and substitution options eliminate participants’ need for milk in a quart-sized container. More yogurt may be purchased by WIC participants under the revised substitution options, as 1 and 2 qt substitution options are allowed. The state agency option of a range of yogurt container sizes (30 to 32 oz) may also lead to increased redemption. Stocking requirements are not expected to substantially expand or change. | The proposed revisions provide supplemental quantities of milk across the food packages. The substitution structure eliminates the possibility of a dangling quart and may be more compatible with cultural needs or preferences. |
| No more than 1 qt of yogurt is authorized per participant. No more than a total of 4 qt of milk may be substituted for a combination of cheese, yogurt, or tofu for children and women in food packages IV–VI. No more than a total of 6 qt of milk may be substituted for a combination of cheese, yogurt, or tofu for women in food package VII. Proposed revision: Food package IV-A recipients are prescribed 12 qt of milk per month. Food package IV-B recipients are prescribed 14 qt of milk per month. All women are prescribed 16 qt of milk per month. Cheese is no longer offered as a separate food package item. Children and women can substitute up to 4 qt of milk per month, choosing either |
| Current Rules, Proposed Revisions, and Projected Net Cost Differences* | Effect of the Proposed Revision | |||
|---|---|---|---|---|
| USDA/Federal Government | State/Local Agencies | Vendors/Industry | WIC Participants | |
| to substitute 2 qt of yogurt for 2 qt for milk or to substitute 1 lb of cheese and 1 qt of yogurt for 4 qt of milk. Fully breastfeeding women can choose from a third substitution option of 2 lb of cheese for 6 qt of milk. Only one substitution option can be selected per month. At the discretion of the state agency, yogurt may be prescribed as a range of 30 to 32 oz, to accommodate different container sizes available on the market. (Net cost effect: savings) |
||||
| Current rule: Food packages V and VII recipients are prescribed 1 lb of whole wheat | The proposed revisions are expected to decrease food package costs. The expanded list of whole | The expanded list of whole grain options that states can authorize are intended to better meet | The range of whole wheat bread sizes may lead to the elimination of the 16 oz bread size | WIC participants will benefit by allowing whole wheat breads that are readily available in the |
| bread or other authorized options. Food package IV recipients are prescribed 2 lb of whole wheat bread or other authorized options. Authorized whole grain options include brown rice, bulgur, oats, whole grain barley, tortillas, and pastas. Proposed revision: Food packages IV, V, and VII recipients are prescribed one 16 to 24 oz 100% whole wheat bread or other authorized whole grain option. Allowable whole grain options include brown rice, bulgur, oats, whole grain barley, tortillas, pastas, corn masa flour (nonwhole grain), cornmeal, teff, and buckwheat. (Net cost effect: savings) |
grain options is available at the discretion of state agencies, within cost-containment parameters. | the cultural and personal preferences of the participants they serve, within cost containment parameters. The expansion of whole grain sizes will require the Management Information Systems to be updated. WIC staff, vendors, and participants will need to be trained on new sizes and options. | in the market, which was principally created for the WIC population. The proposed revision is likely to lead to stocking requirements that better reflect widely available sizes. Vendors will need to train personnel to identify WIC-eligible breads and grains. | market. The expanded state options for substitutions may allow options that better meet diverse cultural needs and personal preferences. |
| Current Rules, Proposed Revisions, and Projected Net Cost Differences* | Effect of the Proposed Revision | |||
|---|---|---|---|---|
| USDA/Federal Government | State/Local Agencies | Vendors/Industry | WIC Participants | |
| Current rule: Food package VII recipients are prescribed 30 oz of canned fish per month. May be packed in water or oil. Pack may include bones or skin. May be regular or lower in sodium content. At the state agency’s option, added sauces and flavorings are allowable. Proposed revision: Food packages IV, V-A, and VI recipients are prescribed 10 oz of fish once every 3 months. Food package V-B recipients are prescribed 10 oz of fish every month and food package VII recipients are prescribed 20 oz per month. May be packed in water, but may not be packed in oil. |
Addition of fish across the food packages will increase food packages costs. The additional costs are offset by other changes across food packages. | Implementing the proposed change will increase the short-term administrative burden. Management Information Systems will need to be revised. WIC staff, vendors, and participants will need to be trained on new quantities and rotation pattern for food packages IV, V-A, and VI. The burden is expected to be relatively minor, as all food packages would be authorized the same canned fish. | The proposed revision is expected to increase the amount of water-packed canned fish purchased by WIC participants with their food benefit. The revision may increase minimum stocking requirements for small vendors. Vendors will need to train personnel to identify authorized canned fish products. | Provision of water-packed canned fish provides a high nutrient-density source of nonperishable seafood, and better aligns the food packages with DGA recommendations. |
| All other specifications remain the same. (Net cost effect: increase) |
||||
| Current rule: Food packages IV and VI recipients have the option of being prescribed 1 lb dried legumes (or 64 oz of canned legumes) or 16 to 18 oz of peanut butter per month. Food packages V and VII are prescribed 1 lb legumes (or 64 oz of canned legumes) and 16 to 18 oz of peanut butter per month. Proposed revision: Food package IV recipients receive peanut butter, legumes, and canned fish in rotation over 3 months. All women receive legumes and peanut butter once each in a quarter. Both canned and dried legumes must be allowed by all state agencies. (Net cost effect: savings) |
Reduction of the amount of legumes and peanut butter prescribed in food packages IV through VII will result in a cost savings. | States and local agencies will need to educate participants about the legume and peanut butter rotation patterns for children and women. States that do not currently authorize canned legumes will incur a short-term administrative burden of expanding to include the canned option. Management Information Systems will need to be revised. | Sales of legumes and peanut butter to WIC participants using their food instrument will decrease. Market effect is expected to be minimal. | This change brings children’s and women’s food packages in better alignment with the concept of supplemental and the recommendations of the DGA. Cost savings help offset costs of revisions throughout the food packages. |
| Current Rules, Proposed Revisions, and Projected Net Cost Differences* | Effect of the Proposed Revision | |||
|---|---|---|---|---|
| USDA/Federal Government | State/Local Agencies | Vendors/Industry | WIC Participants | |
| Current rule: Children are prescribed an $8 CVV per month. Women are prescribed an $11 CVV per month. Proposed revision: The monthly CVVs for food packages IV, V-A, V-B, VI, and VII are $12, $15, $25, $15, and $35, respectively. (Net cost effect: increase) |
Increasing the CVV across the food packages will increase food package costs. The additional costs are offset by other changes across food packages. | The infrastructure already exists to provide the CVV through the program, which greatly reduces the administrative burden associated with the proposed changes. Management Information Systems will need to be updated. States and local agencies will need to develop ways to communicate the change in the short term, and encourage use of the CVV for vegetables, to align use with the DGA. | Sales of vegetables and fruits will increase through WIC participants using their food benefit. Minimum stocking requirements will slightly increase for vendors that meet the current federal minimum stocking requirement for vegetables. Vendors in states that currently only allow fresh fruits may experience additional stocking requirements, as frozen, canned, and/or dried options are authorized. | Increasing the CVV expands the amount of vegetables and fruits participants are able to buy with their food instrument. Provision of a dollar amount allows participants flexibility and choice to meet cultural needs and personal preferences. Larger CVV values in food packages V-B and VII are intended as incentives to partial (mostly) and full breastfeeding. |
NOTES: CVV = cash value voucher; DGA = Dietary Guidelines for Americans; fl oz = fluid ounce(s); lb = pound(s); oz = ounce(s); qt = quart(s).
* The projected net cost differences described in this table are contingent on the committee’s assumptions, which are detailed in the “Cost” section of this appendix. The magnitude and even the direction of some of the cost differences can change with different assumptions that would still be considered reasonable. The cost effects of various different assumptions are evaluated in the “Uncertainties” section of this appendix.
TABLE U-3 Estimated Unadjusted Food Costs of the Current and Proposed Food Packages, FY2018 Through FY2022
| Food Package Version | Food Package | Unadjusted Food Costs ($, millions) | |||||
|---|---|---|---|---|---|---|---|
| FY2018a | FY2019 | FY2020 | FY2021b | FY2022 | Total, FY2018 Through FY2022 | ||
| Current | I | 213.5 | 441.3 | 451.0 | 461.8 | 472.9 | 2,040.6 |
| II | 300.3 | 620.5 | 634.2 | 649.4 | 665.0 | 2,869.4 | |
| IIIc | 45.2 | 93.4 | 95.3 | 97.5 | 99.7 | 431.2 | |
| IV-A | 277.7 | 571.7 | 582.1 | 593.7 | 605.5 | 2,630.7 | |
| IV-B | 616.5 | 1,268.9 | 1,291.9 | 1,317.4 | 1,343.6 | 5,838.3 | |
| V | 202.4 | 416.3 | 423.5 | 431.6 | 448.1 | 1,922.0 | |
| VI | 128.2 | 263.5 | 267.8 | 272.7 | 284.0 | 1,216.3 | |
| VII | 76.9 | 158.3 | 161.2 | 164.5 | 170.2 | 731.1 | |
| Total food costs | 1,860.7 | 3,833.9 | 3,907.1 | 3,988.7 | 4,089.2 | 17,679.6 | |
| Revised | I | 213.5 | 441.3 | 451.0 | 450.7 | 461.5 | 2,018.1 |
| II | 297.5 | 614.7 | 628.3 | 634.0 | 649.2 | 2,823.7 | |
| IIIc | 45.4 | 93.7 | 95.7 | 97.8 | 100.0 | 432.6 | |
| IV-A | 264.8 | 544.5 | 553.7 | 563.9 | 574.3 | 2,501.2 | |
| IV-B | 602.2 | 1,237.9 | 1,258.7 | 1,281.9 | 1,305.6 | 5,686.4 | |
| V-A | 166.0 | 340.9 | 346.3 | 352.3 | 358.4 | 1,563.9 | |
| V-B | 35.4 | 72.4 | 73.4 | 97.6 | 99.1 | 377.9 | |
| VI | 129.0 | 264.5 | 268.4 | 259.0 | 263.2 | 1,184.1 | |
| VII | 87.6 | 179.4 | 184.0 | 186.5 | 191.3 | 828.8 | |
| Total food costs | 1,841.4 | 3,789.5 | 3,859.4 | 3,923.7 | 4,002.7 | 17,416.7 | |
| Total unadjusted cost differencesd | −19.2 | −44.4 | −47.7 | −65.0 | −86.6 | −262.8 | |
NOTES: Unadjusted costs and cost differences assume full implementation of the proposed revisions in all state agencies as of April 1, 2018. Column and row totals may not be exact owing to independent rounding.
a This analysis assumes the earliest date of implementation of the proposed changes would be April 1, 2018. Accordingly all estimates for FY2018 only encompass a 6-month period.
b This analysis assumes the proposed revisions will incentivize partially (mostly) breastfeeding food packages for mother–infant dyads The cost estimates for the revised food package anticipates a 5 percent shift of fully formula-fed dyads to the partially (mostly) breastfed participant categories in the year after full implementation of the food package revisions under the phased-in implementation assumption. Difference in food package costs in FY2021 and FY2022 are due, in part, to this anticipated shift in participants.
c Estimated costs for food package III only include standard issuance food package items, and do not account for exempt infant formula or WIC-eligible nutritionals.
d Calculated by subtracting the current food package costs from the revised food package costs. Negative values (−) indicate that the revised food packages result in cost savings as compared to the current food packages. Positive values (+) indicate that the revised food packages result in cost increases as compared to the current food packages.
TABLE U-4 Estimated Phased-in Cost Differences of the Proposed Revised Food Packages as Compared to the Current Food Packages, FY2018 Through FY2022
| Food Package | Phased-in Cost Differences of the Revised Food Packages Compared to Current Food Packages ($, millions)a | |||||
|---|---|---|---|---|---|---|
| FY2018b,c | FY2019c | FY2020 | FY2021d | FY2022d | Total, FY2018 Through FY2022 | |
| I | 0.0 | 0.0 | 0.0 | −11.1 | −11.4 | −22.5 |
| II | −0.9 | −1.9 | −5.9 | −15.4 | −5.8 | −40.0 |
| IIIe | +0.1 | +0.1 | +0.3 | +0.3 | +0.3 | +1.1 |
| IV-A | −4.3 | −9.1 | −28.4 | −29.8 | −31.2 | −102.8 |
| IV-B | −4.8 | −10.3 | −33.1 | −35.6 | −38.0 | −121.8 |
| V-Af | −2.1 | −4.6 | −14.7 | −15.6 | −23.5 | −60.5 |
| V-Bf | +1.8 | +3.6 | +10.8 | +33.9 | +32.9 | +83.0 |
| VI | +0.2 | +0.3 | +0.5 | −13.6 | −20.8 | −33.4 |
| VII | +3.6 | +7.0 | +22.8 | +22.0 | +21.1 | +76.5 |
| Total phased-in cost differences | −6.4 | −14.8 | −47.7 | −65.0 | −86.6 | −220.4 |
NOTES: Phased-in estimates assume full implementation of the proposed revisions in state agencies serving one-third of all WIC participants as of April 1, 2018. All other state agencies are assumed to implement the proposed revisions as of FY2020.
a Cost differences were calculated by subtracting the estimated food costs for the current food packages from the estimated food costs for the revised food packages. Negative values (−) indicate that the revised food packages result in cost savings as compared to the current food packages. Positive values (+) indicate that the revised food packages result in cost increases as compared to the current food packages. Column and row totals may not be exact owing to independent rounding.
b This analysis assumes the earliest date of implementation of the proposed changes would be April 1, 2018. Accordingly all estimates for FY2018 only encompass 6 months.
c Phased-in cost differences in FY2018 and FY2019 are 33.3 percent of the unadjusted cost differences.
d This analysis assumes the proposed revisions will incentivize partially (mostly) breastfeeding food packages for mother–infant dyads. Accordingly, the cost estimates for the revised food package anticipates a 5 percent shift of fully formula-fed dyads to the partially (mostly) breastfed participant categories in the year after full implementation of the food package revisions. The participant shift is assumed to take place in FY2021. The shift is expected to be sustained, but to not recur in FY2022. The difference in food package costs for both FY2021 and FY2022 is due, in part, to the participant shift assumptions.
e Estimates for food package III only include standard issuance food package items for both the current and revised food packages. Costs and cost differences do not account for exempt infant formula or WIC-eligible nutritionals.
f Currently, food package V is issued to both pregnant and partially (mostly) breastfeeding women. To arrive at cost differences, the proportion of food package V recipients categorized as pregnant and partially (mostly) breastfeeding were applied to the estimated costs of food package V for the current food packages to create estimates that could be compared to revised food package V-A and V-B, respectively.
Sources of Cost Differences
Cost Difference of Each Food Package Item
To determine the source(s) of the projected cost savings of the revised food package, the committee evaluated the total costs of each food package item category within the current and revised food packages. The total costs of each of the food items presented in Table U-5 include assumptions about substitutions and allowable options within each category and assumptions about changes in redemption rates (see “Cost Estimate Methodology” for additional details). Across the food package items, the total cost savings are larger than the total added costs, resulting in estimated total cost savings of the revised food packages as compared to the current food packages. Two major sources of cost differences between the current and revised food packages are juice and the CVV. In the current food packages, all women and children are prescribed juice. The reduction of total juice in the revised food packages results in a total phased-in cost savings of approximately $627 million over the course of FY2018 through FY2022, as compared to the current food packages. In contrast, increasing the value of the CVV for all women and children in the revised food package leads to an estimated total phased-in cost increase of approximately $780 million over the course of FY2018 through FY2022.
Major Cost Differences of Food Package Items Within Each Food Package
To further explore the sources of the cost differences, the committee evaluated the total phased-in cost differences of each food package item within each food package. Table U-6 presents each food package item revision that resulted in a total phased-in cost difference of at least $25 million in cost saving or increases over the course of FY2018 through FY2022, as compared to the total cost of the corresponding item in the current food packages. The major total cost differences summarized in the table not only reflect the specific revisions to the items and the quantity prescribed, but also the distribution of participants across the different food packages. Because food package IV-B comprises the largest participant group (approximately 36 percent of food package recipients), relatively small changes lead to more drastic cost differences. For example, the CVV in the revised food package IV-B would increase by $3 per month compared to the current food package,8 leading to an estimated $246 million increase in
__________________
8 Participants do not received adjustments in the CVV until the inflated value inflates crosses a $1 increment. The CVV for food package IV is currently $8 per month. By 2018, it is expected to cross the next $1 increment and be adjusted to $9 per month.
TABLE U-5 Phased-in Total Food Cost and Cost Differences (FY2018 Through FY2022) Between the Current and Revised Food Packages by Food Package Item Category, in Descending Order of Additional Costs
| Food Package Itema | Total Phased-in Food Costs, FY2018 Through FY2022 ($, millions)b | Total Phased-in Cost Difference, FY2018 Through FY2022 ($, millions)c | |
|---|---|---|---|
| Current Food Packages | Revised Food Packages | ||
| Cash value voucher | 1,886.9 | 2,666.4 | +779.5 |
| Canned fish | 51.9 | 165.5 | +113.5 |
| Jarred infant vegetables and fruits | 578 | 659.4 | +81.4 |
| Eggs | 513.5 | 513.6 | +0.2d |
| Infant food meat | 52.1 | 32.6 | −19.4 |
| Breakfast cereal | 1,321.8 | 1,300.0 | −21.7 |
| Infant formula, postrebate | 3,321.2 | 3,279.8 | −41.5d |
| Cheesee | 45.9 | 0 | −45.9 |
| Infant cereal | 142.6 | 64.4 | −78.1 |
| Milk | 3,747.7 | 3,662.2 | −85.5 |
| Legumes and peanut butter | 410.4 | 286.9 | −123.6 |
| Whole wheat bread | 559.5 | 406.9 | −152.6 |
| Juice | 1,251.6 | 625.0 | −626.6 |
NOTES: Phased-in estimates assume full implementation of the proposed revisions in state agencies serving one-third of all WIC participants as of April 1, 2018. All other state agencies are assumed to implement the proposed revisions as of FY2020.
a Broadly describes the food package item category. Cost differences include assumptions about substitutions and selection of allowable options within each category.
b Calculated by summing the food cost of each specific food package item from FY2018 through FY2022. To account for the phased-in implementation, the food costs for FY2018 and FY2019 are one-third the estimated unadjusted food costs. Phased-in and unadjusted food costs are identical for FY2020 through FY2022. The estimated phased-in total food costs reflect assumptions about redemption, substitutions, prices, and program participation.
c Cost differences were calculated by subtracting the estimated phased-in food costs for the current food packages from the estimated food costs for the revised food packages. Negative values (−) indicate that the revised food packages result in cost savings as compared to the current food packages. Positive values (+) indicate that the revised food packages result in cost increases as compared to the current food packages. Row totals may not be exact owing to independent rounding.
d This analysis assumes the proposed revisions will incentivize partially (mostly) breastfeeding food packages for mother–infant dyads. Accordingly, the cost estimates for the revised food package anticipates a 5 percent shift of fully formula-fed dyads to the partially (mostly) breastfed participant categories in the year after full implementation of the food package revisions. The participant shift is assumed to take place in FY2021. The shift is expected to be sustained, but to not recur in FY2022. The projected cost difference is attributed solely to this shift, rather than revisions to the food item in the food package.
e Describes the total food cost and cost difference of cheese as a separate food package category for food package VII. The costs associated with cheese as a substitution option for fluid milk is incorporated into the estimates for the milk category.
TABLE U-6 Revisions to Food Package Items That Lead to Major Total Phased-in Cost Differences from FY2018 Through FY2022, by Food Package
| Food Package | Food Package Revision | Total Phased-In Cost Difference, FY2018 Through FY2022 ($, millions)a |
|---|---|---|
| I |
|
— |
| II |
|
+69 |
|
−71 | |
| III |
|
— |
| IV-A |
|
+107 |
|
+27 | |
|
−45 | |
|
−52 | |
|
−116 | |
| IV-B |
|
+246 |
|
+62 | |
|
−47 | |
|
−119 | |
|
−264 | |
| V-A |
|
+129 |
|
−29 | |
|
−37 | |
|
−84 | |
| V-B |
|
+26 |
| VI |
|
+65 |
|
−109 | |
| VII |
|
+200 |
|
−46 |
NOTES: The committee defined a major total cost difference as a revision within a specific food package resulting in a total phased-in cost difference of at least $25 million over the course of FY2018 through FY2022. The major total cost differences not only reflect the specific revisions to the items and the quantity prescribed, but also the distribution of participants across the different food packages. Food packages that represent a smaller proportion of WIC participants generally have fewer major cost differences. Not all savings and costs are reflected in the table.
a Phased-in estimates assume full implementation of the proposed revisions in state agencies serving one-third of all WIC participants as of April 1, 2018. All other state agencies are assumed to implement the proposed revisions as of FY2020. Cost differences were calculated by subtracting the estimated cost for the current food package item from the estimated costs corresponding to the food item in the revised food package. Negative values (−) indicate that the revised food packages result in cost savings compared to the current food packages. Positive values (+) indicate that the revised food packages result in cost increases compared to the current food packages.
b This analysis assumes the incentives in the proposed revisions will result in a 5 percent shift of fully formula-fed mother–infant dyads to the partially (mostly) breastfed participant categories in the year after full implementation of the food package revisions across the entire WIC program under the phased-in assumption. The total amount of formula prescribed in the revised food packages I and II is expected to decrease because of this shift in participants. For food package I, the total cost difference for FY2018 through FY2022 is expected to result in $22.5 million in savings.
c Because food package III recipients comprise a small proportion of food package recipients, all food package revisions resulted in total phased-in cost differences of less than $25 million over the course of FY2018 through FY2022.
d The estimated cost differences for milk includes assumptions about the proportion of participants purchasing fluid milk (e.g., whole milk, 2%), milk alternatives (e.g., lactose-free milk, soy-based beverage), and substitutions (e.g., cheese, yogurt).
e The estimated cost difference for whole wheat bread includes assumptions about the proportion of participants purchasing options available under the current food packages and proposed revisions (e.g., corn tortillas, instant oatmeal).
f The proposed revisions remove cheese as a separate food package category prescribed to food package VII participants. Cheese remains as substitution option for milk across all children’s and women’s food packages.
estimated total phased-in costs, as compared to the current food package. In contrast, the CVV for fully breastfeeding women (food package VII)—who comprise approximately 3 percent of food package recipients—would increase by $24 per month in the revised food packages, and would only lead to an estimated $200 million increase in estimated phased-in costs.
Cost Differences of Food Package Items Over Time
The preceding sections broadly evaluate the cost implications of each food package item, summed across all projected years. As presented in Table U-7, the phased-in costs differences are not static over the course of FY2018 through FY2022 and reflect assumptions of the analysis. Cost differences in FY2018 and FY2019 are markedly lower than in subsequent years, for example, because they reflect the phased-in implementation of the revised food package. The values for these 2 years are one-third of the unadjusted value. The cost differences for FY2018 are further reduced, because the values only encompass a 6-month period.
TABLE U-7 Phased-in Cost Differences Between the Current and Revised Food Packages by Food Package Item Category, by Fiscal Year
| Food Package Itema | Phased-in Cost Differences of the Revised Food Packages Compared to Current Food Packages ($, millions)b | ||||
|---|---|---|---|---|---|
| FY2018c,d | FY2019d | FY2020 | FY2021 | FY2022 | |
| Cash value voucher | +36.5 | +73.9 | +224.1 | +229.7 | +215.2 |
| Canned fish | +5.0 | +10.3 | +31.6 | +32.9 | +33.7 |
| Jarred infant vegetables and fruits | +3.6 | +7.5 | +22.9 | +23.4 | +24 |
| Eggs | 0 | 0 | 0 | +0.1 | +0.1 |
| Infant food meat | −0.9 | −1.8 | −5.5 | −5.6 | −5.7 |
| Breakfast cereal | −1.0 | −2.0 | −6.2 | −6.2 | −6.3 |
| Infant formula, postrebate | 0 | 0 | 0 | −20.5 | −21.0 |
| Cheesee | −2.0 | −4.2 | −12.9 | −13.2 | −13.5 |
| Infant cereal | −3.5 | −7.2 | −22.0 | −22.5 | −23.0 |
| Milk | −3.9 | −8.1 | −24.7 | −24.1 | −24.7 |
| Legumes and peanut butter | −5.5 | −11.3 | −34.8 | −35.6 | −36.4 |
| Whole wheat bread | −6.8 | −14.1 | −43.4 | −43.6 | −44.6 |
| Juice | −27.9 | −57.7 | −176.9 | −179.9 | −184.2 |
NOTES: Phased-in estimates assume full implementation of the proposed revisions in state agencies serving one-third of all WIC participants as of April 1, 2018. All other state agencies are assumed to implement the proposed revisions as of FY2020.
a Broadly describes the food package item category. Cost differences include assumptions about substitutions and selection of allowable options within each category.
b Cost differences were calculated by subtracting the estimated phased-in food cost for each item in the current food packages from the estimated food costs of the corresponding item in the revised food packages. Negative values (−) indicate that the revised food packages result in cost savings as compared to the current food packages. Positive values (+) indicate that the revised food packages result in cost increases as compared to the current food packages.
c This analysis assumes the earliest date of implementation of the proposed changes would be April 1, 2018. Accordingly all estimates for FY2018 only encompass a 6-month period.
d Phased-in cost differences in FY2018 and FY2019 are 33.3 percent of the unadjusted cost differences.
e Describes the cost difference of cheese as a separate food package category for food package VII. The costs associated with cheese as a substitution option for fluid milk is incorporated into the estimates for the milk category.
Some of the variations in cost differences over time are solely due to assumptions regarding participation. In FY2021 and FY2022, infant formula is projected to cost less and eggs are projected to cost slightly more in the revised food packages as compared to the current food packages. The analysis does not assume changes in quantities or percent redeemed between the current and revised food packages for either food package item. Instead, the cost differences result from the 5 percent shift in fully formula-fed mother–infant dyads to partially (mostly) breastfeeding food packages that the committee projects to take place in FY2020 for the revised food packages. The slight increase in egg costs in the revised food packages is attributed to the women shifting from being classified as partially (minimally) breastfeeding at more than 6-months postpartum (i.e., receiving food package N/A) to partially (mostly) breastfeeding (i.e., receiving the revised food package V-B).
Most of the projected variations in cost differences over time are the result of a complex interplay among several factors. The CVV serves as a prime example. The proposed revisions add value to the CVV across all food packages for women and children. In FY2020 and FY2022, the CVV for women in the revised food package VII is projected to be adjusted for inflation by $1, increasing to $36 and $37 per month, respectively. Similarly, an inflation adjustment of $1 is projected for the revised food package V-B (for partially [mostly] breastfeeding women), increasing the CVV to $26 per month. Also during FY2021, the committee anticipates a 5 percent shift of fully formula-fed dyads to partially (mostly) breastfed food packages, which would shift a portion of postpartum women to the larger CVV in the revised food package V-B (as compared to the revised food package VI CVV). These adjustments and assumptions in the revised food packages do not have a dramatic effect on total cost differences because participants in food packages VII and V-B make up a small proportion of the total WIC population. In FY2022, however, the trajectory of the cost difference for the CVV changes, decreasing from +$230 million in FY2021 to +$215 million in FY2022. This is the result of a $1 inflation adjustment that is projected to affect all food packages for women in the current food packages. Although the revised CVV values result in positive cost differences (i.e., cost increases) as compared to the CVV values in the current food packages for each fiscal year assessed, the difference across the years is not consistent. Assumptions regarding the CVV are detailed in the “Cost Effect Methodology” section that follows. Alternative assumptions and their effects on total cost differences are tested in the “Uncertainty” section later in this appendix.
Cost Estimate Methodology
This analysis projects costs of each food package in the current and revised sets of food packages through FY2022. The committee estimated
the monthly costs of a food package by multiplying the projected number of recipients of the package, the average proportion of each food package item projected to be redeemed, and the estimated prices of each item in the food package and then summing these values within the food package. This process was repeated for each food package. Monthly costs were multiplied by 12 to arrive at annual estimates for each fiscal year in the analysis (FY20189 through FY2022). The sections that follow detail how the committee projected participation, redemption, and prices.
The presented estimates only encompass the cost of supplemental foods to the state agency. Administrative costs are not included. Although state and local WIC providers will likely incur additional administrative burden associated with the proposed revisions initially, such as updating their Management Information Systems and retraining staff, the committee was not in a position to quantify the costs of such changes.
Participation
The WIC Participation and Program Characteristics 2014: Food Package Report (USDA/FNS, 2016a) and average participation by participant category from administrative data posted on FNS’s website10 (USDA/FNS, 2016b) both describe WIC program participation by food package. While each provides a slightly different portrait of participation, neither directly provides the number of individuals who claim each specific food package type (outlined in Table U-1). The committee used both data sources to estimate the average number of participants who are actually issued a food instrument each month.
The 2014 Food Package Report is the only data source that provides insight into the distribution11 of participants across the 27 specific types of food packages. While the data used for the Food Package Report are the most comprehensive available on the topic of specific food package assignments, there are limitations including, but are not limited to:
- The dataset captured all individuals certified to receive benefits during the month of April of the assessment year, regardless of whether the food benefits were claimed. The total number of participants in the Food Package Report’s analyses, therefore, is higher than average monthly participation counts derived from other sources
__________________
9 FY2018 in this analysis only encompasses 6 months. As such, monthly estimates were multiplied by 6 rather than 12.
10 Administrative data includes all state agencies, Indian Tribal Organizations, and territories.
11 Throughout this appendix, the phrase “food package distributions” or simply “distributions” refers to the proportions of a WIC participant group assigned specific food packages. It does not refer to the physical distribution or claiming of the food benefit.
- The food package type variable in the dataset is still considered to be in the testing phase. Because of this, the Food Package Report notes: “Findings should be treated as suggestive rather than definitive” (USDA/FNS, 2016a).
- The dataset only includes WIC participants in Puerto Rico; Washington, DC; and 48 states.12 Louisiana and New Mexico did not provide information on specific food package assigned to participants. Furthermore, other territories and Indian Tribal Organizations were not included in the dataset. As such, the distributions of the food packages within the participant categories approximates, but may not necessarily represent, that which exists across all participating agencies.
- The dataset had variable levels of missing data. The Food Package Report notes that “the information provided by state agencies on food package types is not entirely complete or reliable” (USDA/FNS, 2016a).
- In the data received from states, participants were recorded as being part of one of five certification categories: pregnant women, breastfeeding women, postpartum women, infants, and children. The breastfeeding category encompasses fully breastfeeding women (intended to be food package VII); partially (mostly) breastfeeding women up to 1-year postpartum (intended to be food package V); partially (minimally) breastfeeding women up to 6-months postpartum (intended to be food package VI); and partially (minimally) breastfeeding women, 6- to 12-months postpartum (no food package). In the analyses performed in the Food Package Report, the breastfeeding certification category was separated into fully and partially breastfeeding women by dichotomizing the participants based on prescription of food package VII. Food package VII, however, can also be assigned to women pregnant with or partially (mostly) breastfeeding multiples, so this approach to subgrouping can only closely approximate the number of fully breastfeeding women in the dataset. Furthermore, partially (minimally) breastfeeding women more than 6-months postpartum are eligible for WIC services but do not receive a food package. Agencies differed in their approach to reporting the food package associated with these participants. Some reported a null food package (food package “N/A”) while most did not report a food package.
of administrative data, which generally reflect those that claimed benefits from the WIC agency.
__________________
12 This statement specifically pertains to Table C.1 in the Food Package Report, “Food Packages Assigned by Participant Category (2014).”
- Some participant categories appeared to be assigned discordant food packages. A small fraction of participants were reportedly assigned a food package that did not correspond with their participant category (e.g., an infant receiving food package IV-A). Some of the discrepancy is attributed to how age was calculated in the dataset (e.g., an infant aged into the children’s food package during the month of April may still be counted as an infant). Another potential source of the discrepancies is that agencies may prescribe an updated food package without recertifying the participant when their status changes. Women, for example, may take up to 6-weeks postpartum to recertify based on breastfeeding status. During this period, such women would continue to receive the prenatal food package V despite being postpartum.
The distributions presented in the 2014 Food Package Report were applied to the average monthly national participation for FY2015, to arrive at participation estimates that reflect individuals issued food benefits in a given month. Because the Food Package Report and administrative data posted on FNS’s website assess participation levels differently, the following adjustments and assumptions were made:
- The data used in the 2014 Food Package Report are collected on a biennial basis, and are the most current portrait of specific food package prescription distributions. The committee presumed that the food package distributions would not be substantially different between FY2014 and FY2015.
- Due to rounding, not all food package distributions within each participant category presented in the 2014 Food Package Report summed to 100 percent. To account for this in the RIA, the following was done:
- Specific food packages assigned “<0.1 percent” were set to zero for pregnant women, partially breastfeeding women, infants, and children, as the distributions within each of the participant categories summed to 100 percent without accounting for such values.
- The three food package types assigned a “<0.1 percent” for postpartum women were replaced with a value of 0.03 percent, so the distribution for the participant category summed to 100 percent rather than 99.9 percent.
- All values ≥0.1 percent in the infant participant category were divided by 1.001 to scale the distribution for the participant category to 100 percent rather than 100.1 percent.
- The percent of a participant group assigned a “Missing” food package type in the Food Package Report was assumed to represent
- The Food Package Report includes a null food package (“N/A”) which is noted to be assigned to minimally breastfeeding women more than 6-months postpartum who do not receive food benefits but still participate in WIC. According to FNS, this type of WIC participant is captured in the administrative dataset. Because the goal of this analysis is to assess costs related to the food benefit, participants assigned the “N/A” food package were not included in the cost profiles for the current food package (see “Cost Estimate Methodology” for additional details). The final participant count used in this RIA is therefore slightly lower than the total average participation derived from the administrative data.
- Discordance between the food package and the participant category were largely disregarded for the purposes of this analysis, since the primary goal was to determine the number of participants prescribed as specific food package. However, assumptions had to be made for food package V. In the Food Package Report, more than 1 percent of women in the postpartum participant category were assigned food package V, which is intended for pregnant and partially (mostly) breastfeeding women. It was presumed that these participants were women who had given birth within the previous 6 weeks and were still receiving the prenatal food package, and would therefore receive food package V-A (pregnant) in the revised food package structure. This assumption had minimal effect on
certified WIC participants who did not claim benefits in a given month. This type of participant is represented in the Food Package Report dataset, but not in the administrative totals presented on FNS’s website. To arrive at food package distributions representing only participants claiming their food instrument, the percent assigned “Missing” were removed from each participant category, and the remaining food package distributions were scaled to 100 percent within each participant category. Scaled distributions were then applied to the FY2015 administrative participation data, by participant category. This assumption has implications particularly for the partially breastfeeding women participant category. Since not all states used a null food package (“N/A”) to report on partially (minimally) breastfeeding women more than 6-months postpartum (i.e., a participant group that does not receive a food instrument), the slightly higher rate of missing food package assignments for the partially breastfeeding woman participant category could be due to this subgroup being inadequately captured in the data. The extent to which this occurred, however, could not be determined or accounted for in this analysis.
overall cost, as postpartum women represented less than 1 percent of participants receiving food package V.
The integration of the 2014 Food Package Report and average participation by category from FNS administrative data allowed the committee to estimate the number of participants actively being issued each of the specific food packages in FY2015. This served as the base for both the current and proposed cost estimates.
Estimating participation for FY2018 through FY2022 The forecasted levels of WIC participation through FY2022 are an extrapolation of FY2015 WIC participation levels based on the relationship between WIC participation and the general economy. During and following the economic recession of 2008–2009, WIC participation grew. As that recession waned, WIC participation declined. As the general economy is forecasted to moderately improve and then stabilize, the committee expects that WIC participation levels will decrease initially, then slightly increase and stabilize through FY2022.
To extrapolate WIC participation into the future, the committee quantified the relationship between WIC participation levels and economic conditions, using regression analysis. The number of unemployed persons served as a measure of economic conditions. Regression analysis showed a strong correlation between the number of unemployed persons and WIC participation. This correlation was used to predict WIC participation based on the Federal Reserve’s forecast of unemployment rates and the Bureau of Labor Statistics’s forecast of the civilian labor force (BLS, 2013). Based on these data and the relationship between WIC participation and unemployment, the committee forecasts WIC participation to decline by 2.2 percent between FY2015 and FY2018. From FY2018 to FY2022, the committee forecasts WIC participation to increase by 1.5 percent. The FY2022 participation levels are forecasted to be 0.7 percent lower than the FY2015 levels. The relative changes in participation used in this RIA are summarized in Table U-8. The committee assumed the relative change would be experienced the same across all participant categories. Projected participation for the current food packages, by food package type, is presented in Table U-9. These values served as the participant multipliers for estimating costs of the current food packages.
Anticipating a Shift in Fully Formula-Fed Mother–Infant Dyads Under the Proposed Revisions
Participation projections are identical between the current and proposed revised food packages, with one exception. The committee anticipates the
TABLE U-8 Forecasted Relative Change in Total Participation
| Fiscal Year | Relative Change in Participationa |
|---|---|
| 2016b | −1.1% |
| 2017b | −0.9% |
| 2018 | −0.2% |
| 2019 | 1.2% |
| 2020 | 0.1% |
| 2021 | 0.1% |
| 2022 | 0.1% |
NOTES: The base year of this analysis is FY2015. The committee estimated FY2015 participation from the 2014 Food Packages Report and 2015 average annual program participation from data posted on FNS’s website (USDA/FNS, 2016a,b).
a The relative change describes the percent by which total participation increased or decreased, relative to the total participation in the preceding fiscal year. Total participation in FY2016, for example, was projected to be 1.1 percent lower than total participation in FY2015.
b Year not included in the cost estimates presented in this RIA, but it was necessary to arrive at total participation projections for FY2018 through FY2022.
proposed revision to the categorization of partial (mostly) breastfeeding dyads in the first month will result in a shift of 5 percent of formula-fed infants (food packages I-FF-A, I-FF-B, and II-FF), 5 percent of postpartum and partially (minimally) breastfeeding women less than 6-months postpartum (food package VI recipients), and 5 percent of women classified as receiving the N/A food package to their respective partially (mostly) breastfeeding categories. The shift of women assigned the food package N/A to V-B slightly increases the total number of participants issued food benefits under the proposed revisions, as compared to the projections for the current food packages. The 5-percent shift was selected based on data presented in USDA/FNS (2011) that indicated the 2009 food package resulted in an approximately 8 to 11 percent shift of women out of the partially breastfeeding food package. The shifts were largely due to the fully formula-feeding food packages. The 5 percent value used in this analysis was therefore considered a conservative estimate for the number of participants that would shift back to the partially (mostly) breastfeeding category. The committee anticipates that the shift will take place after all the revisions have been implemented in all states and will be sustained but not recur in subsequent years. Accordingly, the shift has been incorporated in FY2021 participation estimates, which corresponds to the year after full implementation under the phased-in assumption. Projected participation under the proposed revisions by specific food package is presented in
Table U-10. These values served as the participant multipliers for estimating food package costs under the proposed revisions.
Redemption
Three sources of data were used to estimate and project redemption for each item in the current and revised food packages: (1) anonymized redemption data provided by FNS (hereafter referenced as the FNS redemption dataset), (2) redemption data provided by six individual WIC agencies, and (3) a 2014 Altarum report detailing redemption in Kentucky, Michigan, and Nevada as they transitioned to EBT (USDA/ERS, 2014).
Redemption data provided by FNS USDA-FNS provided the committee with 12 months (August 2013 through July 2014) of WIC redemption data from a convenience sample of 6 WIC state agencies, representing five of the seven regions of the country (the FNS redemption dataset). The identities of the states were not known to the committee. The states were diverse in terms of size and did not include Indian Tribal Organizations or territories.13
For each state, each month’s worth of data included the following information: a description of the main food package item category (e.g., “legume”); the subcategory of food (e.g., “canned beans,” “dry beans”); size and measure of the container purchased (e.g., 16 ounces); number of containers redeemed; average price for the container; and the total amount paid by WIC for that specific item (see the “Prices” section for use of the cost data). Because states agencies varied in their reporting approach—some providing specific descriptions of the items purchased (e.g., “soft corn tortilla”), while others only provided general descriptions (e.g., “whole grains, all types”)—redemption estimates collectively describe the main food package item category, rather than individual food items. To arrive at redemption estimates from the FNS redemption dataset, the following steps were taken for each state:
- The number of units purchased in a given month was standardized by multiplying the container size by the number of containers redeemed, summing the total amount purchased across the various container sizes, and, where applicable, dividing by a food package-appropriate unit size. For example, ounces of fish purchased in the month was determined across all container sizes (3.75 to 20 ounces), summed, and divided by 30 to arrive at number of 30-ounce units purchased.
__________________
13 As characterized by USDA-FNS.
TABLE U-9 Projected Participation by Food Package Type, Current Food Packages
| Participant Category | Specific Food Package | Projected Participation | ||||
|---|---|---|---|---|---|---|
| FY2018 | FY2019 | FY2020 | FY2021 | FY2022 | ||
| Infants, 0 to less than 6 months | ||||||
| 0 less than 1 month infants | ||||||
| Partially (mostly) breastfed | I-BF/FF-A | 17,659 | 17,871 | 17,889 | 17,906 | 17,924 |
| 0 less than 4 months infants | ||||||
| Fully breastfed | I-BF-A | 64,749 | 65,526 | 65,591 | 65,657 | 65,723 |
| Fully formula-fed | I-FF-A | 333,554 | 337,557 | 337,895 | 338,232 | 338,571 |
| 1 to less than 4 months infants | ||||||
| Partially (mostly) breastfed | I-BF/FF-B | 66,711 | 67,511 | 67,579 | 67,646 | 67,714 |
| 4 to less than 6 months infants | ||||||
| Fully breastfed | I-BF-B | 31,393 | 31,770 | 31,802 | 31,834 | 31,865 |
| Partially (mostly) breastfed | I-BF/FF-C | 47,090 | 47,655 | 47,703 | 47,750 | 47,798 |
| Fully formula-fed | I-FF-B | 204,057 | 206,505 | 206,712 | 206,919 | 207,126 |
| Subtotal | 765,213 | 774,395 | 775,170 | 775,945 | 776,721 | |
| Infants, 6 to less than 12 months | ||||||
| Fully breastfed | II-BF | 111,839 | 113,181 | 113,294 | 113,407 | 113,521 |
| Partially (mostly) breastfed | II-BF/FF | 105,953 | 107,224 | 107,331 | 107,439 | 107,546 |
| Fully formula-fed | II-FF | 694,815 | 703,153 | 703,856 | 704,560 | 705,264 |
| Subtotal | 912,606 | 923,558 | 924,481 | 925,406 | 926,331 | |
| Participants with qualifying conditions | ||||||
| Infants | Alla | 184,436 | 186,649 | 186,836 | 187,023 | 187,210 |
| Children | ||||||
| 1 to less than 2 years | IV-A | 1,229,645 | 1,244,401 | 1,245,646 | 1,246,891 | 1,248,138 |
| 2 to less than 5 years | IV-B | 2,813,121 | 2,846,878 | 2,849,725 | 2,852,575 | 2,855,427 |
| Subtotal | 4,042,766 | 4,091,279 | 4,095,371 | 4,099,466 | 4,103,566 | |
| Women | ||||||
| Pregnant | V | 744,902 | 753,841 | 754,595 | 755,350 | 756,105 |
| Partially (mostly) breastfeeding | V | 129,145 | 130,695 | 130,826 | 130,957 | 131,088 |
| Subtotal | 874,048 | 884,536 | 885,421 | 886,306 | 887,193 | |
| Postpartum and partially (minimally) breastfeeding, <6-months postpartum | VI | 685,082 | 693,303 | 693,996 | 694,690 | 695,385 |
| Fully breastfeeding | VII | 256,034 | 259,106 | 259,365 | 259,625 | 259,884 |
| Partially (minimally) breastfeeding, >6-months postpartum | N/Ab | 64,768 | 65,545 | 65,610 | 65,676 | 65,742 |
| Totalc | 7,783,566 | 7,876,969 | 7,884,846 | 7,892,731 | 7,900,623 | |
NOTES: Participation was regressed on unemployment from the U.S. Bureau of Labor Statistics, and projections were based on projected unemployment from the Federal Reserve.
a Food package III recipients are prescribed food packages appropriate for their age and physiological state. There are specific food packages within food package III for women, infants, and children that correspond to specific food packages I, II, IV, V, VI, and VII.
b Women who are minimally breastfeeding and with infants more than 6 months of age that receive more formula than is allowed for a partially breastfed infant do not receive a food benefit. These women, however, are eligible to continue to receive other benefits through WIC, such as breastfeeding support, nutrition education, and health and social services referrals (USDA/FNS, 2013a). This group of participants is included in one of the committee’s assumption regarding the revised food package cost estimates, and is therefore included in the above table.
c Total number of food package recipients does not include women assigned food package N/A.
TABLE U-10 Projected Participation Under the Proposed Revisions, by Food Package Type
| Participant Category | Food Package Type | Projected Participation | ||||
|---|---|---|---|---|---|---|
| FY2018 | FY2019 | FY2020 | FY2021a | FY2022 | ||
| Infants, 0 to less than 6 months | ||||||
| 0 to less than 1 month infants | ||||||
| Partially (mostly) breastfed | I-BF/FF-A | 17,659 | 17,871 | 17,889 | 21,446 | 21,468 |
| 0 to less than 4 months infants | ||||||
| Fully breastfed | I-BF-A | 64,749 | 65,526 | 65,591 | 65,657 | 65,723 |
| Fully formula-fed | I-FF-A | 333,554 | 337,557 | 337,895 | 321,321 | 321,642 |
| 1 to less than 4 months infants | ||||||
| Partially (mostly) breastfed | I-BF/FF-B | 66,711 | 67,511 | 67,579 | 81,018 | 81,099 |
| 4 to less than 6 months infants | ||||||
| Fully breastfed | I-BF-B | 31,393 | 31,770 | 31,802 | 31,834 | 31,865 |
| Partially (mostly) breastfed | I-BF/FF-C | 47,090 | 47,655 | 47,703 | 58,096 | 58,154 |
| Fully formula-fed | I-FF-B | 204,057 | 206,505 | 206,712 | 196,573 | 196,769 |
| Subtotal | 765,213 | 774,395 | 775,170 | 775,945 | 776,721 | |
| Infants, 6 to less than 12 months | ||||||
| Fully breastfed | II-BF | 111,839 | 113,181 | 113,294 | 113,407 | 113,521 |
| Partially (mostly) breastfed | II-BF/FF | 105,953 | 107,224 | 107,331 | 142,667 | 142,809 |
| Fully formula-fed | II-FF | 694,815 | 703,153 | 703,856 | 669,332 | 670,001 |
| Subtotal | 912,606 | 923,558 | 924,481 | 925,406 | 926,331 | |
| Participants with qualifying conditions | ||||||
| Infants | Allb | 184,436 | 186,649 | 186,836 | 187,023 | 187,210 |
| Children | Allb | 62,184 | 62,930 | 62,993 | 63,056 | 63,119 |
| Women | Allb | 1,197 | 1,211 | 1,213 | 1,214 | 1,215 |
| Subtotal | 247,817 | 250,791 | 251,042 | 251,293 | 251,544 | |
| Children, 1 to up to 5 years | ||||||
| 1 to less than 2 years | IV-A | 1,229,645 | 1,244,401 | 1,245,646 | 1,246,891 | 1,248,138 |
| 2 to less than 5 years | IV-B | 2,813,121 | 2,846,878 | 2,849,725 | 2,852,575 | 2,855,427 |
| Subtotal | 4,042,766 | 4,091,279 | 4,095,371 | 4,099,466 | 4,103,566 | |
| Women | ||||||
| Pregnant | V-A | 744,902 | 753,841 | 754,595 | 755,350 | 756,105 |
| Partially (mostly) breastfeeding | V-B | 129,145 | 130,695 | 130,826 | 168,975 | 169,144 |
| Postpartum and partially (minimally) breastfeeding, <6-months postpartum | VI | 685,082 | 693,303 | 693,996 | 659,956 | 660,616 |
| Fully breastfeeding | VII | 256,034 | 259,106 | 259,365 | 259,625 | 259,884 |
| Partially (minimally) breastfeeding, >6-months postpartum | N/Ac | 64,768 | 65,545 | 65,610 | 62,392 | 62,455 |
| Totald | 7,783,566 | 7,876,969 | 7,884,846 | 7,896,015 | 7,903,911 | |
NOTES: Participation was regressed on unemployment from the U.S. Bureau of Labor Statistics, and projections were based on projected unemployment from the Federal Reserve.
a This analysis assumes the proposed revisions will incentivize partially (mostly) breastfeeding food packages for mother–infant dyads. Accordingly, the participation projections for the revised food package anticipates a 5 percent shift of fully formula-fed dyads to the partially (mostly) breastfed participant categories in the year after full implementation of the food package revisions. The participant shift is assumed to take place in FY2021. The shift is expected to be sustained, but to not recur in FY2022.
b Food package III recipients are prescribed food packages appropriate to their age and physiological state. There are specific food packages for women, infants, and children within food package III that correspond to specific food packages I, II, IV, V, VI, and VII.
c Women who are minimally breastfeeding and with infants more than 6 months of age that receive more formula than is allowed for a partially breastfed infant do not receive a food benefit. These women, however, are eligible to continue to receive other benefits through WIC, such as breastfeeding support, nutrition education, and health and social services referrals (USDA/FNS, 2013a). The anticipated shift in fully formula-fed dyads to the partially (mostly) breastfeeding categories includes women who are more than 6-months postpartum. Accordingly, 5 percent of women who did not qualify for a food package under the current food packages are anticipated to qualify for food package V-B under the proposed revisions.
d Total number of food package recipients does not include women assigned food package N/A.
- The number of standardized units purchased in a given month was then averaged across the 12 months for each food package item category.
- The average number of standardized units purchased in a month was divided by the number of participants expected to receive the food item and accounted for differences in monthly maximum allowances by food package (e.g., the equation used to estimate juice redemption accounted for the different maximum amounts prescribed children and the various food packages for women). To keep the identity of the state agencies anonymous, FNS inputted average monthly participation by participant category for each state into a spreadsheet that contained the redemption equations created by the committee, and returned the overall unweighted average redemption across the state agencies per food package item.14 Through this process, FNS identified one of the six states as a clear outlier, and removed it from the averages (personal communication, K. Castellanos-Brown, USDA-FNS, June 22, 2016). As such, redemption estimates are calculated from five of the six state agency datasets provided by FNS.
Redemption estimates based on the FNS data have both strengths and limitations for the purposes of estimating and projecting costs associated with the food benefit. One of the strengths is that the data reflect actual purchases made by WIC participants with their food instrument. The data capture the range of container sizes that participants chose to purchase, and also include state-specific options for substitutions. Using redemption data, rather than making assumptions based on average quantity prescribed to participants, has the potential to better reflect the actual food costs. Limitations of the existing data, however, affect generalizability. The data only provide insight into the total number of units purchased in a given month or over the course of the year and were not currently reported in a way that could be used to see how redemption differed across specific food packages when an item was not unique to a single food package (e.g., breakfast cereal redemption may not be the same for children as it is for women). Furthermore, the FNS data could also not be used to arrive at redemption estimates for certain food package items. Redemption of milk and cheese, for example, could not be determined because cheese is offered not only as a separate food item provided in food package VII, but also as a substitution option for milk across children’s and women’s food packages. The data also predated the authorization of yogurt as a milk substitution option.
__________________
14 The committee was provided with unweighted averages to preserve the anonymity of the states included in the FNS dataset.
Redemption data provided by individual state agencies From the data provided by FNS, the committee was able to estimate redemption for most of the standard items prescribed to children and women. Some redemption of estimates, however, could not be determined. In these instances, publicly available redemption data from individual state agencies were averaged and used in the analysis. The six agencies that provided redemption data included California (February 2015 through February 2016), the Chickasaw Nation (April 2015 through March 2016), Kentucky (November 2014 through May 2015), Massachusetts (March through August 2015), Texas (July and August 2015), and Wyoming (May 2015). Not all of the state agencies provided redemption estimates for all food items. Although the redemption estimates derived from these sources were WIC-specific, they were relatively limited in scope and not necessarily representative of WIC participants nationally.
Calculating Redemption for Current and Revised Food Package Items
The redemption rates derived from the data provided by FNS and the data provided by individual state agencies were applied to the current food packages and served as the base for the redemption projections under the proposed revised food packages. The committee used a 2014 report from Altarum (USDA/ERS, 2014), which provided insight into three types of redemption practices (full-, partial-, and nonredemption) to develop data-based assumptions for the redemption behaviors in the revised food packages (detailed in Appendix R). Redemption estimates that were based only on assumptions about full-, partial-, and nonredemption were considered “implied redemption rates.” Implied redemption rates, however, do not account for behavioral changes, such as those that might result from the offering of new substitution options. Accordingly, the committee made slight adjustments to account for such changes. Table U-11 outlines the redemption rates applied to the current and revised food packages.
Applying redemption rates to the food packages The committee applied the calculated and projected redemption rates to the current and proposed monthly maximum allowances) for all food packages. Tables U-12 and U-13 summarize the estimated average amount redeemed for each food item for the current and revised food packages, respectively. The projected average amounts redeemed for each food package item serves as the quantity multipliers used in the estimation of total food costs.
TABLE U-11 Redemption Estimates and Projections for Food Package Items for Current and Revised Food Packages
| Food Package Item | Current Food Packages | Revised Food Packages | |||
|---|---|---|---|---|---|
| Redemption Rate | Applicable Food Packages Type | Redemption Rate | Applicable Food Packages | Rationale for Revised Redemption Projection | |
| Breakfast cereal | 60a | IV-A, IV-B, V, VI, VII | 54 | IV-A, IV-B, V-A, V-B, VI, VII | 10% (6 percentage point) decrease because state-level redemption data indicate that whole grain cereals are less preferred in some states and the number of options in the revised packages are reduced. |
| Cash value voucher | 77a | IV-A, IV-B, V, VI, VII | 75 | IV-A, IV-B, V-A, V-B, VI, VII | Slightly decreased because additional voucher value may not be redeemed at the same rate; projected redemption also accounts for time costs of preparation of vegetables and fruits. |
| Cheeseb | 70c | VII | NA | NA | Cheese, as its own food package item, has been removed under the proposed revisions. |
| Eggs | 80a | IV-A, IV-B, V, VI, VII | 80 | IV-A, IV-B, V-A, V-B, VI, VII | No change. |
| Fish | 69a NA | VII IV-A, IV-B, V, VI | 68 | IV-A, IV-B, V-A, V-B, VI, VII | Projected value is the implied redemption rate.d |
| Formula | 94e | I-BF/FF-A, I-BF/FF-B, I-BF/FF-C, I-FF-A, I-FF-B, II-BF/FF, II-FF | 94 | I-BF/FF-A, I-BF/FF-B, I-BF/FF-C, I-FF-A, I-FF-B, II-BF/FF, II-FF | No change. |
| Infant cereal | 47f | II-BF, II-BF/FF, II-FF | 57g,h | II-BF, II-BF/FF, II-FF | Increased because the amount prescribed is reduced and the amount provided in the current food packages exceeded recommended amounts. |
| Infant food vegetables and fruits | 51f | II-BF, II-BF/FF, II-FF | 65h,i | II-BF, II-BF/FF, II-FF | Increased because of the added CVV substitution option. |
| Infant food meat | 31c | II-BF | 43g,h | II-BF | Increased because the amount prescribed is reduced and the substitution option of canned fish is added. |
| Juice | 70a | IV-A, IV-B, V, VI, VII | 78g,j 79g,j | IV-A, IV-B V-A, V-B, VII | Increased because the amount prescribed is reduced and individuals who prefer the CVV substitution will shift to that option (i.e., individuals who prefer juice will be issued and redeem juice). |
| NA | VI | Juice is removed from food package VI under the proposed revisions. | |||
| Legumes and peanut butter | 51a | IV-A, IV-B, V, VI, VII | 53g,j | IV-A, IV-B, V-A, V-B, VI, VII | Increased redemption because of the additional options (canned legumes) and reduced amounts. |
| Milk | 75k | IV-A | 87 | IV-A | Used the implied redemption rate;d public comments and redemption indicate that whole milk is a preferred food, so do not anticipate full yogurt substitution. |
| 71c 56c | IV-B V, VI, VII | 80j 66j | IV-B V-A, V-B | Used the implied redemption rated and increased it by 4 percentage points because of the additional yogurt substitution option. | |
| 59j 68j | VI VII | Used the implied redemption rated and increased it by 3 percentage points because of the additional yogurt substitution option. | |||
| Whole grains | 53a | IV-A, IV-B, V, VII | 60 | IV-A, IV-B, V-A, V-B, VII | Increased because of the increased options and allowable size range; redemption set to redemption of breakfast cereal in the current food packages. |
NOTES: The food package items listed in this table describe the broad categorization of the item, and encompass the allowable options and substitutions. NA = not applicable.
a The U.S. Department of Agriculture’s Food and Nutrition Service (FNS) provided the committee with 12 months (August 2013 through July 2014) of price and redemption data from a convenience sample of six WIC state agencies, representing five of the seven regions of the country. The identity of the agencies was not known to the committee. The states were diverse in terms of size and did not include Indian Tribal Organizations or territories. FNS identified one of the states as an outlier and removed its data from the average redemption estimates. Accordingly, estimates presented in the table are based on data from five of the six states.
b Cheese as its own food package item.
c Based on redemption data provided by the Chickasaw Nation, Kentucky, Massachusetts, and Texas.
d The committee used the redemption rates in the current food packages and the distribution of redemption shares (full, partial, nonredeemers) provided in a 2014 report from Altarum to calculate an implied redemption rate under the proposed revisions. The implied redemption rate accounts for the change in quantity prescribed to participants, primarily driven by the assumed average amount redeemed by partial redeemers. Although these values account for changes in amounts prescribed, they do not account for changes in composition or substitution options. The implied redemption rate does not account for behavioral changes.
e The revised redemption rate is approximately the average of the implied redemption rate (Altarum) and the revised redemption rate for the CVV; it is also the actual average redemption rate from Altarum so represents a reasonable redemption rate.
f Based on redemption data provided by the Chickasaw Nation, Kentucky, Massachusetts, and Wyoming.
g Used the Altarum report average to account for bimodal distribution of redemption. Bimodal distribution refers to cases where the tails of the distribution (none and full redemption) had a relatively large share of the redemptions and the “partial redemptions” were a small share (USDA/ERS, 2014).
h Redemption projection is or closely approximates the average redemption from the Altarum report, and therefore represents a reasonable projection.
i Based on redemption data provided by the California, Kentucky, and Massachusetts.
j Approximately a 5 percent increase from the Altarum implied redemption rate.
k Based on redemption data provided by the Chickasaw Nation, Kentucky, and Massachusetts.
SOURCES: Personal communication, K. Castellanos-Brown, USDA-FNS, redemption data provided to the committee, June 30, 2016; USDA/ERS, 2014; redemption data provided to the committee by individual states. Data are available in the public access file for this study (Email: paro@nas.edu).
TABLE U-12 Estimated Average Amount Redeemed for Each Food Package Item Food Package Type, Current Food Packages
| Food Package Type | Foods Package Item | Unit | Monthly Maximum Allowance | Estimated Average Amount Redeemeda |
|---|---|---|---|---|
| Food package I: Infants, 0 to less than 6 months | ||||
| I-BF-A | Infant formula | Prepared fl oz | 0 | 0 |
| I-BF-B | Infant formula | Prepared fl oz | 0 | 0 |
| I-BF/FF-A | Infant formula | Prepared fl oz | 104b | 98 |
| I-BF/FF-B | Infant formula | Prepared fl oz | 424b | 399 |
| I-BF/FF-C | Infant formula | Prepared fl oz | 510b | 479 |
| I -FF-A | Infant formula | Prepared fl oz | 861b | 809 |
| I -FF-B | Infant formula | Prepared fl oz | 948b | 891 |
| Food package II: Infants, 6 to less than 12 months | ||||
| II-BF | Infant cereal | Ounces | 24 | 11 |
| Jarred infant food vegetables | Ounces | 256 | 131 | |
| and fruits | ||||
| Jarred infant food meat | Ounces | 77.5 | 24 | |
| II-BF/FF | Infant formula | Prepared fl oz | 371b | 349 |
| Infant cereal | Ounces | 24 | 11 | |
| Jarred infant food vegetables | Ounces | 128 | 66 | |
| and fruits | ||||
| II-FF | Infant formula | Prepared fl oz | 683b | 642 |
| Infant cereal | Ounces | 24 | 11 | |
| Jarred infant food vegetable and fruits | Ounces | 128 | 66 | |
| Food package III: Participants with qualifying conditions | ||||
| IIIc | ||||
| Food package IV: Children, 1 to up to 5 years | ||||
| IV-A | Cash value voucher | Voucher ($) | 8 | 6 |
| Juice | Ounces | 128 | 90 | |
| Milk, whole | Quarts | 16 | 12 | |
| Breakfast cereal | Ounces | 36 | 22 | |
| Whole wheat bread | 16 oz | 2 | 1 | |
| Legumes or peanut butterd | 16 oz/18 oze | 1 | 0.5 | |
| Eggs | Dozen | 1 | 0.8 | |
| Food Package Type | Foods Package Item | Unit | Monthly Maximum Allowance | Estimated Average Amount Redeemeda |
|---|---|---|---|---|
| IV-B | Cash value voucher | Voucher ($) | 8 | 6 |
| Juice | Ounces | 128 | 90 | |
| Milk, reduced-fat | Quarts | 16 | 11 | |
| Breakfast cereal | Ounces | 36 | 22 | |
| Whole wheat bread | 16 oz | 2 | 1 | |
| Legumes or peanut butterd | 16 oz/18 oze | 1 | 0.5 | |
| Eggs | Dozen | 1 | 0.8 | |
| Food package V: Pregnant and partially (mostly) breastfeeding women, up to 1-year postpartum | ||||
| V | Cash value voucher | Voucher ($) | 11 | 9 |
| Juice | Ounces | 144 | 101 | |
| Milk, reduced-fat | Quarts | 22 | 12 | |
| Breakfast cereal | Ounces | 36 | 22 | |
| Whole wheat bread | 16 oz | 1 | 0.5 | |
| Legumes and peanut butterf | 16 oz/18 oze | 2 | 1 | |
| Eggs | Dozen | 1 | 0.8 | |
| Food package VI: Nonbreastfeeding postpartum women and partially (minimally) breastfeeding women, up to 6-months postpartum | ||||
| VI | Cash value voucher | Voucher ($) | 11 | 9 |
| Juice | Ounces | 96 | 67 | |
| Milk, reduced-fat | Quarts | 16 | 9 | |
| Breakfast cereal | Ounces | 36 | 22 | |
| Legumes or peanut butterd | 16 oz/18 oze | 1 | 0.5 | |
| Eggs | Dozen | 1 | 0.8 | |
| Food package VII: Fully breastfeeding women, up to 1-year postpartum | ||||
| VII | Cash value voucher | Voucher ($) | 11 | 9 |
| Juice | Ounces | 144 | 101 | |
| Milk, reduced-fat | Quarts | 24 | 13 | |
| Cheese | 16 oz | 1 | 0.7 | |
| Breakfast cereal | Ounces | 36 | 22 | |
| Whole wheat bread | 16 oz | 1 | 0.5 | |
| Legumes and peanut butterf | 16 oz/18 oze | 2 | 1 | |
| Eggs | Dozen | 2 | 2 | |
| Canned fish | Ounces | 30 | 21 | |
NOTES: The food package items listed in this table describe the broad categorizations and encompass the allowable options and substitutions.
a Calculated by multiplying the monthly maximum allowance by the redemption rate for the applicable food package and food package item. Value represents the estimated average quantity purchased by participants issued the specific food package.
b Weighted average of the monthly maximum allowances of the three different forms of infant formula. Weights were 0.78 for reconstituted powder, 0.12 for reconstituted liquid concentrate, and 0.10 for ready-to-feed, and were derived from the 2014 Food Package Report (USDA/FNS, 2016a).
c Food package III recipients were not uniquely identified in the redemption data. Accordingly, the committee assumed the redemption estimates in the current food packages and corresponding redemption projections applied to all participants categorically eligible to be prescribed the food item (i.e., a child prescribed food package III was assumed to be prescribed all of food package IV foods). With the exception of WIC formulas, the committee used both the monthly maximum allowances and the overall redemption rates for the standard food packages to arrive at corresponding food package III estimates. Owing to a lack of data on the reimbursement and costs to the program associated with exempt infant formulas and WIC-eligible nutritionals, estimates for food package III only encompass supplementary foods. The committee did, however, make one exception regarding WIC formula. The 2014 Food Package Report indicated that at least 40 percent of infant formula prescribed to partially (mostly) breastfed and fully formula fed infants is nonexempt (USDA/FNS, 2016a). Some nonexempt specialty formulas, such as thickened formulas, are reportedly covered by rebate contracts (USDA/ERS, 2004). Accordingly, the committee applied the proportion of nonexempt formula prescribed to the monthly maximum allowances for each of the infant food packages in food package III. The 94-percent redemption rate was then applied to those quantities and used in cost estimates. Because the quantity of infant formula did not change in the revised food package, this assumption is not expected to affect the estimated cost difference between the food packages.
d Food package IV and VI recipients can select from either peanut butter or legumes each month. They do not receive both in a given month.
e The 16 oz corresponds to the size of the dried legumes. States may also authorize four 16 oz cans (64 oz total) in lieu of the dried legumes. The 18 oz corresponds to size of the peanut butter. Although states may authorize smaller containers of canned legumes (15- to 16-oz) and peanut butter (16- to 18-oz), this analysis uses maximum container size for each.
f Food package V and VII recipients are prescribed both legumes and peanut butter each month.
Prices
As described in the preceding “Redemption” section, FNS provided the committee with 12 months’ worth of anonymized redemption data from six state agencies (August 2013 through July 2014).15 The data included the
__________________
15 As was previously discussed, one of the states included in the six states dataset produced outlier redemption estimates when average participation was inputted into the redemption equations. The outlier state was omitted from the average redemption estimates. In looking at price per unit across the six states, however, there were no clear outliers. As such, all six states were included in price estimates.
TABLE U-13 Projected Average Amount Redeemed for Each Food Package Item Under the Proposed Revisions, by Food Package Type
| Food Package Type | Foods Package Item | Unit | Monthly Maximum Allowance | Projected Average Amount Redeemeda |
|---|---|---|---|---|
| Food package I: Infants, 0 to less than 6 months | ||||
| I-BF-A | Infant formula | Prepared fl oz | 0 | 0 |
| I-BF-B | Infant formula | Prepared fl oz | 0 | 0 |
| I-BF/FF-A | Infant formula | Prepared fl oz | 104b,c | 98 |
| I-BF/FF-B | Infant formula | Prepared fl oz | 424b | 399 |
| I-BF/FF-C | Infant formula | Prepared fl oz | 510b | 479 |
| I -FF-A | Infant formula | Prepared fl oz | 861b | 809 |
| I -FF-B | Infant formula | Prepared fl oz | 948b | 891 |
| Food package II: Infants, 6 to less than 12 months | ||||
| II-BF | Infant cereal | Ounces | 16 | 9 |
| Jarred infant food vegetables and fruits | Ounces | 128 | 83 | |
| Jarred infant food meat | Ounces | 40 | 17 | |
| II-BF/FF | Infant formula | Prepared fl oz | 371b | 349 |
| Infant cereal | Ounces | 8 | 5 | |
| Jarred infant food vegetables and fruits | Ounces | 128 | 83 | |
| II-FF | Infant formula | Prepared fl oz | 683b | 642 |
| Infant cereal | Ounces | 8 | 5 | |
| Jarred infant food vegetables and fruits | Ounces | 128 | 83 | |
| Food package III: Participants with qualifying conditions | ||||
| IIId | ||||
| Food package IV: Children, 1 to up to 5 years | ||||
| IV-A | Cash value voucher | Voucher ($) | 12 | 9 |
| Juice | Ounces | 64 | 50 | |
| Milk, whole | Quarts | 12 | 10 | |
| Breakfast cereal | Ounces | 36 | 20 | |
| Whole wheat bread | 24 ozf | 1 | 0.6 | |
| Legumes and peanut butter | 16 oz/18 oze | 0.7g | 0.4 | |
| Eggs | Dozen | 1 | 0.8 | |
| Canned fish | Ounces | 3.3h | 2.3 | |
| Food Package Type | Foods Package Item | Unit | Monthly Maximum Allowance | Projected Average Amount Redeemeda |
|---|---|---|---|---|
| IV-B | Cash value voucher | Voucher ($) | 13 | 9 |
| Juice | Ounces | 64 | 50 | |
| Milk, reduced-fat | Quarts | 14 | 11 | |
| Breakfast cereal | Ounces | 36 | 20 | |
| Whole wheat bread | 24 ozf | 1 | 0.6 | |
| Legumes or peanut butter | 16 oz/18 oze | 0.7g | 0.4 | |
| Eggs | Dozen | 1 | 0.8 | |
| Canned fish | Ounces | 3.3h | 2.3 | |
| Food package V-A: Pregnant women | ||||
| V-A | Cash value voucher | Voucher ($) | 15 | 11 |
| Juice | Ounces | 64 | 51 | |
| Milk, reduced-fat | Quarts | 16 | 11 | |
| Breakfast cereal | Ounces | 36 | 20 | |
| Whole wheat bread | 24 ozf | 1 | 0.6 | |
| Legumes and peanut butter | 16 oz/18 oze | 1i | 0.5 | |
| Eggs | Dozen | 1 | 0.8 | |
| Canned fish | Ounces | 3.3h | 2.3 | |
| Food package V-B: Partially (mostly) breastfeeding women, up to 1-year postpartum | ||||
| V-B | Cash value voucher | Voucher ($) | 25 | 19 |
| Juice | Ounces | 64 | 51 | |
| Milk, reduced-fat | Quarts | 13 | 11 | |
| Breakfast cereal | Ounces | 36 | 20 | |
| Whole wheat bread | 24 ozf | 1 | 0.6 | |
| Legumes and peanut butter | 16 oz/18 oze | 1i | 0.5 | |
| Eggs | Dozen | 1 | 0.8 | |
| Canned fish | Ounces | 10 | 7 | |
| Food package VI: Nonbreastfeeding postpartum women and partially (minimally) breastfeeding women, up to 6-months postpartum | ||||
| VI | Cash value voucher | Voucher ($) | 15 | 11.3 |
| Milk, reduced-fat | Quarts | 16 | 9.4 | |
| Breakfast cereal | Ounces | 36 | 19.5 | |
| Legumes and peanut butter | 16 oz/18 oze | 1i | 0.5 | |
| Food Package Type | Foods Package Item | Unit | Monthly Maximum Allowance | Projected Average Amount Redeemeda |
|---|---|---|---|---|
| Eggs | Dozen | 1 | 0.8 | |
| Canned fish | Ounces | 3.3h | 2.3 | |
| Food package VII: Fully breastfeeding women, up to 1-year postpartum | ||||
| VII | Cash value voucher | Voucher ($) | 35 | 26.3 |
| Juice | Ounces | 64 | 50.8 | |
| Milk, reduced-fat | Quarts | 16 | 10.9 | |
| Breakfast cereal | Ounces | 36 | 19.5 | |
| Whole wheat bread | 24 ozf | 1 | 0.6 | |
| Legumes and peanut butter | 16 oz/18 oze | 1i | 0.5 | |
| Eggs | Dozen | 2 | 1.6 | |
| Canned fish | Ounces | 20 | 13.6 | |
NOTES: The food package items listed in this table describe the broad categorizations and encompass the allowable options and substitutions.
a Calculated by multiplying the monthly maximum allowance by projected redemption for the applicable food package and food package item. Value represented the projected average quantity purchased participants issued the specific food package.
b Weighted average of the monthly maximum allowances of the three different forms of infant formula. Weights were 0.78 for reconstituted powder, 0.12 for reconstituted liquid concentrate, and 0.10 for ready-to-feed and were derived from the 2014 Food Package Report (USDA/FNS, 2016a).
c The committee proposes to allow partially (mostly) breastfed infants up to 364 reconstituted fl oz of infant formula in the first 30 days of life after a breastfeeding assessment by a competent professional authority. Because the committee upholds the provision that issuance of formula to a breastfed infant should not be standard practice and the amount is determined on a case-by-case basis, the monthly maximum allowance of 104 reconstituted fl oz was retained for this analysis. The cost effect of changing the monthly maximum allowance to 364 reconstituted fl oz is evaluated in the “Uncertainties” section of this appendix.
d Food package III recipients were not uniquely identified in the redemption data. Accordingly, the committee assumed the redemption estimates in the current food packages and corresponding redemption projections applied to all participants categorically eligible to be prescribed the food item (i.e., a child prescribed food package III was assumed to be prescribed all of food package IV foods). With the exception of WIC formulas, the committee used both the monthly maximum allowances and the overall redemption rates for the standard food packages to arrive at corresponding food package III estimates. Owing to a lack of data on the reimbursement and costs to the program associated with exempt infant formulas and WIC-eligible nutritionals, estimates for food package III only encompass supplementary foods. The committee did, however, make one exception regarding WIC formula. The 2014 Food Package Report indicated that at least 40 percent of infant formula prescribed to partially (mostly) breastfed and fully formula fed infants is nonexempt (USDA/FNS, 2016a). Some nonexempt specialty formulas, such as thickened formulas, are reportedly covered by rebate contracts (USDA/ERS, 2004). Accordingly, the committee applied the proportion of nonexempt formula
prescribed to the monthly maximum allowances for each of the infant food packages in food package III. The 94-percent redemption rate was then applied to those quantities and used in cost estimates. Because the quantity of infant formula did not change in the revised food package, this assumption is not expected to affect the estimated cost difference between the food packages.
e The 16 oz corresponds to the size of the dried legumes. The proposed revisions will require all state agencies to authorize four 16-oz cans (64 oz total) in lieu of the dried legumes. The 18 oz corresponds to the size of the peanut butter. All women receive 2 lb of legumes and 18 oz of peanut butter in a quarter. Although states may authorize smaller containers of canned legumes (15- to 16-oz) and peanut butter (16- to 18-oz), this analysis uses maximum container size for each.
f The proposed revisions to the whole wheat bread category would allow participants to choose from a range of bread sizes, 16 to 24 oz. The maximum amount that a participant could purchase under the proposed revisions (24 oz) is used in this analysis.
g This value reflects the average amount prescribed over the course of 3 months and should not be interpreted as an amount provided on a monthly basis. Under the proposed revisions, food packages IV-A and IV-B recipients receive legumes, peanut butter, and canned fish in rotation over a 3 month period. This rotation scheme results in legumes and peanut butter being issued in 2 out of 3 months, averaging to 0.667 allotments (an allotment corresponds to 16 oz of legumes; 18 oz of peanut butter) per month.
h This value reflects the average amount prescribed over the course of 3 months and should not be interpreted as an amount provided on a monthly basis. Under the proposed revisions, food packages IV-A, IV-B, V-A, and VI recipients are prescribed 10 oz of fish once every 3 months. This averages to 3.33 oz per month.
i Under the proposed revisions, all women receive 2 lb of legumes and 18 oz of peanut butter once each in quarter.
number and sizes of containers purchased, the average price per container for each container size, and the total amount the WIC agency paid for each size of the food item. Given the range of container sizes purchased for each food package item, the number of units purchased was standardized by multiplying the container size by the number of containers redeemed, summing the total amount purchased across the various container sizes, and, where applicable, dividing by a food package-appropriate unit size. The total amount the agency paid for the food item (across all container sizes) was divided by the total number of standardized units purchased to arrive at a price per unit.
The FNS redemption dataset captures WIC shopping behaviors not readily quantifiable from other sources of food prices. For example, the data were presumed to encompass the range of approved vendors where participants choose to use their WIC food instruments. The prices themselves reflect the choices participants actually made while at the vendor. Prices are inclusive of the substitutions and state-authorized allowable options selected by participants. Although the extent to which the FNS redemption dataset was representative of program participants at large
could not be determined, the committee prioritized its use owing to its specificity to the WIC population.
The FNS redemption dataset, however, could not be used to estimate prices for select food package items. Infant formula was not included in the FNS redemption dataset. The FNS redemption dataset also predated allowing yogurt as a substitution option for fluid milk. Finally, the FNS redemption dataset did not contain the range of whole wheat bread and allowable options being proposed for the revised food packages. For these items, prices were drawn from the 2014 IRI Consumer Network database.
Composite prices for the food items State agencies that contributed information to the FNS redemption dataset varied in the level of detail about the purchased item. Some provided specific descriptors of the subcategory (e.g., “nonwhole grain breakfast cereal”) while other only provided broad descriptions (e.g., “breakfast cereal: all types”). Because of this, the price estimates derived from the FNS redemption dataset collectively describe the main food package item category, which includes corresponding substitution and state-authorized allowable option selections made within that category. This approach, however, could not be used for five food package items: infant formula, infant food meat (revised food package only), milk, peanut butter and legumes, and whole wheat bread (revised food package only). For these items, the committee developed composite prices for each of the food package items, as outlined below:
- Infant formula prices were not included in the FNS redemption dataset. The committee, therefore, drew retail price data for liquid concentrate, powdered, and ready-to-feed infant formulas from the 2014 IRI Consumer Network database. The prices for unprepared infant formula were converted to prices per prepared fluid ounce. The average costs per prepared fluid ounce were weighted to reflect the distribution of infant formula types purchased through WIC. The weights were derived from the 2014 Food Package Report (USDA/FNS, 2016a): 0.78 (powdered), 0.12 (liquid concentrate), and 0.10 (ready-to-feed). Based on the FY2010 WIC Food Cost Report (USDA/FNS, 2013b), postrebate costs of infant formula are approximately 35 percent of prerebate costs. Given the rebate data were from 2010, the committee evaluated the stability of rebates between 2010 and 2015.16 With the exception of 2011, rebates between 2010 and 2015 were relatively stable. Accordingly, the
__________________
16 Rebates were reported as “rebates billed” before 2013 and “rebates received” after 2013. These were considered equivalent for the purpose of estimating rebate changes over time.
- Under the proposed revisions, fully breastfed infants ages 6 to less than 12 months are prescribed 40 ounces of infant food meat, with the option of 10 ounces substituted with canned fish. Given the relatively low redemption of infant food meat and feedback from the public regarding infant food meat, the committee assumed food package II-BF recipients would make use of the 10-ounce substitution option. The weights used to calculate the composite were 0.75 for infant food meat and 0.25 for canned fish. The redemption projection presented in Table U-11 was applied to this composite value.
- In both the current and revised food packages, legumes and peanut butter are prescribed to participant under two different schemes. Accordingly, the different food packages and food package versions needed different weights for calculating composite prices. The weights accounted for the two different forms of legumes that can be authorized (dried and canned). The 2015 WIC Food Package Policy Options II Final Report (USDA/FNS, 2015b) reported that 85 percent of WIC participants are served by state agencies that allow canned legumes as an allowable option. Under the proposed revisions, all state agencies would have to authorize canned legumes as an allowable option. Table U-14 summarizes the weighting scheme used to calculate composite prices for the legume and peanut butter category.
- Allowable options and substitutions in the milk category include milk,17 yogurt, cheese, soy beverage, and tofu. In both the current and revised food packages, children issued food package IV-A are prescribed whole milk, while all other food packages only prescribed the option of reduced-fat milk, low-fat milk, or nonfat milk. In the FNS redemption dataset, the cost of whole milk was slightly more than reduced-fat, low-fat, and nonfat milks, indicating a single price for fluid milk could not be used for this analysis. Milk prices are a weighted composite of the price of fluid milk, soy beverage, and lactose-free milk. Weights were based on redemption data provided by Texas and Wyoming. Tofu was redeemed for less than 1 percent of milk purchases in the available redemption data, and therefore was omitted from the milk composite price.
postrebate cost to the agency was estimated to be approximately 35 percent of the weighted average price per prepared fluid ounce.
__________________
17 Allowable forms of milk include fluid, evaporated, and dry milks. Allowable types include whole, reduced-fat (2%), low fat, nonfat, buttermilk, acidophilus, lactose-free, lactose-reduced, ultra-high-temperature (UHT) milk, and kosher milks. Under the current rule, some state agencies also authorize flavored milk.
TABLE U-14 Weighting Schemes Used to Calculate Composite Prices for Legumes and Peanut Butter for Current and Revised Food Packages
| Food Package Version | Food Package | Maximum Monthly Allowance | Weights Used to Calculate Composite Legumes and Peanut Butter Price | Assumptions | ||
|---|---|---|---|---|---|---|
| Legumes | Peanut Butter | |||||
| Canned | Dried | |||||
| Current | IV-A, IV-B, and VI | 1 lb legumes (64 oz canned)a or 18 oz peanut butter | 0.186 | 0.314 | 0.500 | Assumes half of food package IV and VI recipients choose peanut butter and half choose legumes; canned beans account for 37.2% of legume purchases while dried legumes account for 62.8%b |
| V and VII | 1 lb legumes (64 oz canned)a or 18 oz peanut butter | 0.186 | 0.314 | 0.500 | Legumes and peanut butter are both provided, so are equally weighted; canned beans account for 37.2% of legume purchases while dried legumes account for 62.8%b | |
| Revised | IV-A and IV-B | 1 lb legumes (64 oz canned) and 18 oz peanut butter prescribed over the course of 3 monthsc | 0.211 | 0.289 | 0.500 | Legumes and peanut butter are both provided in a 3-month cycle, so are equally weighted; canned beans were assumed to account for 42.2% of legume purchases while dried legumes account for 57.8%d |
| V-A, V-B, VI, and VII | 2 lb legumes (128 oz canned) and 18 oz peanut butter prescribed over the course of 3 monthse | 0.281 | 0.385 | 0.333 | Legumes are provided twice and peanut butter is provided once in a 3-month cycle, so are weighted in a 2 to 1 ratio; canned beans were assumed to account for 42.2% of legume purchases while dried legumes account for 57.8%c |
NOTES: The weights summarized in this table were used to calculate composite prices for the legume and bean category in each food package. lb = pound; oz = ounces.
a Most, but not all, state agencies, currently authorize canned as an allowable form of legumes.
b Ratio was calculated from the FNS redemption dataset. Because the identity of the state agencies was unknown, the committee could not verify that states authorized both dried and canned options for legumes. It was therefore assumed that the ratio reflected the current state of authorized options for legumes.
c Under the proposed revisions, legumes, peanut butter, and canned fish are each prescribed once in a 3-month rotation. The weights presented in the table reflect contributions to the unit price used to estimate total costs. The 3-month rotation pattern is accounted for in this analysis through the value used for the monthly maximum allowance (0.66 allotments per month).
d To account for the proposed revision that all states authorized canned legumes, the proportion of legume purchases attributable to canned was increased. The committee assumed the proportion of legume purchases attributable to canned legumes would increase by 5 percentage points (from 37.2 to 42.2 percent).
e Under the proposed revisions, legumes and peanut butter are prescribed in a 3-month rotation. Legumes (2 lb or 128 oz canned) and peanut butter (18 oz) are each prescribed once. Because this averages to one allotment (either 1 lb of legume or one 18 oz container of peanut butter) each month, the weights reflect the 2 to 1 ratio across the 3-month period.
- Proposed changes to the specifications and allowable options in the whole wheat bread category necessitated new prices. Prices for 100% whole wheat bread (18- to 24-ounce sizes),18 corn tortillas (16 to 24 ounces), and oatmeal (16 to 24 ounces) were used in the cost estimates for the proposed revisions. While other allowable options for the whole wheat bread category exist (e.g., brown rice, bulgur, whole wheat pasta), nationally representative data on the distribution of redemption in context of the different options authorized by states were not available to the committee. Weights for the whole wheat bread (0.755), corn tortillas (0.185), and oatmeal (0.060) were estimated from redemption data from the Chickasaw Nation, Texas, and Wyoming.
Furthermore, because the quantity of milk prescribed differs across the food packages, and the maximum allowed substitutions differ for food package VII, a single weighting scheme of milk, yogurt, and cheese could not be applied. For the current food packages, the committee assumed maximum substitution of cheese and yogurt. For the revised food packages, the committee weighted the maximum cheese and yogurt substitution options. Table U-15 summarizes the weighting scheme used to calculate composite prices for the milk food package item category.
Inflating unit prices to FY2015 prices The two sources of price data encompassed different timeframes; the FNS redemption dataset values were from August 2013 through July 2014 and the IRI Consumer Network prices were from calendar year 2014. To create a common base year, prices were inflated to FY2015 prices using Bureau of Labor Statistics Consumer Price Index (CPI) adjustments.19 To accomplish this, the average item-specific CPI for FY2015 was divided by the average CPI for the time frame encompassed by the available unit price. The FY2015 prices were used to create the composite prices described in the preceding section. Table U-16 outlines the item-specific inflation rates and resulting FY2015 unit and composite prices for each food item used in this analysis.
Projecting prices after FY2015 For years after FY2015, prices for items that are prescribed as a fixed quantity (e.g., 16 quarts of milk) were inflated using the Congressional Budget Office’s March 2015 Baseline Thrifty Food
__________________
18 The 2014 IRI Consume Network price of the 16-ounce size of 100% whole wheat bread was not included in the price estimate under the proposed revisions because the committee anticipates the expansion of allowable bread sizes will result in the 16-ounce size eventually being removed from the market. The 16-ounce size was initially manufactured and distributed to comply with current WIC specifications for whole wheat bread.
19 See http://data.bls.gov/cgi-bin/dsrv?cu (accessed March 12, 2017).
TABLE U-15 Weighting Schemes Used to Calculate Composite Prices for Milk for the Current and Revised Food Packages
| Food Package Version | Food Package | Maximum Monthly Allowance | Substitution Scheme Used to Develop the Composite Milk Price Weightsa | Weights Used to Calculate Composite Milk Price | ||
|---|---|---|---|---|---|---|
| Milk | Cheese | Yogurt | ||||
| Current | IV-A | 16 qt | 12 qt milk + 1 lb cheese + 1 qt yogurt | 0.750b | 0.063 | 0.063 |
| IV-B | 16 qt | 12 qt milk + 1 lb cheese + 1 qt yogurt | 0.750c | 0.063 | 0.063 | |
| V | 22 qt | 18 qt milk + 1 lb cheese + 1 qt yogurt | 0.818c | 0.045 | 0.045 | |
| VI | 16 qt | 12 qt milk + 1 lb cheese + 1 qt yogurt | 0.750c | 0.063 | 0.063 | |
| VII | 24 qt | 19 qt milk + 1.5 lb cheese + 0.5 qt yogurt | 0.792c | 0.063 | 0.021 | |
| Revised | IV-A | 12 qt | 8 qt milk + 1 lb cheese + 1 qt yogurtd | 0.667b | 0.083 | 0.083 |
| IV-B | 14 qt | 11 qt milk + 0.5 lb cheese + 1.5 qt yogurt | 0.786c | 0.036 | 0.107 | |
| V-A | 16 qt | 13 qt milk + 0.5 lb cheese + 1.5 qt yogurt | 0.813c | 0.313 | 0.094 | |
| V-B | 16 qt | 13 qt milk + 0.5 lb cheese + 1.5 qt yogurt | 0.813c | 0.313 | 0.094 | |
| VI | 16 qt | 13 qt milk + 0.5 lb cheese + 1.5 qt yogurt | 0.813c | 0.313 | 0.094 | |
| VII | 16 qt | 12 qt milk + 1 lb cheese + 1 qt yogurt | 0.750c | 0.063 | 0.063 | |
NOTES: The weights summarized in this table were used to calculate composite prices for the milk category in each food package. The unit price for milk is per quart, cheese is per pound, and yogurt is per quart. The substitution ratio is 1 lb of cheese for 3 qt of milk and 1 qt of yogurt for 1 qt of milk. Because the unit price for cheese is per pound and the substitution ratio is 3:1 cheese to milk, weights do not sum to one. qt = quart(s); lb = pound(s).
a Schemes reflect high-price substitution scenarios for each food package. In the current food packages, the maximum number of quarts of milk that can be substituted are 4 (food packages IV–VI) and 6 (food package VII). A maximum of 1 qt of milk can be substituted for yogurt. No more than 1 lb of cheese can be substituted in food packages IV–VI and 2 lb in food package VII. Under the proposed revisions, all women and children can substitute 1 qt of yogurt and 1 lb of cheese for 4 qt of milk, or 2 qt of yogurt for 2 qt of milk. Food package VII recipients can also substitute 2 lb of cheese for 6 qt of milk. Substitution schemes for revised food packages average the substitution options unless otherwise noted.
b Milk price that is weighted is a composite of the price of whole milk (weight: 0.983), soy beverage (weight: 0.008), and lactose-free milk (weight: 0.009). Weights were based on redemption data provided by Texas and Wyoming. Tofu was redeemed for <1 percent of milk purchases in the available redemption data and therefore was omitted from the milk composite price.
c Milk price that is weighted is a composite of the average price of reduced-fat, low-fat, and nonfat milk (weight: 0.975); soy beverage (weight: 0.011); and lactose-free milk (weight: 0.013). Weights were based on redemption data provided by Texas and Wyoming. Tofu was redeemed for <1 percent of milk purchases in the available redemption data and therefore was omitted from the milk composite price.
d Given the high redemption rate and public feedback received about whole milk, the committee made the assumption that substitution of 2 qt of yogurt may not be a likely scenario for food package IV-A. The substitution scheme used in the weighting, therefore, only represents the cheese and yogurt pattern. This is the higher-price substitution scenario, so cost differences for this food package are most likely conservative.
Plan estimates (CBO, 2015) The inflation assumptions are presented in Table U-17.
Inflating the cash value voucher The CVV does not inflate the same way as items prescribed as a fixed quantity. Instead, its inflation depends on an annual average of the CPI for fresh fruits and vegetables (7 C.F.R. § 246.16). Under the current rule, the average CPI for fresh fruits and vegetables from April 2006 through March 2007 is assigned to FY2008 and considered the baseline CPI. Each subsequent year follows the same pattern (e.g., FY2009 value is the average CPI from April 2007 to March 2008). To inflate the CVV, the average CPI for the fiscal year being considered is divided by the baseline CPI value and multiplied by the base values of each CVV ($8 for children, $10 for women). Participants only receive an increase in value when the inflated CVV crosses a $1 increment. Provision of the CVV in dollar increments, rather than prescribing the exact inflated value, is easier from an administrative perspective, as adjustments only have to be made periodically. It also decreases participant burden, as the benefit is provided in a round number and a consistent value month to month. This inflation approach was used for estimating the costs of the current food packages in this analysis.
Under the proposed revisions, all women and children receive a CVV of higher value. Had the committee kept FY2008 as the baseline CPI value under the proposed revisions, in FY2018 the $12, $15, $25, and $35 CVVs would already have been inflated to $13, $17, $28, and $39, respectively, because of the inflation that will have taken place in the decade between FY2008 and FY2018. Accordingly, the CVV under the proposed revision required a new inflation baseline, which was assumed to be the first year of implementation (FY2018).
The CPI values used in the inflation of the CVV encompass the 6 to 18 months prior to the fiscal year they describe. Accordingly, actual CPI
TABLE U-16 FY2015 Price per Unit for Each Food Package Item and Calculated Composite Using Item-Specific Inflation Rates
| Food Package Item | Item-Specific Inflation Ratea | FY2015 Price | Unit |
|---|---|---|---|
| Individual Food Package Items | |||
| Infant formula, liquid concentrateb | 0.99996c | 0.067 | Prepared fl oz, postrebate |
| Infant formula, powderb | 0.99996c | 0.064 | Prepared fl oz, postrebate |
| Infant formula, ready-to-feedb | 0.99996c | 0.080 | Prepared fl oz, postrebate |
| Infant cereal | 1.01097 | 0.264 | Ounce |
| Infant food, vegetables and fruits | 1.01097 | 0.165 | Ounce |
| Infant food, meat | 1.01097 | 0.403 | Ounce |
| Beans, driedb | 1.04713 | 1.503 | Pound |
| Beans, cannedb | 1.00257 | 4.058 | 64 oz |
| Peanut butterb | 0.98294 | 2.286 | 18 oz |
| Juice | 1.00853 | 0.049 | Ounce |
| Cheeseb,d | 1.03901 | 5.327 | Pound |
| Milk, reduced fatb | 0.98261 | 0.818 | Quart |
| Milk, wholeb | 0.98261 | 0.858 | Quart |
| Milk, lactose-freeb | 0.98261 | 1.631 | Quart |
| Soy beverageb | 1.02499 | 1.819 | Quart |
| Yogurtb | 0.99596c | 3.219 | Quart |
| Breakfast cereal (current)e | 1.00602 | 0.214 | Ounce |
| Breakfast cereal (revised)f | 1.00602 | 0.233 | Ounce |
| Corn tortillasb | 1.00369c | 2.264 | 24 oz |
| Oatmealb | 1.00369c | 4.143 | 24 oz |
| Whole wheat bread (current)b | 1.00608 | 2.354 | 16 oz |
| Whole wheat bread (revised)b,f | 1.00369c | 2.650 | 24 oz |
| Eggs | 1.15757 | 2.169 | Dozen |
| Fish, cannedb,g | 1.01228 | 0.202 | Ounce |
| Calculated Food Package Composites | |||
| Infant formulah | 0.066 | Prepared fl oz, postrebate | |
| Infant food, meat (revised)i | 0.353 | Ounce | |
| Legumes and peanut butterj | |||
| Food packages IV-A, IV-B, V, VI and VII (current) | 2.370 | Per one allotmentk | |
| Food packages IV-A and IV-B (revised) | 2.434 | Per one allotmentk | |
| Food Package Item | Item-Specific Inflation Ratea | FY2015 Price | Unit |
|---|---|---|---|
| Food packages V-A, V-B, VI, and VII (revised) | 2.483 | Per one allotmentk | |
| Milkl | |||
| Food package IV-A (current) | 1.189 | Quart | |
| Food package IV-B (current) | 1.164 | Quart | |
| Food package V (current) | 1.076 | Quart | |
| Food package VI (current) | 1.164 | Quart | |
| Food package VII (current) | 1.065 | Quart | |
| Food package IV-A (revised) | 1.294 | Quart | |
| Food package IV-B (revised) | 1.195 | Quart | |
| Food package V-A, V-B, and VI (revised) | 1.151 | Quart | |
| Food package VII (revised) | 1.164 | Quart | |
| Whole wheat bread (revised)m | 2.667 | 24 oz | |
a Item-specific inflation rates were calculated using the U.S. Bureau of Labor Statistics Consumer Price Index (CPI). The selected CPI was matched to the closest food category for each food package item. The inflation rate was calculated by dividing the average of the item-specific CPI for FY2015 by the average of the item-specific CPI for the time period encompassed by the estimated price. Unless otherwise noted, the time period encompassed by the estimated price being inflated is August 2013 through July 2014. Values greater than 1 indicate FY2015 prices increased; values less than 1 indicate prices decreased.
b Item was used to calculate a composite price listed in the lower portion of the table.
c Price data were drawn from the IRI Consumer Network database. The inflation rate was calculated by dividing the average of the item-specific CPI for FY2015 by the average of the item-specific CPI from January through December 2014.
d In the current food packages, cheese is prescribed to food package VII recipients as a separate item. In both the current and revised food packages, cheese is offered as a substitution option for milk. Cheese, therefore, is used as an individual item and in the calculated composites.
e In the current food packages, whole grain must be the primary ingredient in at least one-half of breakfast cereals authorized by the state agency. The price reflects the average price per ounce of all breakfast cereals purchased in the FNS redemption dataset.
f In the revised food packages, all breakfast cereals authorized by a state agency must adhere to the “whole grain-rich” criteria as outlined by USDA-FNS for the school lunch program. The price reflects the average price per ounce of all breakfast cereals described as “whole grain breakfast cereal” purchased in the FNS redemption dataset.
g Canned fish is prescribed as an individual food package item in the current food packages (food package VII) and the revised food packages (food packages IV–VII). Additionally, canned fish is offered as a substitution option for infant food meat in food package II-BF. Canned fish, therefore, is used as an individual item and in a calculated composite.
h Weights were derived from the 2014 Food Package Report (USDA/FNS, 2016a): 0.78 (powdered), 0.12 (liquid concentrate), and 0.10 (ready-to-feed). All prices were based on prepared fl oz of each infant formula type.
i Weights used to calculate the composite were 0.75 for infant food meat and 0.25 for canned fish.
j Weighting schemes are presented in Table U-12.
k An “allotment” corresponds to 1 lb of legumes, 64 oz of canned legumes, or 18 oz of peanut butter.
l Weighting schemes are presented in Table U-13.
m Weights used to calculate the composite were: 0.76 (whole wheat bread [revised]), 0.19 (corn tortillas), and 0.06 (oatmeal).
values were used through FY2017 of this analysis. The committee could not identify forecasts for the retail price of fresh vegetables and fruits that extended to FY2022. A forecast for 2017 projected a 1 to 2 percent relative change in price from FY2016 (USDA/ERS, 2016). Therefore, a relative change in average CPI of 1.5 percent was used for FY2018 through FY2022. The CPI value assumptions and associated percent increase are summarized in Table U-18. The cost effect of using alternate baseline years for the CPI inflation values for the revised food packages are tested in the “Uncertainties” section of this analysis.
When the assessment year’s CPI is divided by the baseline year value, it represents the percent increase relative to baseline. Because this percent is applied to the initial CVV value, larger CVVs will cross the $1 increment sooner than smaller CVVs. These differences become more pronounced
TABLE U-17 Inflation Assumptions for Food Package Items Prescribed as a Fixed Quantity, FY2016–FY2022
| Year | Thrifty Food Plan (inflation rate)a |
|---|---|
| FY2016b | 1.026 |
| FY2017b | 1.020 |
| FY2018 | 1.020 |
| FY2019 | 1.021 |
| FY2020 | 1.021 |
| FY2021 | 1.023 |
| FY2022 | 1.023 |
NOTES: The base year of this analysis is FY2015.
a Rate is relative to the fiscal year preceding it. Prices for FY2016, for example, were projected to be 2.6 percent higher than in FY2015.
b Year not included in the cost estimates presented in this RIA, but it was necessary to arrive at price estimates for FY2018 through FY2022.
SOURCE: CBO, 2015.
TABLE U-18 Consumer Price Index for Fresh Vegetables and Fruits: Assumptions for Inflating the CVV for Current and Revised Food Packages
| Year | CPI for Fresh Fruits and Vegetables | Change Relative to Baseline CPI Value, Inflation Rate | |
|---|---|---|---|
| Currenta | Revisedb | ||
| FY2015c | 332.5d | 1.093 | NA |
| FY2016c | 340.0d | 1.117 | NA |
| FY2017c | 341.1d | 1.121 | NA |
| FY2018 | 346.2e | 1.138 | 0f |
| FY2019 | 351.4e | 1.155 | 1.015 |
| FY2020 | 356.6e | 1.172 | 1.030 |
| FY2021 | 362.0e | 1.190 | 1.046 |
| FY2022 | 367.4e | 1.207 | 1.061 |
NOTES: CPI = Consumer Price Index; NA = not applicable.
a The baseline CPI value is 304.3 and is assigned to FY2008.
b The baseline CPI value is 346.2 and is assigned to FY2018.
c Year not included in the cost estimates presented in this RIA, but was necessary to arrive at CVV inflation estimates for FY2018 through FY2022.
d Actual values based on available CPI values.
e Projected CPI values, based on a 1.5 percent relative increase in CPI each fiscal year.
f Baseline value under the proposed revisions.
with higher CVV values. Given this, in this analysis, the CVVs that are issued as substitution options (i.e., half of infant food vegetables and fruits for a $10 CVV; all infant food vegetables and fruits for a $20 CVV; all juice for $3 CVV) are not added to the participant’s CVV value, but are instead inflated separately. Table U-19 presents the effect of the CPI projections on the CVVs for the current and revised food packages.
UNCERTAINTIES
The estimated costs of the current food packages and proposed revised food packages are sensitive to key assumptions made in the preceding sections. The cost implications of several of these assumptions are tested below. The uncertainty scenarios specifically evaluate changing one or multiple assumptions about the revised food package and evaluating the cost effects. The “primary analysis” refers to the assumptions, food costs, and cost differences presented in the preceding sections of this appendix. “Base assumption” refers to the specific assumption(s) used in the primary analysis.
TABLE U-19 Projected Incremental Increases in Cash Value Vouchers for the Current and Revised Food Packages
| Year | CVV Values, as Prescribed to WIC Participants | ||||||||
|---|---|---|---|---|---|---|---|---|---|
| Current | Revised | ||||||||
| Initial Value, $8a | Initial Value, $10b | Initial Value, $3c | Initial Value, $10d | Initial Value, $12e | Initial Value, $15f | Initial Value, $20g | Initial Value, $25h | Initial Value, $35i | |
| FY2015j | $8k | $10k | |||||||
| FY2016j | $8k | $11k | |||||||
| FY2017j | $8k | $11k | |||||||
| FY2018 | $9 | $11 | $3 | $10 | $12 | $15 | $20 | $25 | $35 |
| FY2019 | $9 | $11 | $3 | $10 | $12 | $15 | $20 | $25 | $35 |
| FY2020 | $9 | $11 | $3 | $10 | $12 | $15 | $20 | $25 | $36 |
| FY2021 | $9 | $11 | $3 | $10 | $12 | $15 | $20 | $26 | $36 |
| FY2022 | $9 | $12 | $3 | $10 | $12 | $15 | $21 | $26 | $37 |
NOTES: Under current WIC regulations (7 C.F.R. §246.16), the CVV inflates based on an annual average CPI value, as compared to a baseline CPI value. WIC participants, however, do not receive an increase in CVV until the inflated value exceeds a dollar increment. The CVV values in the table are inflated based on projected changes in average CPI values presented in Table U-16 and establishing FY2018 as the new baseline year under the proposed revisions. No values are presented for FY2015 through FY2017 under the proposed revisions because the changes are not anticipated to be implemented until FY2018. CPI = Consumer Price Index; CVV = cash value voucher.
a Initial values of the CVV prescribed to food packages IV-A and IV-B in the current food packages.
b Initial values of the CVV prescribed to food packages V, VI, and VII in the current food packages.
c Initial values of the CVV prescribed when substituted for juice under the proposed revisions.
d Initial values of the CVV prescribed when substituted for half of jarred infant food vegetables and fruits under the proposed revisions.
e Initial values of the CVV prescribed to food packages IV-A and IV-B under the proposed revisions.
f Initial values of the CVV prescribed to food packages V-A and VI under the proposed revisions.
g Initial values of the CVV prescribed when substituted for all jarred infant food vegetables and fruits under the proposed revisions.
h Initial values of the CVV prescribed to food packages V-B under the proposed revisions.
i Initial values of the CVV prescribed to food packages VII under the proposed revisions.
j Year not included in the cost estimates presented in this RIA, but was necessary to arrive at CVV inflation estimates for FY2018 through FY2022.
k Inflation is based on actual CPI data.
For each uncertainty scenario tested, the phased-in cost differences are presented. The phased-in cost differences presented for each assumption scenario (i.e., base assumption, each uncertainty scenario) indicate that the cost effect as it relates to the current food packages. Negative values (–) indicate that the specific scenario costs less than the current food packages, while a positive value (+) indicates the specific scenario costs more than the current food packages. The cost differences between the base assumption and each uncertainty scenario are also presented. These describe how much the base assumption costs or saves, as compared to the tested uncertainty scenario. For these differences, a negative value (–) indicates that the base assumption used in the primary analysis costs less than the uncertainty scenario; a positive value (+) indicates that the base assumption costs more than the uncertainty scenario.
The cost differences presented in this section must be considered in context of estimated overall food costs of the current and revised food packages. Over the course of FY2018 through FY2022, the food packages in this analysis are projected to cost approximately $17 billion, averaging to approximately $3.9 billion per year, both under the current and revised food packages.
Assumptions About the CVV
The CVVs are estimated to cost approximately $780 million more in the revised food packages as compared to the CVVs in the current food packages. The proposed revisions allow for a CVV to be a substitution options for juice and jarred infant food vegetables and fruits. Given the CVV’s increased prominence in the revised food packages, it is paramount to evaluate different aspects of the assumptions underlying the primary cost analysis.
Different CVV Redemption Projections Under the Proposed Revisions
In the primary analysis, CVV redemption was estimated to be 77.2 percent in the current food packages and 75.0 percent in the revised food packages The cost implications of two alternative redemption scenarios are presented in Table U-20. Scenario 1 shows that increasing the redemption assumption to 85 percent for the revised food packages would result in the estimated $220.4 million savings projected in the primary analysis becoming $135.1 million in additional costs, as compared to the current food packages ($355.5 million in additional costs as compared to the base assumption). Similarly, scenario 2 shows that lower redemption of the revised CVV (65 percent redemption) results in an additional $355.5 million savings from FY2018 through FY2022, as compared to the base
TABLE U-20 Projected Phased-in Cost Difference of WIC Food Package Revisions, Increase or Decrease in Redemption Assumption of Cash Value Voucher
| Scenario | CVV Assumption, Percent Redeemed | Phased-in Cost Differences of the Revised Food Packages Compared to Current Food Packages ($, millions)a | |||||
|---|---|---|---|---|---|---|---|
| FY2018 | FY2019 | FY2020 | FY2021 | FY2022 | Total Cost Difference, FY2018 Through FY2022 | ||
| Base assumptionb | 75 | –6.4 | −14.8 | –47.7 | –65.0 | –86.6 | –220.4 |
| Uncertainty scenario 1b | 85 | +10.2 | +18.8 | +53.4 | +37.0 | +15.8 | +135.1 |
| Cost difference of base assumption as compared to uncertainty scenario 1c | −16.6 | −33.6 | −101.1 | −101.9 | −102.3 | −355.5 | |
| Base assumptionb | 75 | –6.4 | –14.8 | –47.7 | –65.0 | –86.6 | –220.4 |
| Uncertainty scenario 2b | 65 | −23.0 | –48.4 | –148.8 | –166.9 | –188.9 | –575.9 |
| Cost difference of base assumption as compared to uncertainty scenario 2c | +16.6 | +33.6 | +101.1 | +101.9 | +102.3 | +355.5 | |
NOTES: This table shows the phased-in cost difference between the revised and current food packages, along with the cost differences between different redemption assumptions for the revised CVV (85 and 65 percent redemption) and the current food packages. The primary analysis of the RIA assumes 75 percent redemption of the revised CVVs. All other assumptions in the primary analysis remain constant. Column and row totals may not be exact owing to independent rounding. CVV = cash value voucher.
a Phased-in estimates assume full implementation of the proposed revisions in state agencies serving one-third of all WIC participants as of April 1, 2018. All other state agencies are assumed to implement the proposed revisions as of FY2020.
b Describes the increases or savings of the base assumption or uncertainty scenario (“assumption scenario”) as compared to the current food packages. Negative values (−) indicate that the assumption scenario costs less than the current food packages. Positive values (+) indicate that the assumption scenario costs more than the current food packages.
c Describes the increases or savings of the base assumption as compared to the uncertainty scenario. Negative values (−) indicate that the base assumption costs less than the uncertainty assumption. Positive values (+) indicate that the base assumption costs more than the uncertainty scenario.
assumptions in the primary analysis. This lower redemption assumption for the CVVs in the revised food packages results in a total cost savings of approximately $580 million over the course of FY2018 through FY2022, as compared to the current food packages.
Different CPI Inflation Scenarios
The CVV inflation rate depends on the baseline CPI value to which all subsequent years are compared. In the primary analysis, actual inflation rates were available through FY2017; values thereafter are projections. The CPI value assigned to FY2018 has significant implications, as it is expected to serve as the new CVV inflation baseline for the revised food packages. Based on Economic Research Service forecast (USDA/ERS, 2016), the committee estimated a 1.5 percent relative change in average CPI from FY2017 to FY2018 and in each year thereafter.
Table U-21 presents the cost differences of changing these assumptions about relative change in CPI values.20 In scenario 1, a higher relative change in just FY2018 (relative increase of 5 percent rather than 1.5 percent) leads to an additional $34.1 million in savings from FY2018 through FY2022, resulting in an estimated total cost savings of $255 million, as compared to the current food packages. When the base assumption inflation rate is maintained for FY2018, but increased to 5.0 percent in all subsequent years (scenario 2), the proposed revisions would decrease cost savings by $42.6 million over FY2018 through FY2022. Scenario 3 assumes a 5.0 percent inflation rate across all years, which would cost $19.8 million more than the total phased-in cost estimate of the primary analysis. In contrast, a 5.0 percent deflation from FY2017 to FY2018 followed by inflation of 1.5 percent in each subsequent year (scenario 4) would cost an additional $130 million compared to the base assumptions in the primary analysis, over the course of FY2018 through FY2022. Finally, when the initial deflation assumption is followed by a higher relative inflation rate (5 percent rather than 1.5 percent; scenario 5), the total costs are approximately $229 million more than the total costs of the base assumptions for the revised food packages. This is the only tested CPI inflation scenario that results in the proposed revisions costing more than the current food packages during FY2018 through FY2022.
Another CPI inflation scenario assumption is the baseline year to which all subsequent years are compared in the revised food packages. Table U-22 explores the cost differences associated with different CPI base years for the revised food packages. In scenario 1, changing the base year to inflate the
__________________
20 The CPI values presented in this section are relative to the immediately preceding year. Increasing or decreasing the CPI value in one year effects all subsequent years.
revised CVV FY2015 would cost an additional $128 million over FY2018 through FY2022, as compared to using FY2018 as the base year. Both scenarios 2 and 3 demonstrate that there are relatively small costs effects of selecting either FY2016 or FY2017 as the base year for CVV inflation in the revised food packages.
Different Levels of Substitution for CVV
Under the proposed revisions, food package II recipients can receive a $10 (“partial substitution”) or a $20 (“full substitution”) CVV in lieu of the 64 ounces and 128 ounces of jarred infant food vegetables and fruits, respectively. To maintain cost neutrality, the committee selected the dollar value of the CVVs based on estimated FY2015 prices of jarred infant food vegetables and fruits. The base assumptions in the primary analysis, however, project slightly higher redemption of CVVs compared to jarred infant food vegetables and fruits. Furthermore, jarred infant food vegetables and fruits inflate differently than the CVV. While jarred infant food vegetables and fruits are projected to progressively inflate between FY2018 and FY2022, the CVV value prescribed to participants does not adjust until FY2022, when the $20 CVV inflates to $21.
The base assumption in the primary analysis is that 0 percent of participants select the CVV substitution option. Table U-23 summarizes the cost effects of different levels of partial and full substitution of jarred infant food vegetables and fruits. Given the redemption and inflation assumptions, substitutions of jarred infant food vegetables and fruits with CVVs initially cost slightly more but eventually lead to additional cost savings beginning in FY2020. The net cost effect of substitution for CVVs in food package II are $5.1 million (scenario 1, 50 percent of infants selecting partial substitution) to $11.4 million (scenario 4, 100 percent selecting full substitution) of additional savings, as compared to the base assumption of no substitution in the revised food packages.
Under the proposed revisions, a $3 CVV can be substituted for the 64 ounces of juice prescribed in children’s and women’s food packages. The CVV amount was the closest dollar increment to the estimated cost of 64 fluid ounces of juice based on FY2015 prices, which was estimated to be $3.15. In contrast to jarred infant food vegetables and fruits, the redemption rate of juice is projected to be slightly higher than the overall redemption rate of the CVV. The cumulative effect of the slightly lower price and projected redemption means that, under the assumptions of the analysis, substituting a CVV for the juice prescription would lead to increased cost savings (see Table U-24).
TABLE U-21 Projected Phased-in Cost Difference of WIC Food Package Revisions, Assuming Different Consumer Price Index Inflation Rates Used to Inflate the Revised CVV
| Scenario | Relative Change in CPI Used to Inflate Revised CVV Assumptions, Inflation Ratea | Phased-in Cost Differences of the Revised Food Packages Compared to Current Food Packages ($, millions)b | |||||||||
|---|---|---|---|---|---|---|---|---|---|---|---|
| FY2018 | FY2019 | FY2020 | FY2021 | FY2022 | FY2018 | FY2019 | FY2020 | FY2021 | FY2022 | Total Difference, FY2018 Through FY2022 | |
| Base assumptionc | 1.015 | 1.015 | 1.015 | 1.015 | 1.015 | −6.4 | −14.8 | −47.7 | −65.0 | −86.6 | −220.4 |
| Uncertainty scenario 1c | 1.050 | 1.015 | 1.015 | 1.015 | 1.015 | −6.4 | −14.8 | −64.7 | −82.0 | −86.6 | −254.5 |
| Cost difference of base assumption as compared to uncertainty scenario 1d | 0.0 | 0.0 | +17.0 | +17.1 | 0.0 | +34.1 | |||||
| Base assumptionc | 1.015 | 1.015 | 1.015 | 1.015 | 1.015 | −6.4 | −14.8 | −47.7 | −65.0 | −86.6 | −220.4 |
| Uncertainty scenario 2c | 1.015 | 1.050 | 1.050 | 1.050 | 1.050 | −6.4 | −13.6 | −45.8 | −62.3 | −49.8 | −177.9 |
| Cost difference of base assumption as compared to uncertainty scenario 2d | 0.0 | −1.2 | −1.9 | −2.7 | −36.8 | −42.6 | |||||
| Base assumptionc | 1.015 | 1.015 | 1.015 | 1.015 | 1.015 | −6.4 | −14.8 | −47.7 | −65.0 | −86.6 | −220.4 |
| Uncertainty scenario 3c | 1.050 | 1.050 | 1.050 | 1.050 | 1.050 | −6.4 | −19.3 | −45.8 | −62.3 | −66.8 | −200.6 |
| Cost difference of base assumption as compared to uncertainty scenario 3d | 0.0 | 4.5 | −1.9 | −2.7 | −19.7 | −19.8 | |||||
| Base assumptionc | 1.015 | 1.015 | 1.015 | 1.015 | 1.015 | −6.4 | −14.8 | −47.7 | −65.0 | −86.6 | −220.4 |
| Uncertainty scenario 4c | 0.950 | 1.015 | 1.015 | 1.015 | 1.015 | −0.1 | −2.0 | +7.9 | −26.4 | −69.5 | −90.1 |
| Cost difference of base assumption as compared to uncertainty scenario 4d | −6.3 | −12.8 | −55.6 | −38.6 | −17.1 | −130.4 | |||||
| Base assumptionc | 1.015 | 1.015 | 1.015 | 1.015 | 1.015 | −6.4 | −14.8 | −47.7 | −65.0 | −86.6 | −220.4 |
| Uncertainty scenario 5c | 0.950 | 1.050 | 1.050 | 1.050 | 1.050 | −0.1 | −0.8 | +9.8 | −6.7 | +5.9 | +8.2 |
| Cost difference of base assumption as compared to uncertainty scenario 5d | −6.3 | −14.0 | −57.5 | −58.3 | −92.5 | −228.6 |
NOTES: This table shows the phased-in cost difference between the revised and current food packages, along with the cost differences between different CVV CPI inflation assumptions and the current food packages. The primary analysis of the RIA assumes that the CPI for fresh fruits and vegetables will increase 1.5 percent relative to each preceding year, from FY2018 through FY2022. The uncertainty scenarios test different relative change values and patterns of relative change. All other assumptions in the primary analysis remain constant. Column and row totals may not be exact owing to independent rounding. CPI = Consumer Price Index; CVV = cash value voucher.
a Inflation rates describe the relative change in prices compared to the preceding year. Values greater than 1 indicate prices increased; values less than 1 indicate prices decreased.
b Phased-in estimates assume full implementation of the proposed revisions in state agencies serving one-third of all WIC participants as of April 1, 2018. All other state agencies are assumed to implement the proposed revisions as of FY2020.
c Describes the increases or savings of the base assumption or uncertainty scenario (“assumption scenario”) as compared to the current food packages. Negative values (−) indicate that the assumption scenario costs less than the current food packages. Positive values (+) indicate that the assumption scenario costs more than the current food packages.
d Describes the increases or savings of the base assumption as compared to the uncertainty scenario. Negative values (−) indicate that the base assumption costs less than the uncertainty assumption. Positive values (+) indicate that the base assumption costs more than the uncertainty scenario.
TABLE U-22 Projected Phased-in Cost Difference of WIC Food Package Revisions, Changing the Base Comparison Year for CVV Inflation
| Scenario | Base Year for CVV Inflation in the Revised Food Packages | Phased-in Cost Differences of the Revised Food Packages Compared to Current Food Packages ($, millions)a | |||||
|---|---|---|---|---|---|---|---|
| FY2018 | FY2019 | FY2020 | FY2021 | FY2022 | Total Cost Difference, FY2018 Through FY2022 | ||
| Base assumptionb | FY2018 | −6.4 | −14.8 | −47.7 | −65.0 | −86.6 | −220.4 |
| Uncertainty scenario 1b | FY2015 | −5.8 | −13.6 | −31.1 | −8.6 | −32.4 | −91.6 |
| Cost difference of base assumption as compared to uncertainty scenario 1c | −0.6 | −1.2 | −16.6 | −56.4 | −54.1 | −128.8 | |
| Base assumptionb | FY2018 | −6.4 | −14.8 | −47.7 | −65.0 | −86.6 | −220.4 |
| Uncertainty scenario 2b | FY2016 | −6.4 | −14.0 | −46.5 | −62.6 | −72.3 | −201.8 |
| Cost difference of base assumption as compared to uncertainty scenario 2c | 0.0 | −0.8 | −1.2 | −2.3 | −14.3 | −18.6 | |
| Base assumptionb | FY2018 | −6.4 | −14.8 | −47.7 | −65.0 | −86.6 | −220.4 |
| Uncertainty scenario 3b | FY2017 | −6.4 | −14.0 | −46.5 | −62.6 | −73.8 | −203.4 |
| Cost difference of base assumption as compared to uncertainty scenario 3c | 0.0 | −0.8 | −1.2 | −2.3 | −12.8 | −17.1 |
NOTES: This table shows the phased-in cost difference between the revised and current food packages, along with the cost differences between different base years for CVV inflation and the current food packages. The primary analysis of the RIA assumes that the base year of the CVV inflation is FY2018. All other assumptions in the primary analysis remain constant. Column and row totals may not be exact owing to independent rounding. CVV = cash value voucher.
a Phased-in estimates assume full implementation of the proposed revisions in state agencies serving one-third of all WIC participants as of April 1, 2018. All other state agencies are assumed to implement the proposed revisions as of FY2020.
b Describes the increases or savings of the base assumption or uncertainty scenario (“assumption scenario”) as compared to the current food packages. Negative values (−) indicate that the assumption scenario costs less than the current food packages. Positive values (+) indicate that the assumption scenario costs more than the current food packages.
c Describes the increases or savings of the base assumption as compared to the uncertainty scenario. Negative values (−) indicate that the base assumption costs less than the uncertainty assumption. Positive values (+) indicate that the base assumption costs more than the uncertainty scenario.
TABLE U-23 Projected Phased-in Cost Difference of WIC Food Package Revisions, Changing Assumptions About Substitution of Cash Value Vouchers for Jarred Infant Food Vegetables and Fruits
| Scenarios | Jarred Infant Food Vegetables and Fruit, Percent of Participants Substituting for CVVa | Phased-in Cost Differences of the Revised Food Packages Compared to Current Food Packages ($, millions)b | |||||
|---|---|---|---|---|---|---|---|
| FY2018 | FY2019 | FY2020 | FY2021 | FY2022 | Total Cost Difference, FY2018 Through FY2022 | ||
| Base assumptionc | 0 | −6.4 | −14.8 | −47.7 | −65.0 | −86.6 | −220.4 |
| Uncertainty scenario 1c | 50 (partial) | −6.2 | −14.7 | −48.4 | −66.8 | −89.4 | −225.6 |
| Cost difference of base assumption as compared to uncertainty scenario 1d | −0.2 | −0.1 | +0.7 | +1.8 | +2.9 | +5.1 | |
| Base assumptionc | 0 | −6.4 | −14.8 | −47.7 | −65.0 | −86.6 | −220.4 |
| Uncertainty scenario 2c | 100 (partial) | −6.0 | −14.7 | −49.1 | −68.6 | −92.3 | −230.7 |
| Cost difference of base assumption as compared to uncertainty scenario 2d | −0.4 | −0.1 | +1.4 | +3.6 | +5.8e | +10.3e | |
| Base assumptionc | 0 | −6.4 | −14.8 | −47.7 | −65.0 | −86.6 | −220.4 |
| Uncertainty scenario 3c | 50 (full) | −6.0 | −14.7 | −49.1 | −68.6 | −87.8 | −226.1 |
| Cost difference of base assumption as compared to uncertainty scenario 3d | −0.4 | −0.1 | +1.4 | +3.6 | +1.2e | +5.7e | |
| Base assumptionc | 0 | −6.4 | −14.8 | −47.7 | −65.0 | −86.6 | −220.4 |
| Uncertainty scenario 4c | 100 (full) | −5.7 | −14.5 | −50.6 | −72.1 | −89.0 | −231.8 |
| Cost difference of base assumption as compared to uncertainty scenario 4d | −0.8 | −0.3 | +2.9 | +7.2 | +2.4 | +11.4 | |
| Base assumptionc | 0 | −6.4 | −14.8 | −47.7 | −65.0 | −86.6 | −220.4 |
| Uncertainty scenario 5c | 25 (partial), 25 (full) | −6.1 | −14.7 | −48.8 | −67.7 | −88.6 | −225.8 |
| Cost difference of base assumption as compared to uncertainty scenario 5d | −0.3 | −0.1 | +1.1 | +2.7 | +2.0 | +5.4 |
NOTES: This table shows the phased-in cost difference between the revised and current food packages, along with the cost differences of different assumptions regarding jarred infant food vegetables and fruits substitution for CVV. All other assumptions in the primary analysis remain constant. Column and row totals may not be exact owing to independent rounding. CVV = cash value voucher.
a Under the proposed revisions, 64 oz of jarred infant food vegetables and fruits can be substituted for a $10 CVV (“partial”) and all 128 oz can be substituted for a $20 CVV (“full”). Values in the column correspond to the percent of food package II recipients that choose to be prescribed a CVV instead of the jarred infant food vegetables and fruits.
b Phased-in estimates assume full implementation of the proposed revisions in state agencies serving one-third of all WIC participants as of April 1, 2018. All other state agencies are assumed to implement the proposed revisions as of FY2020.
c Describes the increases or savings of the base assumption or uncertainty scenario (“assumption scenario”) as compared to the current food packages. Negative values (−) indicate that the assumption scenario costs less than the current food packages. Positive values (+) indicate that the assumption scenario costs more than the current food packages.
d Describes the increases or savings of the base assumption as compared to the uncertainty scenario. Negative values (−) indicate that the base assumption costs less than the uncertainty assumption. Positive values (+) indicate that the base assumption costs more than the uncertainty scenario.
e Cost differences for 100 percent of food package II recipients opting for partial substitution and cost difference for 50 percent of food package II recipients opting for full substitution are not identical because of CVV inflation assumptions. The $20 CVV prescribed to recipients opting for full substitution is projected to inflate in FY2022 to a level in which the value prescribed would increase to $21. The $10 CVV is not projected to inflate to $11 during this time period.
TABLE U-24 Projected Phased-in Cost Difference of WIC Food Package Revisions, Changing Assumptions About Substitution of Cash Value Vouchers for Juice
| Scenario | Juice, Percent of Participants Substituting for CVVa | Phased-in Cost Differences of the Revised Food Packages Compared to Current Food Packages ($, millions)b | |||||
|---|---|---|---|---|---|---|---|
| FY2018 | FY2019 | FY2020 | FY2021 | FY2022 | Total Cost Difference, FY2018 Through FY2022 | ||
| Base assumptionc | 0 | −6.4 | −14.8 | −47.7 | −65.0 | −86.6 | −220.4 |
| Uncertainty scenario 1c | 50 | −8.4 | −19.5 | −63.6 | −83.0 | −106.7 | −281.2 |
| Cost difference of base assumption as compared to uncertainty scenario 1d | +2.0 | +4.7 | +15.9 | +18.1 | +20.2 | +60.8 | |
| Base assumptionc | 0 | −6.4 | −14.8 | −47.7 | −65.0 | −86.6 | −220.4 |
| Uncertainty scenario 2c | 100 | −10.5 | −24.2 | −79.5 | −101.1 | −126.9 | −342.1 |
| Cost difference of base assumption as compared to uncertainty scenario 2d | +4.1 | +9.4 | +31.8 | +36.1 | +40.3 | +121.6 | |
NOTES: This table shows the phased-in cost difference between the revised and current food packages, along with the cost differences of different assumptions regarding jarred infant food vegetables and fruits substitution for CVV. All other assumptions in the primary analysis remain constant. Column and row totals may not be exact owing to independent rounding. CVV = cash value voucher.
a Under the proposed revisions, 64 fl oz of juice prescribed to women and children can be substituted for a $3 CVV. Values in the column correspond to the percent of women and children that choose to be prescribed a CVV instead of the juice.
b Phased-in estimates assume full implementation of the proposed revisions in state agencies serving one-third of all WIC participants as of April 1, 2018. All other state agencies are assumed to implement the proposed revisions as of FY2020.
c Describes the increases or savings of the base assumption or uncertainty scenario (“assumption scenario”) as compared to the current food packages. Negative values (−) indicate that the assumption scenario costs less than the current food packages. Positive values (+) indicate that the assumption scenario costs more than the current food packages.
d Describes the increases or savings of the base assumption as compared to the uncertainty scenario. Negative values (−) indicate that the base assumption costs less than the uncertainty assumption. Positive values (+) indicate that the base assumption costs more than the uncertainty scenario.
Assumptions About Use of “Up to” Amounts
The primary analysis assumes that infant formula prescription practices will remain unchanged between the current and revised food packages. Table U-25 projects the cost effects of different formula prescription practices for the revised food packages. In Scenario 1, prescribing all infants in food package I-BF/FF-A the maximum “up to” amount of infant formula would result in approximately $20 million in additional costs in the revised food packages, over the course of FY2018 through FY2022, as compared to the base assumption used in the primary analysis. The revised food packages would still be projected to cost approximately $201 million less than the current food packages, over the course of FY2018 through FY2022. In contrast, if the average amount of infant formula prescribed across all food packages was 95 percent of the maximum “up to” amount for each food package (scenario 2), the total cost savings of the revised food packages would increase by $145 million over the course of the FY2018 through FY2022, as compared to the base assumption used in the primary analysis. This would result in an estimated $366 million in total savings as compared to the current food packages.
Assumptions About Shifts in Fully Formula-Fed Dyads
A key assumption of the primary analysis is that, under the proposed revisions, 5 percent of fully formula-fed mother–infant dyads will shift to corresponding fully (mostly) breastfeeding food packages. The committee considered the 5 percent shift conservative, given evidence that the 2009 food package, which allowed women to either choose between formula-feeding or fully breastfeeding in the infant’s first month of life, resulted in an approximately 7 to 11 percent shift of dyads from breastfeeding to formula-feeding (USDA/FNS, 2011).
Table U-26 presents the cost effect of this assumption. The cost differences only affect FY2021 and FY2022, because the base assumption is that the shift would occur 1 year after full implementation in all state agencies under the phased-in implementation scheme. Assuming no shift in participants in the revised food packages (scenario 1) would cost approximately $25 million more over the course of FY2018 through FY2022, as compared to the assumption of a 5 percent shift. A 3 percent shift of participants would decrease estimated total cost savings by $9.9 million (scenario 2), while an 8 percent shift would increase estimated total cost savings by $14.8 million (scenario 3), as compared to the base assumption in the primary analysis. If the shift only occurs for infants less than 6 months old and women less than 6 months postpartum, the estimated total cost savings of
TABLE U-25 Projected Phased-in Cost Difference of WIC Food Package Revisions, Changing the Maximum Amount of Formula in Food Packages I and II
| Scenario | Maximum Formula Assumption, Amount Change | Phased-in Cost Differences of the Revised Food Packages Compared to Current Rule ($, millions)a | |||||
|---|---|---|---|---|---|---|---|
| FY2018 | FY2019 | FY2020 | FY2021 | FY2022 | Total Cost Difference, FY2018 Through FY2022 | ||
| Base assumptionc | Identical to Current Food Packageb | −6.4 | −14.8 | −47.7 | −65.0 | −86.6 | −220.4 |
| Uncertainty scenario 1c | All I-BF/FF-A recipients prescribed maximum “up to” amount | −5.6 | −13.1 | −42.6 | −58.8 | −80.3 | −200.5 |
| Cost difference of base assumption as compared to uncertainty scenario 1d | −0.8 | −1.6 | −5.1 | −6.1 | −6.3 | −19.9 | |
| Base assumptionc | Identical to Current Food Packageb | −6.4 | −14.8 | −47.7 | −65.0 | −86.6 | −220.4 |
| Uncertainty scenario 2c | 95% of maximum “up to” amounts | −13.0 | −28.5 | −89.6 | −105.9 | −128.5 | −365.5 |
| Cost difference of base assumption as compared to uncertainty scenario 2d | +6.6 | +13.7 | +41.9 | +41.0 | +41.9 | +145.1 | |
NOTES: This table shows the phased-in cost difference between the proposed revisions and the current rule, along with the cost differences of different assumptions regarding the maximum amount of formula in food packages I and II. All other assumptions in the primary analysis remain constant. Column and row totals may not be exact owing to independent rounding.
a Phased-in estimates assume full implementation of the proposed revisions in state agencies serving one-third of all WIC participants as of April 1, 2018. All other state agencies are assumed to implement the proposed revisions as of FY2020.
b Base assumptions for maximum formula under the proposed revisions are as follows: I-BF/FF-A (104 fl oz), I-BF/FF-B (424 fl oz), I-BF/FF-C (510 fl oz), I-FF-A (861 fl oz), I-FF-B (948 fl oz), II-BF/FF (371 fl oz), II-FF (683 fl oz). The formula amounts are the weighted average of the monthly maximum allowances across the different forms of infant formula. The base assumption is that the quantity of formula prescribed will remain unchanged.
c Describes the increases or savings of the base assumption or uncertainty scenario (“assumption scenario”) as compared to the current food packages. Negative values (−) indicate that the assumption scenario costs less than the current food packages. Positive values (+) indicate that the assumption scenario costs more than the current food packages.
d Describes the increases or savings of the base assumption as compared to the uncertainty scenario. Negative values (−) indicate that the base assumption costs less (provides more savings) than the uncertainty assumption. Positive values (+) indicate that the base assumption costs more than the uncertainty scenario.
TABLE U-26 Projected Phased-in Cost Difference of WIC Food Package Revisions, Changing Assumptions About Percent of Fully Formula-Fed Dyads Shift to Partially (Mostly) Breastfed Food Packages
| Scenario | Dyadic Shift Assumption, Percent of Fully Formula-Fed Projected to Shifta | Phased-in Cost Differences of the Revised Food Packages Compared to Current Food Packages ($, millions)b | |||||
|---|---|---|---|---|---|---|---|
| FY2018 | FY2019 | FY202 | FY2021 | FY2022 | Total Cost Difference, FY2018 Through FY2022 | ||
| Base assumptionc | 5 | −6.4 | −14.8 | −47.7 | −65.0 | −86.6 | −220.4 |
| Uncertainty scenario 1c | 0 | −6.4 | −14.8 | −47.7 | −52.8 | −74.0 | −195.7 |
| Cost difference of base assumption as compared to uncertainty scenario 1d | 0.0 | 0.0 | 0.0 | −12.1 | −12.5 | −24.7 | |
| Base assumptionc | 5 | −6.4 | −14.8 | −47.7 | −65.0 | −86.6 | −220.4 |
| Uncertainty scenario 2c | 3 | −6.4 | −14.8 | −47.7 | −60.1 | −81.5 | −210.6 |
| Cost difference of base assumption as compared to uncertainty scenario 2d | 0.0 | 0.0 | 0.0 | −4.9 | −5.0 | −9.9 | |
| Base assumptionc | 5 | −6.4 | −14.8 | −47.7 | −65.0 | −86.6 | −220.4 |
| Uncertainty scenario 3c | 8 | −6.4 | −14.8 | −47.7 | −72.2 | −94.1 | −235.2 |
| Cost difference of base assumption as compared to uncertainty scenario 3d | 0.0 | 0.0 | 0.0 | +7.3 | +7.5 | +14.8 | |
| Base assumptionc | 5 | −6.4 | −14.8 | −47.7 | −65.0 | −86.6 | −220.4 |
| Uncertainty scenario 4c | 5 (only dyads <6-months postpartum)d | −6.4 | −14.8 | −47.7 | −57.5 | −78.9 | −205.30 |
| Cost difference of base assumption as compared to uncertainty scenario 4d | 0.0 | 0.0 | 0.0 | −7.5 | −7.7 | −15.1 |
NOTES: This table shows the phased-in cost difference between the revised and current food packages, along with the cost differences of different assumptions regarding the percent of fully formula-fed mother–infant dyads shifting to partially (mostly) breastfeeding food packages. All other assumptions in the primary analysis remain constant. Column and row totals may not be exact owing to independent rounding.
a The shift describes the percent of participants prescribed food package I-FF-A, I-FF-B, II-FF, VI, and N/A shifting to corresponding partially (mostly) breastfeeding food packages. Approximately 21 and 79 percent of participants shifting from food package I-FF-A were assigned to food packages I-BF/FF-A and I-BF/FF-B, respectively. All women shifting from being classified as more than 6-months postpartum (i.e., food package N/A) were assigned to food package V-B. The shift is projected to occur in the year after full implementation of the proposed revisions (FY2021). The effect on participation is expected to be sustained but additional shifts are not projected in subsequent years.
b Phased-in estimates assume full implementation of the proposed revisions in state agencies serving one-third of all WIC participants as of April 1, 2018. All other state agencies are assumed to implement the proposed revisions as of FY2020.
c Describes the increases or savings of the base assumption or uncertainty scenario (“assumption scenario”) as compared to the current food packages. Negative values (–) indicate that the assumption scenario costs less than the current food packages. Positive values (+) indicate that the assumption scenario costs more than the current food packages.
d Describes the increases or savings of the base assumption as compared to the uncertainty scenario. Negative values (–) indicate that the base assumption costs less (provides more savings) than the uncertainty assumption. Positive values (+) indicate that the base assumption costs more than the uncertainty scenario.
the revised food packages would decrease by $15.1 million over the course of FY2018 through FY2022, as compared to the base assumption.
Assumption About Milk Redemption
Milk and its associated substitutions and allowable options play a key role in the projected differences between the revised and current food packages. Under the proposed revisions, the projected redemption for milk increased by varying degrees because of different initial redemption estimates, the increase in the amount of yogurt allowed as a substitution, the reduction in the amount prescribed (excluding food package VI), and substitution options that eliminate the dangling quart of milk. Table U-27 evaluates the cost implications of increases and decreases in projected milk redemption. If the projected redemption rates were each underestimated by 5 percentage points (scenario 1), the proposed revisions would cost $21.8 million more than the current food packages over the course of FY2018 through FY2022. In contrast, lower redemptions of milk would lead to greater cost savings under the proposed revisions (scenarios 2 and 3).
ALTERNATIVES
The committee considered several alternatives to current food package items and amounts that were ultimately rejected. Some of these alternatives and the committee’s rationale for not including them in the revised food packages are outlined in the sections that follow. As with the uncertainty scenarios, the “primary analysis” refers to the set of base assumptions that led to a total phased-in cost savings of $220 million for the revised food packages as compared to the current food packages, over the course of FY2018 through FY2022.
For each alternative tested, the phased-in cost differences are presented. The phased-in cost differences presented for each scenario (i.e., base assumption, each alternative) indicate the cost effect as it relates to the current food packages. Negative values (−) indicate the specific scenario costs less than the current food packages, while a positive value (+) indicates the specific scenario costs more than the current food packages. The cost difference between the base assumption and the alternative are also presented. These describe how much the base assumption costs or saves, as compared to the tested alternative. For these differences, a negative value (−) indicates the base assumption used in the primary analysis costs less than the alternative; a positive value (+) indicates the base assumption costs more than the alternative. This section presents select alternatives tested by the committee.
More Canned Fish
To support the DGA’s recommendation to increase seafood intake, the committee proposes adding canned fish to all children’s and women’s food packages and offering it as a substitution option for jarred infant food meat. To maintain cost neutrality and create incentives for partially (mostly) and fully breastfeeding women, different quantities and rotation patterns were created for canned fish. The amount prescribed in food packages IV-A, IV-B, V-A, and VI are relatively low compared to the DGA recommended intake. Table U-28 shows the cost effects of prescribing additional canned fish to these food packages. Increasing the prescribed amount to 20 ounces every 3 months for these food packages (alternative 1) costs approximately $122 million more than the base assumption. Alternative 1 would be considered cost neutral from FY2018 through FY2022, as the total food package costs would be approximately $99 million less than the projected costs for the current food packages (from FY2018 through FY2022). However, the parameter of cost neutrality the committee was operating under was plus or minus $0.10 per-participant cost per month, based on FY2015 prices. When 20 ounces of canned fish every 3 months is used in this pricing scenario, the revised food packages would cost $0.37 more per-participant per month than the current food packages. Alternative 2 shows that 10 ounces per month in the food packages would cost approximately $23 million more than the current food packages.
Maintain the 16-Ounce Requirement for Whole Wheat Bread
Based on available data to the committee, the 16- to 24-ounce whole wheat bread and allowable options will cost more per ounce than the 16 ounces authorized in the current food packages. Allowing the range of sizes and simultaneously decreasing the total number of ounces prescribed to food package IV recipient helped the committee to arrive at a cost neutral food package. Table U-29 shows the cost implications of maintaining the current whole wheat bread regulations as they exist in the current food packages. This alternative would cost an estimated $154 million more than the base assumptions for the revised food packages. While keeping the 16-ounce requirement would be cost neutral compared to the current food packages (approximately $67 million less than the current food packages over the course of FY2018 through FY2022), the committee considered two factors as benefits that are anticipated to increase redemption: (1) the ease of shopping for participant with the range of authorized bread sizes, and (2) the expansion of stocking options for vendors.
TABLE U-27 Projected Phased-in Cost Difference of WIC Food Package Revisions, Changing Assumptions About Percent of Fully Formula-Fed Dyads Shift to Partially (Mostly) Breastfed Food Packages
| Scenario | Milk Redemption Assumption, Percent Point Changea | Phased-in Cost Differences of the Revised Food Packages Compared to Current Food Packages ($, millions)b | |||||
|---|---|---|---|---|---|---|---|
| FY2018 | FY2019 | FY2020 | FY2021 | FY2022 | Total Cost Difference, FY2018 Through FY2022 | ||
| Base assumptionc | d | −6.4 | −14.8 | −47.7 | −65.0 | −86.6 | −220.4 |
| Uncertainty scenario 1c | +5 | +4.3 | +7.4 | +20.4 | +4.80 | −15.1 | +21.8 |
| Cost difference of base assumption as compared to uncertainty scenario 1e | −10.7 | −22.2 | −68.1 | −69.8 | −71.5 | −242.2 | |
| Base assumptionc | d | −6.4 | −14.8 | −47.7 | −65.0 | −86.6 | −220.4 |
| Uncertainty scenario 2c | −5 | −17.2 | −37.0 | −115.8 | −134.7 | −158.0 | −462.7 |
| Cost difference of base assumption as compared to uncertainty scenario 2e | +10.7 | +22.2 | +68.1 | +69.8 | +71.4 | +242.2 | |
| Base assumptionc | d | −6.4 | −14.8 | −47.7 | −65.0 | −86.6 | −220.4 |
| Uncertainty scenario 3c | −10 | −27.9 | −59.2 | −183.9 | −204.5 | −229.4 | −704.9 |
| Cost difference of base assumption as compared to uncertainty scenario 3e | +21.5 | +44.4 | +136.2 | +139.5 | +142.9 | +484.5 | |
NOTES: This table shows the phased-in cost difference between the revised and current food packages, along with the cost differences of different assumptions regarding the redemption of milk and associated substitutions and allowable options. All other assumptions in the primary analysis remain constant. Column and row totals may not be exact owing to independent rounding.
a The term “milk” encompasses substitutions and allowable options, including cheese, yogurt, soy beverage, and tofu. The redemption assumptions are applied to the food package-specific milk composite price.
b Phased-in estimates assume full implementation of the proposed revisions in state agencies serving one-third of all WIC participants as of April 1, 2018. All other state agencies are assumed to implement the proposed revisions as of FY2020.
c Describes the increases or savings of the base assumption or uncertainty scenario (“assumption scenario”) as compared to the current food packages. Negative values (–) indicate that the assumption scenario costs less than the current food packages. Positive values (+) indicate that the assumption scenario costs more than the current food packages.
d Base assumptions for the redemption rates of milk under the proposed revisions are as follows: IV-A (87.00 percent), IV-B (79.53 percent), V-A and V-B (65.61 percent), VI (58.54 percent) and VII (67.96 percent). All tested uncertainty scenarios added and subtracted a set value from each of the redemption rates.
e Describes the increases or savings of the base assumption as compared to the uncertainty scenario. Negative values (–) indicate that the base assumption costs less (provides more savings) than the uncertainty assumption. Positive values (+) indicate that the base assumption costs more than the uncertainty scenario.
TABLE U-28 Projected Phased-in Cost Difference of WIC Food Package Revisions, Prescribing Additional Fish to Food Packages IV-A, IV-B, V-A, and VI
| Scenario | Quantity of Fish Prescribed to Food Packages IV-A, IV-B, V-A, and VI | Phased-in Cost Differences of the Revised Food Packages Compared to Current Food Packages ($, millions)a | |||||
|---|---|---|---|---|---|---|---|
| FY2018 | FY2019 | FY2020 | FY2021 | FY2022 | Total Cost Difference, FY2018 Through FY2022 | ||
| Base assumptionb | 10 oz once every 3 months | −6.4 | −14.8 | −47.7 | −65.0 | −86.6 | −220.4 |
| Alternative 1b | 20 oz once every 3 months | −1.0 | −3.6 | −13.4 | −30.0 | −50.8 | −98.8 |
| Cost difference of base assumption as compared to alternative 1c | −5.4 | −11.2 | −34.3 | −35.0 | −35.8 | −121.6 | |
| Base assumption b | 10 oz once every 3 months | −6.4 | −14.8 | −47.7 | −65.0 | −86.6 | −220.4 |
| Alternative 2b | 10 oz per month | 4.4 | 7.6 | 20.9 | 4.9 | −15.0 | 22.8 |
| Cost difference of base assumption as compared to alternative 2c | −10.8 | −22.4 | −68.6 | −69.9 | −71.6 | −243.2 | |
NOTES: This table shows the phased-in cost difference between the revised and current food packages, along with the cost differences of alternative quantities of canned fish prescribed to participants receiving food packages IV-A, IV-B, V-A, and VI. All other assumptions in the primary analysis remain constant. Column and row totals may not be exact owing to independent rounding.
a Phased-in estimates assume full implementation of the proposed revisions in state agencies serving one-third of all WIC participants as of April 1, 2018. All other state agencies are assumed to implement the proposed revisions as of FY2020.
b Describes the increases or savings of the base assumption or alternative as compared to the current food packages. Negative values (−) indicate that the base assumption or alternative costs less than the current food packages. Positive values (+) indicate that the base assumption or alternative costs more than the current food packages.
c Describes the increases or savings of the base assumption as compared to the alternative. Negative values (−) indicate that the base assumption costs less (provides more savings) than the uncertainty assumption. Positive values (+) indicate that the base assumption costs more than the uncertainty scenario.
TABLE U-29 Projected Phased-in Cost Difference of WIC Food Package Revisions, Maintaining the 16-Ounce Whole Wheat Bread Requirement
| Scenario | Bread Prescription and Specification for Food Packages IV-A, IV-B, V-A, V-B, and VII | Phased-in Cost Differences of the Revised Food Packages Compared to Current Food Packages ($, millions)a | |||||
|---|---|---|---|---|---|---|---|
| FY2018 | FY2019 | FY2020 | FY2021 | FY2022 | Total Cost Difference, FY2018 Through FY2022 | ||
| Base assumptionb | All are prescribed 16–24 oz per month | −6.4 | −14.8 | −47.7 | −65.0 | −86.6 | −220.4 |
| Alternativeb | Women are prescribed 16 oz per month; children are prescribed 32 oz (two 16 oz) per month | +0.4 | −0.7 | −4.3 | −20.7 | −41.3 | −66.5 |
| Cost difference of base assumption as compared to alternativec | −6.8 | −14.2 | −43.4 | −44.3 | −45.3 | −153.9 | |
NOTES: This table shows the phased-in cost difference between the revised and current food packages, along with the cost differences of alternative quantities of whole wheat bread prescribed to participants receiving food packages IV-A, IV-B, V-A, V-B and VII. All other assumptions in the primary analysis remain constant. Column and row totals may not be exact owing to independent rounding.
a Phased-in estimates assume full implementation of the proposed revisions in state agencies serving one-third of all WIC participants as of April 1, 2018. All other state agencies are assumed to implement the proposed revisions as of FY2020.
b Describes the increases or savings of the base assumption or alternative as compared to the current food packages. Negative values (−) indicate that the base assumption or alternative costs less than the current food packages. Positive values (+) indicate that the base assumption or alternative costs more than the current food packages.
c Describes the increases or savings of the base assumption as compared to the alternative. Negative values (−) indicate that the base assumption costs less (provides more savings) than the uncertainty assumption. Positive values (+) indicate that the base assumption costs more than the uncertainty scenario.
Separate Vouchers for Vegetables and Fruits
Analyses presented in the DGA indicate that vegetable consumption across all age groups (ages 2 years and older) and fruit consumption among adolescents and adults do not currently meet the recommended intake ranges. The committee responded to these data by increasing the CVVs across all children’s and women’s food packages, and providing options for substituting food package items for a CVV. Given the shortfall in vegetable intake, in particular, the committee considered splitting the benefit into a vegetable CVV and a fruit CVV. Such a benefit would require state and local agencies to develop participant materials communicating why and how the benefits differ. Although this would create an opportunity to separately adjust vegetable and fruit prescriptions and encourage recipients to buy both vegetables and fruits, implementation would be challenging. USDA-FNS would need to provide state agencies with clear guidance on what items would qualify as a vegetable and which would qualify as a fruit. Vendors, particularly small vendors, would need clear guidance on how to implement such a classification into their systems. While these challenges are not insurmountable, the committee considered the simplicity of the
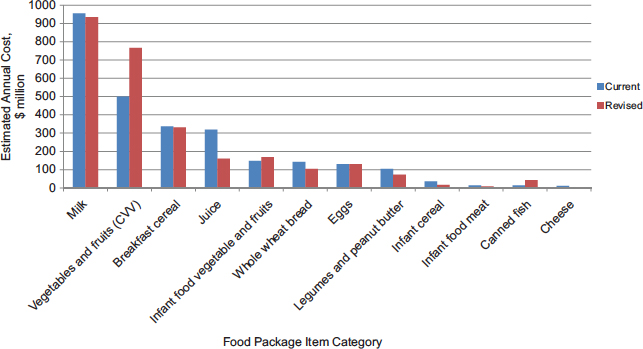
NOTES: The food package item categories encompass substitutions and allowable options. Estimates for the revised food packages include the 5 percent participant shift from the fully formula-fed mother–infant dyads to partially (mostly) breastfeeding food packages. Vegetables and fruits (CVV) estimates for the current food packages use $11 for all women’s food packages. CVV = cash value voucher.
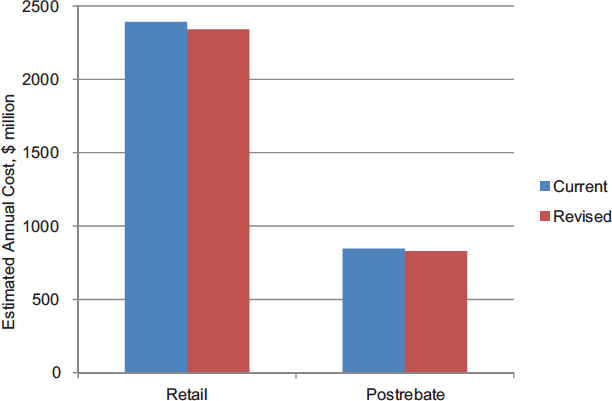
NOTES: Estimates for the revised food packages include the 5 percent participant shift from the fully formula-fed mother–infant dyads to partially (mostly) breastfeeding food packages.
single CVV more favorable in the proposed revised food packages at this time.
MARKET ANALYSIS
The food package revisions will result in changes in the quantities and types of foods that WIC participants buy with their WIC food benefit. While the market effects of the changes are difficult to accurately quantify, the committee expects them to be minor.
Based on the assumptions in the primary analysis, the committee estimated the total value of WIC sales for each food item using the quantities in the current and revised food packages for FY2015.21Figure U-1 shows the estimated sales for each category prescribed in the current food packages
__________________
21 To reflect current regulations, women’s CVV in this portion of the analysis is $11 for the current food package. The committee acknowledges that this inflation-based increase in CVV was not effective until FY2016. Using a $10 CVV for women in this portion of the analysis would result in the estimated annual cost of fruits and vegetables to be approximately $483 million for the current food package.
side-by-side with estimates for the revised package. Each food item represents the food item category, which encompasses assumptions about substitutions and allowable options within that category (e.g., yogurt and cheese substitution are included in the milk category). Estimated sales of infant formula using retail prices are presented in Figure U-2.
Changes in total sales are estimated to be relatively small for most food categories, with the possible exception of juice, vegetables and fruits, and milk. However, WIC sales of each of these categories are a small portion of the total retail market. The committee did not have access to data that would enable an estimate of total retail sales of WIC food categories. Instead, the analysis is based on the committee’s assessment of likely market effects using aggregate retail data available from the RIA conducted for the Interim Rule (7 C.F.R. § 246, 2007). The estimates presented in that RIA are summarized in Table U-30. WIC sales of juice were estimated to be 2 percent of the total retail juice market in the Interim Rule. WIC sales of vegetables and fruits were estimated to be 2.7 percent of the retail vegetable and fruit market. In the interim rule, sales of milk were estimated to be 4.4 percent of the retail milk market, and cheese sales were estimated to be 2 percent of the retail cheese market. While it is difficult to accurately gauge how sales of any individual product within that composite will be affected, data for the dairy products examined in the Interim Rule suggest that effects of the
TABLE U-30 Estimated Percent of the Market Attributed to WIC Sales, as Presented in the Interim Rule Regulatory Impact Analysis
| WIC Food Item | Estimated WIC Percent of the Market of the Interim Rule Food Packages Calendar Year 2005 | |
|---|---|---|
| Assuming No Substitutions | Assuming Full Substitution | |
| Formula | 65.5 | 56.3 |
| Beans | 8.9 | 9.5 |
| Peanut butter | 4.8 | 4.8 |
| Milk | 4.5 | 4.4 |
| Adult cereal | 4.1 | 4.1 |
| Juice | 2.0 | 2.0 |
| Vegetables and fruits | 2.7 | 2.7 |
| Eggs | 2.3 | 2.3 |
| Cheese | 2.0 | 2.0 |
| Bread | 0.5 | 0.6 |
| Canned fish | 0.6 | 0.6 |
SOURCE: 7 C.F.R. § 246, 2007.
proposed revisions will be small. The categories estimated to experience the largest changes in sales under the revised packages represent small shares of their respective total retail markets, and the committee expects minimal market effects as a consequence of the revision to the food package.
REFERENCES
AAP (American Academy of Pediatrics). 2014. Pediatric nutrition. 7th ed. Edited by R. E. Kleinman and F. R. Greer. Elk Grove Village, IL: American Academy of Pediatrics.
AHA (American Heart Association). 2015. Fish and omega-3 fatty acids. http://www.heart.org/HEARTORG/HealthyLiving/HealthyEating/HealthyDietGoals/Fish-and-Omega-3-Fatty-Acids_UCM_303248_Article.jsp (accessed August 30, 2016).
BLS (U.S. Bureau of Labor Statistics). 2013. The U.S. economy to 2022: Settling into a new normal. http://www.bls.gov/opub/mlr/2013/article/the-u-s-economy-to-2022-settlinginto-a-new-normal-16.htm (accessed October 3, 2016).
CBO (U.S. Congressional Budget Office). 2015. Supplemental Nutrition Assistance Program —CBO’s March 2015 baseline. https://www.cbo.gov/sites/default/files/51312-2015-03-SNAP.pdf (accessed October 3, 2016).
CDC (U.S. Centers for Disease Control and Prevention). 2015. National vital statistics system: Birth data. http://www.cdc.gov/nchs/births.htm (accessed December 21, 2016).
DHS (U.S. Department of Homeland Security). 2014. 2013 yearbook of immigration statistics. http://www.dhs.gov/publication/yearbook-2013 (accessed December 21, 2016).
FDA/EPA (U.S. Food and Drug Administration/Environmental Protection Agency). 2014. Fish: What pregnant women and parents should know. Silver Spring, MD: U.S. Food and Drug Administration. http://www.fda.gov/downloads/Food/FoodborneIllnessContaminants/Metals/UCM400358.pdf (accessed December 21, 2016).
HHS (U.S. Department of Health and Human Services). 2015. Healthy People 2020: Maternal, infant, and child health objectives. https://www.healthypeople.gov/2020/topics-objectives/topic/maternal-infant-and-child-health/objectives (accessed December 21, 2016).
IOM (Institute of Medicine). 2006. WIC food packages: Time for a change. Washington, DC: The National Academies Press.
NWA (National WIC Association). 2013. The role of WIC in public health. https://s3.amazonaws.com/aws.upl/nwica.org/WIC_Public_Health_Role.pdf (accessed December 21, 2016).
Oldways Whole Grain Council. 2015. Whole grain statistics. http://wholegrainscouncil.org/newsroom/whole-grain-statistics (accessed December 21, 2016).
USDA/ERS (U.S. Department of Agriculture/Economic Research Service). 2004. WIC and the retail price of infant formula. http://www.ers.usda.gov/media/330246/fanrr39-1_1_.pdf (accessed October 3, 2016).
USDA/ERS. 2005. Interstate variation in WIC food package costs: The role of food prices, caseload composition, and cost-containment practices. https://www.ers.usda.gov/publications/pub-details/?pubid=46844 (accessed March 26, 2017).
USDA/ERS. 2014. Transition to EBT in WIC: Review of impact and examination of participant redemption patterns: Final report. http://altarum.org/sites/default/files/uploaded-publication-files/Altarum_Transition%20to%20WIC%20EBT_Final%20Report_071614.pdf (accessed December 21, 2016).
USDA/ERS. 2016. Food price outlook—Consumer Price Index, changes in food price indexes, 2014 through 2017. http://www.ers.usda.gov/data-products/food-price-outlook.aspx (October 3, 2016).
USDA/FNS (U.S. Department of Agriculture/Food and Nutrition Service). 2006. Special Supplemental Nutrition Program for Women, Infants and Children (WIC): Revisions in the WIC food packages. Proposed Rule, 7 C.F.R. § 246.
USDA/FNS. 2007a. Special Supplemental Nutrition Program for Women, Infants and Children (WIC): Revisions in the WIC food packages. Interim Rule, 7 C.F.R. § 246.
USDA/FNS. 2007b. Special Supplemental Nutrition Program for Women, Infants and Children (WIC): Revisions in the WIC food packages; additional data for RIA. http://www.fns.usda.gov/sites/default/files/WICfoodpkg-additionaldataforRIA.pdf (accessed October 3, 2016).
USDA/FNS. 2007c. WIC participant and program characteristics 2006. http://www.fns.usda.gov/sites/default/files/pc2006.pdf (accessed December 21, 2016).
USDA/FNS. 2011. Evaluation of the birth month breastfeeding changes to the WIC food packages. http://www.fns.usda.gov/sites/default/files/BirthMonth.pdf (accessed December 21, 2016).
USDA/FNS. 2012. Special Supplemental Nutrition Program for Women, Infants, and Children (WIC) Erroneous Payments to Vendors: Annual Estimates for FY 2011. http://www.fns.usda.gov/sites/default/files/WICErroneousPayment_2011.pdf (accessed October 3, 2016).
USDA/FNS. 2013a. Breastfeeding promotion in WIC: Current federal requirements. http://www.fns.usda.gov/wic/breastfeeding-promotion-wic-current-federal-requirements (accessed October 3, 2016).
USDA/FNS. 2013b. Fiscal year 2010 WIC food cost report. http://www.fns.usda.gov/sites/default/files/WICFoodCost2010_0.pdf (accessed October 3, 2016).
USDA/FNS. 2014a. WIC food packages Final Rule - Regulatory impact analysis (RIA). https://www.regulations.gov/document?D=FNS-2006-0037-2586 (accessed October 3, 2016).
USDA/FNS. 2014b. Special Supplemental Nutrition Program for Women, Infants, and Children (WIC): Revisions in the WIC food packages. Final Rule, 7 C.F.R. § 246.
USDA/FNS. 2014c. Whole grain resource for the national school lunch and school breakfast programs: A guide to meeting the whole grain-rich criteria. http://www.fns.usda.gov/sites/default/files/WholeGrainResource.pdf (accessed October 3, 2016).
USDA/FNS. 2015a. About WIC—WIC at a glance. http://www.fns.usda.gov/wic/about-wic-wic-glance (accessed December 21, 2016).
USDA/FNS. 2015b. WIC food packages policy options II, final report. http://www.fns.usda.gov/wic-food-package-policy-options-ii (accessed December 21, 2016).
USDA/FNS. 2016a. WIC participant and program characteristics 2014: Food package report. http://www.fns.usda.gov/wic-participant-and-program-characteristics-2014-food-package-report (accessed August 30, 2016).
USDA/FNS. 2016b. Monthly data—state-level participation by category and program costs. http://www.fns.usda.gov/pd/wic-program (accessed October 3, 2016).
USDA/FNS. 2016c. August 2016 EBT detail status report. http://www.fns.usda.gov/sites/default/files/wic/August2016EBTDetailStatusReport.pdf (accessed October 3, 2016).
USDA/FNS. 2016d. Breastfeeding policy and guidance. http://www.fns.usda.gov/sites/default/files/wic/WIC-Breastfeeding-Policy-and-Guidance.pdf (accessed October 3, 2016).
USDA/HHS (U.S. Department of Agriculture/U.S. Department of Health and Human Services). 2016. Dietary Guidelines for Americans 2015–2020. https://health.gov/dietaryguidelines/2015 (accessed August 29 2016).


