
Appendix B
Food Allergy Prevalence Literature Search Strategy
Two literature searches were conducted to assess the current prevalence of food allergy both nationally and internationally, including overall population prevalence, food-induced anaphylaxis, and the prevalence of allergy to specific foods. The searches were conducted in the online databases Medline and EMBASE and were not limited by country. Peanut, nut, milk, wheat, egg, soy, fish, shellfish, and sesame were included in the initial search. An additional search was conducted that included the previous foods as well as specific types of fish (tuna, salmon, cod), molluscs (clams), nuts (almond, macadamia nut, Brazil nut, pecan, cashew, pine nut, chestnut, pistachio, hazelnut, walnut), seeds (sesame, mustard, sunflower, poppy, pumpkin), coconut, litchi, lupin, fruits, and vegetables. Articles were excluded if they were written in a language other than English, had nonhuman subjects, or were case studies/series, notes, conference abstracts, nonsystematic reviews, or opinion pieces. The searches yielded 767 unduplicated articles. The abstracts of these articles were then screened for food allergy or anaphylaxis population prevalence estimates. Of these, 707 articles did not provide an estimate and were excluded, leaving 60 articles for full text review. These were supplemented by 13 articles suggested by committee members or found through reference mining. This process is illustrated in Figure B-1, and the search terms used are listed in Tables B-1 and B-2. A summary of studies that reported prevalence of food allergy is found in Table B-3. Summary tables of systematic reviews on the prevalence of food allergy are found in Table B-4.
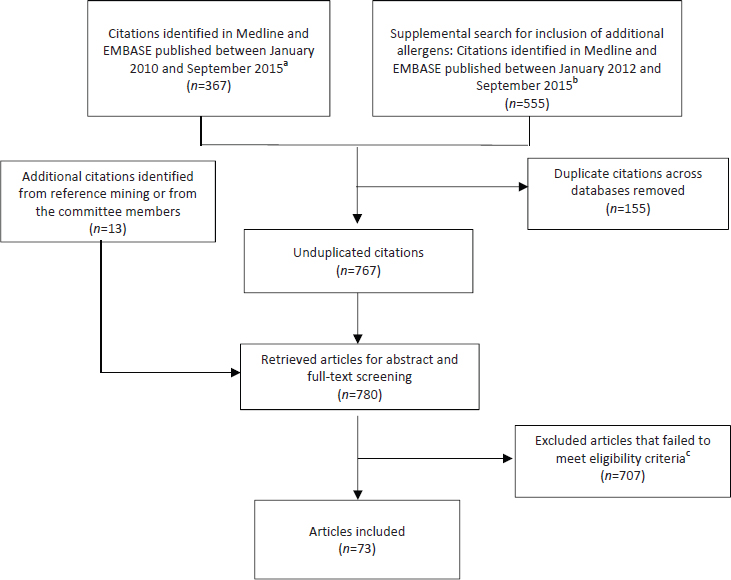
TABLE B-1 Search Terms to Identify Relevant Literature on Global Prevalence of Food Allergy for Medline and EMBASE
| Search Number | Search Terms |
|---|---|
| a. Medline Search | |
| 1 | Food hypersensitivity/ |
| 2 | Peanut hypersensitivity/ |
| 3 | Nut hypersensitivity/ |
| 4 | Milk hypersensitivity/ |
| 5 | Wheat hypersensitivity/ |
| 6 | Egg hypersensitivity/ |
| 7 | Soybean allergy.mp |
| 8 | Soy allergy.mp |
| 9 | Fish allergy.mp |
| 10 | Shellfish allergy.mp |
| 11 | Sesame allergy.mp |
| 12 | 1 or 2 or 3 or 4 or 5 or 6 or 7 or 8 or 9 or 10 or 11 |
| 13 | Prevalence/ |
| 14 | Anaphylaxis/ |
| 15 | Life threatening food allergy.mp |
| 16 | 13 or 14 or 15 |
| 17 | 12 and 16 |
| b. EMBASE Search | |
| 1 | Food allergy/ |
| 2 | Food allergen/ |
| 3 | Peanut allergy/ |
| 4 | Nut allergy/ |
| 5 | Milk allergy/ |
| 6 | Wheat allergy/ |
| 7 | Egg allergy/ |
| 8 | Soy allergy.mp |
| 9 | Soybean allergy.mp |
| 10 | Fish allergy.mp |
| 11 | Shellfish allergy.mp |
| 12 | Sesame allergy.mp |
| 13 | 1 or 2 or 3 or 4 or 5 or 6 or 7 or 8 or 9 or 10 or 11 or 12 |
| 14 | Prevalence/ |
| 15 | Anaphylaxis/ |
| 16 | Food allergy prevalence.mp |
| 17 | Life threatening food allergy.mp |
| 18 | 14 or 15 or 16 or 17 |
| 19 | 13 and 18 |
NOTES: Search terms were mapped to Subject Headings when available; otherwise searched as Keyword (.mp). Searches limited to 2010 to Current.
TABLE B-2 Search Terms to Identify Relevant Literature on Global Prevalence of Food Allergy to Additional Allergens for Medline and EMBASE
| Search Numbers | Search Terms |
|---|---|
| a. Medline | |
| 1 | Prevalence/ |
| 2 | limit 1 to (English language and humans and yr=“2012 -Current”) |
| 3 | Incidence/ |
| 4 | limit 3 to (English language and humans and yr=“2012 -Current”) |
| 5 | Hypersensitivity/ |
| 6 | limit 5 to (English language and humans and yr=“2012 -Current”) |
| 7 | Food Hypersensitivity/ |
| 8 | limit 7 to (English language and humans and yr=“2012 -Current”) |
| 9 | Skin Tests/ |
| 10 | Immunoglobulin E/ |
| 11 | 2 or 4 |
| 12 | 6 or 8 or 9 or 10 |
| 13 | 11 and 12 |
| 14 | Milk/ |
| 15 | 13 and 14 |
| 16 | Egg Hypersensitivity/ |
| 17 | 13 and 16 |
| 18 | Milk Hypersensitivity/ |
| 19 | 13 and 18 |
| 20 | Fishes/ |
| 21 | Tuna/ |
| 22 | Salmon/ |
| 23 | Gadiformes/ |
| 24 | 20 or 21 or 22 or 23 |
| 25 | 13 and 24 |
| 26 | Nut Hypersensitivity/ |
| 27 | Prunus/ |
| 28 | Macadamia/ |
| 29 | Bertholletia/ |
| 30 | Carya/ |
| Search Numbers | Search Terms |
|---|---|
| 31 | Anacardium/ |
| 32 | Nuts/ |
| 33 | Pistacia/ |
| 34 | Corylus/ |
| 35 | Juglans/ |
| 36 | pine nut.mp. |
| 37 | chestnut.mp. |
| 38 | 26 or 27 or 28 or 29 or 30 or 31 or 32 or 33 or 34 or 35 or 36 or 37 |
| 39 | 13 and 38 |
| 40 | Peanut Hypersensitivity/ |
| 41 | 13 and 40 |
| 42 | Wheat Hypersensitivity/ |
| 43 | 13 and 42 |
| 44 | Soybeans/ |
| 45 | 13 and 44 |
| 46 | Seeds/ |
| 47 | Sesamum/ |
| 48 | Mustard Plant/ |
| 49 | Helianthus/ |
| 50 | Papaver/ |
| 51 | Cucurbita/ |
| 52 | 46 or 47 or 48 or 49 or 50 or 51 |
| 53 | 13 and 52 |
| 54 | Cocos/ |
| 55 | 13 and 54 |
| 56 | Litchi/ |
| 57 | 13 and 56 |
| 58 | Lupinus/ |
| 59 | 13 and 58 |
| 60 | Fruit/ |
| 61 | Vegetables/ |
| 62 | Fragaria/ |
| Search Numbers | Search Terms |
|---|---|
| 63 | 60 or 61 or 62 |
| 64 | 13 and 63 |
| 65 | Mollusca/ |
| 66 | Bivalvia/ |
| 67 | 65 or 66 |
| 68 | 13 and 67 |
| Results from 15, 17, 19, 25, 39, 41, 43, 45, 53, 55, 57, 59, 64, and 68 combined | |
| b. EMBASE Search | |
| 1 | Prevalence/ |
| 2 | limit 1 to (human and English language and yr=“2012 -Current”) |
| 3 | incidence/ |
| 4 | limit 3 to (human and English language and yr=“2012 -Current”) |
| 5 | hypersensitivity/ |
| 6 | limit 5 to (human and English language and yr=“2012 -Current”) |
| 7 | food allergy/ |
| 8 | limit 7 to (human and English language and yr=“2012 -Current”) |
| 9 | skin test/ |
| 10 | immunoglobulin E/ |
| 11 | 2 or 4 |
| 12 | 6 or 8 or 9 or 10 |
| 13 | 11 and 12 |
| 14 | milk allergy/ |
| 15 | egg allergy/ |
| 16 | fish/ |
| 17 | salmon/ |
| 18 | tuna/ |
| 19 | Atlantic cod/ |
| 20 | Crustacea/ |
| 21 | shellfish/ |
| 22 | shrimp/ |
| 23 | lobster/ |
| 24 | crab/ |
| 25 | mollusc/ |
| Search Numbers | Search Terms |
|---|---|
| 26 | clam/ |
| 27 | nut allergy/ |
| 28 | almond/ |
| 29 | Macadamia/ |
| 30 | Brazil nut/ |
| 31 | pecan/ |
| 32 | cashew nut/ |
| 33 | pine nut.mp. |
| 34 | chestnut/ |
| 35 | hazelnut/ |
| 36 | pistachio/ |
| 37 | walnut/ |
| 38 | peanut allergy/ |
| 39 | wheat allergy/ |
| 40 | soybean/ |
| 41 | plant seed/ |
| 42 | sunflower/ |
| 43 | sesame/ |
| 44 | Papaver/ |
| 45 | mustard/ |
| 46 | squash/ |
| 47 | coconut/ |
| 48 | lychee/ |
| 49 | lupin/ |
| 50 | fruit/ |
| 51 | vegetable/ |
| 52 | 14 or 15 or 16 or 17 or 18 or 19 or 20 or 21 or 22 or 23 or 24 or 25 or 26 or 27 or 28 or 29 or 30 or 31 or 32 or 33 or 34 or 35 or 36 or 37 or 38 or 39 or 40 or 41 or 42 or 43 or 44 or 45 or 46 or 47 or 48 or 49 or 50 or 51 |
| 53 | 13 and 52 |
NOTES: Search terms were mapped to Subject Headings when available; otherwise searched as Keyword (.mp). Searches limited to human studies, English language, and published 2012 to Current.
TABLE B-3 Summary of Food Allergy Prevalence Studies
| Reference | Country | Study Design | Number Invited or Eligible Participants | Participation Rate N (%) |
|---|---|---|---|---|
| Grabenhenrich et al., 2016 | Europe | Cross-sectional | N/A | 1,970 (reports of anaphylaxis) |
| McGowan et al., 2016 | US | Cross-sectional | N/A | NHANES III (1988-1994): 4,995 NHANES (2005-2006): 2,901 |
| Xepapadaki et al., 2016 | Europe | Cohort | 12,049 | 9,336 (77%) |
| Datema et al., 2015 | Europe | Cross-sectional | Not indicated | 731 |
| Le et al., 2015 | Europe (The Netherlands) | Cross-sectional | 6,600 | 3,864 (59%) |
| Age of Participants | Food Allergens | Method of Outcome Assessment | Estimated Prevalence of Food Allergy, % (95% CI) |
|---|---|---|---|
| <18 years | Hen egg, cow milk, nuts | Report of anaphylaxis in the European Anaphylaxis Registry | Food-related anaphylaxis: 66% of reports |
| 6-19 years | Peanut, milk, egg, shrimp | sIgE | Food sensitization NHANES III: 24.3 (22.1-26.5) NHANES 2005-2006: 21.6 (19.5-23.7) Shrimp sensitization NHANES III: 11.2 (10.0-12.5) NHANES 2005-2006: 6.1 (4.5-7.7) |
| 2 years | Hen egg | sIgE, SPT, DBPCOFC |
Mean raw incidence: 0.84 (0.67-1.03) Adjusted mean incidence: 1.23 (0.98-1.51) (Adjusted for eligible children who were not challenged) |
| Mean age: 32.3 ± 14.8 (SD) years | Hazelnut | SPT sIgE DBPCOFC (N=124) |
77.4 83.7 70.2 |
| 20-54 years | Hen egg, cow milk, peanut, hazelnut, celery, apple, peach, fish, or shrimp | Self-report Clinical evaluation medical history, sIgE DBPCOFC |
10.8 4.1 3.2 |
| Reference | Country | Study Design | Number Invited or Eligible Participants | Participation Rate N (%) |
|---|---|---|---|---|
| Schoemaker et al., 2015 | Europe | Cohort | 12,049 | 9,336 (77%) 358 eligible for DBPCOFC; 248 agreed to at least 1 challenge |
| Soller et al., 2015 | Canada | Cross-sectional | 12,762 households | 5,734 households/15,022 individuals (45%) (full participants) 524 households (4%) (partial participants) |
| Winberg et al., 2015 | Sweden | Cohort | Not indicated | 2,612 (96%) |
| Age of Participants | Food Allergens | Method of Outcome Assessment | Estimated Prevalence of Food Allergy, % (95% CI) |
|---|---|---|---|
| 12 and 24 months | Cow milk | Parent-report, clinical examination, sIgE or SPT, DBPCOFC | Raw incidence: 0.54 (0.41-0.70) Adjusted incidence: 0.74 (0.56-0.97) (Adjusted for children who were eligible but not challenged, were placebo reactors, or who had inconclusive challenge outcomes, or who were lost to follow up) |
| Adults and children | Peanut, tree nuts, fish, shellfish, sesame, milk, egg, wheat, and/or so | Self-report, convincing history, physician diagnosis | Self-reported food allergy to any food Full participants: 6.4 (6.0-6.8) (unweighted) 7.5 (6.9-8.1) (weighted) Partial participants: 2.1 (1.4-2.9) (unweighted) |
| 11-12 years | Milk, egg, cod, wheat | Parent-report Clinical evaluation + sIgE DBPCOFC |
Reported food allergy: 4.8 (4-6) Clinically evaluated food allergy: 1.4 (1-2) DBPCOFC-proven food allergy: 0.6 (0-1) |
| Reference | Country | Study Design | Number Invited or Eligible Participants | Participation Rate N (%) |
|---|---|---|---|---|
| Bunyavanich et al., 2014 | US | Cohort study | 1,277 | 616 (48.2) |
| Burney et al., 2014 | Europe | Cross-sectional | 28,269 | 17,366 (54.6) |
| GasparMarques et al., 2014 | Portugal | Cross-sectional | 2,228 | 1,225 (55.0) participated 1,217 (54.6) included in analysis |
| Salo et al., 2014 | US | Cross-sectional | 10,348 | 10,348 |
| Wood et al., 2014 | US | Cross-sectional (patient survey) | 1,651 | 1,059 (64%) |
| Age of Participants | Food Allergens | Method of Outcome Assessment | Estimated Prevalence of Food Allergy, % (95% CI) |
|---|---|---|---|
| 7-10 years | Peanut | Self-reported symptoms, sIgE levels, clinical information, and combinations of these variables | Self-reported food allergy: 4.6 (2.9-6.3) Clinical food allergy based on sIgE: 5.0% (3.5-7.1) Peanut sIgE ≥0.35 kU/L and prescribed epi auto-injector: 4.9 (3.2-6.7) Peanut sIgE ≥14 kU/L: 2.9 (1.6-4.3) Peanut sIgE ≥14 kU/L and prescribed epi auto-injector: 2.0 (0.9-3.2) |
| 20-54 years | Various | Self-report, physician diagnosis, sIgE (≥0.35 kUA/L) | Self-report: 21.0 Physician diagnosis: 4.4 IgE to any foods: 15.81 |
| 0-3 years 4-6 years | Various | Self-report | Ever had a food allergy 0-3 years: 8.6 (6.4-11.5) 4-6 years: 12.1 (10.0-14.7) Total: 10.8 (9.1-12.6) Current food allergy 0-3 years: 4.7 (3.1-7.0) 4-6 years: 6.4 (4.9-8.4) Total: 5.7 (4.6-7.2) |
| ≥1 year | Egg white, cow milk, peanut, shrimp | sIgE | Prevalence of food sensitization: 28 |
| Adults (median age 52 years) | Not specified | Self-report of anaphylaxis to food | Reported anaphylaxis: 31 |
| Age of Participants | Food Allergens | Method of Outcome Assessment | Estimated Prevalence of Food Allergy, % (95% CI) |
|---|---|---|---|
| 11-15 years | Various | Parent-report Confirmation by: clinical history, sIgE, SPT, OFC, DBPCOFC |
Lifetime parent-reported: 11.3 (10.7-11.9) Parent-reported point prevalence: 3.6 (3.2-3.8) Confirmed food allergy: 0.15 Confirmed peanut: 0.05 Confirmed tree nut: 0.05 |
| 0-17 years | All allergens (peanut, shellfish, milk, fin fish, egg, tree nuts, wheat, soy) | Parent report of physician diagnosis, sIgE, SPT, OFC, reaction history | Urban centers: 9.8 (8.6-11.0) Metro cities: 9.2 (8.4-10.1) Urban outskirts: 7.8 (7.0-8.6) Suburban areas: 7.6 (6.9-8.2) Small towns: 7.2 (5.7-8.6) Rural areas: 6.2 (5.6-6.8) P<0.0001 |
| 0-17 years | Egg, fin fish, milk, peanut, shellfish, soy, tree nuts, wheat, or strawberry | Parent report of physician diagnosis, sIgE, SPT, OFC, reaction history | All allergens: 8.0 (7.7-8.3) Egg: 0.8 (0.7-0.9) Fin fish: 0.5 (0.4-0.6) Milk: 1.7 (1.5-1.8) Peanut: 2.0 (1.8-2.2) Shellfish: 1.4 (1.2-1.5) Soy: 0.4 (0.3-0.4) Tree nuts: 1.0 (0.9-1.2) Wheat: 0.4 (0.3-0.5) Strawberry: 0.4 (0.4-0.5) |
| Reference | Country | Study Design | Number Invited or Eligible Participants | Participation Rate N (%) |
|---|---|---|---|---|
| Osborne et al., 2011 | Australia | Cohort | 3,898 | 2,848 (73) |
| Sicherer et al., 2010 | US | Cross-sectional | 12,658 households | 5,300 households (13,534 subjects) (42) |
| Venter et al., 2010 | UK | Cohort | Cohort A: 1,456 Cohort B: 2,858 Cohort C: 969 |
Cohort A: 1,218 (84) Cohort B: 1,273 (44) Cohort C: 891 (92) |
| Ben-Shoshan et al., 2009 | Canada | Cross-sectional | 8,039 | (64) |
| Branum and Lukacs, 2009 | US | Cross-sectional | Not indicated | Not indicated |
NOTE: CI = confidence interval; DBPCOFC = double-blind, placebo-controlled oral food challenge; IgE = immunoglobulin E; N/A = not applicable; OFC = oral food challenge; SE = standard error; sIgE = food-specific serum IgE; SPT = skin prick test; UK = United Kingdom; US = United States.
| Age of Participants | Food Allergens | Method of Outcome Assessment | Estimated Prevalence of Food Allergy, % (95% CI) |
|---|---|---|---|
| 12 months | Raw egg, peanut, sesame, shellfish, or cow milk | SPT, DBPCOFC Shellfish and milk: no food challenge performed |
Overall prevalence (raw egg, peanut or sesame): 10.4 (9.3-11.5) Raw egg: 8.9 (7.8-10.0) Peanut: 3.0 (2.4-3.8) Sesame: 0.8 (0.5-1.1) |
| <18 years | Peanut, tree nuts, sesame | Self-report | Peanut: 1.4 (1.0-1.9) Tree nuts: 1.1 Sesame: 0.1 (0-0.2) |
| 3-4 years | Peanut | Cohort A: clinical history Cohorts B and C: SPT and clinical history or OFC |
Cohort A: 0.5 Cohort B: 1.4 Cohort C: 1.2 |
| K-grade 3 students | Peanut | Clinical history, SPT, sIgE, DBPCOFC | 1.62 (1.31-1.98) |
| 0-17 years | Not indicated | Parent-report | 3.9 ± 0.3 (SE) |
| Peanut, egg, milk, shrimp (in children ≥6 years) | sIgE Food allergy-related ambulatory care visits to hospital facilities and physician offices and hospitalizations |
Proportion estimate ± SE sIgE (peanut): 9.3 ± 0.8 sIgE (egg): 6.7 ± 0.6 sIgE (milk): 12.2 ± 0.9 sIgE (shrimp): 5.2 ± 0.6 317,000 (95% CI: 196,000-438,000) visits per year |
TABLE B-4 Prevalence of Food Allergy: Systematic Review Summaries
| Author, year | McWilliam et al., 2015 | |
| Aims/Key questions | To provide a comprehensive, up-to-date systematic review of the population prevalence of tree nut allergy in children and adults, including details of all individual tree nuts in various regions of the world | |
| Study eligibility criteria |
Inclusion criteria:
Exclusion criteria:
|
|
| Literature search dates or year range | January 1996 to December 2014 | |
| Number of food allergy studies included | 36 | |
| Synthesis methods | Summary tables, narrative text, meta-analysis | |
| Key findings | Confirmed food allergy: Seven studies (all in children) using OFC (or convincing recent history of allergic reaction together with positive allergen-specific IgE) to determine a prevalence range of 0-1.6%. | |
| Probable food allergy: Nine studies combined self-reported food allergy with additional objective assessment (e.g., specific details regarding doctor diagnosis or sensitization details [sIgE/SPT]) and were classified as probable food allergy for this review. The overall probable tree nut allergy prevalence range was 0.05-4.9%, with only one study reporting adult data. | ||
| Self-reported food allergy: Twenty studies based on self-report found tree nut allergy prevalence range was wider for adults (0.18-8.9%) and those studies including both adults and children (0.4-11.4%) than for those studies including only children (0-3.8%). Overall self-reported tree nut allergy prevalence ranged from 0 to 11.4%. | ||
| Pollen-associated food allergy: Prevalence estimates that included pollen-associated food allergy reactions to tree nut were significantly higher (8-11.4%) and were predominantly from Europe. | ||
| Geographic Differences: Prevalence of individual tree nut allergies varied significantly by region, with hazelnut the most common tree nut allergy in Europe; walnut and cashew the most common in the US; and Brazil nut, almond, and walnut the most common in the UK. | ||
| Limitations | Small number of studies reporting challenge-confirmed tree nut allergy prevalence. | |
| Unable to pool the prevalence estimates due to the large heterogeneity between the studies. | ||
| Data are largely limited to European, US, and UK studies. | ||
| AMSTAR rating | ||
| An a priori design? | Y | |
| Duplicate study selection and data extraction? | Y | |
| Comprehensive literature search? | Y | |
| Status of the publication as an inclusion criterion? | Y (limited to English-language articles) | |
| List of studies (included and excluded) provided? | Y/N (no list of excluded studies) | |
| Characteristics of included provided? | Y | |
| Scientific quality of the included studies assessed and reported? | Y | |
| Scientific quality used in formulating conclusions? | Y | |
| Methods used to combine the findings appropriate? | Y | |
| Likelihood of publication bias assessed? | N | |
| Conflict of interest (COI) stated? | Y/N (COI of the systematic review authors was provided but not provided for included studies) | |
| Author, year | Umasunthar et al., 2015 | |
| Aims/Key questions | To quantify the risk of anaphylaxis for food-allergic people | |
| Study eligibility criteria |
Inclusion criteria:
Exclusion criteria:
|
|
| Literature search dates or year range | January 1946 to September 5, 2012 | |
| Number of food allergy studies included | 34 | |
| Synthesis methods | Summary tables, narrative text, meta-analysis | |
| Key findings |
Self-reported food anaphylaxis in food allergic people:
|
|
|
Medically coded food anaphylaxis in food-allergic people:
|
||
|
Hospital admission due to food anaphylaxis in food-allergic people:
|
||
| Limitations | High heterogeneity between study results, possibly due to variation in study populations, anaphylaxis definition, and data collection methods. | |
| Some uncertainty exists about the precision of the risk estimates, so mean estimates should be interpreted with caution. | ||
| The rate of self-reported anaphylaxis varied widely across studies. Study quality was generally rated as low for studies of self-reported anaphylaxis. It is likely that studies of self-reported anaphylaxis overestimate the true incidence of anaphylaxis. | ||
| The rate of medically coded anaphylaxis also varied widely between studies. These data may underestimate food anaphylaxis occurrence. | ||
| AMSTAR rating | ||
| An a priori design? | Y | |
| Duplicate study selection and data extraction? | Y | |
| Comprehensive literature search? | Y | |
| Status of the publication as an inclusion criterion? | Y | |
| List of studies (included and excluded) provided? | Y/N (no list of excluded studies) | |
| Characteristics of included provided? | Y | |
| Scientific quality of the included studies assessed and reported? | Y | |
| Scientific quality used in formulating conclusions? | Y | |
| Methods used to combine the findings appropriate? | Y | |
| Likelihood of publication bias assessed? | Y | |
| Conflict of interest stated? | Y/N (COI of the systematic review authors was provided but not provided for included studies) | |
| Author, year | Katz et al., 2014 | |
| Aims/Key questions | To identify the adjusted prevalence of IgE-mediated soy allergy in children and perform a secondary analysis of the impact of age (less than and more than 6 months). | |
| Study eligibility criteria |
Inclusion criteria:
Exclusion criteria:
|
|
| Literature search dates or year range | 1909 to March 2013 | |
| Number of food allergy studies included | 40 | |
| Synthesis methods | Summary tables, meta-analysis | |
| Key findings |
Ten studies reported OFC-proven soy protein allergy in the general population (i.e., the referred population). Quality of evidence was low or moderate.
|
|
|
Six studies reported the prevalence of self-reported soy allergy in the general population. The quality of evidence was low.
|
||
|
Twelve studies reported the prevalence of allergy to soy after the use of infant formula with soy-based protein. Quality of evidence was low to moderate.
|
||
|
Six studies reported prevalence of self-reported soy allergy after use of soy-based formula. Quality of evidence was moderate except for one study.
|
||
| Limitations | All four positive cases of OFC-proven soy allergy in the general population originated from one study. Cutaneous signs were noted in only one of these cases. | |
| AMSTAR rating | ||
| An a priori design? | Y | |
| Duplicate study selection and data extraction? | Y | |
| Comprehensive literature search? | Y | |
| Status of the publication as an inclusion criterion? | Y | |
| List of studies (included and excluded) provided? | Y/N (no for excluded studies) | |
| Characteristics of included provided? | Y | |
| Scientific quality of the included studies assessed and reported? | Y | |
| Scientific quality used in formulating conclusions? | Y | |
| Methods used to combine the findings appropriate? | Y | |
| Likelihood of publication bias assessed? | Y | |
| Conflict of interest stated? | N | |
| Author, year | Keet et al., 2014 | |
| Aims/Key questions | To determine the prevalence of self-reported food allergy in children in the US, and explore sources of variation in prevalence estimates, including case definition, changes over time, and racial/ethnic differences. | |
| Study eligibility criteria |
Inclusion criteria:
Exclusion criteria:
|
|
| Literature search dates or year range | Up to February 2012 | |
| Number of food allergy studies included | 27 survey administrations (20 survey administrations were used in the meta-regression) | |
| Synthesis methods | Summary tables, narrative text, meta-analysis with meta-regression | |
| Key findings | Seven surveys reported self-reported food allergy (National Maternal and Infant Health Survey; NHANES III; National Survey of Children’s Health 2003 and 2007; NHIS 1997-2011; NHANES 2007-2008 and 2009-2010). | |
| Prevalence: It appears that the prevalence of self-reported food allergy is between 3 and 6 percent. | ||
| Prevalence (current versus ever): Compared to estimates of prevalence of self-reported current food allergy, the prevalence of self-reported history of food allergy ever was considerably higher, even after adjusting for year of study (difference: 2.5 percentage points between current and ever/time undefined food allergy, 95% CI: 1.5%-3.4%; P<0.001 for all children). | ||
| Change over time: The self-reported prevalence of food allergy among children was estimated to have increased by 1.2 percentage points per decade during 1988-2011 (95% CI: 0.7%-1.6%). | ||
| Racial/ethnic differences: The rate of increase in self-reported food allergy prevalence varied significantly by race/ethnicity; the estimated increase in food allergy prevalence per decade among Black children was 2.1 percentage points (95% CI: 1.5%-2.7%) compared to 1.2 percentage points among Hispanics (95% CI: 0.7%-1.7%) and 1.0 percentage points (95% CI: 0.4%-1.6%) among whites (P=0.01 for comparison of trends between blacks and whites, and P=0.04 for comparison between blacks and Hispanics). | ||
| Limitations | Surveys included in meta-regression were limited to those conducted by the CDC. | |
| The studies have too much heterogeneity to calculate a summary measure of food allergy prevalence. | ||
| All outcomes were based on self-report. | ||
| AMSTAR rating | ||
| An a priori design? | Y | |
| Duplicate study selection and data extraction? | Y | |
| Comprehensive literature search? | Y | |
| Status of the publication as an inclusion criterion? | Y (English-only) | |
| List of studies (included and excluded) provided? | Y/N (no list of excluded studies) | |
| Characteristics of included provided? | Y | |
| Scientific quality of the included studies assessed and reported? | Y | |
| Scientific quality used in formulating conclusions? | Y | |
| Methods used to combine the findings appropriate? | Y | |
| Likelihood of publication bias assessed? | Y | |
| Conflict of interest stated? | Y/N (COI of the systematic review authors was provided but not provided for included studies) | |
| Author, year | Nwaru et al., 2014 | |
| Aims/Key questions | To provide up-to-date estimates of the prevalence of allergy to cow milk, egg, wheat, soy, peanut, tree nuts, fish, and shellfish in Europe. | |
| Study eligibility criteria |
Inclusion criteria:
Exclusion criteria:
|
|
| Literature search dates or year range | January 2000 to September 30, 2012 | |
| Number of food allergy studies included | 65 (based on 50 primary studies) | |
| Synthesis methods | Summary tables, narrative text, meta-analysis | |
| Key findings | Self-reported food allergy: The overall pooled estimates for all age groups of self-reported lifetime prevalence of allergy to cow milk, egg, wheat, soy, peanut, tree nuts, fish, and shellfish were 6.0% (95% CI: 5.7%-6.4%), 2.5% (2.3%-2.7%), 3.6% (3.0%-4.2%), 0.4% (0.3%-0.6%), 1.3% (1.2%-1.5%), 2.2% (1.8%-2.5%), and 1.3% (0.9%-1.7%), respectively. | |
| Food-challenge-defined food allergy: The prevalence of food-challenge-defined allergy to cow milk, egg, wheat, soy, peanut, tree nuts, fish, and shellfish was 0.6% (0.5%-0.8%), 0.2% (0.2%-0.3%), 0.1% (0.01%-0.2%), 0.3% (0.1%-0.4%), 0.2% (0.2%-0.3%), 0.5% (0.08%-0.8%), 0.1% (0.02%-0.2%), and 0.1% (0.06%-0.3%). | ||
| Limitations | Significant heterogeneity between the studies. | |
| Limited generalizability (limited to European studies published after 2000). | ||
| AMSTAR rating | ||
| An a priori design? | Y | |
| Duplicate study selection and data extraction? | Y | |
| Comprehensive literature search? | Y | |
| Status of the publication as an inclusion criterion? | Y | |
| List of studies (included and excluded) provided? | Y/N (no list of excluded studies) | |
| Characteristics of included provided? | Y | |
| Scientific quality of the included studies assessed and reported? | Y | |
| Scientific quality used in formulating conclusions? | Y | |
| Methods used to combine the findings appropriate? | Y | |
| Likelihood of publication bias assessed? | N | |
| Conflict of interest stated? | Y/N (COI of the systematic review authors was provided but not provided for included studies) | |
| Author, year | Greenhawt et al., 2013 | |
| Aims/Key questions | To understand the racial and ethnic disparities in food allergy in the US. | |
| Study eligibility criteria |
Inclusion criteria:
Exclusion criteria:
|
|
| Literature search dates or year range | Not provided | |
| Number of food allergy studies included | 20 | |
| Synthesis methods | Summary tables, narrative text | |
| Key findings | None of the studies used OFC/DBPCOFC to assess food allergy. | |
| In 12 studies, blacks (primarily children) had significantly increased adjusted odds of food sensitization or significantly higher proportion or odds of food allergy by self-report, discharge codes, or clinic-based chart review than did white children. | ||
| Limitations | Major differences in study methodology and reporting precluded calculation of a pooled estimate of effect. | |
| Food allergy outcomes were measured indirectly. | ||
| Low AMSTAR rating. | ||
| AMSTAR rating | ||
| An a priori design? | Y | |
| Duplicate study selection and data extraction? | Y | |
| Comprehensive literature search? | N (did not state the literature search dates or range) | |
| Status of the publication as an inclusion criterion? | N | |
| List of studies (included and excluded) provided? | Y/N (list of excluded studies not provided) | |
| Characteristics of included provided? | Y | |
| Scientific quality of the included studies assessed and reported? | N | |
| Scientific quality used in formulating conclusions? | N | |
| Methods used to combine the findings appropriate? | N | |
| Likelihood of publication bias assessed? | N | |
| Conflict of interest stated? | Y/N (COI of the systematic review authors was provided but not provided for included studies) | |
| Author, year | Lee et al., 2013 | |
| Aims/Key questions | To summarize the current literature on food allergy in Asia and compare it with Western populations. | |
| Study eligibility criteria |
Inclusion criteria:
Exclusion criteria:
|
|
| Literature search dates or year range | January 2005 to December 2012 | |
| Number of food allergy studies included | 53 | |
| Synthesis methods | Summary table, narrative text | |
| Key findings | The overall prevalence of food allergy in Asia is somewhat comparable to the West. However, the types of food allergy differ in order of relevance. Shellfish is the most common food allergen from Asia. | |
| The prevalence of peanut allergy in Asia is extremely low compared to the West. Among young children and infants, egg and cow milk allergy are the two most common food allergies, with prevalence data comparable to Western populations. | ||
| Wheat allergy, though uncommon in most Asian countries, is the most common cause of anaphylaxis in Japan and Korea, and is increasing in Thailand. | ||
| Limitations | Low AMSTAR rating | |
| AMSTAR rating | ||
| An a priori design? | Y | |
| Duplicate study selection and data extraction? | N | |
| Comprehensive literature search? | N (did not supplement the database searches) | |
| Status of the publication as an inclusion criterion? | N | |
| List of studies (included and excluded) provided? | Y/N (did not include list of excluded studies) | |
| Characteristics of included provided? | Y/N (not for all 53 studies) | |
| Scientific quality of the included studies assessed and reported? | N | |
| Scientific quality used in formulating conclusions? | N | |
| Methods used to combine the findings appropriate? | Not applicable (findings were not combined) | |
| Likelihood of publication bias assessed? | N | |
| Conflict of interest stated? | N | |
| Author, year | Panesar et al., 2013 | |
| Aims/Key questions | To understand and describe the epidemiology of anaphylaxis from any cause in Europe and describe how these characteristics vary by person, place, and time. | |
| Study eligibility criteria |
Inclusion criteria:
Exclusion criteria:
|
|
| Literature search dates or year range | January 1, 2000, to September 30, 2012 | |
| Number of food allergy studies included | 49 (3 included in meta-analysis) Only 10 were food allergy studies and none of these was in the meta-analysis |
|
| Synthesis methods | Summary tables, narrative text, meta-analysis | |
| Key findings | Meta-analysis yielded a pooled estimated prevalence of anaphylaxis, due to any cause, of 0.3% (95% CI 0.1%-0.5%). | |
| Ten studies found that the proportions of food allergy reactions that resulted in anaphylaxis ranged from 0.4% to 39.9%. | ||
| One study of 163 children found the food allergens that most commonly resulted in anaphylaxis were cow milk (29%), hen egg (25%), hazelnut (5%), peanut (4%), kiwi (4%), walnut (4%), pine nut (3%), fish (3%), wheat (2%), soy (2%), shrimp (2%), apricot (2%), and sesame (2%). | ||
| Limitations | No discussion of how food allergy was determined. | |
| Very few studies were on food allergy. | ||
| Limited to European populations. | ||
| AMSTAR rating | ||
| An a priori design? | Y | |
| Duplicate study selection and data extraction? | Y | |
| Comprehensive literature search? | Y | |
| Status of the publication as an inclusion criterion? | Y | |
| List of studies (included and excluded) provided? | Y | |
| Characteristics of included provided? | Y | |
| Scientific quality of the included studies assessed and reported? | Y | |
| Scientific quality used in formulating conclusions? | Y | |
| Methods used to combine the findings appropriate? | Y | |
| Likelihood of publication bias assessed? | N | |
| Conflict of interest stated? | Y/N (COI of the systematic review authors was provided but not provided for included studies) | |
| Author, year | Umasunthar et al., 2013 | |
| Aims/Key questions | To estimate the incidence of fatal food-induced anaphylaxis for people with food allergy and relate this to other mortality risks in the general population. | |
| Study eligibility criteria |
Inclusion criteria:
Exclusion criteria:
|
|
| Literature search dates or year range | January 1946 to September 5, 2012 | |
| Number of food allergy studies included | 13 | |
| Synthesis methods | Summary table, meta-analysis | |
| Key findings |
Meta-analysis estimates the incidence rate of fatal food anaphylaxis in a food-allergic person as:
|
|
| In sensitivity analysis with different estimated food allergy prevalence, the incidence varied from 1.35 to 2.71 per million person-years. | ||
| Limitations | Study quality was mixed, and study results had high heterogeneity, possibly due to variation in food allergy prevalence and data collection methods. | |
| Study authors were unable to exclude the possibility of a systematic bias operating across different studies, in either the acquisition and coding of fatal food anaphylaxis data or the estimation of food allergy prevalence. | ||
| AMSTAR rating | ||
| An a priori design? | Y | |
| Duplicate study selection and data extraction? | Y | |
| Comprehensive literature search? | Y | |
| Status of the publication as an inclusion criterion? | Y | |
| List of studies (included and excluded) provided? | Y/N (list of excluded studies was not provided) | |
| Characteristics of included provided? | Y | |
| Scientific quality of the included studies assessed and reported? | Y | |
| Scientific quality used in formulating conclusions? | Y | |
| Methods used to combine the findings appropriate? | Y | |
| Likelihood of publication bias assessed? | Y | |
| Conflict of interest stated? | Y/N (COI of the systematic review authors was provided but not provided for included studies) | |
| Author, year | Chafen et al., 2010 | |
| Aims/Key questions | To systematically review the evidence on the prevalence of food allergies. | |
| Study eligibility criteria |
Inclusion criteria:
|
|
| Literature search dates or year range | January 1988 to September 2009 | |
| Number of food allergy studies included | 6 studies on prevalence of food allergy | |
| Synthesis methods | Narrative text | |
| Key findings |
One meta-analysis on incidence and prevalence.
|
|
|
Three population-based studies on change in prevalence over time in the UK, Canada, and the US.
|
||
|
Overall Findings:
|
||
| Limitations |
|
|
| AMSTAR rating | ||
| An a priori design? | Y | |
| Duplicate study selection and data extraction? | Y | |
| Comprehensive literature search? | Y | |
| Status of the publication as an inclusion criterion? | Y (limited to English-only articles) | |
| List of studies (included and excluded) provided? | N | |
| Characteristics of included provided? | N | |
| Scientific quality of the included studies assessed and reported? | Y | |
| Scientific quality used in formulating conclusions? | Y | |
| Methods used to combine the findings appropriate? | Not applicable (findings on prevalence were not combined) | |
| Likelihood of publication bias assessed? | N | |
| Conflict of interest stated? | Y/N (COI of the systematic review authors was provided but not provided for included studies) | |
| Author, year | Zuidmeer et al., 2008 | |
| Aims/Key questions | To assess the prevalence of allergies to plant food according to the different subjective and objective assessment methods. | |
| Study eligibility criteria |
Inclusion criteria:
Exclusion criteria:
|
|
| Literature search dates or year range | January 1990 to December 2006 | |
| Number of food allergy studies included | 36 (33 publications) | |
| Synthesis methods | Summary tables, meta-analysis | |
| Key findings | Based on 4 studies using food challenge tests, the prevalence of allergy to fruits ranged from 0.1% to 4.3%. | |
| Based on 2 studies using food challenge tests, the prevalence of allergy to vegetables ranged from 0.1% to 0.3%. | ||
| Based on 3 studies using food challenge tests, the prevalence of allergy to nuts ranged from 0.1% (almond) to 4.3% (hazelnut). | ||
| Both for challenge tests and for sensitization assessed by SPT, the highest prevalence estimates of more than 4% were found for hazelnut. | ||
| Two studies from the UK and one from Germany reported positive wheat challenge tests in children with a prevalence as high as 0.5%. In adults, the prevalence of sensitization to wheat (assessed by IgE) was >3% in several studies. | ||
| In adults and adolescents, the highest prevalence estimates of allergy to soy were found in three Swedish studies (sensitization assessed by IgE as high as almost 3%). Studies from all other countries showed prevalences well below 1% regardless of method used or age group. | ||
| Meta-analyses showed significant heterogeneity between studies regardless of food item or age group. In adults, there was significant heterogeneity (P<0.001) among the seven studies regarding perception of allergy caused by fruits (summary prevalence estimate, 1.22%; 95% CI: 0.82%-1.63%), vegetables (six studies: 0.98%; 95% CI: 0.52%-1.45%), and wheat (five studies: 0.40%; 95% CI: 0.21%-0.59%), as well as for sensitization against wheat (assessed by IgE in five studies: 2.08%; 95% CI: 0.87%-3.29%). Similarly, among studies in children, the heterogeneity was significant (P<0.001) for perception of allergy caused by tree nuts (five studies: 0.52%; 95% CI: 0.20%-0.85%) or soy (seven studies: 0.34%; 95% CI: 0.12%-0.56%), whereas the heterogeneity was of a lower level but still significant (P=5.016) among the five studies assessing sensitization against wheat by SPT (0.43%; 95% CI: 0.16%-0.70%). | ||
| Limitations | Few studies used OFC or DBPCOFC to determine food allergy. Meta-analysis was done only when five or more studies were available, so, due to the lack of studies using OFC or DBPCOFC, meta-analysis was done only for studies that determined food allergy by SPT, sIgE, or self-report. | |
| The authors could not rule out that studies were missed, particularly from non-European or non-American journals. | ||
| The comparison of prevalence estimates from different studies is hampered by using different types of prevalence. | ||
| A limitation of the interpretation of findings on allergic sensitization may be that positive IgE or SPT results to plant-derived foods can be a result of cross-reactivity to pollen. Consequently, the prevalence of food allergy may rise or fall with the presence of the sensitizing pollen in the study area, which depends on the season and climate and may vary from year to year. | ||
| Fairly low AMSTAR rating. | ||
| AMSTAR rating | ||
| An a priori design? | Y | |
| Duplicate study selection and data extraction? | Y (study selection)/ Not clear for data extraction | |
| Comprehensive literature search? | N (searched only one database) | |
| Status of the publication as an inclusion criterion? | N | |
| List of studies (included and excluded) provided? | Y/N (no list of excluded studies) | |
| Characteristics of included provided? | Y | |
| Scientific quality of the included studies assessed and reported? | N | |
| Scientific quality used in formulating conclusions? | N | |
| Methods used to combine the findings appropriate? | Y | |
| Likelihood of publication bias assessed? | N | |
| Conflict of interest stated? | Y/N (COI of the systematic review authors was provided but not provided for included studies) | |
| Author, year | Rona et al., 2007 | |
| Aims/Key questions | To assess the prevalence of food allergy by performing a meta-analysis according to the method of assessment used. | |
| Study eligibility criteria |
Inclusion criteria:
Exclusion criteria:
|
|
| Literature search dates or year range | January 1990 to December 2005 | |
| Number of food allergy studies included | 51 | |
| Synthesis methods | Narrative text, summary tables, meta-analysis | |
| Key findings | The studies showed marked heterogeneity regardless of type of assessment or food item considered, and in most analyses this persisted after age stratification. | |
| Self-reported prevalence of food allergy varied from 1.2% to 17% for milk, 0.2% to 7% for egg, 0% to 2% for peanuts and fish, 0% to 10% for shellfish, and 3% to 35% for any food. | ||
|
Prevalence of food allergy determined by OFC or DBPCOFC:
|
||
| Meta-analysis results were presented graphically in this paper. | ||
| Limitations | In the overall estimate of the prevalence of food allergy related to food challenge, the authors were unable to omit positive challenges to nonallergic food hypersensitivity; thus, these estimates may give an overestimate of prevalence. | |
| Marked heterogeneity among studies. | ||
| AMSTAR rating | ||
| An a priori design? | Y | |
| Duplicate study selection and data extraction? | Y | |
| Comprehensive literature search? | Y | |
| Status of the publication as an inclusion criterion? | N | |
| List of studies (included and excluded) provided? | Y/N (list of excluded studies not provided) | |
| Characteristics of included provided? | N | |
| Scientific quality of the included studies assessed and reported? | N | |
| Scientific quality used in formulating conclusions? | N | |
| Methods used to combine the findings appropriate? | Y | |
| Likelihood of publication bias assessed? | N | |
| Conflict of interest stated? | Y/N (COI of the systematic review authors was provided but not provided for included studies) | |
NOTE: CDC = Centers for Disease Control and Prevention; CI = confidence interval; DBPCOFC = double-blind, placebo-controlled oral food challenge; IgE = immunoglobulin E; NHANES = National Health and Nutrition Examination Survey; NHIS = National Health Interview Survey; sIgE = food-specific serum IgE; SPT = skin prick test; UK = United Kingdom; US = United States.
REFERENCES
Ben-Shoshan, M., R. S. Kagan, R. Alizadehfar, L. Joseph, E. Turnbull, Y. St Pierre, and A. E. Clarke. 2009. Is the prevalence of peanut allergy increasing?: A 5-year follow-up study in children in Montreal. J Allergy Clin Immunol 123(4):783-788.
Branum, A. M., and S. L. Lukacs. 2009. Food allergy among children in the United States. Pediatrics 124(6):1549-1555.
Bunyavanich, S., S. L. Rifas-Shiman, T. A. Platts-Mills, L. Workman, J. E. Sordillo, M. W. Gillman, D. R. Gold, and A. A. Litonjua. 2014. Peanut allergy prevalence among school-age children in a US cohort not selected for any disease. J Allergy Clin Immunol 134(3):753-755.
Burney, P. G., J. Potts, I. Kummeling, E. N. Mills, M. Clausen, R. Dubakiene, L. Barreales, C. Fernandez-Perez, M. Fernandez-Rivas, T. M. Le, A. C. Knulst, M. L. Kowalski, J. Lidholm, B. K. Ballmer-Weber, C. Braun-Fahlander, T. Mustakov, T. Kralimarkova, T. Popov, A. Sakellariou, N. G. Papadopoulos, S. A. Versteeg, L. Zuidmeer, J. H. Akkerdaas, K. Hoffmann-Sommergruber, and R. van Ree. 2014. The prevalence and distribution of food sensitization in European adults. Allergy 69(3):365-371.
Chafen, J. J., S. J. Newberry, M. A. Riedl, D. M. Bravata, M. Maglione, M. J. Suttorp, V. Sundaram, N. M. Paige, A. Towfigh, B. J. Hulley, and P. G. Shekelle. 2010. Diagnosing and managing common food allergies: A systematic review. JAMA 303(18):1848-1856.
Datema, M. R., L. Zuidmeer-Jongejan, R. Asero, L. Barreales, S. Belohlavkova, F. de Blay, P. Bures, M. Clausen, R. Dubakiene, D. Gislason, M. Jedrzejczak-Czechowicz, M. L. Kowalski, A. C. Knulst, T. Kralimarkova, T. M. Le, A. Lovegrove, J. Marsh, N. G. Papadopoulos, T. Popov, N. Del Prado, A. Purohit, G. Reese, I. Reig, S. L. Seneviratne, A. Sinaniotis, S. A. Versteeg, S. Vieths, A. H. Zwinderman, C. Mills, J. Lidholm, K. Hoffmann-Sommergruber, M. Fernandez-Rivas, B. Ballmer-Weber, and R. van Ree. 2015. Hazelnut allergy across Europe dissected molecularly: A EuroPrevall outpatient clinic survey. J Allergy Clin Immunol 136(2):382-391.
Gaspar-Marques, J., P. Carreiro-Martins, A. L. Papoila, I. Caires, C. Pedro, J. Araujo-Martins, D. Virella, J. Rosado-Pinto, P. Leiria-Pinto, and N. Neuparth. 2014. Food allergy and anaphylaxis in infants and preschool-age children. Clin Pediatr (Phila) 53(7):652-657.
Grabenhenrich, L. B., S. Dolle, A. Moneret-Vautrin, A. Kohli, L. Lange, T. Spindler, F. Rueff, K. Nemat, I. Maris, E. Roumpedaki, K. Scherer, H. Ott, T. Reese, T. Mustakov, R. Lang, M. Fernandez-Rivas, M. L. Kowalski, M. B. Bilo, J. O. Hourihane, N. G. Papadopoulos, K. Beyer, A. Muraro, and M. Worm. 2016. Anaphylaxis in children and adolescents: The European Anaphylaxis Registry. J Allergy Clin Immunol 137(4):1128-1137.
Greenhawt, M., C. Weiss, M. L. Conte, M. Doucet, A. Engler, and C. A. Camargo, Jr. 2013. Racial and ethnic disparity in food allergy in the United States: A systematic review. J Allergy Clin Immunol Pract 1(4):378-386.
Gupta, R. S., E. E. Springston, M. R. Warrier, B. Smith, R. Kumar, J. Pongracic, and J. L. Holl. 2011. The prevalence, severity, and distribution of childhood food allergy in the United States. Pediatrics 128(1):e9-e17.
Gupta, R. S., E. E. Springston, B. Smith, M. R. Warrier, J. Pongracic, and J. L. Holl. 2012. Geographic variability of childhood food allergy in the United States. Clin Pediatr (Phila) 51(9):856-861.
Gupta, R. S., E. E. Springston, B. Smith, J. Pongracic, J. L. Holl, and M. R. Warrier. 2013. Parent report of physician diagnosis in pediatric food allergy. J Allergy Clin Immunol 131(1):150-156.
Katz, Y., P. Gutierrez-Castrellon, M. G. Gonzalez, R. Rivas, B. W. Lee, and P. Alarcon. 2014. A comprehensive review of sensitization and allergy to soy-based products. Clin Rev Allergy Immunol 46(3):272-281.
Kaya, A., M. Erkocoglu, E. Civelek, B. Cakir, and C. N. Kocabas. 2013. Prevalence of confirmed IgE-mediated food allergy among adolescents in Turkey. Pediatr Allergy Immunol 24(5):456-462.
Keet, C. A., J. H. Savage, S. Seopaul, R. D. Peng, R. A. Wood, and E. C. Matsui. 2014. Temporal trends and racial/ethnic disparity in self-reported pediatric food allergy in the United States. Ann Allergy Asthma Immunol 112(3):222-229.
Le, T. M., E. van Hoffen, I. Kummeling, J. Potts, B. K. Ballmer-Weber, C. A. Bruijnzeel-Koomen, A. F. Lebens, J. Lidholm, T. M. Lindner, A. Mackie, E. C. Mills, R. van Ree, S. Vieths, M. Fernandez-Rivas, P. G. Burney, and A. C. Knulst. 2015. Food allergy in the Netherlands: Differences in clinical severity, causative foods, sensitization and DBPCFC between community and outpatients. Clin Transl Allergy 5:8.
Lee, A. J., M. Thalayasingam, and B. W. Lee. 2013. Food allergy in Asia: How does it compare? Asia Pac Allergy 3(1):3-14.
McGowan, E. C., R. D. Peng, P. M. Salo, D. C. Zeldin, and C. A. Keet. 2016. Changes in food-specific IgE over time in the National Health and Nutrition Examination Survey (NHANES). J Allergy Clin Immunol Pract 4(4):713-720.
McWilliam, V., J. Koplin, C. Lodge, M. Tang, S. Dharmage, and K. Allen. 2015. The prevalence of tree nut allergy: A systematic review. Curr Allergy Asthma Rep 15(9):555.
Nwaru, B. I., L. Hickstein, S. S. Panesar, G. Roberts, A. Muraro, A. Sheikh, EAACI Food Allergy and Anaphylaxis Guidelines Group. 2014. Prevalence of common food allergies in Europe: A systematic review and meta-analysis. Allergy 69(8):992-1007.
Osborne, N. J., J. J. Koplin, P. E. Martin, L. C. Gurrin, A. J. Lowe, M. C. Matheson, A. L. Ponsonby, M. Wake, M. L. Tang, S. C. Dharmage, K. J. Allen, and HealthNuts Investigators. 2011. Prevalence of challenge-proven IgE-mediated food allergy using population-based sampling and predetermined challenge criteria in infants. J Allergy Clin Immunol 127(3):668-676.
Panesar, S. S., S. Javad, D. de Silva, B. I. Nwaru, L. Hickstein, A. Muraro, G. Roberts, M. Worm, M. B. Bilo, V. Cardona, A. E. Dubois, A. Dunn Galvin, P. Eigenmann, M. Fernandez-Rivas, S. Halken, G. Lack, B. Niggemann, A. F. Santos, B. J. Vlieg-Boerstra, Z. Q. Zolkipli, A. Sheikh, EAACI Food Allergy and Anaphylaxis Guidelines Group. 2013. The epidemiology of anaphylaxis in Europe: A systematic review. Allergy 68(11):1353-1361.
Rona, R. J., T. Keil, C. Summers, D. Gislason, L. Zuidmeer, E. Sodergren, S. T. Sigurdardottir, T. Lindner, K. Goldhahn, J. Dahlstrom, D. McBride, and C. Madsen. 2007. The prevalence of food allergy: A meta-analysis. J Allergy Clin Immunol 120(3):638-646.
Salo, P. M., S. J. Arbes, Jr., R. Jaramillo, A. Calatroni, C. H. Weir, M. L. Sever, J. A. Hoppin, K. M. Rose, A. H. Liu, P. J. Gergen, H. E. Mitchell, and D. C. Zeldin. 2014. Prevalence of allergic sensitization in the United States: Results from the National Health and Nutrition Examination Survey (NHANES) 2005-2006. J Allergy Clin Immunol 134(2):350-359.
Schoemaker, A. A., A. B. Sprikkelman, K. E. Grimshaw, G. Roberts, L. Grabenhenrich, L. Rosenfeld, S. Siegert, R. Dubakiene, O. Rudzeviciene, M. Reche, A. Fiandor, N. G. Papadopoulos, A. Malamitsi-Puchner, A. Fiocchi, L. Dahdah, S. T. Sigurdardottir, M. Clausen, A. Stanczyk-Przyluska, K. Zeman, E. N. Mills, D. McBride, T. Keil, and K. Beyer. 2015. Incidence and natural history of challenge-proven cow’s milk allergy in European children—EuroPrevall birth cohort. Allergy 70(8):963-972.
Sicherer, S. H., A. Munoz-Furlong, J. H. Godbold, and H. A. Sampson. 2010. US prevalence of self-reported peanut, tree nut, and sesame allergy: 11-year follow-up. J Allergy Clin Immunol 125(6):1322-1326.
Soller, L., M. Ben-Shoshan, D. W. Harrington, M. Knoll, J. Fragapane, L. Joseph, Y. St Pierre, S. La Vieille, K. Wilson, S. J. Elliott, and A. E. Clarke. 2015. Adjusting for nonresponse bias corrects overestimates of food allergy prevalence. J Allergy Clin Immunol Pract 3(2):291-293.
Umasunthar, T., J. Leonardi-Bee, M. Hodes, P. J. Turner, C. Gore, P. Habibi, J. O. Warner, and R. J. Boyle. 2013. Incidence of fatal food anaphylaxis in people with food allergy: A systematic review and meta-analysis. Clin Exp Allergy 43(12):1333-1341.
Umasunthar, T., J. Leonardi-Bee, P. J. Turner, M. Hodes, C. Gore, J. O. Warner, and R. J. Boyle. 2015. Incidence of food anaphylaxis in people with food allergy: A systematic review and meta-analysis. Clin Exp Allergy 45(11):1621-1636.
Venter, C., S. Hasan Arshad, J. Grundy, B. Pereira, C. Bernie Clayton, K. Voigt, B. Higgins, and T. Dean. 2010. Time trends in the prevalence of peanut allergy: Three cohorts of children from the same geographical location in the UK. Allergy 65(1):103-108.
Winberg, A., C. E. West, A. Strinnholm, L. Nordstrom, L. Hedman, and E. Ronmark. 2015. Assessment of allergy to milk, egg, cod, and wheat in Swedish schoolchildren: A population based cohort study. PLoS One 10(7):e0131804.
Wood, R. A., C. A. Camargo, Jr., P. Lieberman, H. A. Sampson, L. B. Schwartz, M. Zitt, C. Collins, M. Tringale, M. Wilkinson, J. Boyle, and F. E. Simons. 2014. Anaphylaxis in America: The prevalence and characteristics of anaphylaxis in the United States. J Allergy Clin Immunol 133(2):461-467.
Xepapadaki, P., A. Fiocchi, L. Grabenhenrich, G. Roberts, K. E. Grimshaw, A. Fiandor, J. I. Larco, S. Sigurdardottir, M. Clausen, N. G. Papadopoulos, L. Dahdah, A. Mackie, A. B. Sprikkelman, A. A. Schoemaker, R. Dubakiene, I. Butiene, M. L. Kowalski, K. Zeman, S. Gavrili, T. Keil, and K. Beyer. 2016. Incidence and natural history of hen’s egg allergy in the first 2 years of life—The EuroPrevall birth cohort study. Allergy 71(3):350-357.
Zuidmeer, L., K. Goldhahn, R. J. Rona, D. Gislason, C. Madsen, C. Summers, E. Sodergren, J. Dahlstrom, T. Lindner, S. T. Sigurdardottir, D. McBride, and T. Keil. 2008. The prevalence of plant food allergies: A systematic review. J Allergy Clin Immunol 121(5):1210-1218.


