
3
Prevalence
Overall, food allergy has been estimated to cost $24.8 billion annually in the United States, including direct medical costs and costs borne by the family (Gupta et al., 2013a). To determine more accurate estimates of cost and to prioritize efforts, accurate prevalence1 data are needed. Prevalence data also are important in helping to identify relationships between risk determinants and food allergies in specific populations. Various surveys of pediatricians and family practitioners, school teachers, school nurses, and the general public generally agree that the prevalence of food allergy in children has been increasing over the past two decades. A Data Brief published by the Centers for Disease Control and Prevention (CDC) in 2013 (Jackson et al., 2013) based on the National Health Interview Survey supports this notion (see Figure 3-1), but the true prevalence of food allergy in the past, or even the present, is uncertain and difficult to ascertain.
The term “food allergy” is often misunderstood and misused by the public and also by health care providers and researchers (see “Food Allergy Misconceptions” in Chapter 2), leading to inflated figures of prevalence reported from population-based surveys, ranging from 10 percent to 30 percent depending on the rigor of the questionnaires used. Even the definition of “food allergy” is not uniform (see “Commonly Accepted Definitions” in Chapter 2).
Unfortunately, no simple laboratory tests can be used to diagnose food allergy, especially non-immunoglobulin E (IgE)-mediated allergic reac-
__________________
1 Prevalence is the proportion of a population who have a specific characteristic (e.g., illness) in a given time period.
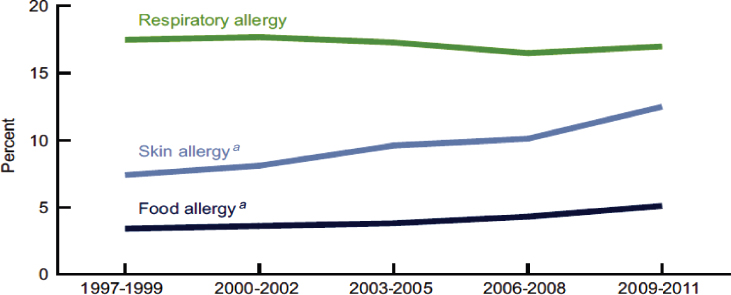
NOTES: Food allergy prevalence: Estimated based on an affirmative response to the National Health Interview Survey (NHIS) question: “During the past 12 months, has your child had any kind of food or digestive allergy?”
Respiratory allergy prevalence: Estimated based on affirmative responses to either of the two NHIS question(s): “During the past 12 months, has your child had hay fever?” and “During the past 12 months, has your child had any kind of respiratory allergy?”
Skin allergy prevalence: Estimated based on an affirmative response to the NHIS question: “During the past 12 months, has your child had eczema or any kind of skin allergy?” a Significant increasing linear trend for food and skin allergy from 1997-1999 to 2009-1011.
SOURCES: CDC/NCHS, National Health Interview Survey, NCHS Data Brief, May 2013 (Jackson et al., 2013).
tions. Instead, physicians must rely on a combination of medical history, food-specific skin prick test (SPT) and/or food-specific serum IgE (sIgE) results, and/or oral food challenges2 (OFCs) (preferably blinded) in order to accurately diagnose a food allergy (see Chapter 4). In a research setting, the gold standard to measure food allergy as an outcome is double-blind, placebo-controlled OFC (DBPCOFC). However, using such an approach in
__________________
2 There are three types of oral food challenges (OFCs) depending on the protocol. An open OFC is one where the food is in its natural form; a single-blind OFC is one where the food is masked from the patient’s perspective so less patient bias occurs because of anxiety; a double-blind, placebo-controlled OFC involves masking the tested allergen and feeding it or indistinguishable placebo randomly without the patient or observer knowing if the allergen or placebo is being tested.
large population-based studies to ascertain prevalence is impractical, very labor-intense, and extremely expensive, and is therefore almost never done. The first real attempt to assess food allergy prevalence in the United States was conducted in 1987 (Bock, 1987). Although the study might be limited by selection bias and the small number of subjects, the use of OFC make this a landmark study.
This chapter addresses the difficulties inherent in attempting to ascertain the true prevalence of food allergy and the strength of the evidence based on the design of various trials. It summarizes current knowledge about IgE-mediated food allergy prevalence data in the United States and abroad. Given the complexity of diagnosing food allergy in population-based studies, both the prevalence of food sensitization (i.e., by SPT or serum IgE concentrations) and food allergy (i.e., the presence of clinical allergy as documented by an unequivocal clinical history and supportive laboratory studies or OFC) are presented. The prevalence of food allergies resulting from sensitization to the food and systemic reactions involving the skin, respiratory tract, gastrointestinal tract, and/or cardiovascular system will be considered. Prevalence data based on systematic reviews and meta-analyses from the United States and Europe are presented first, followed by data from individual studies in all countries, where available. It should be noted that the vast majority of data on the prevalence of food allergy has been ascertained in the pediatric population, often children in the first decade of life. Recommendations for data collection and analysis to improve the prevalence estimates for food allergy are included at the end of the chapter, along with research needs.
APPROACH TO LITERATURE REVIEW
The primary resources for this chapter on prevalence were derived from the 2010 National Institute of Allergy and Infectious Diseases/National Institutes of Health (NIAID/NIH)-supported Guidelines for the Diagnosis and Management of Food Allergy in the United States and its associated systematic reviews3 (based on 51 publications) (Boyce et al., 2010; Chafen et al., 2010; Rona et al., 2007), and the 2014 European Academy of Allergy & Clinical Immunology’s (EAACI’s) Food Allergy and Anaphylaxis Guidelines: Diagnosis and Management of Food Allergy and its associated
__________________
3 According to the Cochrane Collaboration, “a systematic review is a review of a clearly formulated question that uses systematic and explicit methods to identify, select, and critically appraise relevant research, and to collect and analyze data from the studies that are included in the review” (Moher et al., 2009). Statistical methods are often used to analyze and summarize the results of the studies included in the review.
systematic review and meta-analysis4 (based on 65 publications based on 50 primary studies) (Nwaru et al., 2014). In addition, searches of EMBASE and Medline were selectively performed to identify studies and reports in the literature since 2012 (see Appendix B for literature search strategy). Meta-analyses, systematic reviews, and population-based or cohort prevalence studies were included. The summary of the findings of the individual studies and systematic reviews and meta-analysis used are presented in Appendix B.
DIFFICULTIES IN ASCERTAINING FOOD ALLERGY PREVALENCE
A variety of methodologies have been employed in an attempt to determine the prevalence of food allergy in various populations. Implementing designs and interpreting results from studies on food allergy prevalence have a number of challenges; some are commonly encountered within other research fields and others are unique to the field of food allergy. For example, the type of food allergy being assessed and the methodology used to assess it can have major impacts on the outcome. In this Chapter, prevalence figures will reflect IgE-mediated food allergies (except where otherwise noted), not non-IgE-mediated disorders. Pollen-associated food allergy is considered a form of IgE-mediated food allergy that typically results in oral and pharyngeal pruritus and mild edema. Pollen-associated food allergy occurs in some patients with allergic rhinitis when ingesting certain raw fruits, vegetables, tree nuts or peanuts. Pollen-associated food allergy5 is the result of sensitization to airborne pollen allergens that cross-react with homologous proteins in plant-derived foods. Ingesting the plant-derived foods elicits symptoms (Kazemi-Shirazi et al., 2000). With 47 to 70 percent of patients with allergic rhinitis reporting such symptoms (Katelaris, 2010), this form of food allergy could account for a food allergy prevalence of 5 to 19 percent in some regions (Sicherer, 2011). Also, the form of a food used in an OFC can affect the prevalence of food allergy (Osborne et al., 2011). Table 3-1 lists the challenges and below is a description of a selected number.
__________________
4 Meta-analysis refers to the use of statistical techniques in a systematic review that are used to integrate the results of included studies.
5 The homologous food allergens are generally heat-labile and susceptible to gastric digestion, thus limiting symptoms primarily to the oropharynx (Wang, 2013). Examples of allergenic pollens (and cross-reacting foods) that might result in pollen-associated food allergy include birch tree (apple, carrot, hazelnut, etc.), ragweed (melons and bananas), and grass pollens (tomatoes and strawberries).
TABLE 3-1 Factors Affecting the Accuracy of Prevalence Surveys
| Methodologies | History only versus history + laboratory data (SPT and/or serum IgE) versus history + laboratory data + physician diagnosis versus history + oral food challenge versus history + double-blind placebo-controlled oral food challenges. |
| Food challenge material | Cooked/baked versus raw food. |
| Selection bias | Selected cohort (e.g., allergy clinic based versus birth cohort) or unselected cohort. |
| Nonparticipation bias | Those affected are more likely to participate. |
| Timing of survey | Children “outgrow” many food allergies; adults may acquire food allergies late; varies with specific food being investigated (e.g., milk versus shrimp). |
| Definition | Pollen-associated food allergy, fairly frequent compared to classic generalized immediate food allergies. |
| Geographical region | Westernized countries tend to have greater prevalence of food allergies than less well developed countries. |
| Statistical analyses | Methods employed to handle missing data and nonparticipation. |
Selection Bias and Methodologies
Food allergy prevalence studies are conducted either on general populations or on specific cohorts (e.g., hospital cohort of individuals with signs of food allergy). Both approaches have advantages and disadvantages. Earlier prevalence studies often incorporated selected cohorts from hospital-based or allergy practices and extrapolated the results to the general population, which typically led to inflated prevalence figures. Population-based surveys are often employed given the ease of administration and an ability to incorporate large numbers of subjects at relatively low cost. Although tens of thousands of individuals can be included in such surveys, these studies rely on self-reporting of specific food allergies, or “perceived prevalence,” which uniformly results in higher prevalence rates than do studies incorporating more rigorous diagnostic methods. For example, the NIAID/NIH-supported Guidelines noted a self-report rate of food allergy in adults of 13 percent compared to a rate of 3 percent when food allergy was confirmed by DBPCOFCs (Boyce et al., 2010). More recent surveys have attempted
to use progressively more extensive questionnaires, inclusion of IgE testing (food-specific SPT and/or serum IgE levels), and rigorous statistical methods in an attempt to derive a more accurate picture of true prevalence.
In this chapter, studies reporting prevalence figures from questionnaires only have generally been excluded unless the investigators appropriately corrected for inherent biases or the study provided insights related to geographic or ethnic variation. Also, only population-based studies have been included as evidence.
Nonparticipation Bias
Even with increased rigor, such surveys are likely flawed by unintentional selection bias. For example, families and individuals affected by food allergy are more likely than unaffected families to participate in and complete a study involving extensive questionnaires and testing, leading to falsely elevated prevalence rates of food allergy. To minimize such bias, some investigators are now attempting to adjust for “nonresponse” bias. In the Surveying Prevalence of Food Allergy in All Canadian Environments study, Soller et al. telephoned 17,337 households, of which 14,113 were reached (Soller et al., 2015). Of this total, 5,734 households (representing 15,022 individuals) completed the full survey instrument, a 45 percent participation rate, which is a rate similar to that seen in other recent studies. An additional 524 households (4 percent) refused to answer the full questionnaire but agreed to answer an abbreviated form, and 6,504 households (51 percent) answered the phone but refused to provide any information. The self-reported prevalence of food allergy among the full participants was 6.4 percent (95% confidence interval [CI]: 6.0%-6.8%), which was significantly greater than the 2.1 percent (95% CI: 1.4%-2.9%) prevalence reported by those answering the abbreviated questionnaire. This study clearly shows that when assessing the outcome of prevalence surveys, it is essential to determine the percentage of individuals randomly selected who participated in the study, the percentage who dropped out before completion, and whether the rate of food allergy in those dropping out differed from those completing the trial.
Timing of Survey
It also is essential to note the timing of the evaluation and the type of food involved, as a survey of young children will yield a much higher prevalence of allergy to foods such as cow milk, egg, soy, or wheat than a survey conducted in the same children at age 10 years because the majority of young children will outgrow these food allergies.
FOOD ALLERGY PREVALENCE IN THE UNITED STATES AND EUROPE
Systematic Reviews and Meta-Analyses
Systematic reviews and meta-analyses have become increasingly important for addressing a variety of questions in health care and disease prevalence. International guidelines have evolved over the past decade to improve the quality of systematic reviews, such as the Preferred Reporting Items for Systematic Reviews and Meta-analyses (PRISMA) (Moher et al., 2009). More recently the PRISMA-P (Protocols) contains a checklist of 17 items considered to be essential and lists minimal components of a systematic review or meta-analysis protocol (Shamseer et al., 2015). Relatively few systematic reviews in the literature have incorporated all aspects of the PRISMA-P checklist. In this report, systematic reviews have been assessed based on the PRISMA checklist.
Based on a meta-analysis by Rona (Rona et al., 2007) and systematic reviews by the RAND Corporation (Chafen et al., 2010) and Zuidmeer (Zuidmeer et al., 2008), the NIAID/NIH-sponsored Guidelines (Boyce et al., 2010) reported that the prevalence of food allergy in the United States and several European countries was 12 to 13 percent by self-report, but only 3 percent when confirmed by laboratory studies and DBPCOFCs. As depicted in Table 3-2, several foods were analyzed individually, with marked differences dependent upon the stringency of the diagnostic criteria used. In general, the food challenge-proven prevalence of food allergy appears to be about one-quarter to one-third the rate of self-reported food allergy by questionnaire.
In 2012, the European Food Safety Authority published a review of the prevalence data in Europe (EFSA, 2013). In many studies prevalence was self-reported and, when OFC were conducted, protocols varied substantially. This work was not peer-reviewed so its findings are not included in this report. One of the EAACI systematic reviews and meta-analyses reviewed studies published from January 2000 through September 2012 on food allergy prevalence in Europe of eight foods or food groups (cow milk, egg, peanut, tree nuts, wheat, soy, fish, and shellfish) (Nwaru et al., 2014). Their analysis included only systematic reviews, meta-analyses, cohort, case-control, cross-sectional, and routine health care studies. The authors also analyzed the risk of bias in the studies using a modified relevant version of the Critical Appraisal Skills Programme quality assessment tool (http://www.casp-uk.net). Overall, 65 publications were reviewed representing 50 studies of which 27 were cross-sectional studies, 17 cohort studies, 3 systematic reviews, and 3 case-control studies. Only one study had an evidence grading of “strong” and the rest had a “moderate” grading. Although the
TABLE 3-2 Prevalence (Percent) of Food Allergy to Various Foods Ascertained by Self-Report or Oral Food Challenge
| Peanut (%) | Milk (%) | Egg (%) | Fish (%) | Crustacean shellfish (%) | Tree nuts (%) | Wheat (%) | Soy (%) | |
|---|---|---|---|---|---|---|---|---|
| Diagnostic Criteria | ||||||||
| Self-report | 0.6 | 3 | 1 | 0.6 | 1.2 | 0-4.1 | 0.2-1.3 | 0-0.6 |
| Oral food challenge | Not estimated | 0.9 | 0.3 | 0.3 | Not estimated | 0.1-4.3 | 0-0.5 | 0-0.7 |
SOURCE: Boyce et al., 2010.
TABLE 3-3 Prevalence (Percent) of Food Allergy to Various Foods Ascertained by Self-Report or Oral Food Challenge (Open Challenge or DBPCOFC)
| Peanut (%) | Milk (%) | Egg (%) | Fish (%) | Shellfish (%) | Tree nuts (%) | Wheat (%) | Soy (%) | |
|---|---|---|---|---|---|---|---|---|
| Diagnostic Criteria | ||||||||
| Self-report | 0.4 | 6 | 2.5 | 2.2 | 1.3 | 1.3 | 3.6 | Not estimated |
| Oral food challenge | 0.2 | 0.6 | 0.2 | 0.1 | 0.1 | 0.5 | 0.1 | 0.3 |
SOURCE: Nwaru et al., 2014.
42 studies included in the meta-analysis showed considerable heterogeneity, the authors ascertained overall lifetime prevalence estimates (see Table 3-3). The perceived prevalence rates of food allergies in the EAACI Guidelines were slightly higher than those noted in the NIAID/NIH-supported Guidelines, but the challenge-proven prevalence rates were generally lower. As noted in the NIAID/NIH-supported Guidelines, the prevalence of allergy to milk and egg were more common in young children, while the prevalence rates to peanut, tree nuts, fish and shellfish tended to be higher in adults. The authors caution about interpreting the results of this report because participation rates varied widely across the studies (17.3 to 99.5 percent) and in several studies no information was provided on participation rates.
More recently, two systematic reviews on the prevalence of specific foods have been published: soy (Katz et al., 2014) and tree nuts (McWilliam et al., 2015). Katz et al. (2014) included 40 studies published between 1909 and 2013 on soy allergy in their systematic review and meta-analysis out of 357 potential studies initially identified. In addition, they judged the quality of the publications using the GRADE scoring system (Atkins et al., 2004). The majority of the studies were cross-sectional or cohort studies with moderate to low quality methodological design and evident bias largely due to insufficient sample size, patients’ countries of origin, and the length of time followed in longitudinal studies (follow-up data collection is important because the prevalence of food allergy changes with age). The authors calculated the prevalence of soy allergy in the general population based on self-reporting to be 0.2 percent (95% CI: 0.0%-0.3%). Based on OFC outcomes, the prevalence in the general population was 0.27 percent (95% CI: 0.1%-0.44%) and in patients referred to centers for evaluation of allergy, 1.9 percent (95% CI: 1.1%-2.7%). The prevalence of sensitization based on positive SPT results was 0.1 percent (95% CI: 0%-0.2%) in the general population and 12.7 percent (95% CI: 5.8%-16.7%) in referred patients. In 11 studies where participants had both OFCs and SPTs or sIgE performed, only 11.2 percent of sensitized patients reacted to soy following ingestion. Interestingly, of 1,430 infants younger than age 6 months identified in three studies, only 0.1 percent (2 infants) likely had soy allergy, suggesting that the prevalence of soy allergy is much lower than presently believed. However, it should be noted that 9 out of the 11 studies were conducted in Europe, 1 was conducted in Israel), and none was conducted in the United States, where the prevalence of soy allergy is believed to be higher.
McWilliam et al. performed a systematic review and meta-analysis on the prevalence of tree nut allergy, which was defined as allergy to almond, Brazil nut, cashew, hazelnut, macadamia nut, pecan, pistachio, or walnut (McWilliam et al., 2015). The authors identified 36 studies published between January 1996 and December 2014. The majority of studies were in children (24 of the 36 studies identified) and from European countries (18
from Europe, 8 from the United Kingdom, and 5 from the United States). Studies reporting tree nut allergy based on self-report, allergic sensitization (skin tests and/or serum IgE to individual tree nuts), food challenges (OFC or DBPCOFC) or convincing clinical histories were considered eligible for inclusion. In an attempt to reduce selection bias, only population-based cross-sectional and cohort studies were included. Studies on selected patient groups or those performed in a hospital or allergy clinic settings were excluded. In assessing the quality of the studies included in the analysis, 28 studies were graded as moderate and 8 were graded as poor due to participation rates, objectivity of outcomes, and study design. In seven studies using OFCs or recent convincing history, plus evidence of tree nut–specific IgE to define nut allergy, the overall prevalence of tree nut allergy ranged from 0 to 1.6 percent. In nine studies using less rigorous criteria, namely self-reported allergy with physician diagnosis or evidence of sensitization (positive skin tests or specific IgE to tree nuts), the overall probable prevalence of tree nut allergy was calculated to be 0.05 to 4.9 percent. The majority of studies were based on self-reporting of tree nut allergy and yielded an overall prevalence range of 0.18 to 8.9 percent in adults and 0.0 to 3.8 percent in children. The authors noted regional differences in the prevalence of tree nut allergies, with northern European countries reporting the highest rates, largely due to pollen-associated food allergy. [Pollen-associated food allergy in northern Europe is due primarily to cross-reactivity with a homologous pollen protein (Bet v 1) in patients with allergic rhinitis to birch pollen.] The most common tree nut allergy reported in the European studies was hazelnut allergy, accounting for 17 to 100 percent of all tree nut allergies, whereas walnut (20 to 30 percent of all tree nut allergy) and cashew (15 to 30 percent) were the most common tree nut allergies reported in the United States. Brazil nut (24 to 33 percent) was the most common nut allergy reported in the United Kingdom (McWilliam et al., 2015). Limited evidence was available to address the question of whether tree nut allergy has been increasing in prevalence, but as depicted in Figure 3-2, using the same random digit-dial survey, in the United States (an unselected cohort, not a national survey) the prevalence of tree nut allergy in children younger than age 18 years was estimated to have increased significantly from 0.2 percent in 1997 to 1.1 percent in 2008 (Sicherer et al., 2010). In the 1997 survey, 5,300 households (13,534 individuals) participated, of which 188 households (3.6%; 95% CI: 3.1%-4.1%) reported 1 or more individuals with peanut allergy, tree nut allergy, or both. Race/ethnicity was determined only from the responding household member. The authors concluded that heterogeneity in tree nut allergy prevalence in different parts of the world appears to be significant, but that the limited high-quality data make it difficult to ascertain the true prevalence of tree nut allergy, especially to individual tree nuts (McWilliam et al., 2015).
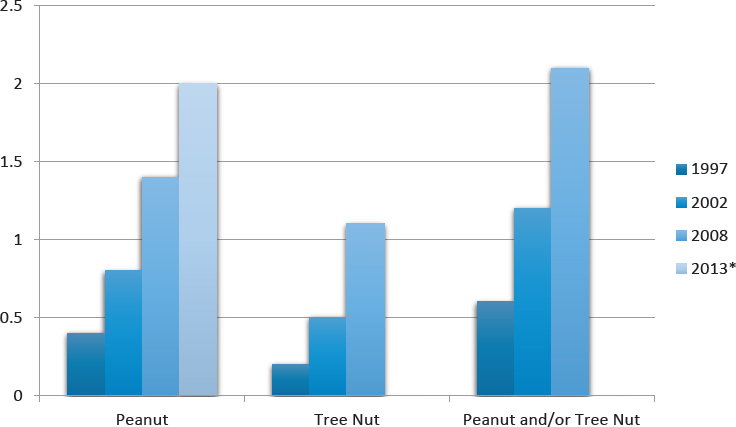
SOURCES: *Bunyavanich et al., 2014; Sicherer et al., 2010.
Given the known racial disparity in other atopic disorders such as asthma, two recent systematic reviews attempted to address the question of racial disparities of food allergy in the United States. In one report, the authors were able to analyze 20 out of 645 articles initially identified (Greenhawt et al., 2013). The analyzed studies used a variety of criteria to define food allergy, including self-reporting, evidence of IgE sensitization, discharge codes (i.e., ICD-9), chart reviews, and event-reporting databases. Although 12 studies suggested that African American children had significantly increased odds of food sensitization and allergy, major differences in methodology and reporting did not permit calculation of pooled estimates or confirmation of definitive racial or ethnic disparities in food allergy among African American and white children in the United States. In the second study, the authors evaluated 27 different surveys representing more than 450,000 children covering the period from 1988 to 2011 (Keet et al., 2014). As noted in the previous systematic review, no summary estimates of food allergy prevalence in the different racial or ethnic groups could be determined because of the heterogeneity of the surveys.
In summary, both systematic reviews and meta-analyses have examined questions related to the prevalence of food allergy in the United States and in other countries. However, limitations in the quality of the data make it difficult to come to firm conclusions about the prevalence of food allergy.
Recent Population-Based Studies in the United States
No large population-based or unselected cohort studies that include both laboratory and OFC confirmation of food allergy have been performed in the United States.
A CDC report suggested that 3.9 percent of American children younger than age 18 years had a food allergy (Branum and Lukacs, 2009). The authors’ prevalence figure was based on an assessment of cross-sectional survey data from the 1997-2007 National Health Interview Survey, the 2005-2006 National Health and Nutrition Examination Survey (NHANES), 1993-2006 National Hospital Ambulatory Medical Care Survey (NHAMCS) and the 1998-2006 National Hospital Discharge Survey (NHDS). These surveys consisted of reports of food allergy and assessments of serum IgE antibody levels for specific foods, ambulatory care visits, and hospitalizations. A related CDC analysis (Branum and Lukacs, 2008) used NHDS data to show an increase in the rate of hospital discharges related to food allergy (see Figure 3-3).
In 2014, the prevalence of sensitization to food and environmental allergens was published based on the results from NHANES 2005-2006 data and compared to earlier sensitization rates determined in the previous NHANES III survey (Salo et al., 2014). NHANES 2005-2006 included
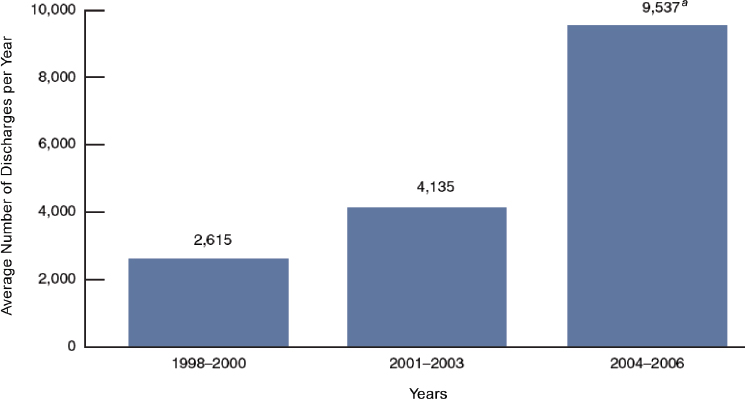
SOURCES: CDC/NCHS (Branum and Lukacs, 2008).
10,348 participants from throughout the United States and, and to ensure adequate samples for subgroup analyses, contained an oversampling of persons of low income, adolescents ages 12 to 19 years, adults ages 60 years and older, African Americans, and Mexican Americans (see http://www.cdc.gov/nchs/nhanes2005-2006/nhanes05_06.htm [accessed August 31, 2016] for a description of survey design and methods). Of the 1,355 children ages 1 to 5 years, 856 (63.2 percent) were determined to have had IgE antibody levels to three food allergens: egg, cow milk, and peanut, and of 8,086 participants, ages 6 years and older, 7,268 (89.9 percent) had IgE determined for egg, cow milk, peanut, and shrimp. Food-specific IgE (sIgE) levels ≥0.35 kUA/L were considered positive for sensitization. Each group also was tested for IgE antibodies to 6 and 15 inhalant allergens, respectively. Overall, 36.2 percent of children ages 1 to 5 years and 44.6 percent of individuals ages 6 years and older were sensitized to at least one environmental and/or food allergen. Sensitization to milk and egg were significantly greater in the ages 1 to 5 years group (22 percent and 14 percent, respectively), compared to the age 6 years and older group (5 percent and 3.3 percent, respectively), with a marked decline in the prevalence of sensitization occurring over the first decade of life. The prevalence of peanut sensitization was similar in the two groups, about 7 percent and 8 percent, respectively. Among children ages 6 years and older, sensitization to food allergens was most prevalent in the South, and only peanut sensitization showed regional differences. In children ages 1 to 5 years, only sIgE levels to peanut were associated with urbanization. NHANES 2005-2006 data provide a good snapshot of IgE sensitization to the three most common food allergens in the United States—egg, cow milk, and peanut—but as described above, sensitization does not equate with clinical reactivity and so the actual number of Americans at risk of clinical reactions to these foods cannot be determined.
In the past 5 years, a few population-based, cross-sectional surveys have been conducted in an attempt to determine the prevalence and severity of food allergy in the United States. In one study, administered between June 2009 and February 2010, Gupta et al. collected data on 40,104 children from U.S. households (Gupta et al., 2011, 2013b); 6,100 were recruited from a web-enabled panel that was statistically representative of U.S. households with children and an additional 33,900 were obtained from an online sample of U.S. households with children that had access to the Internet. Food allergy was categorized as “convincing” or “confirmed.” A convincing history was based on the report of one or more allergic symptoms after ingesting a food and a confirmed food allergy was considered a convincing history plus a physician diagnosis with evidence of IgE antibody testing to the food or a positive OFC. Reportedly, 70.4 percent of children considered with a food allergy in the analysis had a physician’s diagnosis
and evidence of sIgE antibodies (47.3 percent were evaluated by SPT and 39.9 percent by serum sIgE levels) or a positive OFC (20.2 percent) (Gupta et al., 2013b). Overall, complete data were available on 38,480 children (96 percent), but due to the method of sampling, a rate of nonparticipation, which could affect selection bias, could not be provided. Based on this study, the overall prevalence of convincing and confirmed food allergy in children in the United States was estimated to be 8 percent (95% CI: 7.7%-8.3%), with more than one food allergy reported in 2.4 percent of all children (95% CI: 2.2%-2.6%), or about one-third of the children with a reported food allergy (Gupta et al., 2011). The prevalences of reported allergy to individual foods in the U.S. pediatric population are depicted in Table 3-4. Severe reactions (defined as reports of anaphylaxis, low blood pressure, trouble breathing or wheezing, or a combination of vomiting, angioedema, and coughing) were reported in 38.7 percent of the children with food allergy, with the odds of severe reactions progressively increasing with age and peaking in adolescent ages 14 to 17 years. The authors noted that the odds of having a food allergy were significantly higher among Asian and African American children compared to Caucasian children, which is in agreement with the NHANES 2005-2006 data described above. Although this study provides some insight into the perceived prevalence of food allergy in children, the survey was not validated and, moreover, results from a self-reporting survey must be interpreted with caution.
In subsequent publications using data from their 2009-2010 survey, Gupta et al. evaluated the geographical variability of food allergy in the United States (Gupta et al., 2012). The odds of having a food allergy was found to be significantly greater in southern and middle latitudes of the United States as compared to northern latitudes, suggesting a north-to-south increase in the prevalence of food allergy. Interestingly, this finding is in contrast to an analysis of food-related admissions to U.S. emergency departments based on the NHAMCS data for emergency department visits to noninstitutional hospitals from 1993 to 2005 (Rudders et al., 2010), which suggested that acute food-allergic reactions are higher in northeastern regions as compared to southern regions. Similarly, a survey of epinephrine auto-injector prescriptions, used as a partial surrogate for food allergy, indicated a strong north-south gradient, with the highest prescription rates found in New England (Camargo et al., 2007). Gupta et al. (2012) also reported that the prevalence of food allergy was higher in urban centers compared to rural areas, 9.8 percent versus 6.2 percent, respectively, with peanut allergy being the most prevalent in urban centers and milk the most prevalent in rural areas (Gupta et al., 2012). There appeared to be a direct correlation between the density of the population in an area and the prevalence of food allergy, but no difference in severe food allergy based on urban versus rural status or latitude.
TABLE 3-4 Prevalence of Food Allergy to Various Foods Ascertained by Convincing History Plus a Physician Diagnosis with Evidence of IgE Antibody Testing to the Food or a Positive Oral Food Challenge, Children in the United States
| Peanut (%) | Milk (%) | Egg (%) | Fish (%) | Shellfish (%) | Tree nuts (%) | Wheat (%) | Soy (%) | |
|---|---|---|---|---|---|---|---|---|
| Prevalence | 2 | 1.7 | 0.8 | 0.5 | 1.4 | 1.0 | 0.4 | 0.4 |
SOURCE: Gupta et al., 2011.
In an attempt to ascertain the prevalence of peanut allergy in American children, Bunyavanich et al. used data from the Viva Project’s unselected observational birth cohort to determine the frequency of the allergy in children ages 7 to 10 years (Bunyavanich et al., 2014). The study of 2,128 children was designed to examine maternal dietary and other factors that could influence their child’s health. Overall, 1,277 children underwent a mid-childhood visit following their baseline visit in early childhood. Of these children, 616 (29 percent of the original cohort) had serum peanut-specific IgE antibody levels measured. Children who returned for the mid-childhood visit tended to be from a higher socioeconomic status than children who failed to follow up, but parental atopy6 was comparable in both groups. Various criteria for diagnosing peanut allergy to determine prevalence in this cohort were provided: self-reported peanut allergic reactions—4.6 percent; peanut allergy based on serum IgE sensitization (IgE ≥0.35 kUA7/L; as used in NHANES 2005-2006)—5.0 percent; peanut-IgE + prescription for epinephrine auto-injector—4.9 percent; peanut-IgE ≥14 kUA/L—2.9 percent; and peanut-IgE ≥14 kUA/L + prescription for epinephrine autoinjector—2.0 percent. Although less than one-third of the children in the original cohort were evaluable and diagnoses were not established by OFC, OCF data suggested a higher prevalence of peanut allergy, i.e., 2.0 percent, than previously reported in the United States. The authors noted that this study was conducted in the northeast, which other studies suggest tends to have higher rates of peanut allergy than other regions in the United States (Salo et al., 2014).
In summary, since the systematic review and meta-analysis published by the RAND Group in 2010 suggesting that food allergy in the United States affects more than 2 percent and less than 10 percent of the population (Chafen et al., 2010), attempts to define the prevalence of food allergy in the U.S. population have been confined to self-reports with variable confirmatory evidence in two large cohort studies and information from the NHANES 2005-2006 survey, but no large prospective studies involving confirmatory food challenges have been conducted. Based on this more recent evidence, it is likely that 3.9 to 8 percent of the U.S. population ages 18 years and younger is affected by food allergy (Branum and Lukacs, 2009; Gupta et al., 2011), but regional and racial differences are likely. Well-designed population-based studies are needed.
__________________
6 The genetic tendency to develop the classic allergic diseases—atopic dermatitis, allergic rhinitis (hay fever), and asthma.
7 Kilo units of allergen-specific IgE.
Recent Population-Based Studies in Europe
In 2005, the European Union launched the EuroPrevall Surveys, a series of multinational epidemiological surveys aimed at determining the prevalence of food allergy in children and adults across Europe. These surveys were performed as multicenter, cross-sectional studies in general populations with case-control studies nested within the surveys. Studies were performed in children ages 7 to 10 years and adults between ages 20 to 54 years in the eight centers representing different social and climatic regions in Europe (Kummeling et al., 2009). Participants for these studies were selected in stages. The first stage involved community-based surveys using a short questionnaire to collect basic information on adverse reactions to foods. The sampling for these surveys was not random, but was based on established criteria. Surveys needed to be administered in areas with preexisting boundaries that had total populations of at least 200,000 people and had current registries that could be used to sample children ages 7 to 10 years and adults ages 20 to 54 years. Each center targeted a population of about 3,000 respondents, and attempts were made to determine and code reasons for nonresponse. In the second stage, all those in the first stage who indicated some type of adverse reaction to priority foods and a random selection of those reporting no reaction completed a detailed questionnaire and provided a blood sample to determine IgE sensitization. In the third stage, all those who indicated a reaction to a food and demonstrated IgE antibodies to the food were invited for a full clinical evaluation, including a standardized DBPCOFC. The study excluded those with a history of anaphylaxis, which could lead to a small error. However, conducting oral challenges in such individuals raises ethical concerns. Aside from this limitation, EuroPrevall and its protocols were well designed. It should be noted, however, that adherence to and completion of the OFC protocols showed considerable variability.
To date, the EuroPrevall group has published self-reporting and IgE sensitization rates on 17,366 adults from the eight centers participating in the study (Burney et al., 2014). Overall, 21 percent of the adults reported reactions to particular foods, ranging from 37 percent in the Alpine area of Europe to less than 2 percent in Northern Europe. Physician-diagnosed food allergy was 4.4 percent overall and ranged from 7.5 percent in Alpine and Mediterranean regions to <1 percent in Northern Europe and the Balkans. The overall prevalence rate of IgE sensitization to all foods was 15.81 percent and ranged from 23.6 percent in the Alpine region to 6.6 percent in the Northern Maritime region. Birch pollen–related foods, i.e., hazelnut, peach, apple, carrot, celery, and peach accounted for highest overall rates of sensitization, from 9.3 percent to 6.3 percent, while egg, milk, and fish accounted for the lowest rates, 0.86 percent to 0.22 percent,
with significant regional variation. The prevalence of true food allergy in European adults remains to be established because DBPCOFCs have not been performed in adults. However, it was noted that in different regions of Europe, the prevalence of sensitization to foods is strongly associated with the prevalence of IgE sensitization to aeroallergens (e.g., birch pollen, mugwort) whereas sensitization to nonpollen-related foods (e.g., egg, milk, and fish) is quite rare.
In an expanded multicenter epidemiologic study involving 12 European centers, the EuroPrevall group identified 731 adults from a cross-sectional survey of 2,273 participants who reported reactions to hazelnut occurring 2 hours or less following ingestion (Datema et al., 2015). Twenty-two individuals had a clear-cut history of anaphylaxis and 124 agreed to undergo a DBPCOFC. In those challenged, 87 (70 percent) were found to be responders. Birch pollen–driven hazelnut sensitization (Cor a 1) dominated in most areas, except in Iceland and the Mediterranean areas. Sensitization to the hazelnut storage proteins Cor a 9 and 14 (i.e., those more often associated with generalized allergic reactions) was significantly more common in children compared to adults, 42.0 percent versus 5.8 percent, respectively, except in the Netherlands where 90 percent of adults were sensitized to Cor a 9 or 14. No potential explanation was given for such high rates.
In parallel with the EuroPrevall study, Dutch investigators sought to determine the difference in reporting and prevalence of food allergy among community participants in the EuroPrevall study and those referred to a tertiary allergy center with suspected food allergy (Le et al., 2015). The investigators confirmed the previously reported discrepancies between self-reported food allergy, food allergy defined by suggestive history plus supporting lab data (sIgE), and food allergy confirmed by DBPCOFC—10.8 percent versus 4.1 percent versus 3.2 percent, respectively. They also found large differences in self-reported food allergies between the community-based EuroPrevall cohort and those referred to allergy centers, but sensitization and DBPCOFC-proven food allergies did not differ significantly between the two groups except for milk and egg allergy. These differences in clinically confirmed food allergy rates in the community versus in the allergy centers reinforce the need to use population-based studies when determining the prevalence of food allergy in the general population and not to extrapolate from referral populations, particularly when using questionnaires.
The EuroPrevall group also enrolled a birth cohort of 12,049 from 9 centers throughout Europe between October 2005 and March 2007 (McBride et al., 2012), and followed up at ages 1 year and 2 years. This is the largest birth cohort reported to date. Overall, 1,928 parents contacted the study centers about possible adverse food reactions in their children
and, based on annual follow-up questionnaires, an additional 684 children were suspected of having potential allergic disease (Schoemaker et al., 2015). Of this group, 358 children met the criteria to undergo a DBPCOFC to milk and 248 (69 percent) agreed to at least one food challenge. Fifty-five children experienced a positive result for an overall incidence of cow milk allergy of 0.54 percent (95% CI: 0.41%-0.70%). The incidence varied by country with the highest incidence of cow milk allergy in the United Kingdom and the Netherlands (1 percent) and the lowest (<0.3 percent) in Germany, Lithuania, and Greece. Nearly 25 percent of the children had non-IgE-mediated cow milk allergy, especially those from the United Kingdom, the Netherlands, and Poland. Of the 32 children with cow milk allergy who were evaluated 1 year later, 22 (69 percent) were tolerant to milk, including all those with non-IgE-mediated cow milk allergy and 57 percent of those with the IgE-mediated form of the allergy. This study reports the lowest incidence of cow milk allergy in recent times, but is subject to a number of limitations. First, about 30 percent of the children did not undergo a DBPCOFC. Second, the numbers of eligible infants in each center who did not participate in the study were not reported so it is not possible to assess the role of selection bias. Finally, only a limited number of children underwent a rechallenge to cow milk at 1 year and so the true proportion of children that became tolerant is less certain.
A similar evaluation of hen egg allergy was conducted in the EuroPrevall birth cohort (Xepapadaki et al., 2016). Overall, 2,612 children were identified by parental report (N=1,928) or during annual follow-up questionnaires (N=684) about possible adverse food reactions in their children to hen egg. Following a standardized evaluation, 298 (27 percent) of the children were invited for a DBPCOFC to egg and 172 (58 percent) agreed to be challenged; 86 (50 percent) experienced a positive challenge to pasteurized egg powder, for an overall raw incidence of 0.84 percent (95% CI: 0.67%-1.03%). After adjusting for eligible children who refused the challenge, the overall incidence of egg allergy in Europe was estimated to be 1.23 percent (95% CI: 0.98%-1.51%), with the United Kingdom reporting the highest prevalence at 2.18 percent (95% CI: 1.27%-3.47%) and Greece reporting the lowest prevalence at 0.07 percent (95% CI: 0.00%-0.37%). This rate of egg allergy was markedly lower than the recently reported 8.9 percent prevalence of egg allergy in a population-based cohort in Australia of infants age 1 (Osborne et al., 2011), discussed below. Overall, one-half of the egg allergic children reportedly became tolerant to egg within 1 year following the initial diagnosis (Xepapadaki et al., 2016). A major limitation of this study was the large numbers of parents who refused to have their children challenged and no indication of the number of eligible children from each site who did not participate, eliminating the possibility of identifying selection bias. Nevertheless, this study represents the largest multi-center birth
cohort evaluated for egg allergy and demonstrated a variable rate of egg allergy across different regions of Europe.
In 2010, a cohort of 2,612 children (ages 11 to 12 years) from three Swedish municipalities (96 percent participation) were evaluated by questionnaire and a random subset was further evaluated by skin testing and DBPCOFC. Overall, 4.8 percent (95% CI: 4%-6%) reported allergy to one or more common foods, i.e., cow milk, egg, fish, and/or wheat (Winberg et al., 2015). About one-fourth of the children who underwent clinical examination (1.4 percent) were diagnosed with a food allergy, and only 0.6 percent were diagnosed after undergoing a DBPCOFC. This study provides some insight on the prevalence of food allergy in Sweden and further evidence that self-reported rates of food allergy consistently overestimate true prevalence of food allergy.
A cross-sectional survey was conducted in 19 children’s day care centers from two Portuguese cities selected following randomization and cluster analysis (Gaspar-Marques et al., 2014). Questionnaires derived from the International Study of Asthma and Allergies in Childhood and supplemented with questions on food allergy were distributed to 2,228 parents and returned by 1,225 (55 percent). The median age of the children sampled was 3.5 years; 38.3 percent were ages 0 to 3 years, and 61.7 percent were ages 4 to 6 years. Parents reported that 10.8 percent (95% CI: 9.1%-12.6%) of the children ever had a food allergy and 5.7 percent (95% CI: 4.6%-7.2%) currently had a food allergy. Milk (2.8 percent), strawberry (2.3 percent), chocolate (1.4 percent), egg (1.0 percent) and shellfish (0.7 percent) were the most commonly reported foods. Although no attempt was made to validate food allergy with laboratory studies or OFC, the prevalence of parental-perceived food allergy is considerably lower than that reported for some countries in the EuroPrevall study, such as Germany (30 percent), Iceland, the United Kingdom, and the Netherlands (20 to 22 percent), but similar to those in others, such as Lithuania, Greece, Poland, and Spain (5 to 8 percent) (McBride et al., 2012). Like many epidemiological studies on food allergy, the use of parental reporting by questionnaire may lead to misclassification, which could explain the high perceived prevalence of allergy to strawberry and chocolate, and selection bias due to the high rate of nonresponders.
In summary, a variety of studies have been conducted in European countries to ascertain prevalence of food allergy in various populations and to various food allergens. In the most ambitious study, the EuroPrevall Surveys, 8 European centers enrolled about 3,000 individuals each to conduct questionnaires, IgE sensitization tests, and DBPCOFC. The results from DBPCOFCs in children have been published for milk and eggs; additional prevalence data will be forthcoming. No OFC were performed in adults. Although these studies provide some insights, inconsistencies
in the implementation across countries make it difficult to come to firm generalizations about food allergy prevalence in Europe for children or for adults.
PREVALENCE OF FOOD ALLERGY IN OTHER PARTS OF THE WORLD
Australia
One of the most comprehensive population-based studies to date was conducted in Melbourne, Australia, as part of the HealthNuts Study (Osborne et al., 2011). Importantly this study used a formal sampling frame to ensure that the study is truly population-representative (Osborne et al., 2010). Parents of infants between the ages of 11 and 15 months attending one of 120 immunization clinics were enrolled and a short interview was conducted with all nonparticipants to assess potential participation bias. Overall, 3,898 parents were approached and 2,848 (73.1 percent) agreed to participate; 99.1 percent of the nonparticipants completed the nonparticipant interview. Of those infants enrolled, 98.4 percent had SPT to four of five foods (egg, peanut, sesame, shrimp, or cow milk). Any participant with a detectable wheal size (1mm greater than the negative control) was invited for an OFC, which was conducted with research staff blinded to SPT result and history of previous reaction. The challenges were undertaken irrespective of wheal size or history of previous reaction unless the reactions occurred in the previous 1 month and predetermined objective stopping criteria were used (Koplin et al., 2012). At the time of OFC, repeat SPT wheal (i.e., small swelling) diameters 1 mm or greater than the negative control were considered positive, and 21.0 percent (95% CI: 19.5%-22.5%) were positive to one or more foods: raw egg—11.8 percent (95% CI: 10.6%-13.0%); peanut—6.4 percent (95% CI: 5.5%-7.3%); sesame—1.6 percent (95% CI: 1.2%-2.1%); shellfish—0.4 percent (95% CI: 0.2%-0.7%); and milk—5.6 percent (95% CI: 3.2%-8.0%). More than 90 percent of infants with a positive SPT to egg, peanut, and/or sesame underwent a food challenge regardless of skin test size, with an overall prevalence of challenge-confirmed food allergy among participants of 10.4 percent (95% CI: 9.3%-11.5%): raw egg—9.0 percent (95% CI: 7.8%-10.0%); peanut—2.9 percent (95% CI: 2.3%-3.6%); and sesame—0.7 percent (95% CI: 0.4%-1.0%). Of 88 infants reactive to raw egg, 80.3 percent did not react to 1.1 g of egg protein baked in a cake. Oral food challenges to milk were not performed, but IgE-mediated type reactions to milk were reported in 2.7 percent (95% CI: 2.1%-3.4%) of infants. Accounting for differences among participants and nonparticipants only marginally decreased the estimated prevalence of food allergy, e.g., peanut—2.9 percent (95% CI: 2.3%-
3.6%) to 3.0 percent (95% CI: 2.4%-3.8%) (Osborne et al., 2011). One of the greatest strengths of this survey is the diagnosis of food allergy based on challenge-proven outcomes. Despite the use of such rigorous diagnostic criteria, the prevalence of food allergy in this population of children age 1 year is the highest reported to date and may reflect the apparent higher prevalence of allergic disease in Australia or the increasing prevalence of food allergy worldwide. This cohort, which is now being followed and has been re-examined at ages 2, 4, 6, and 10 years (Koplin et al., 2015), will provide interesting insights into the natural history of food allergy.
Africa
Few epidemiologic studies on the prevalence of food allergy have been performed in other parts of the world. Kung et al. attempted a systematic review of food allergy in Africa and found very limited information from 11 countries (Kung et al., 2014). No population-based surveys and few case-controlled cross-sectional studies have been conducted. Most studies relied on self-reporting and in some cases skin testing in selected populations. Nevertheless, the investigators concluded that while not common, food allergy is an increasing problem in several emerging African countries. A preliminary feasibility study of food sensitization and challenge-proven food allergy was conducted in Cape Town, South Africa (Basera et al., 2015). The authors concluded that future studies in this black African infant cohort will be helpful in determining the prevalence of food sensitization and allergy in an African population.
Asia
A systematic review of food allergy in Asia yielded 53 original articles from Southeast Asia. Of these, 13 were epidemiologic studies and most had major design limitations resulting in low-grade evidence (Lee et al., 2013). The overall prevalence of self-reported or questionnaire-based food allergy in the pediatric population ranged from 3.4 percent to 11.1 percent. Egg and milk allergy were the most common food allergies in infants and young children, 0.15 percent to 4.4 percent and 0.33 percent to 3.5 percent, respectively. Shellfish (crustaceans and mollusks) allergy was the most common food allergy in older children and adults (reportedly 5.12 percent and 5.23 percent in the Philippines and Singapore, respectively), and it was the leading cause of anaphylaxis in Southeast Asia. Wheat allergy was reportedly the leading cause of anaphylaxis in children in Japan, with a prevalence of 0.37 percent.
A population-based survey of fish allergy in the Philippines, Singapore, and Thailand was conducted in randomly selected secondary schools using
structured written questionnaires followed by an extended questionnaire in those responding positively to the initial survey (Connett et al., 2012). Overall, 19,966 out of 25,842 initial surveys were returned (11,434 [81.1 percent] from the Philippines, 6,498 [67.9 percent] from Singapore and 2,034 [80.2 percent] from Thailand). The prevalence of a convincing history of fish allergy was greatest in the Philippines—2.29 percent (95% CI: 2.02%-2.56%) compared to 0.26 percent (95% CI: 0.14%-0.79%) in Singapore and 0.29 percent (95% CI: 0.06%-0.52%) in Thailand.
Two cross-sectional studies of food allergy prevalence also have been conducted in China showing an increase in food sensitization and allergy prevalence in infants between 1999 and 2009 (Hu et al., 2010). These studies, however, were small and could be subject to selection bias and therefore could report a higher level than the actual prevalence.
A cross-sectional survey of adolescents from 34 state elementary schools in Ankara province in Turkey included an initial survey followed-up by a phone survey with families that reported a food allergy and then a clinical evaluation of children who had a history compatible with food allergy following the phone survey (Kaya et al., 2013). Of 11,233 questionnaires distributed to 6th, 7th, and 8th grade students at the 34 schools, 10,096 (89.9 percent) questionnaires were returned (mean age of students was 12.9 + 0.9 years) and 1,139 (11.2 percent) reported a food allergy. The parent-reported lifetime prevalence of food allergy was 11.3 percent (95% CI: 10.7%-11.9%) and the point prevalence8 was 3.6 percent (95% CI: 3.2%-3.8%). All children’s families who reported a food allergy and 200 others who reported no food allergy were contacted by an allergy specialist by phone. After reviewing the case histories, 133 cases were compatible with a food allergy and 107 agreed to participate in a clinical evaluation including SPT, serum IgE levels, open OFC, and in some cases DBPCOFC. Following clinical evaluation, including OFC, the prevalence of IgE-mediated food allergy was found to be 0.15 percent, with allergy to peanut (0.05 percent) and tree nuts (0.05 percent) being the most common. Strengths of this study include its large sample size and progressive diagnostic evaluation, including OFC documentation of food allergy.
In summary, relatively few population-based studies have attempted to determine the prevalence of food allergy in countries outside of Europe and the United States. These data have been limited by a number of shortcomings: small sample size, selection bias related to sampling methodology and low response rates, use of parental reporting of food allergy and/or SPT/serum IgE levels, and when included, variable OFC methodologies. One exception is Australia, which has mounted a robust effort to determine
__________________
8 The proportion of a population that has the condition at a specific point in time.
prevalence. Data emerging from this effort will provide valuable insights into natural history and prevalence.
PREVALENCE OF FOOD ALLERGY–INDUCED ANAPHYLAXIS
Systematic Reviews and Meta-Analysis
Umasunthar et al. performed a systematic review and meta-analysis to determine the incidence of food-induced anaphylaxis in individuals with food allergy (Umasunthar et al., 2015). The systematic review identified 34 studies, primarily from North America, Europe, and Australia, out of 2,552 article titles that could be used to contribute data to the meta-analysis. Study results showed marked heterogeneity, most likely due to the variation in study populations, definitions of anaphylaxis used, and data collection methods. In individuals with food allergy, medically coded food anaphylaxis had an incidence rate9 of 0.14 per 100 person-years (95% CI: 0.05-0.35). At ages 0 to 19 years, the incidence rate for anaphylaxis in those with food allergy was 0.20 (95% CI: 0.09-0.43) and at ages 0 to 4 years, the authors reported an incidence rate of up to 7.00 per 100 person-years. In food-allergic patients, the incidence rate of hospital admission due to food anaphylaxis was 0.09 (95% CI: 0.0-0.67) per 1,000 person-years, with an incidence rate of 0.20 (95% CI: 0.10-0.43) at ages 0 to 19 years based on eight studies and 0.50 (95% CI: 0.26-0.93) at ages 0 to 4 years based on six studies. The authors concluded that “the incidence of medically coded anaphylaxis for a food allergic person is greater than the general population incidence of accidental death, but is likely to be significantly lower than the incidence of Emergency Department attendance due to motor vehicle accidents” (Umasunthar et al., 2015, p. 1624). The highest rates of medically coded food anaphylaxis and hospital admissions for food anaphylaxis were seen in preschool children, in contrast to reports of fatal food anaphylaxis, which are most commonly reported in adolescents and young adults.
Using the PRISMA guidelines, Umasunthar et al. also performed a systematic review and meta-analysis to determine the incidence of fatal food anaphylaxis in individuals with food allergy (Umasunthar et al., 2013). Out of 2,552 original titles, 13 studies, conducted in North America, Europe, Australia, Brazil, and Israel, describing a total of 240 fatal food-induced anaphylactic reactions were included in the analysis. Assuming a food allergy prevalence rate of 3 percent (3.9 percent in individuals ages 0 to 19 years and 1 percent in those with peanut allergy), meta-analysis of 10 evaluable studies (which had low-grade evidence and a high level of heterogeneity) estimates the incidence of fatal food anaphylaxis among those
__________________
9 Incidence rate is the number of new cases per population at risk in a given time period.
with a food-allergy as 1.81 (95% CI: 0.94-3.45) per million person-years (equivalent to about 25 deaths per year in the United States, assuming an overall 3 percent prevalence of food allergy), 3.25 (95% CI: 1.73-6.10) per million person-years in children ages 0 to 19 years, and 2.13 (95% CI: 1.09-4.16) per million person-years in peanut-allergic patients. The investigators concluded that in all studies examined and in all subgroups evaluated, “the incidence of fatal food anaphylaxis for a food-allergic person is ≥100 times lower than incidence of death due to any accident in the general population, and at age 0–19, the incidence is ≥10 times lower than the accidental death incidence in the general population” (Umasunthar et al., 2013, p. 1338). In both the systematic review and meta-analysis by Umasunthar et al., the level of evidence in the studies reviewed was low due to variations in case definition of anaphylaxis, methods of data capture, limited information about food allergy prevalence in the populations studied, and likely ascertainment bias across all studies. However, both systematic reviews suggested a number of risk factors for more severe anaphylactic reactions that have been noted in previous studies, including individuals with asthma, previous severe reaction (Bock et al., 2007; Sampson et al., 1992), IgE binding to a diverse range of sequential epitopes (Flinterman et al., 2008; Lewis et al., 2005; Shreffler et al., 2004), and deficient platelet-activating factor acetylhydrolase enzyme activity (Vadas et al., 2008).
A systematic review and meta-analysis of the prevalence of anaphylaxis in Europe was conducted by Panesar et al., who identified 49 articles satisfying their inclusion criteria, but only 3 were suitable for generating a pooled estimate of anaphylaxis (Panesar et al., 2013). Meta-analysis of these studies suggested a pooled European anaphylaxis prevalence of 0.3 percent (95% CI: 0.1%-0.5%), with markedly varying estimates of anaphylaxis due to food allergy based on individual studies ranging from 0.4 percent to 39.9 percent. In children, cow milk, egg, hazelnut, peanut, kiwi, and other tree nuts were the most common triggers, and asthma and reactions in pollen-allergic patients occurring in pollen season were identified as increased risk factors for anaphylaxis.
Studies in the United States
Virtually no studies have been conducted evaluating the prevalence of food-induced anaphylaxis in the United States. Recently Wood et al. conducted two nationwide, cross-sectional random-digit-dial surveys: a public survey that included unselected adults and a patient survey that collected information from household members who reported a reaction to medications, foods, insect stings, or latex and idiopathic reactions in the previous 10 years (Wood et al., 2014). The public survey included 1,000 adults from which it was estimated that 5.1 percent (95% CI: 3.4%-6.8%) and 1.6
percent (95% CI: 0.8%-2.4%) had probable and very likely anaphylaxis, respectively. In the patient survey 344 of 1,059 respondents reported a history of anaphylaxis; 31 percent of these reactions were to foods, most commonly peanuts, tree nuts, and shellfish. Even though children were included in the patient survey, it had a significant bias toward an older population (median age was age 52 years). This age bias likely misrepresented the relative proportion of anaphylaxis triggers in the overall U.S. population, probably underestimating foods and overestimating medications. As with similar such surveys, both studies were limited by recall bias of interviewees, potential bias caused by using only a landline sample, and high rates of nonparticipation that could potentially result in further selection bias.
Other methods to estimate prevalence have been used, such as the International Statistical Classification of Diseases and Related Health Problems (ICD)10 (Jerschow et al., 2014). However, ICD codes are considered inaccurate for determining the prevalence of food-induced anaphylactic deaths.
In the United States, the National Electronic Injury Surveillance System (NEISS) is an active surveillance system maintained by the Consumer Product Safety Commission (CPSC) designed to identify consumer product-related adverse events at emergency departments. The authors of a 2008 pilot study that analyzed NEISS emergency department data to assess food allergies adverse events concluded that analysis of NEISS data may be a useful tool for assessing the magnitude and severity of food-allergic events (Ross et al., 2008).
Studies in Europe
Some European countries have developed Web-based surveillance systems to gather food related severe reactions data, such as the French Allergovigilance Network (Moneret-Vautrin et al., 2005) or the European Anaphylaxis Registry. Between July 2007 and March 2015, 1,970 anaphylactic events in children younger than age 18 years were reported to the European Anaphylaxis Registry, which consisted of data retrieved from medical records of referrals to 90 tertiary allergy centers in 10 European countries (Grabenhenrich et al., 2016). Overall, 1,291 out of 1,970 (66 percent) severe allergic events were due to allergic reactions to food. The investigators found that milk (N=120) and egg (N=115) were the most common cause of anaphylaxis in children during the first 2 years of life. Cashew
__________________
10The International Statistical Classification of Diseases and Related Health Problems (or International Classification of Diseases [ICD]) is the international standard diagnostic tool for epidemiology, health management, and clinical purposes maintained by the World Health Organization.
(N=87) and hazelnut (N=86) reactions occurred mostly in preschoolers and peanut (N=325) occurred at all ages in European children. Grabenhenrich et al. found that most incidents occurred in private homes (46 percent) and that one-third of the children had experienced a previous reaction (Grabenhenrich et al., 2016). Skin symptoms occurred in 92 percent of children: hives (62 percent), angioedema (53 percent), pruritus (37 percent), and flushing (29 percent). Gastrointestinal symptoms developed in 45 percent of the reactions: vomiting (overall 27 percent) dominating in the preschool children, abdominal pain (16 percent), and nausea (overall 15 percent) dominating in adolescents. Overall, 70 percent of anaphylactic cases due to known factors were due to food allergy, with peanut and milk being the most common elicitors. Overall, 26 children (1.3 percent) experienced severe life-threatening reactions, mostly to foods, and 5 children died. This study represents the largest series of anaphylactic reactions reported in a pediatric population.
In summary, high-quality data on the prevalence of food-induced anaphylaxis in the United States and in other countries are lacking. In addition, it is challenging to make definitive conclusions about prevalence of anaphylaxis due to heterogeneity in populations, definitions of anaphylaxis used, and data collection methods. However, mortality due to food-induced anaphylaxis seems to be low compared to other accidental causes. Still, monitoring anaphylaxis reactions from food allergies is important not only to estimate prevalence but for understanding the causes, identifying interventions, and for bringing the information to patient care and other educational efforts.
EVIDENCE THAT THE PREVALENCE OF FOOD ALLERGY IS INCREASING
A few studies have employed consistent methodology over time in an attempt to determine whether the prevalence of food allergy has been changing over time. Sicherer et al. performed a random digit-dial telephone survey in the United States using the same methodology at set intervals (1997, 2002, and 2008) to determine the prevalence of peanut and tree nut allergy (Sicherer et al., 2010). In the 2008 study, a total of 5,300 households (13,534 participants) were surveyed (participation rates, 42 percent versus 52 percent in 2002 and 67 percent in 1997). Overall, peanut allergy, tree nut allergy, or both were reported in 1.4 percent of participants (95% CI: 1.2%-1.6%) compared with 1.2 percent in 2002 and 1.4 percent in 1997. The prevalence for adults was 1.3 percent (95% CI: 1.1%-1.6%), which was not significantly different from the earlier surveys, while the prevalence of peanut or tree nut allergy for children younger than 18 years of age was significantly different: 2.1 percent in 2008 (95% CI: 1.6%-2.7%) com-
pared with 1.2 percent in 2002 and 0.6 percent in 1997. The prevalence of peanut allergy in children in 2008 was 1.4 percent (95% CI: 1.0%-1.9%) compared with 0.8 percent in 2002 and 0.4 percent in 1997. Additionally, the prevalence of childhood tree nut allergy increased significantly across the survey waves (1.1 percent in 2008, 0.5 percent in 2002, and 0.2 percent in 1997). However, these studies had a number of limitations, including self-reporting, increasing awareness, and increasing nonparticipation rates, which could have led to increasing selection bias and higher prevalence rates.
As noted above, investigators at the CDC performed a cross-sectional survey of data from several U.S. databases and concluded that the prevalence of food allergy in children younger than age 18 years increased 18 percent from 1997 through 2007 (Branum and Lukacs, 2009). However, it remains unclear whether this represents a true increase in prevalence or a difference in awareness and coding. A recent comparison between the rate of sensitization (sIgE test) to peanut, milk, egg, and shrimp in U.S. children ages 6 to 19 years from 1988-1994 to 2005-2006 was conducted based on NHANES data. The analysis found that sensitization did not increase between 1988 and 1994 (24.3%; 95% CI: 22.1%-26.5%) and 2005-2006 (21.6%; 95% CI: 19.5%-23.7%), except for a trend toward the increased prevalence to the combination of milk, egg, and peanut among non-Hispanic blacks (McGowan et al., 2016). Sensitization, however, is not a good indicator of symptomatic food allergies.
A number of studies from other parts of the world also suggest an increase in the prevalence of sensitization and allergic reactions to foods. Three birth cohorts from the Isle of Wight in the United Kingdom were evaluated for peanut allergy in 1989 (2,181 children age 4), 1996 (1,273 children ages 3 and 4), and 2001-2002 (891 children age 3) (Venter et al., 2010). Peanut sensitization increased significantly, from 1.3 percent in the 1989 cohort to 3.3 percent (P=0.003) in the 1996 cohort before falling back to 2.0 percent in the 2001-2002 cohort (P=0.145). Clinical peanut allergy (based on positive SPT with convincing clinical history or positive OFC in the latter two cohorts) increased significantly from 0.5 percent in the 1989 cohort to 1.4 percent (P=0.023) in 1996 cohort with a subsequent fall to 1.2 percent in the 2001-2002 cohort (P=0.850). However, in this study, the cohorts are not totally comparable because the ages and participation rates varied.
In a cross-sectional survey of grade school children in Montreal, Ben-Shoshan et al. reported a non-significant rise in adjusted peanut allergy prevalence from 1.34 percent (95% CI: 1.08%-1.64%) in a 2000-2002 cohort to 1.62 percent (95% CI: 1.31%-1.98%) in a 2005-2007 cohort (Ben-Shoshan et al., 2009).
In summary, although a general perception that food allergy is increas-
ing exists, especially in westernized countries, very few studies support this likely change.
OVERALL CONCLUSIONS
An accurate assessment of the true prevalence of food allergy and a determination of whether it is increasing are needed to prioritize food allergy as a public health problem and ensure that adequate resources are directed at the problem. Although a general consensus has emerged and plentiful “soft” data, such as parental reports, surveys of school teachers and nurses, and reports from general practitioners, suggest that the prevalence of food allergy is increasing, few well-designed comprehensive studies exist to support this notion. Because of the low quality of published prevalence data, particularly the use of self-reported data, the true prevalence of food allergy is likely overestimated in most published studies. Even so, it is clear that food allergy has become a major health problem in many countries around the world. The prevalence of atopic dermatitis has increased dramatically over the past two decades (see Figure 3-1), and this may in large part account for the rise in food allergy, as children with eczema are susceptible to sensitization to various allergens, including food, through the defective and inflamed skin barrier. Figure 3-4 depicts the prevalence of food allergy based on convincing histories plus laboratory data or OFCs, primarily in young children, in various countries around the world.
It appears that a few foods, such as milk, egg, peanut and/or tree nuts, and seafood, comprise the vast majority of allergens responsible for allergic reactions around the world, and that the likelihood of severe or fatal reactions due to food allergy in food-allergic individuals is rare, being less likely than the chance of severe injury or death due to accidents in the general public.
Good studies on the prevalence of food allergy are very costly and difficult to perform, often requiring OFCs for accurate diagnosis, which are time-consuming, potentially dangerous and frequently refused by parents, and subject to a variety of biases. In general, prevalence data based on parental surveys or specialty-based practices or hospitals provide the most inflated estimates, followed by population-based surveys, sensitization-based studies, and medical history plus sensitization-based studies. Studies incorporating OFC typically provide the lowest and most accurate assessment of true food allergy prevalence. Population-wide estimates of prevalence of food allergy in both children and adults in Europe are available from the EuroPrevall studies, which encompass questionnaires, testing for IgE antibodies, and more limited testing with DBPCOFC among children. In addition, a comprehensive study of infants has been conducted in Australia in the HealthNuts Study, which is continuing to follow the infants
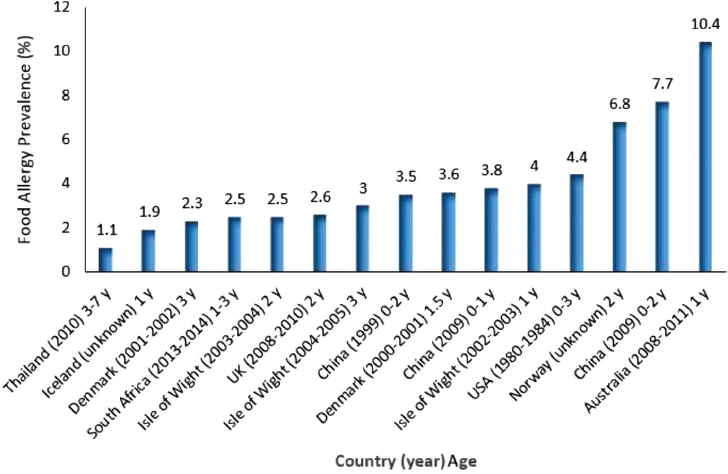
SOURCES: Courtesy of Michael E. Levine, Cape Town, South Africa. Data from Basera et al., 2015; Bock, 1987; Chen et al., 2011; Eller et al., 2009; Grimshaw et al., 2015; Hu et al., 2010; Kristinsdottir et al., 2011; Kvenshagen et al., 2009; Lao-araya and Trakultivakorn, 2012; Osborne et al., 2011; Osterballe et al., 2005; Venter et al., 2006, 2008.
through childhood. No such population-wide estimates of prevalence exist in the United States.
Given the difficulty of diagnosing food allergy, the committee recommends that estimation of prevalence of food allergies in general and for the specific list of priority allergens in the United States be conducted in a systematic fashion and stratified sampling be used for cost-efficiency, with frequency-weighting used to obtain population-wide estimates. In the United States, while some surveys, such as the National Survey of Children’s Health, are limited to questionnaire data, other surveys, possibly including the newly launched Environmental Influences on Child Health Outcomes (ECHO) program, could incorporate more comprehensive assessment of
food allergies, particularly in children. At this time, such information could be incorporated into a population survey sampling already in place, such as NHANES.
RECOMMENDATIONS
The committee recommends that the Centers for Disease Control and Prevention obtain prevalence estimates on food allergy in a systematic and statistically sound manner. Prevalence should be assessed in a systematic fashion in a sufficiently large population, with consideration given to using stratified sampling for cost-efficiency, with frequency-weighting used to obtain population-wide estimates. Prevalence estimates should be conducted in both children and adults and in groups defined by race, ethnicity, and socioeconomic status to determine differences in diagnosis and prevalence within these subgroups. To support population risk assessments, the committee also recommends that the dietary intake history of those reporting food allergy be compared to those who do not, particularly for the specific foods of interest.
Although a new study design (or the use of other data surveillance systems) is possible, the National Health and Nutrition Examination Survey (NHANES) is a feasible option to systematically examine the prevalence of food allergy by collecting data on self-reported food allergies, food-specific immunoglobulin E (sIgE) concentrations, food-specific skin prick test (SPT) results, and oral food challenge (OFC) results.11
Specific suggestions for use of NHANES (or other data surveillance systems) include
- Oversample the population of children ages 0 to 6 years, due to the higher prevalence of food allergy in this group and the fact that environmental exposures at this age might affect food allergy development.
- Consistently incorporate questions on food allergy diagnosis as well as intake of common food allergens into questionnaires to capture point prevalence, change in prevalence
__________________
11 The gold standard OFC is an expensive method and must be administered in a clinic and under supervision of a trained physician. The testing sequence, therefore, is meant to lead to a population sample that is enriched with individuals reporting food allergies and that minimizes cost and effort.
-
of self-reported food allergies over time, and dietary information on intake of common allergens.
- Perform assays of blood specimens for serum food allergen-specific immunoglobulin (IgE), concentrations to obtain population estimates of prevalence of allergen sensitization and assess changes in prevalence over time.
- Invite a stratified sample of participants enriched with individuals reporting food allergies to undergo food-specific SPT during the examination component of the survey.
- Invite a smaller subsample of participants to undergo double blinded placebo-controlled OFCs. This sample should be enriched with individuals reporting food allergies and/or positive SPT or IgE antibody tests.
- Elicit reasons for any nonparticipation in SPT or OFC, particularly whether the individual has had prior testing and a diagnosed food allergy. If possible, obtain medical records containing such test results.
- Obtain population-wide estimates of self-reported food allergies, IgE concentrations, positive SPTs, and positive OFCs through weighted analyses using stratified sampling weights (e.g., as is routinely used in NHANES analyses).
- Establish the sensitivity and specificity of various diagnostics as compared to the OFC.
- Use a diagnostic challenge with progressive series of doses in the subsample undergoing OFCs to establish prevalence of food allergy. Also include testing at a lower dose to validate population thresholds proposed for food labeling purposes.
RESEARCH NEEDS
In addition to sound information about the true prevalence of food allergy, the committee concluded that better methods to collect information about anaphylaxis reactions are needed. In addition, estimates of the various costs of food allergy are needed. For example, the CDC has developed tools to estimate the costs associated with some chronic diseases, such as arthritis. Medical expenditures for managing food allergy place financial burdens on society, as well as on the individuals affected and their caregivers. Additional costs relate to quality of life, productivity in school or at work, and food recalls. In addition, data from a national survey of caregivers of food-allergic children suggests considerable socioeconomic disparities in the economic impact of childhood food allergy. For instance, children in the lowest income stratum incurred 2.5 times the amount of emergency
department and hospitalization costs related to their food allergies than did higher-income children (Bilaver et al., 2016). Estimates on cost burden are necessary for prioritizing research and resources, and for effectively advocating for implementation of practices and policies that will reduce costs. The accuracy of the estimates will partially depend on collecting better prevalence data, as described in the recommendation above.
The following research needs are warranted to improve data on severe reactions and on cost estimates:
- Evaluate various methods of collecting national data on food allergy severe reactions such as by leveraging the existing surveillance systems (e.g., NHANES or the National Electronic Injury Surveillance System) or by developing a Web-based reporting system for anaphylaxis in the community.
- Collect and analyze data to estimate the economic and social costs of food allergy based on current prevalence of both mild and severe reactions and on objective measures of costs, such as data on medical expenses and time lost from school and work. Collect these data on different ethnicities and socioeconomic strata. The costs to industry due to food recalls and implementation of allergen control strategies also should be estimated.
REFERENCES
Atkins, D., D. Best, P. A. Briss, M. Eccles, Y. Falck-Ytter, S. Flottorp, G. H. Guyatt, R. T. Harbour, M. C. Haugh, D. Henry, S. Hill, R. Jaeschke, G. Leng, A. Liberati, N. Magrini, J. Mason, P. Middleton, J. Mrukowicz, D. O’Connell, A. D. Oxman, B. Phillips, H. J. Schunemann, T. Edejer, H. Varonen, G. E. Vist, J. W. Williams, Jr., S. Zaza, and G. W. Group. 2004. Grading quality of evidence and strength of recommendations. BMJ 328(7454):1490.
Basera, W., M. Botha, C. L. Gray, N. Lunjani, A. S. Watkins, C. Venter, K. J. Allen, C. Hlela, H. J. Zar, and M. E. Levin. 2015. The South African food sensitisation and food allergy population-based study of IgE-mediated food allergy: Validity, safety, and acceptability. Ann Allergy Asthma Immunol 115(2):113-119.
Ben-Shoshan, M., R. S. Kagan, R. Alizadehfar, L. Joseph, E. Turnbull, Y. St Pierre, and A. E. Clarke. 2009. Is the prevalence of peanut allergy increasing? A 5-year follow-up study in children in Montreal. J Allergy Clin Immunol 123(4):783-788.
Bilaver, L. A., K. M. Kester, B. M. Smith, and R. S. Gupta. 2016. Socioeconomic disparities in the economic impact of childhood food allergy. Pediatrics 137(5)e20153678.
Bock, S. A. 1987. Prospective appraisal of complaints of adverse reactions to foods in children during the first 3 years of life. Pediatrics 79(5):683-688.
Bock, S. A., A. Munoz-Furlong, and H. A. Sampson. 2007. Further fatalities caused by anaphylactic reactions to food, 2001-2006. J Allergy Clin Immunol 119(4):1016-1018.
Boyce, J. A., A. Assa’ad, A. W. Burks, S. M. Jones, H. A. Sampson, R. A. Wood, M. Plaut, S. F. Cooper, M. J. Fenton, S. H. Arshad, S. L. Bahna, L. A. Beck, C. Byrd-Bredbenner, C. A. Camargo, Jr., L. Eichenfield, G. T. Furuta, J. M. Hanifin, C. Jones, M. Kraft, B. D. Levy, P. Lieberman, S. Luccioli, K. M. McCall, L. C. Schneider, R. A. Simon, F. E. Simons, S. J. Teach, B. P. Yawn, and J. M. Schwaninger. 2010. Guidelines for the diagnosis and management of food allergy in the United States: Report of the NIAID-sponsored expert panel. J Allergy Clin Immunol 126(6 Suppl):S1-S58.
Branum, A. M., and S. L. Lukacs. 2008. Food allergy among U.S. children: Trends in prevalence and hospitalizations. NCHS Data Brief (10):1-8.
Branum, A. M., and S. L. Lukacs. 2009. Food allergy among children in the United States. Pediatrics 124(6):1549-1555.
Bunyavanich, S., S. L. Rifas-Shiman, T. A. Platts-Mills, L. Workman, J. E. Sordillo, M. W. Gillman, D. R. Gold, and A. A. Litonjua. 2014. Peanut allergy prevalence among school-age children in a US cohort not selected for any disease. J Allergy Clin Immunol 134(3):753-755.
Burney, P. G., J. Potts, I. Kummeling, E. N. Mills, M. Clausen, R. Dubakiene, L. Barreales, C. Fernandez-Perez, M. Fernandez-Rivas, T. M. Le, A. C. Knulst, M. L. Kowalski, J. Lidholm, B. K. Ballmer-Weber, C. Braun-Fahlander, T. Mustakov, T. Kralimarkova, T. Popov, A. Sakellariou, N. G. Papadopoulos, S. A. Versteeg, L. Zuidmeer, J. H. Akkerdaas, K. Hoffmann-Sommergruber, and R. van Ree. 2014. The prevalence and distribution of food sensitization in European adults. Allergy 69(3):365-371.
Camargo, C. A., Jr., S. Clark, M. S. Kaplan, P. Lieberman, and R. A. Wood. 2007. Regional differences in EpiPen prescriptions in the United States: The potential role of vitamin D. J Allergy Clin Immunol 120(1):131-136.
Chafen, J. J., S. J. Newberry, M. A. Riedl, D. M. Bravata, M. Maglione, M. J. Suttorp, V. Sundaram, N. M. Paige, A. Towfigh, B. J. Hulley, and P. G. Shekelle. 2010. Diagnosing and managing common food allergies: A systematic review. JAMA 303(18):1848-1856.
Chen, J., Y. Hu, K. J. Allen, M. H. Ho, and H. Li. 2011. The prevalence of food allergy in infants in Chongqing, China. Pediatr Allergy Immunol 22(4):356-360.
Connett, G. J., I. Gerez, E. A. Cabrera-Morales, A. Yuenyongviwat, J. Ngamphaiboon, P. Chatchatee, P. Sangsupawanich, S. E. Soh, G. C. Yap, L. P. Shek, and B. W. Lee. 2012. A population-based study of fish allergy in the Philippines, Singapore and Thailand. Int Arch Allergy Immunol 159(4):384-390.
Datema, M. R., L. Zuidmeer-Jongejan, R. Asero, L. Barreales, S. Belohlavkova, F. de Blay, P. Bures, M. Clausen, R. Dubakiene, D. Gislason, M. Jedrzejczak-Czechowicz, M. L. Kowalski, A. C. Knulst, T. Kralimarkova, T. M. Le, A. Lovegrove, J. Marsh, N. G. Papadopoulos, T. Popov, N. Del Prado, A. Purohit, G. Reese, I. Reig, S. L. Seneviratne, A. Sinaniotis, S. A. Versteeg, S. Vieths, A. H. Zwinderman, C. Mills, J. Lidholm, K. Hoffmann-Sommergruber, M. Fernandez-Rivas, B. Ballmer-Weber, and R. van Ree. 2015. Hazelnut allergy across Europe dissected molecularly: A EuroPrevall outpatient clinic survey. J Allergy Clin Immunol 136(2):382-391.
EFSA (European Food Safety Authority). 2013. Literature searches and reviews related to the prevalence of food allergy in Europe. EFSA Supporting Publications 10(11):1-343.
Eller, E., H. F. Kjaer, A. Host, K. E. Andersen, and C. Bindslev-Jensen. 2009. Food allergy and food sensitization in early childhood: Results from the DARC cohort. Allergy 64(7):1023-1029.
Flinterman, A. E., E. F. Knol, D. A. Lencer, L. Bardina, C. F. den Hartog Jager, J. Lin, S. G. Pasmans, C. A. Bruijnzeel-Koomen, H. A. Sampson, E. van Hoffen, and W. G. Shreffler. 2008. Peanut epitopes for IgE and IgG4 in peanut-sensitized children in relation to severity of peanut allergy. J Allergy Clin Immunol 121(3):737-743 e710.
Gaspar-Marques, J., P. Carreiro-Martins, A. L. Papoila, I. Caires, C. Pedro, J. Araujo-Martins, D. Virella, J. Rosado-Pinto, P. Leiria-Pinto, and N. Neuparth. 2014. Food allergy and anaphylaxis in infants and preschool-age children. Clin Pediatr (Phila) 53(7):652-657.
Grabenhenrich, L. B., S. Dolle, A. Moneret-Vautrin, A. Kohli, L. Lange, T. Spindler, F. Rueff, K. Nemat, I. Maris, E. Roumpedaki, K. Scherer, H. Ott, T. Reese, T. Mustakov, R. Lang, M. Fernandez-Rivas, M. L. Kowalski, M. B. Bilo, J. O. Hourihane, N. G. Papadopoulos, K. Beyer, A. Muraro, and M. Worm. 2016. Anaphylaxis in children and adolescents: The European Anaphylaxis Registry. J Allergy Clin Immunol 137(4):1128-1137.
Greenhawt, M., C. Weiss, M. L. Conte, M. Doucet, A. Engler, and C. A. Camargo, Jr. 2013. Racial and ethnic disparity in food allergy in the United States: A systematic review. J Allergy Clin Immunol Pract 1(4):378-386.
Grimshaw, K. E., T. Bryant, E. M. Oliver, J. Martin, J. Maskell, T. Kemp, E. N. Clare Mills, K. D. Foote, B. M. Margetts, K. Beyer, and G. Roberts. 2015. Incidence and risk factors for food hypersensitivity in UK infants: Results from a birth cohort study. Clin Transl Allergy 6:1.
Gupta, R. S., E. E. Springston, M. R. Warrier, B. Smith, R. Kumar, J. Pongracic, and J. L. Holl. 2011. The prevalence, severity, and distribution of childhood food allergy in the United States. Pediatrics 128(1):e9-e17.
Gupta, R. S., E. E. Springston, B. Smith, M. R. Warrier, J. Pongracic, and J. L. Holl. 2012. Geographic variability of childhood food allergy in the United States. Clin Pediatr (Phila) 51(9):856-861.
Gupta, R., D. Holdford, L. Bilaver, A. Dyer, J. L. Holl, and D. Meltzer. 2013a. The economic impact of childhood food allergy in the United States. JAMA Pediatr 167(11):1026-1031.
Gupta, R. S., E. E. Springston, B. Smith, J. Pongracic, J. L. Holl, and M. R. Warrier. 2013b. Parent report of physician diagnosis in pediatric food allergy. J Allergy Clin Immunol 131(1):150-156.
Hu, Y., J. Chen, and H. Li. 2010. Comparison of food allergy prevalence among Chinese infants in Chongqing, 2009 versus 1999. Pediat Int 52(5):820-824.
Jackson, K. D., L. D. Howie, and L. J. Akinbami. 2013. Trends in allergic conditions among children: United States, 1997-2011. NCHS Data Brief (121):1-8.
Jerschow, E., R. Y. Lin, M. M. Scaperotti, and A. P. McGinn. 2014. Fatal anaphylaxis in the United States, 1999-2010: Temporal patterns and demographic associations. J Allergy Clin Immunol 134(6):1318-1328.
Katelaris, C. H. 2010. Food allergy and oral allergy or pollen-food syndrome. Curr Opin Allergy Clin Immunol 10(3):246-251.
Katz, Y., P. Gutierrez-Castrellon, M. G. Gonzalez, R. Rivas, B. W. Lee, and P. Alarcon. 2014. A comprehensive review of sensitization and allergy to soy-based products. Clin Rev Allergy Immunol 46(3):272-281.
Kaya, A., M. Erkocoglu, E. Civelek, B. Cakir, and C. N. Kocabas. 2013. Prevalence of confirmed IgE-mediated food allergy among adolescents in Turkey. Pediatr Allergy Immunol 24(5):456-462.
Kazemi-Shirazi, L., G. Pauli, A. Purohit, S. Spitzauer, R. Froschl, K. Hoffmann-Sommergruber, H. Breiteneder, O. Scheiner, D. Kraft, and R. Valenta. 2000. Quantitative IgE inhibition experiments with purified recombinant allergens indicate pollen-derived allergens as the sensitizing agents responsible for many forms of plant food allergy. J Allergy Clin Immunol 105(1 Pt 1):116-125.
Keet, C. A., J. H. Savage, S. Seopaul, R. D. Peng, R. A. Wood, and E. C. Matsui. 2014. Temporal trends and racial/ethnic disparity in self-reported pediatric food allergy in the United States. Ann Allergy Asthma Immunol 112(3):222-229.
Koplin, J. J., M. L. Tang, P. E. Martin, N. J. Osborne, A. J. Lowe, A. L. Ponsonby, M. N. Robinson, D. Tey, L. Thiele, D. J. Hill, L. C. Gurrin, M. Wake, S. C. Dharmage, and K. J. Allen. 2012. Predetermined challenge eligibility and cessation criteria for oral food challenges in the HealthNuts population-based study of infants. J Allergy Clin Immunol 129(4):1145-1147.
Koplin, J. J., M. Wake, S. C. Dharmage, M. Matheson, M. L. Tang, L. C. Gurrin, T. Dwyer, R. L. Peters, S. Prescott, A. L. Ponsonby, A. J. Lowe, and K. J. Allen. 2015. Cohort profile: The HealthNuts Study: Population prevalence and environmental/genetic predictors of food allergy. Int J Epidemiol 44(4):1161-1171.
Kristinsdottir, H., M. Clausen, H. S. Ragnarsdottir, I. H. Halldorsdottir, D. McBride, K. Beyer, and S. T. Sigurdardottir. 2011. Prevalence of food allergy in Icelandic infants during first year of life. Laeknabladid 97(1):11-18.
Kummeling, I., E. N. Mills, M. Clausen, R. Dubakiene, C. F. Perez, M. Fernandez-Rivas, A. C. Knulst, M. L. Kowalski, J. Lidholm, T. M. Le, C. Metzler, T. Mustakov, T. Popov, J. Potts, R. van Ree, A. Sakellariou, B. Tondury, K. Tzannis, and P. Burney. 2009. The EuroPrevall surveys on the prevalence of food allergies in children and adults: Background and study methodology. Allergy 64(10):1493-1497.
Kung, S. J., A. P. Steenhoff, and C. Gray. 2014. Food allergy in Africa: Myth or reality? Clin Rev Allergy Immunol 46(3):241-249.
Kvenshagen, B., R. Halvorsen, and M. Jacobsen. 2009. Is there an increased frequency of food allergy in children delivered by caesarean section compared to those delivered vaginally? Acta Paediatr 98(2):324-327.
Lao-araya, M., and M. Trakultivakorn. 2012. Prevalence of food allergy among preschool children in northern Thailand. Pediatr Int 54(2):238-243.
Le, T. M., E. van Hoffen, I. Kummeling, J. Potts, B. K. Ballmer-Weber, C. A. Bruijnzeel-Koomen, A. F. Lebens, J. Lidholm, T. M. Lindner, A. Mackie, E. C. Mills, R. van Ree, S. Vieths, M. Fernandez-Rivas, P. G. Burney, and A. C. Knulst. 2015. Food allergy in the Netherlands: Differences in clinical severity, causative foods, sensitization and DBPCFC between community and outpatients. Clin Transl Allergy 5:8.
Lee, A. J., M. Thalayasingam, and B. W. Lee. 2013. Food allergy in Asia: How does it compare? Asia Pac Allergy 3(1):3-14.
Lewis, S. A., K. E. Grimshaw, J. O. Warner, and J. O. Hourihane. 2005. The promiscuity of immunoglobulin E binding to peanut allergens, as determined by Western blotting, correlates with the severity of clinical symptoms. Clin Exp Allergy 35(6):767-773.
McBride, D., T. Keil, L. Grabenhenrich, R. Dubakiene, G. Drasutiene, A. Fiocchi, L. Dahdah, A. B. Sprikkelman, A. A. Schoemaker, G. Roberts, K. Grimshaw, M. L. Kowalski, A. Stanczyk-Przyluska, S. Sigurdardottir, M. Clausen, N. G. Papadopoulos, D. Mitsias, L. Rosenfeld, M. Reche, C. Pascual, A. Reich, J. Hourihane, U. Wahn, E. N. Mills, A. Mackie, and K. Beyer. 2012. The EuroPrevall birth cohort study on food allergy: Baseline characteristics of 12,000 newborns and their families from nine European countries. Pediatr Allergy Immunol 23(3):230-239.
McGowan, E. C., R. D. Peng, P. M. Salo, D. C. Zeldin, and C. A. Keet. 2016. Changes in food-specific IgE over time in the National Health and Nutrition Examination Survey (NHANES). J Allergy Clin Immunol Pract 4(4):713-720.
McWilliam, V., J. Koplin, C. Lodge, M. Tang, S. Dharmage, and K. Allen. 2015. The prevalence of tree nut allergy: A systematic review. Curr Allergy Asthma Rep 15(9):54.
Moher, D., A. Liberati, J. Tetzlaff, D. G. Altman, and P. Group. 2009. Preferred reporting items for systematic reviews and meta-analyses: The PRISMA statement. Ann Intern Med 151(4):264-269, W264.
Moneret-Vautrin, D., M. Morisset, L. Parisot, G. Kanny. 2005. French Allergovigilance Network report about severe anaphylactic reactions to foods from 2001 to 2004. J Allergy Clin Immunol 115(2):S247.
Nwaru, B. I., L. Hickstein, S. S. Panesar, G. Roberts, A. Muraro, and A. Sheikh. 2014. Prevalence of common food allergies in Europe: A systematic review and meta-analysis. Allergy 69(8):992-1007.
Osborne, N. J., J. J. Koplin, P. E. Martin, L. C. Gurrin, L. Thiele, M. L. Tang, A. L. Ponsonby, S. C. Dharmage, and K. J. Allen. 2010. The HealthNuts population-based study of paediatric food allergy: Validity, safety and acceptability. Clin Exper Allergy 40(10):1516-1522.
Osborne, N. J., J. J. Koplin, P. E. Martin, L. C. Gurrin, A. J. Lowe, M. C. Matheson, A. L. Ponsonby, M. Wake, M. L. Tang, S. C. Dharmage, and K. J. Allen. 2011. Prevalence of challenge-proven IgE-mediated food allergy using population-based sampling and predetermined challenge criteria in infants. J Allergy Clin Immunol 127(3):668-676.e1-2.
Osterballe, M., T. K. Hansen, C. G. Mortz, A. Host, and C. Bindslev-Jensen. 2005. The prevalence of food hypersensitivity in an unselected population of children and adults. Pediatr Allergy Immunol 16(7):567-573.
Panesar, S. S., S. Javad, D. de Silva, B. I. Nwaru, L. Hickstein, A. Muraro, G. Roberts, M. Worm, M. B. Bilo, V. Cardona, A. E. Dubois, A. Dunn Galvin, P. Eigenmann, M. Fernandez-Rivas, S. Halken, G. Lack, B. Niggemann, A. F. Santos, B. J. Vlieg-Boerstra, Z. Q. Zolkipli, and A. Sheikh. 2013. The epidemiology of anaphylaxis in Europe: A systematic review. Allergy 68(11):1353-1361.
Rona, R. J., T. Keil, C. Summers, D. Gislason, L. Zuidmeer, E. Sodergren, S. T. Sigurdardottir, T. Lindner, K. Goldhahn, J. Dahlstrom, D. McBride, and C. Madsen. 2007. The prevalence of food allergy: A meta-analysis. J Allergy Clin Immunol 120(3):638-646.
Ross, M. P., M. Ferguson, D. Street, K. Klontz, T. Schroeder, and S. Luccioli. 2008. Analysis of food-allergic and anaphylactic events in the National Electronic Injury Surveillance System. J Allergy Clin Immunol 121(1):166-171.
Rudders, S. A., J. A. Espinola, and C. A. Camargo, Jr. 2010. North-south differences in US emergency department visits for acute allergic reactions. Ann Allergy Asthma Immunol 104(5):413-416.
Salo, P. M., S. J. Arbes, Jr., R. Jaramillo, A. Calatroni, C. H. Weir, M. L. Sever, J. A. Hoppin, K. M. Rose, A. H. Liu, P. J. Gergen, H. E. Mitchell, and D. C. Zeldin. 2014. Prevalence of allergic sensitization in the United States: Results from the National Health and Nutrition Examination Survey (NHANES) 2005-2006. J Allergy Clin Immunol 134(2):350-359.
Sampson, H. A., L. Mendelson, and J. P. Rosen. 1992. Fatal and near-fatal anaphylactic reactions to food in children and adolescents. N Engl J Med 327(6):380-384.
Schoemaker, A. A., A. B. Sprikkelman, K. E. Grimshaw, G. Roberts, L. Grabenhenrich, L. Rosenfeld, S. Siegert, R. Dubakiene, O. Rudzeviciene, M. Reche, A. Fiandor, N. G. Papadopoulos, A. Malamitsi-Puchner, A. Fiocchi, L. Dahdah, S. T. Sigurdardottir, M. Clausen, A. Stanczyk-Przyluska, K. Zeman, E. N. Mills, D. McBride, T. Keil, and K. Beyer. 2015. Incidence and natural history of challenge-proven cow milk allergy in European children—EuroPrevall birth cohort. Allergy 70(8):963-972.
Shamseer, L., D. Moher, M. Clarke, D. Ghersi, A. Liberati, M. Petticrew, P. Shekelle, and L. A. Stewart. 2015. Preferred reporting items for systematic review and meta-analysis protocols (PRISMA-P) 2015: Elaboration and explanation. BMJ 349:g7647.
Shreffler, W. G., K. Beyer, T. H. Chu, A. W. Burks, and H. A. Sampson. 2004. Microarray immunoassay: Association of clinical history, in vitro IgE function, and heterogeneity of allergenic peanut epitopes. J Allergy Clin Immunol 113(4):776-782.
Sicherer, S. H. 2011. Epidemiology of food allergy. J Allergy Clin Immunol 127(3):594-602.
Sicherer, S. H., A. Munoz-Furlong, J. H. Godbold, and H. A. Sampson. 2010. US prevalence of self-reported peanut, tree nut, and sesame allergy: 11-year follow-up. J Allergy Clin Immunol 125(6):1322-1326.
Soller, L., M. Ben-Shoshan, D. W. Harrington, M. Knoll, J. Fragapane, L. Joseph, Y. St Pierre, S. La Vieille, K. Wilson, S. J. Elliott, and A. E. Clarke. 2015. Adjusting for nonresponse bias corrects overestimates of food allergy prevalence. J Allergy Clin Immunol Pract 3(2):291-293.
Umasunthar, T., J. Leonardi-Bee, M. Hodes, P. J. Turner, C. Gore, P. Habibi, J. O. Warner, and R. J. Boyle. 2013. Incidence of fatal food anaphylaxis in people with food allergy: A systematic review and meta-analysis. Clin Exp Allergy 43(12):1333-1341.
Umasunthar, T., J. Leonardi-Bee, P. J. Turner, M. Hodes, C. Gore, J. O. Warner, and R. J. Boyle. 2015. Incidence of food anaphylaxis in people with food allergy: A systematic review and meta-analysis. Clin Exp Allergy 45(11):1621-1636.
Vadas, P., M. Gold, B. Perelman, G. M. Liss, G. Lack, T. Blyth, F. E. Simons, K. J. Simons, D. Cass, and J. Yeung. 2008. Platelet-activating factor, PAF acetylhydrolase, and severe anaphylaxis. N Engl J Med 358(1):28-35.
Venter, C., B. Pereira, J. Grundy, C. B. Clayton, G. Roberts, B. Higgins, and T. Dean. 2006. Incidence of parentally reported and clinically diagnosed food hypersensitivity in the first year of life. J Allergy Clin Immunol 117(5):1118-1124.
Venter, C., B. Pereira, K. Voigt, J. Grundy, C. B. Clayton, B. Higgins, S. H. Arshad, and T. Dean. 2008. Prevalence and cumulative incidence of food hypersensitivity in the first 3 years of life. Allergy 63(3):354-359.
Venter, C., S. Hasan Arshad, J. Grundy, B. Pereira, C. Bernie Clayton, K. Voigt, B. Higgins, and T. Dean. 2010. Time trends in the prevalence of peanut allergy: Three cohorts of children from the same geographical location in the UK. Allergy 65(1):103-108.
Wang, J. 2013. Oral allergy syndrome. In Food Allergy: Adverse Reactions to Foods and Food Additives, 5th ed., edited by D. Metcalfe, H. A. Sampson, R. A. Simon and G. Lack. Chichester, UK: John Wiley & Sons, Ltd.
Winberg, A., C. E. West, A. Strinnholm, L. Nordstrom, L. Hedman, and E. Ronmark. 2015. Assessment of allergy to milk, egg, cod, and wheat in Swedish schoolchildren: A population based cohort study. PLoS One 10(7):e0131804.
Wood, R. A., C. A. Camargo, Jr., P. Lieberman, H. A. Sampson, L. B. Schwartz, M. Zitt, C. Collins, M. Tringale, M. Wilkinson, J. Boyle, and F. E. Simons. 2014. Anaphylaxis in America: The prevalence and characteristics of anaphylaxis in the United States. J Allergy Clin Immunol 133(2):461-467.
Xepapadaki, P., A. Fiocchi, L. Grabenhenrich, G. Roberts, K. E. Grimshaw, A. Fiandor, J. I. Larco, S. Sigurdardottir, M. Clausen, N. G. Papadopoulos, L. Dahdah, A. Mackie, A. B. Sprikkelman, A. A. Schoemaker, R. Dubakiene, I. Butiene, M. L. Kowalski, K. Zeman, S. Gavrili, T. Keil, and K. Beyer. 2016. Incidence and natural history of hen’s egg allergy in the first 2 years of life—The EuroPrevall birth cohort study. Allergy 71(3):350-357.
Zuidmeer, L., K. Goldhahn, R. J. Rona, D. Gislason, C. Madsen, C. Summers, E. Sodergren, J. Dahlstrom, T. Lindner, S. T. Sigurdardottir, D. McBride, and T. Keil. 2008. The prevalence of plant food allergies: A systematic review. J Allergy Clin Immunol 121(5):1210-1218 e1214.


