
3
Restoration Progress
This committee is charged with the task of discussing accomplishments of the restoration and assessing “the progress toward achieving the natural system restoration goals of the Comprehensive Everglades Restoration Plan [CERP]” (see Chapter 1 for the statement of task and Chapter 2 for a discussion of restoration goals). In this chapter, the committee updates the National Academies’ previous assessments of CERP and related non-CERP restoration projects (NRC, 2007, 2008, 2010, 2012, 2014). This chapter also addresses programmatic and implementation progress, and discusses the ecosystem benefits resulting from the progress to date.
PROGRAMMATIC PROGRESS
To assess programmatic progress the committee reviewed a set of primary issues that influence CERP progress toward its overall goals of ecosystem restoration. These issues, described in the following sections, relate to project authorization, impacts of the recent Water Resources Development Acts, funding, scheduling, and regulatory constraints.
Project Authorization
Once project planning is complete, CERP projects with costs exceeding $25 million1 must be individually authorized by Congress.2 Water Resources
___________________
1 Programmatic authority for smaller projects (less than $25 million each) was subject to a total limit of $206 million (Water Resources Development Act of 2000 [WRDA 2000]).
2 WRDA 2000 included authorizations for 10 initial Everglades restoration projects (pending congressional approval of the project implementation reports), and an adaptive management and monitoring program. WDRA 2000 stipulated that the initial project authorizations are subject to Section 902 of WRDA 1986, thereby requiring reauthorization if project costs increase by more than
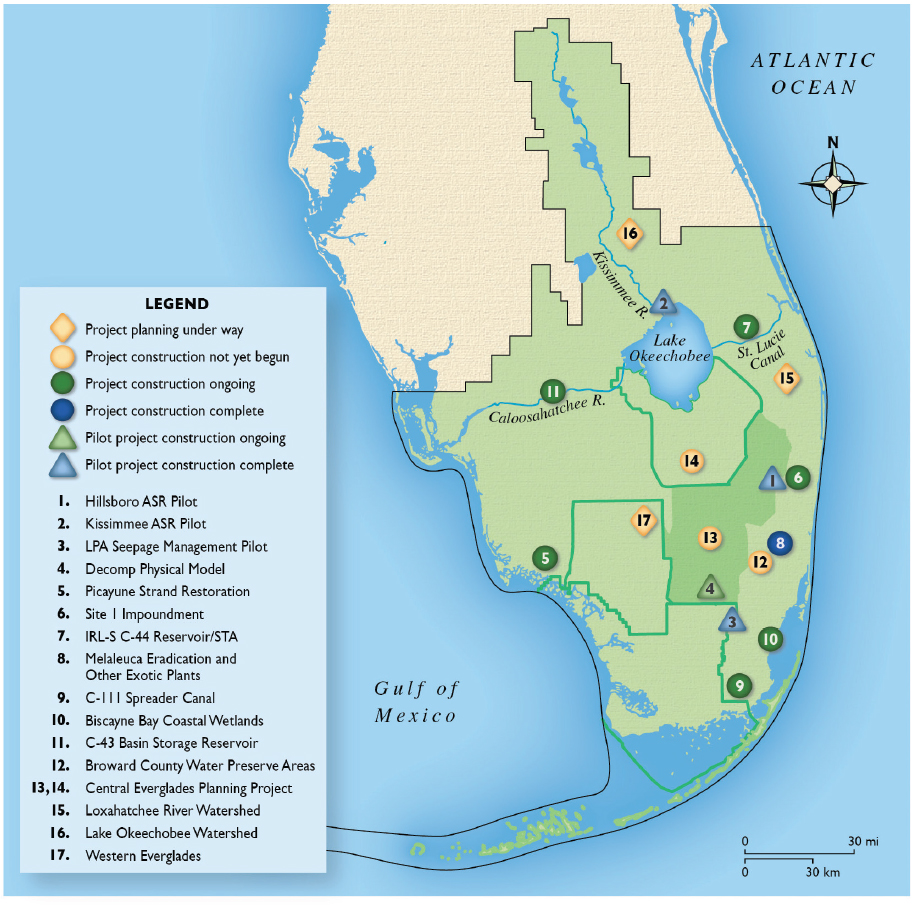
Development Acts (WRDAs) have served as the mechanism to congressionally authorize U.S. Army Corps of Engineers (USACE) projects, and the CERP planning process was developed with the assumption that WRDAs would be passed every 2 years. This, however, has not occurred. In the 16 years since the CERP was launched in WRDA 2000, only two WRDA bills have been enacted: WRDA 2007, which authorized Indian River Lagoon-South, Picayune Strand Restoration, and the Site 1 Impoundment projects; and the Water Resources Reform and Development Act (WRRDA) 2014, which authorized four additional projects (C-43 Reservoir, C-111 Spreader Canal [Western], Biscayne Bay Coastal Wetlands [Phase 1], Broward County Water Preserve Areas [WPAs]). WRDA 2016, which includes authorization for the Central Everglades Planning Project and changes to the Picayune Strand project, was passed by Congress on December 10, 2016.3 The three projects authorized by WRDA 2007 along with the Melaleuca Eradication Project, which was authorized under programmatic authority, are considered Generation 1 projects, and the four projects authorized under WRRDA 2014 represent Generation 2 projects (see Table 3-1; Figure 3-1). With the passage of WRRDA 2014, the federal government is now able to maintain progress on several state-expedited projects already under way (e.g., C-111 Spreader Canal (Western) project, Biscayne Bay Coastal Wetlands [Phase 1]) and initiate construction on two other new projects.
WRRDA Programmatic Changes and Implications
WRRDA 2014 made certain statutory changes to the federal water resource planning process, which has been a concern of Congress for many years (NRC, 1999). Reform of the planning process is probably the most significant change in policy since 1986, when WRDA 1986 brought about fundamental changes to cost-sharing between federal and non-federal project partners. WRRDA 2014 is a complex piece of legislation, with major program reforms and new policies on project deauthorization that directly affect the CERP. WRRDA 2014 transforms the planning process by setting strict timelines for feasibility studies to be completed within 3 years of initiation under $3 million in federal cost. To ensure that final feasibility studies are completed within 3 years, review by three levels of the USACE (district, division and headquarters) are required to be conducted concurrently with field-level planning. These provisions put into law the 3x3x3 process set forth by the USACE in Planning Bulletin 2014-01(USACE, 2014a)
___________________
20 percent of the original authorized cost (exclusive of inflation). As a result of the Section 902 limits or other major project changes, all 10 conditionally authorized projects now require reauthorization (S. Appelbaum, USACE, personal communication, 2012).
3 WRDA 2016 was signed into law on December 16, 2016, after the prepublication copy of this report was released.
TABLE 3-1 CERP or CERP-Related Project Implementation Status as of September 2016
| Project or Component Name | Yellow Book (1999) Estimated Completion Date | IDS 2016 Update Estimated Completion Date | PIR (or PPDR) Status | Authorization Status | Construction Status; Testing Status for Pilots | Ecosystem Benefits Documented to Date |
|---|---|---|---|---|---|---|
| PILOT PROJECTS | ||||||
| Hillsboro ASR Pilot (Fig. 3-1, No. 1) | 2002 | NA | PPDR Final Oct. 2004 | Authorized in WRDA 1999 | Completed, 2013 | NA |
| Kissimmee ASR Pilot (Fig. 3-1, No. 2) | 2001 | NA | PPDR Final Oct. 2004 | Authorized in WRDA 1999 | Completed, 2013 | NA |
| Regional ASR Study | NA | NA | NA | NA | Completed, 2015 | NA |
| LPA Seepage Management Pilot (Fig. 3-1, No. 3) | NA | NA | NA | NA | Completed, 2012 | Additional 0.4 ft water depth in wetland near seepage barrier |
| Decomp Physical Model (Fig. 3-1, No. 4) | NA | 2018 | NA | Programmatic authority WRDA 2000 | Ongoing | NA |
| GENERATION 1 CERP PROJECTS | ||||||
| Picayune Strand Restoration (Fig. 3-1, No. 5) | 2005 | Faka-Union: 2016 Miller: 2018 Remaining feat.: 2020 | Submitted to Congress, 2005 | Authorized in WRDA 2007; LRR authorized in WRDA 2016. | Prairie Canal completed in 2007; Merritt, Faka Union completed 2015-2016 | Increased water levels in 20,000 acres and with early vegetation responses detected |
| Project or Component Name | Yellow Book (1999) Estimated Completion Date | IDS 2016 Update Estimated Completion Date | PIR (or PPDR) Status | Authorization Status | Construction Status; Testing Status for Pilots | Ecosystem Benefits Documented to Date |
|---|---|---|---|---|---|---|
| Site 1 Impoundment (Fig. 3-1, No. 6) | 2007 | Submitted to Congress, 2006 | Authorized in WRDA 2007 | |||
- Phase 1 |
2016 | Completed, 2016 | ~16% reduction in seepage loss | |||
- Phase 2 |
Not specified | Phase 2 requires further authorization. | Not begun | NA | ||
| Indian River Lagoon-South (Fig. 3-1, No. 7) | Submitted to Congress, 2004 | Authorized in WRDA 2007 | ||||
- C-44 Reservoir/STA |
2007 | 2019 | Ongoing | None to date, construction ongoing | ||
- C-23/24 Reservoir/STA |
2010 | 2030 | Not begun | NA | ||
- C-25 Reservoir/STA |
2010 | 2027 | Not begun | NA | ||
- Natural Lands |
NA | Not specified | Not begun | NA | ||
| Melaleuca Eradication and Other Exotic Plants (Fig. 3-1, No. 8) | 2011 | NA | Final June 2010 | Programmatic authority WRDA 2000 | Construction completed 2013, operations ongoing | Increased capacity for biocontrol |
| GENERATION 2 CERP PROJECTS | ||||||
| C-111 Spreader Canal | 2008 | 2021 | Submitted to Congress, 2012 | Authorized in WRRDA 2014 | Ongoing | |
- Western Project (PIR #1) (Fig. 3-1, No. 9) |
Current data insufficient to assess response to project | |||||
| Biscayne Bay Coastal Wetlands (Phase 1) (Fig. 3-1, No. 10) | 2018 | 2021 | Submitted to Congress, 2012 | Authorized in WRRDA 2014 | Ongoing | Some wetland vegetation responses to freshwater inputs; no change in nearshore salinity |
| C-43 Basin Storage: West Basin Storage Reservoir (Fig. 3-1, No. 11) | 2012 | 2024 | Submitted to Congress, 2011 | Authorized in WRRDA 2014 | Ongoing | None to date, construction ongoing |
| Broward County WPAs (Fig. 3-1, No. 12) | Submitted to Congress 2012 | Authorized in WRRDA 2014 | ||||
- C-9 Impoundment |
2007 | 2029 | Not begun | NA | ||
- C-11 Impoundment |
2008 | 2023 | Not begun | NA | ||
- WCA-3A & -3B Levee Seepage Management |
2008 | 2021 | Not begun | NA | ||
| GENERATION 3 CERP PROJECTS | ||||||
| Central Everglades Planning Project (Fig. 3-1, Nos. 13 and 14) | NA | Submitted to Congress, 2015 | Authorized in WRDA 2016 | Not begun | NA | |
- PPA South |
2030 | |||||
- PPA North |
2028 | |||||
- PPA New Water |
2030 | |||||
| Project or Component Name | Yellow Book (1999) Estimated Completion Date | IDS 2016 Update Estimated Completion Date | PIR (or PPDR) Status | Authorization Status | Construction Status; Testing Status for Pilots | Ecosystem Benefits Documented to Date |
|---|---|---|---|---|---|---|
| CERP PROJECTS IN PLANNING | ||||||
| Loxahatchee River Watershed (Fig. 3-1, No. 15) | NA | NA | NA | NA | NA | |
- C51 and L-8 Reservoir |
2014 | |||||
- Loxahatchee River (C-51) ASR |
2013 | |||||
- Pal-Mar Corbett Hydropattern Restoration |
2006 | |||||
| Lake Okeechobee Watershed (Fig. 3-1, No. 16) | NA | NA | NA | NA | NA | |
- North of Lake Storage |
2014 | |||||
- Taylor Creek/Nubbin Slough Reservoir |
2009 | |||||
- Lake Okeechobee ASR |
2020 | |||||
| Western Everglades (Fig. 3-1, No.17) | NA | NA | NA | NA | NA | |
- Big Cypress-L-28 Interceptor Modifications |
2016 | |||||
- Seminole Tribe Big Cypress Water Conservation Plan |
2008 | |||||
- Miccosukee Tribe Water Management Plan |
2008 | |||||
| REMAINING UNPLANNED CERP PROJECTS | ||||||
| EAA Reservoir (Phase 2) | 2015 | NA | NA | NA | NA | NA |
| WCA Decompartmentalization (Phase 2) | 2019 | NA | NA | NA | NA | NA |
| Everglades National Park Seepage Management | 2013 | NA | NA | NA | NA | NA |
| Biscayne Bay Coastal Wetlands, Phase 2 | 2018 | NA | NA | NA | NA | NA |
| C-111 Spreader Canal, Eastern Project | 2008 | NA | NA | NA | NA | NA |
| C-43 ASR | 2012 | NA | NA | NA | NA | NA |
| Site 1 Impoundment ASR | 2014 | NA | NA | NA | NA | NA |
| Agricultural Reserve Reservoir | 2013 | NA | NA | NA | NA | NA |
| North Lake Belt Storage Area | 2021-2036 | NA | NA | NA | NA | NA |
| Central Lake Belt Storage Area | 2021-2036 | NA | NA | NA | NA | NA |
| WCA 2B Flows to Everglades National Park | 2018 | NA | NA | NA | NA | NA |
| WPA Conveyance | 2036 | NA | NA | NA | NA | NA |
| Caloosahatchee Backpumping with Stormwater Treatment | 2015 | NA | NA | NA | NA | NA |
| West Miami-Dade Reuse | 2020 | NA | NA | NA | NA | NA |
| South Miami-Dade Reuse | 2020 | NA | NA | NA | NA | NA |
| Loxahatchee National Wildlife Refuge Internal Canal Structures | 2003 | NA | NA | NA | NA | NA |
| Broward Co. Secondary Canal System | 2009 | NA | NA | NA | NA | NA |
| Project or Component Name | Yellow Book (1999) Estimated Completion Date | IDS 2016 Update Estimated Completion Date | PIR (or PPDR) Status | Authorization Status | Construction Status; Testing Status for Pilots | Ecosystem Benefits Documented to Date |
|---|---|---|---|---|---|---|
| Henderson Creek – Belle Meade Restoration | 2005 | NA | NA | NA | NA | NA |
| Southern CREW | 2005 | NA | NA | NA | NA | NA |
| Lake Trafford Restoration | 2004 | NA | NA | NA | NA | NA |
| Southwest Florida Feasibility Studies | 2004 | NA | NA | NA | NA | NA |
| Florida Bay Florida Keys Feasibility Study | 2004 | NA | NA | NA | NA | NA |
| Comprehensive Integrated Water Quality Plan | 2006 | NA | NA | NA | NA | NA |
NOTES: Table 3-1 does not include non-CERP foundation projects. NA = not applicable. Remaining unplanned CERP projects include all projects over $5 million (2014 dollars) as reported in USACE and DOI (2016).
SOURCES: www.evergladesrestoration.gov; USACE, 2016n; D. Tipple, USACE, personal communication, 2016; R. Braun, SFWMD, personal communication, 2016.
SOURCE: © International Mapping Associates
that governed the Central Everglades Planning Project (see NRC, 2014). WRRDA 2014 made one significant change to the 3x3x3 process, in that it specifies a total federal cost of $3 million, rather than the total $3 million cost of the Planning Bulletin (including both federal and non-federal costs). However, USACE headquarters chose to keep the more restrictive Planning Bulletin as its guidance for implementing Section 1001 of WRRDA 2014 (USACE, 2015a). All future CERP feasibility studies will be subject to the Planning Bulletin rules so long as it is in effect. As experience with the Central Everglades Planning Project suggests, these tight time limits pose significant challenges to processes for reaching consensus when planning complex projects. Extensions of both time and monetary funds are made possible, however, with sufficient justification.
Possibly the most significant impacts of WRRDA 2014 on CERP relate to deauthorization. WRRDA 2014 outlines the steps to deauthorize at least $18 billion in previously authorized USACE projects. The Act mandated that the USACE prepare an Interim Deauthorization List for public review and comment of all projects that were authorized before November 8, 2007 but have not begun construction or for which construction had begun but no funds had been applied in fiscal years 2010-2015. The USACE was then directed to prepare a final list of projects to be deauthorized totaling at least $18 billion of estimated federal cost. Congress will make the final determination on which projects will be deauthorized. Five separable elements of the CERP that were authorized as part of the program authorization in WRDA 2000 were included on the Final Deauthorization List (see Table 3-2; USACE, 2016a). Two of these projects (North New River and Tamiami Trail) are no longer separable elements because they
TABLE 3-2 CERP Projects Included on the Final Deauthorization List
| Project/Element Name | Project/Element Phase and Status | Latest Fiscal Year Of Federal or Non-Fed. Obligations for Construction | Federal Balance to Complete |
|---|---|---|---|
| Lake Belt In-ground Reservoir Technology Pilot | Construction Not Initiated | 2005 | $17,000,000 |
| North New River Improvements | Never Funded | No Obligation For Construction | $67,150,000 |
| Raise and Bridge East Portion of Tamiami Trail and Fill Miami Canal | Never Funded | No Obligation For Construction | $21,500,000 |
| Taylor Creek/Nubbin Slough Storage and Treatment Area | Construction Not Initiated | No Obligation For Construction | $67,800,000 |
| Wastewater Reuse Technology Pilot | Construction Not Initiated | 2005 | $20,500,000 |
were incorporated into the Central Everglades Planning Project or the Tamiami Trail Next Steps project. Taylor Creek/Nubbin Slough has been judged to be solely state responsibility and transferred outside of the CERP. Deauthorization of the Lake Belt in-ground reservoir and wastewater reuse pilot projects suggests that the related CERP project elements are not considered high priorities for the CERP or that the feasibility and cost effectiveness of these projects are so questionable, that further study is not warranted. If need for these pilot studies is determined at a later date, they would require reauthorization by Congress.
A “Backlog Prevention” provision was included in WRRDA 2014 for newly authorized projects. Any project or separable element of a project that was authorized in WRRDA 2014 for which construction funds have not been applied in the 7 years following enactment of the bill will be automatically deauthorized. That provision will be applicable to the newly authorized Generation 2 and 3 CERP projects listed in Table 3-1. This provision puts increased pressure on the CERP program to move forward on authorized projects, and also suggests that new projects should not be lined up for authorization unless there is a funding stream available to support them.
Funding
Funding for Everglades restoration remains an important constraint on achieving a rate of progress that would be consistent with the original vision for the CERP. There are a few positive signs in the previous 2 years, but funding remains low relative to what is needed to complete CERP in the next half-century. Recent CERP and non-CERP funding trends for the federal government and the state are discussed below.
State Funding for CERP and non-CERP Restoration Efforts
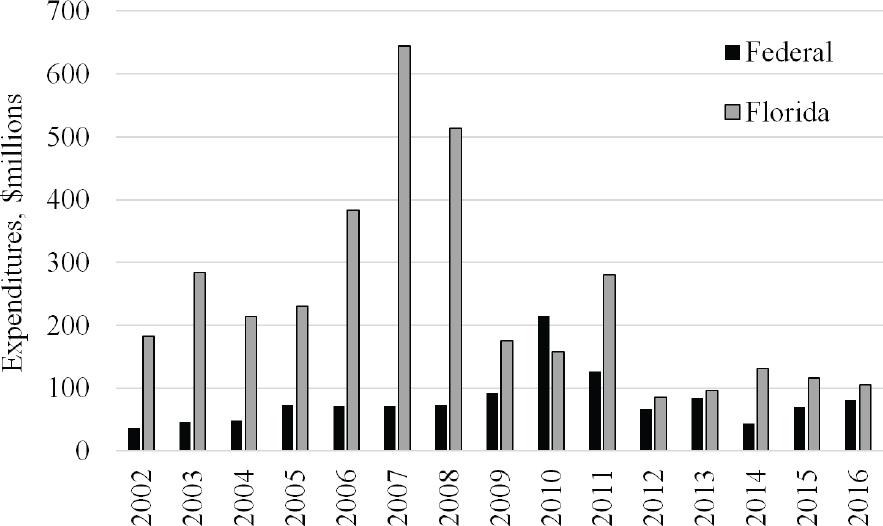
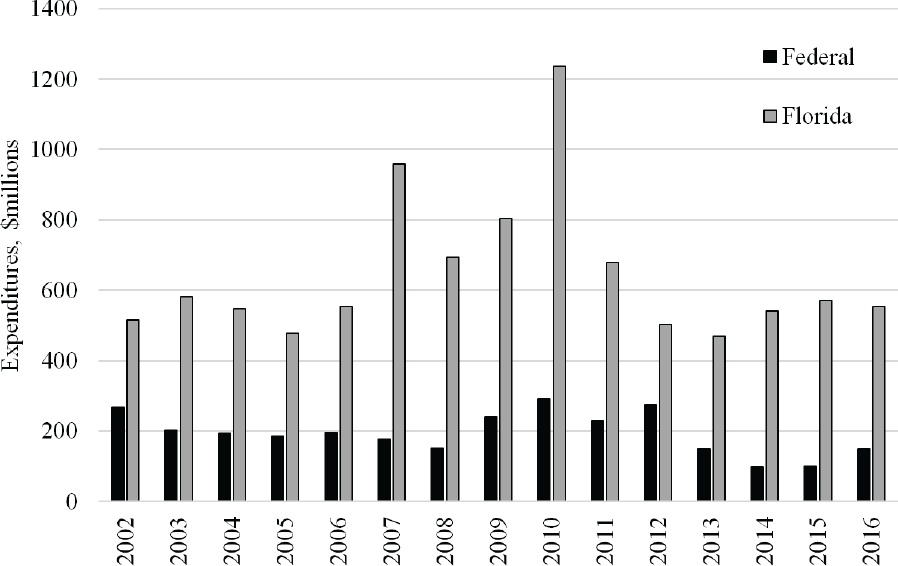
State spending for the CERP over the 5-year period FY2012-2016 is down sharply from the previous 5 years, and it has declined over the most recent 3-year period (Figure 3-2). State spending on non-CERP restoration during FY2012-2016 is also down sharply from FY2007-2011, but in the past 3 years it has shown a modest increase over its historic low in FY2013 (Figure 3-3).
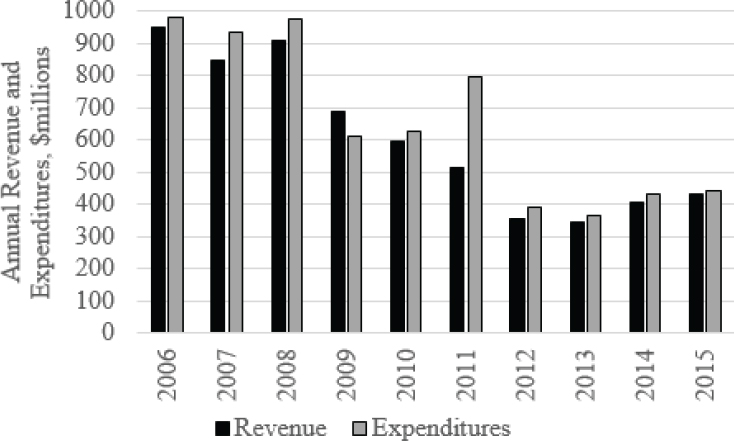
The SFWMD’s revenues to support Everglades restoration activities improved in FY2014-2015 from a historic low in FY2013, but they remain well below the average in FY2007-2012 (Figure 3-4). The adopted budget for FY2016 includes revenues of $523 million and expenditures of $750 million (SFWMD, 2016b), both well above FY2015 levels. Restoration projects reflect approximately 80 percent of projected capital expenditures in the SFWMD Capital Improvements Plan for 2016-2020, with the largest CERP commitments being
SOURCE: Data from SFERTF, 2016a.
the C-43 and C-44 reservoirs and STAs and Picayune Strand (SFWMD, 2016c). Budgeted revenues to support the Capital Improvements Plan include 53 percent from SFWMD funds (including ad valorem tax sources and reserve funds), 32 percent from State of Florida’s Land Acquisition Trust Fund,4 and 11 percent from the Save Our Everglades Trust Fund.5
The 5-year Capital Improvements Plan could change substantially as a result of recent action by the state of Florida. In November 2014, Florida approved Amendment 1 which allocates one-third of state-imposed fees on real estate transactions for environmental protection programs over the next 20 years. In 2015, the Amendment 1 funds generated $750 million (Klas, 2016). Governor Scott proposed a 20-year spending plan (SFWMD and FDEP, 2015) that would
___________________
4 This trust fund was established in 1963 and modified several times. Proceeds are from the sale of bonds repaid with funds collected from documentary stamp taxes on real estate transactions.
5 Save Our Everglades Trust Fund is a state trust fund with the limited purpose being a repository of local, state, and federal funds for CERP (Florida Statutes 373.472).
SOURCE: Data from SFERTF, 2016a.
use $5 billion of those funds ($250 million per year on average) to make substantial progress on CERP and non-CERP projects (see Box 3-1 for proposed areas of emphasis). After several questions were raised about how Amendment 1 money was being used in FY2016, the 2016 session of the legislature set more specific criteria for the distribution of funds. The Legacy Florida Act (HB 989), signed by the Governor in April 2016, established an annual minimum appropriation of $200 million or “25 percent of the funds remaining after the payment of debt service”—whichever is less—for Everglades projects. Projects and appropriations covered by that provision are as follow:
- $32 million to SFWMD for the Long-Term Plan;6
___________________
6 The Long Term Plan referred to in the bill includes the 2003 Everglades Protection Area Tributary Basins Long-Term Plan for Achieving Water Quality Goals, developed pursuant to the amended Everglades Forever Act, and the 2012 Restoration Strategies Regional Water Quality Plan.
SOURCE: Data from SFWMD, 2016d.
- the minimum of the lesser of 76.5 percent or $100 million to the CERP, including the Central Everglades Planning Project subject to Congressional approval; and
- the Northern Everglades and Estuaries Protection Program.
The bill further specifies that the Florida Department of Environmental Protection (FDEP) and SFWMD give preference to those projects that reduce harmful discharges from Lake Okeechobee to the estuaries. Consistent with the Legacy Florida Act, the final state budget for 2017 includes $32 million for Restoration Strategies and $100 million for CERP projects, including the C-44 reservoir/STA ($60 million), the C-43 West Storage Reservoir ($37 million), and CERP planning ($3 million). Additionally, $10.8 million of land acquisition funding was provided for the Biscayne Bay Coastal Wetlands (Phase 1) Project ($5.8 million) and the Picayune Strand Restoration Project ($5.0 million). Another $57 million was appropriated in the 2017 state budget for the Northern Estuaries water quality programs, the bulk of which goes to the public-private partnerships. Details of how SFWMD’s own source funds might be affected and whether Legacy Florida Act funds supplement existing state and district funding for restoration or simply replace those funding sources remain unclear.
Federal Funding for CERP and Non-CERP Restoration Efforts
Federal spending for CERP and non-CERP projects as reported in the 2017 Cross-Cut budget (SFERTF, 2016a) is illustrated in Figure 3-2 and Figure 3-3, respectively. Federal funding for CERP grew steadily from the beginning of the program to a peak of $215 million in FY2010, including $87 million in stimulus funding through the American Recovery and Reinvestment Act of 2009. However, funding levels for the CERP were much lower in FY2012-2014, in part due to cost-sharing constraints. Under cost-sharing agreements, federal “creditable obligations” cannot exceed those of the state. Even though the SFWMD has far outspent federal agencies on CERP projects for land acquisition and expedited construction efforts in advance of project authorizations by Congress, a large
TABLE 3-3 Reported Cumulative Expenditures for the CERP through FY2014
| Total expenditures, including those not yet credited | USACE (millions) | State (millions) |
|---|---|---|
| $ 1,048a | $ 3,379 | |
| Creditable Expenditures | ||
|
Projects |
$ 632 | $ 816 |
|
Otherb |
$ 306 | $ 238 |
| Total | $ 938 | $ 1,054 |
NOTES: The 2015 CERP Report to Congress (USACE and DOI, 2016) reports creditable expenditures for the SFWMD, while the Cross Cut Budget (SFERTF, 2016a) reports total expenditures. How much of the balance of approximately $2.3 billion that will be eligible for cost-share credits under future project partnership agreements remains to be seen.
a includes expenditures by Department of Interior agencies.
b includes adaptive assessment and monitoring and program coordination; also includes actual estimates of in-kind work for FY2013-2014 yet to be submitted by SFWMD.
SOURCE: SFERTF (2016a); USACE and DOI (2016).
share of those expenditures have yet to meet the criteria for being creditable to cost-sharing under the CERP.7 Entries in Table 3-3 indicate that through FY2014, 90 percent of the $1.05 billion in federal obligations had been credited to cost-sharing, but only 31 percent of the $3.38 billion in state obligations had been credited. During 2012-2014, there were a limited number of authorized projects, and state spending on authorized projects was reduced (SFWMD, 2015a). As a consequence state creditable expenditures served as a constraint on federal expenditures, and federal government outlays were reduced to maintain the cost-share balance (see NRC, 2014). WRRDA 2014 authorized four additional projects and additional project partnership agreements have been signed that, for the near term, have alleviated concerns that federal spending would lead to a violation in the 50-50 cost share agreement. Since 2014, there has been a steady increase in federal CERP funding, although not yet reaching 2010-2011 levels (see Figure 3-2).
Reflections on Funding Trends
Although both state and federal spending are still modest in the context of total cost for CERP and non-CERP projects, a few positive signs are encourag-
___________________
7 Cost-sharing policies dictate that the SFWMD can only apply specific creditable expenditures toward the 50-50 CERP cost-sharing requirement. Project-related expenses are creditable only if the project has been authorized by Congress, has a signed project partnership agreement, and has received federal appropriations. Non-planning-related SFWMD expenditures on yet-to-be authorized CERP projects cannot be officially credited toward the 50-50 cost-sharing requirement.
ing. The state’s financial position is improving, and federal appropriations are increasing. Dedicated Amendment 1 funding is especially encouraging because it provides increased stability for CERP and non-CERP implementation.
It is unclear from published data, however, as to how much funding is necessary to complete the program. Updated cost estimates in the 2015 CERP Report to Congress (USACE and DOI, 2016) put total program cost at $16.4 billion in 2014 dollars, a net increase of $3 billion over 2010 including both inflation and changes in project scope. Updated estimates put the total cost of projects authorized prior to passage of WRDA 2016 at $10.33 billion in 2016 dollars. The total of obligations by federal and state governments through FY2016 for those projects is $2.72 billion (K. Smith, USACE, personal communication, 2016). One measure of progress is a comparison of cumulative obligations of funds to estimated cost, all in constant dollars. The $2.72 billion obligated since 2000 has not been adjusted for inflation as the cost estimate has, but the reported obligations indicate that at least 26 percent of the $10.33 billion has been funded. That amounts to somewhere in the order of 16 to 18 percent of current estimates of total CERP cost.
Even with uncertainties in cost estimates, it is clear that less than 20 percent of the cost of the CERP has been funded to date, and a substantial financial commitment is needed to see the restoration to completion. As of 1999, the CERP was estimated to require funding at $350-400 million per year over 20 years (USACE and SFWMD, 1999). Considering project spending to date, inflation, and changes in project scope, program staff now estimate that it will take 55 years at $325 million per year (combined state and federal investments) to complete the CERP as currently outlined in the Report to Congress (K. Smith, USACE, personal communication, 2016). That rate is much larger than the FY2014-2016 annual average federal and state funding of approximately $183 million per year (Figure 3-2). By extension of the program staff’s estimate, at the current rate, it would require nearly 100 years to complete the CERP, thus delaying restoration benefits and allowing further ecosystem decline before restoration actions are taken (see NRC, 2012). The Central Everglades Planning Project illuminates the implications of the pace of funding on the timeframe to deliver restoration benefits. With full funding, the entire project could be constructed and increased flows provided to the central Everglades within 6 years, but with $100 million/year that does not escalate with inflation, the project was expected to take nearly 27 years (USACE and SFWMD, 2014a).
Project Scheduling and Prioritization
The anticipated future progress of CERP projects and the relationships among all the federally-funded South Florida ecosystem projects as well as some highly
relevant state-funded projects are depicted in the Integrated Delivery Schedule (IDS). The IDS is developed in consultation with the South Florida Ecosystem Restoration Task Force and the many CERP constituencies. The Task Force approved a recent version in November 2015 (USACE, 2016b), although a draft 2016 update was released in October 2016 (see Figure 3-5; USACE, 2016n). The reporting horizon for this version extends to 2030 and includes all CERP
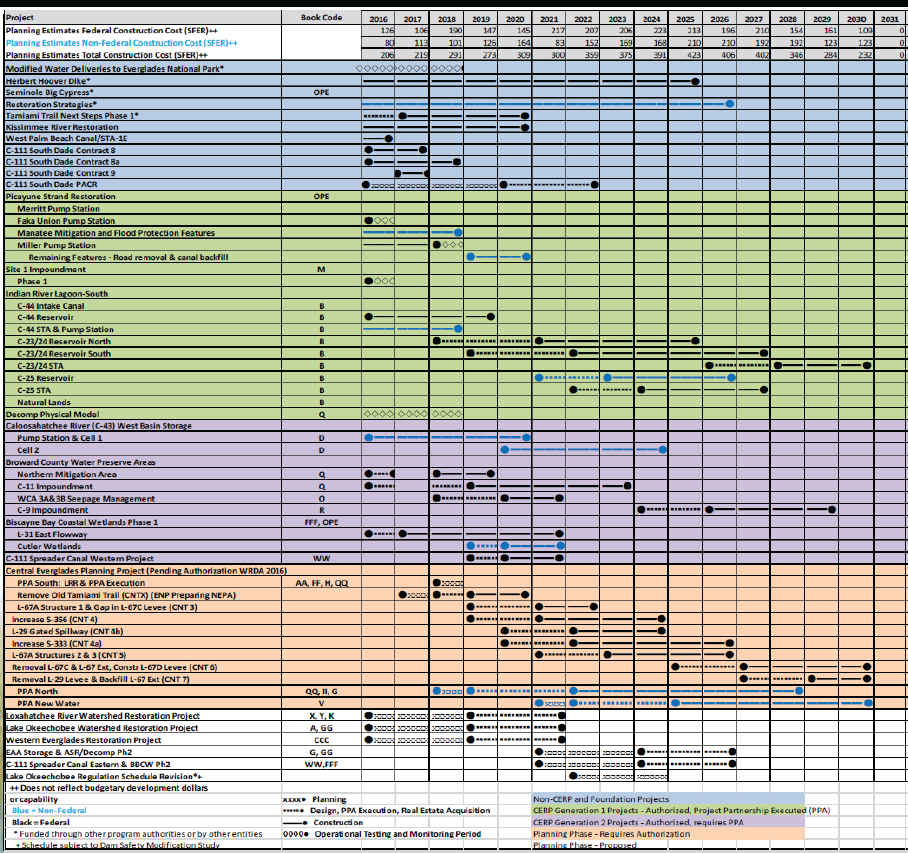
SOURCE: USACE, 2016n.
Generation 1, 2, and 3 projects (although not all components of those projects). The inclusion of the proposed Central Everglades Planning Project and the timing of its component parts is a significant addition since the 2011 IDS, reviewed in the committee’s last report (NRC, 2014). It also shows the initiation of six new planning activities with three in progress or starting 2016.
The IDS is not an action or decision document but rather a guide for planning, design, construction sequencing and budgeting. The lack of an updated IDS since the last 2011 draft had been a committee concern, with NRC (2014) characterizing it as “badly out of date.” During 2015, four stakeholder workshops were held to explore numerous scenarios emphasizing different ecological, water storage, economic, estuary and project completion goals. A key assumption was federal funding at $200 million per year matched equally by the state of Florida. Ultimately, the workshops led to a focus on maximizing “holistic benefits to regional system as early as possible,” which is a basis of the current (USACE and SFWMD, 2016b, USACE, 2016n).
Comparing the 2011 IDS draft to the 2016 version shows several notable differences (USACE, 2011a; Figure 3-5). Generation 1 projects showed minor delays to projects and project components up to 4 years, although Site 1 Impoundment – Phase 2 was eliminated from the updated plan. Several Generation 2 projects experienced even greater delays: C-111 Spreader Canal (Western) project (10-year delay), Biscayne Bay Coastal Wetlands, Phase 1 (5-year delay) and Broward County WPAs – Western C-11 Diversion Impoundment (5-year delay). One project, the Broward County WPAs – WCA-3A & -3B Levee Seepage Management had a one-year advancement in the schedule. Irregular funding profiles and lack of project authorization were the primary bases for these delays.
Based on changes since the 2011 draft, this IDS should be seen as aspirational in terms of both available funding and construction durations. The IDS assumes a future flow of federal funding between approximately $140 and 220 million/year for both CERP and non-CERP projects, with state funding ranging from $56 to 210 million/year, although it’s not evident which funds are directed toward CERP projects. As several major non-CERP projects are completed in the next 5 years (discussed later in this chapter), more funding may be freed up for future CERP projects. These estimates seem reasonable based on recent CERP and non-CERP program funding and the improved state-funding outlook, but availability of funding remains a substantial scheduling uncertainty, and possible construction schedule contingencies are not considered. Reduced funding will delay progress, whereas expedited funding can accelerate construction completion. In its last review, the committee expressed concern that the projected completion of Central Everglades Planning Project may extend to 2053 with its serial execution, assumed funding, and conservative start assumptions
(NRC, 2014). As depicted in the new IDS, a more aggressive start and parallel construction schedules now forecast completion of all Central Everglades components by 2030, which is a positive outcome.
The revised IDS is a welcome communication tool that reflects diverse stakeholder input. Some limitations exist such as difficulties in easily identifying individual project costs and hard project dependencies. There are no indications of other the CERP projects that have not yet been authorized or planned, giving some a false sense of when restoration may be finished or what projects may no longer be considered. Finally, the original concept in the Programmatic Regulations (33 CFR §385.31) of a Master Implementation Sequencing Plan (now replaced by the IDS) required RECOVER to assess any changes in the Master schedule “for effects on achieving the goals and purposes of the Plan and the interim goals and targets.” Documentation of the effects of changes to the schedule on the timing anticipated ecosystem benefits would be valuable additional information to communicate.
Regulatory Constraints: Threatened, Endangered, and Protected Species Issues
Restoration must take place within the context of extensive state and federal laws that govern various aspects of natural resource protection. Thus, agencies involved in restoration planning and implementation projects must negotiate a labyrinth of complex legal requirements, at times at odds with each other. To ensure compliance with water quality standards under the Clean Water Act, a Consent Decree and NPDES permits dictate the quality of the water permitted to be discharged into the Everglades. The profound consequences of this for restoring sheet flow to the central Everglades was a central focus of NRC (2012), and integrating water quality requirements with restoration goals for water quantity and flow has been a central element in recent planning efforts, for example the Central Everglades Planning Project (NRC, 2014; USACE and SFWMD, 2014a). In this section, issues related to the Endangered Species Act (ESA), Migratory Bird Treaty Act (MBTA), and the Clean Water Act are discussed, focusing on current conflicts in which compliance with these laws constrains restoration. These cases exemplify the challenges that will recur as the restoration unfolds.
The South Florida ecosystem contains a rich biota, and accordingly, the restoration is designed to accommodate the needs of this diversity of species within appropriate portions of the system. As the restoration plan has been implemented, challenges to the ability of program managers to meet the needs of particular protected species have repeatedly arisen. As new structures and features are added to the system, and the distribution of water and hydrology change, resident species react, often in unanticipated ways. Some of these responses create chal-
lenges in finding ways to meet restoration objectives, while ensuring compliance with wildlife protection and water quality legal requirements. There has been a consensus that all native species will ultimately benefit from the restoration (e.g., FWS, 2016), an assertion examined further in Chapter 4. Even if this is so, as the system transitions from its current state (where hydrologic restoration in the central Everglades has been planned but not yet implemented) to a fully implemented CERP, local adverse effects on some species can be expected.
Integrating STA and FEB Operation with Avian Conservation
The most substantial and challenging conflicts affecting the restoration come into play when two or more federal environmental laws seemingly clash. The first current conflict is of this sort, involving the sometimes-contradictory requirements of the federal Clean Water Act, ESA, and MBTA. For example, requirements for the quality of the water permitted to be discharged onto federal lands and from stormwater treatment areas (STAs) into the Everglades Protection Area may be at odds with the ESA or the MBTA, which requires that operations be adjusted when protected species nest in an STA or flow equalization basin (FEB) to avoid potential “takes” of protected species. Managing the STAs to protect species may ultimately impact discharge water quality (and in the future, water flows), thereby adversely affecting downstream habitat quality for the same species.
STAs represent new wetlands and as such have proved highly attractive habitat to numerous resident bird species, and two—black-necked stilts and snail kites—have proved problematic in that their hydrologic requirements are not compatible with normal operation of STA cells. The black-necked stilt, protected by the MBTA but neither threatened nor endangered, builds nests on the ground or on other surfaces above the water. At the end of the dry season, stilts may nest in STA cells containing little or no water. In normal operations, these cells would refill at the onset of the rainy season, which would destroy stilt nests; thus inflow to cells with nesting stilts is restricted. Managers can also try to keep the water level in STA cells above 0.5 feet to prevent stilts from nesting.
The endangered Everglades snail kite builds nests in thick emergent wetland vegetation and in wet years when water levels are sufficiently high, nests in emergent vegetation in the STAs. In the STAs, normal operations maintain dry season low water levels suitable for kites, but they require a suitable rate of water recession to nest successfully, and nests can flood due to inflows or collapse if outflows result in rapid dry-down. Thus, the presence of nesting kites restricts movement of water in and out of the STA cells.
Although stilts and kites have different habitat needs, both species have recently found opportune conditions within at least some of the STAs. In Water
Year (WY) 2015 one or both species nested in all five STAs, in 17 of 44 (39 percent) cells and in 13 of 21 (62 percent) flow ways (DeBusk et al., 2016). There were 113 kite nests in STAs in the 2014 breeding season and 93 in the 2015 breeding season. Most of the nesting occurs in STA-5/6—73 of 93 nests were there in 2015, including 48 in one cell—and the remainder in STA-1E (and in the past, sometimes in STA-3/4). Stilts nest in all the STAs, with the distribution of nests among them varying greatly among years according to operations of the cells, that is, which cells are dry at the time of nesting. There were 204 stilt nests in STAs in the 2015 breeding season, and 122 in the 2014 breeding season.
The SFWMD has no authorization for incidental take of kites as nesting in STAs was not anticipated in the Biological Opinion for STA construction and operation (FWS, 2005). Currently, there is no explicit option for take under the MBTA. Thus, the birds must be protected, resulting in constraints on STA operations, ranging from 2-9 months among flow ways in WY2015 (DeBusk et al., 2016). FEBs are subject to this same potential concern. This causes deviations from desired operations to meet restoration objectives.
The extent to which protecting nesting kites and stilts compromises STA performance is not clear as this has not been quantified. Managers often need to limit stages within cells and divert water away from particular flow ways or cells, but flow ways and cells are more often taken off line or constrained in operation due to physical repairs or issues with vegetation than due to nesting birds. Despite the impacts of all these factors, STA performance was the best to date in WY2015 (see STA Performance later in this chapter). Whether in the absence of kites and stilts more water could have been treated, or phosphorus levels in outflows reduced even further, is not clear. Managers are just beginning to collect the data necessary to answer this question. Documenting the reduction in STA performance due to protection of nesting birds is critical to determining the importance of this conflict.
Further conflicts of this sort will no doubt arise as other restoration projects are implemented. In particular, any project creating new wetlands, altering current wetlands, or affecting hydrology could create conflicting objectives between the needs of protected species and the needs of restoration. The preemptive strategy employed in the case of STAs was to engage in formal consultation prior to construction to address conflicts that could be anticipated. However, this consultation resulted in a non-jeopardy opinion because the use of the STAs by kites for nesting was not anticipated (FWS, 2005), so this consultation did not address the potential conflict. New information that kites are indeed nesting in STAs, contrary to what was anticipated at the time of consultation, may warrant reinitiating consultation or pursuing some other means of including kite nesting as part of ESA implementation. Nesting by stilts was not anticipated either and was addressed after the fact through development of an Avian Protection
Plan. This plan protects the birds when they do nest in the STAs, and provides managers with guidance on operation of cells to avoid creating nesting habitat. But other operational needs and rainfall patterns sometimes result in conditions in which creation of nesting habitat cannot be avoided in some cells, and thus, performance continues to be compromised.
In the case of the MBTA, some additional flexibility may result from an agency-wide initiative. In May 2015, the U.S. Fish and Wildlife Service (FWS) issued a Notice of Intent to prepare a programmatic environmental impact statement on a proposal to authorize incidental take of migratory bird under the MBTA. In that notice, the FWS stated that it was considering pursuing rulemaking to address various approaches to regulating incidental take of migratory birds, including general authorization for “some types of hazard to birds associated with particular industry sectors . . . [and] memoranda of understanding with Federal agencies authorizing incidental take from those agencies’ operations and activities” (80 Federal Register 30032, May 26, 2015). As FWS stated “[a]n authorization system created through rulemaking could encourage implementation of appropriate conservation measures to avoid or reduce avian mortality . . . and could create a regulatory mechanism for bird mortality that cannot be avoided or minimized through best practice or technologies. Compensatory mitigation for incidental take, especially on a watershed or landscape basis, can provide conservation benefits. . . .” To date, the FWS has not published the environmental impact statement or proposed rule. Although explicit regulatory language has not yet been proposed, the rule is expected to provide additional flexibility under the MBTA for STA operation.
Even prior to the adoption of such a rule, the agencies should work together to explore options for increased flexibility necessary to optimize STA efficacy. In the past, the FWS has relied on its existing regulatory authority to allow limited “takes” of birds under specific circumstances. For example, the FWS has issued “special use” permits for incidental takes under certain specific circumstances pursuant to rule 50 CFR 21.27. This rule provides that permits may be issued for special purpose activities related to migratory birds upon a showing of a benefit to the migratory bird resource or for other compelling reasons. The FWS has relied on this rule to authorize the National Marine Fisheries Service to take birds incidental to certain fishing operations in Hawaii.8 The FWS has also exercised its discretion under the MBTA in other ways, such as through memoranda of understanding with federal agencies. For example, in an MOU with Federal Energy Regulatory Commission (FERC and FWS, 2011), the FWS has recognized that “actions taken to benefit some migratory bird populations may adversely affect other migratory bird populations” and that “actions that
___________________
8 See http://www.fws.gov/pacific/migratorybirds/pdf/pdf/NMFSPermitFONSI.pdf.
may provide long-term benefits to migratory bird populations may have short-term impacts on individual birds.” To optimize efficacy of STAs for maximum water quality purposes, the agencies could explore these and other options for flexibility under the MBTA.
Regardless of how the issues with protected bird species in the STAs are resolved, having to deal with each issue on a case-by-case basis as they arise is far from ideal and does not constitute an effective model for avoiding or resolving the conflicts that will arise in the future. There is a need for a programmatic strategy to address this issue—that is, a means to handle potential conflicts for the restoration as a whole rather than on a case-by-case basis resulting from individual projects and events.
Cape Sable Seaside Sparrows: Managing the Transition
Continuing to meet the needs of protected species as increments of restoration are implemented is another important challenge. Even for species and habitats projected to be positively impacted by a fully implemented CERP, local adverse effects of increments of restoration and individual projects have arisen, and more can be expected. For endangered species protected by the Endangered Species Act, these effects can have legal ramifications that can affect water management operations and have the potential to compromise the restoration. Managing such species during the transition from current conditions to a fully implemented CERP is a general problem in need of a solution.
This challenge is perhaps best illustrated by the long-running conflict over water management related to the Cape Sable seaside sparrows. As discussed in more detail below, this conflict currently is impacting water management at the boundary between WCA-3A and Everglades National Park embodied in the Everglades Restoration Transition Plan (ERTP, also discussed later in the chapter). A lawsuit asserting that current water management fails to adequately protect the sparrow was filed,9 and the FWS issued a jeopardy opinion on the impact of the ERTP on this species (FWS, 2016). The issue is that unsuitable, overly wet conditions for the sparrow have persisted in the habitat occupied by sparrow subpopulation A near western Shark River Slough (Figure 3-6; see also Chapter 4).
In principle, the restoration goal for this area to move more water through northeastern Shark River Slough and less through western Shark River Slough should alleviate the overly wet conditions experienced by subpopulation A. The ERTP aspires to do this, but only to a modest degree, and has failed to meet
___________________
9 Pimm & Bass v. U.S. Fish and Wild Service & U.S. Army Corps of Engineers, No. 1:15-cv-00657 (DC, filed April 30, 2015). This lawsuit was voluntarily dismissed by the plaintiffs on October 6, 2016.
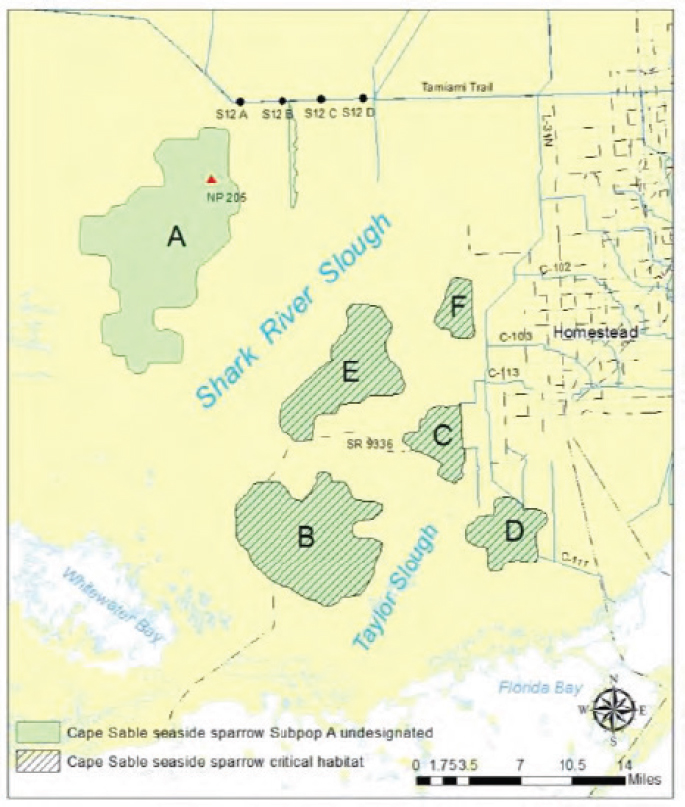
SOURCE: FWS (2016).
its operational targets for endangered species toward that end such that subpopulation A has continued to experience high water conditions (data provided in FWS, 2016). Flows out of Big Cypress National Preserve to the northwest have contributed to this problem. The short-term solution to this issue presented in the Biological Opinion is to accelerate implementation of the Combined Operational Plan that will redirect more flow into northeastern Shark River Slough and address the flows from Big Cypress National Preserve (see below).
However, recent analyses indicate that meeting the needs of Cape Sable seaside sparrows as the restoration unfolds will be far more complicated than simply fixing the problem by moving more water east as envisioned in the CERP. The complexity of the issue is evident in the Central Everglades Planning Project, which represents the first major CERP project to address water management issues along the WCA-3A–Everglades National Park boundary impacting the sparrows. The project implementation report and environmental impact statement (USACE and SFMWD, 2014a) and Biological Opinion (FWS, 2014) associated with the Central Everglades Planning Project provide detailed insight into how the restoration will affect the sparrows. Rather than having a uniformly positive effect, the project is anticipated to result in a complex mix of impacts on sparrows. It is indeed projected to create more favorable conditions in the northeastern portion of subpopulation A where much attention has been focused. However, it produces no improvements in other parts of A and a mix of positive and negative effects in the subpopulations near northeastern Shark River Slough and Taylor Slough, including a substantial negative impact on subpopulation E (Figure 3-7). The Central Everglades Planning Project also is projected to create new marl prairie habitat in areas not currently occupied by sparrows northeast of subpopulation A and between subpopulations C, E and F (Pearlstine et al., 2016).
Thus, analyses associated with the Central Everglades Planning Project confirm that restoration will improve habitat conditions for sparrows in some areas that are currently highly altered and degraded due to being too wet or too dry, but it also reveals that it will convert some areas of current marl prairie to wetter habitat types. The FWS reached a similar conclusion in evaluating the impact of Mod Waters and the Combined Operational Plan, although the impacts were much smaller in this case (FWS, 2016). The C-111 Spreader Canal (Western) and C-111 South Dade projects (discussed later in this chapter) have produced a similar mix of improvements to dry, degraded sparrow habitat and overly wet conditions in previously suitable sparrow habitat near Taylor Slough. Much the same can be expected from future increments of restoration affecting the areas in which the sparrows reside. The net effect on sparrows of the Central Everglades Planning Project and future restoration increments will depend on whether changes in the distribution of water result in shifts in the location of marl prairie habitat (rather than reduction of such habitat) and, if these shifts occur, whether the sparrows colonize this new habitat. The higher the operational target for volumetric flows and water depth, the more likely that marl prairie habitat will be reduced (see Chapter 4).
Even if the restoration is viewed as having a net positive effect on the sparrows, restoration will be impeded if no local negative effects on the sparrows are permitted due to its endangered status. In the case of the Central Everglades
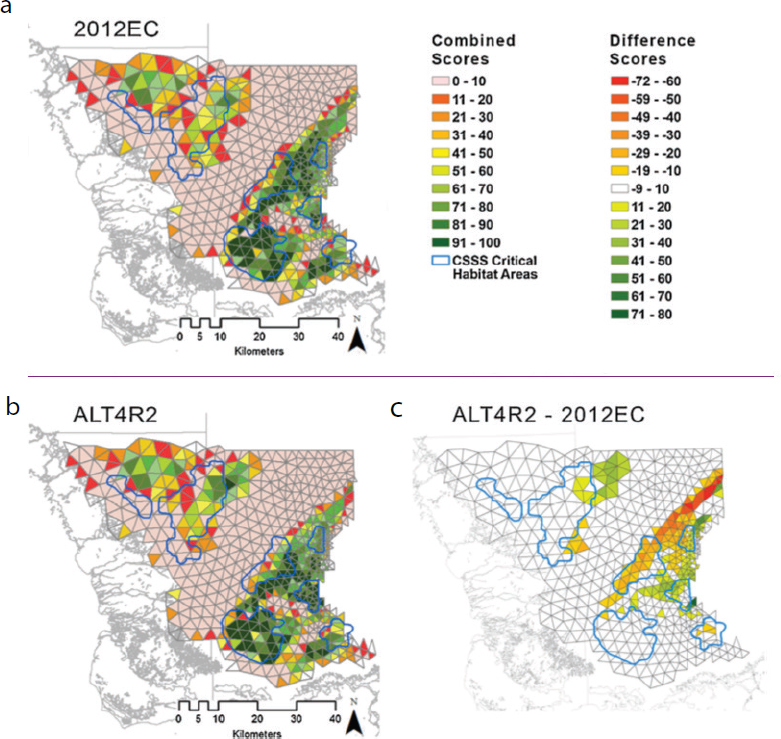
SOURCE: Pearlstine et al. (2016).
project, a negative impact on subpopulation E is projected. The FWS ruled that the project does not jeopardize the sparrow, based on its projected neutral overall impact, but did not authorize incidental take and loss of sparrows from subpopulation E due to restoration activities because project details have not been refined (FWS, 2014). A Memorandum of Understanding was developed to address the impacts of the Central Everglades Planning Project on sparrows (FWS, 2016), but a long-term solution is needed to avoid having protection of sparrows repeatedly being an obstacle to restoration that is played out on a case-by-case basis. As part of the recent consultation over the ERTP, the Corps proposed that a Comprehensive Conservation Plan for the sparrow be developed that includes identification of potential future habitat for this subspecies considering predicted flows associated with Everglades restoration projects and projected sea level rise, identification of habitat and population enhancement techniques to enhance resiliency, and exploration of translocation and captive breeding among other items (FWS, 2016). This appears to have the potential to produce the needed long-term solution to the conflict between sparrow conservation and the restoration, and as such could provide a model for addressing similar issues with other species.
CERP RESTORATION PROGRESS
In the following sections the committee focuses on natural system restoration benefits emerging from the implementation of CERP projects. In order for readers to understand the level of natural system restoration progress to be expected, a brief description of the state of implementation progress for each project is also provided. The committee’s previous report (NRC, 2014) contains additional descriptions of the projects, and progress up to March 2014, while this section emphasizes progress over the last 2 years. The South Florida Environmental Report (SFWMD, 2016e), the 2015 CERP Report to Congress (USACE and DOI, 2016), and the 2014 Integrated Financial Plan (SFERTF, 2014) also provide detailed information about implementation and restoration progress. The 2014 System Status Report (RECOVER, 2014) provides additional information on changing ecosystem conditions and discusses linkages to early project construction.
Measuring Restoration Progress
Environmental restoration generated by CERP and non-CERP projects begins with construction and operation of a project (or project component) designed to yield responses in the physical system (e.g., changes in hydrologic conditions, such as depth, duration, and flow) that in turn cause desired changes in the biological system (e.g., individual species, food webs, habitat, trophic-level
energy flows). The return of hydrologic conditions more similar to pre-drainage conditions potentially enables plant, animal, and microbial communities to develop that are more similar to pre-drainage communities than current ones are.
Monitoring using formal performance metrics can generate a quantitative record of ecosystem changes resulting from project operations. Repeated monitoring at appropriate intervals during the post-construction period, combined with baseline or reference site data, is essential in judging project success. The monitoring protocol must be rigorous enough to discern whether changes in performance metrics are causally linked to projects rather than to other influences or whether they simply reflect normal variability (NASEM, 2016).
Components of the physical and biological environment respond to project operations on highly variable time frames. Typically, hydrologic changes occur more rapidly than changes in ecological conditions but there is considerable overlap. Microbial and herbaceous plant communities, dominated by species with short life cycles, can respond to hydrologic changes within a few years. Responses of some users of those habitats, such as fishes and wading birds, may be equally rapid. In marked contrast, changes in ecological communities dominated by trees and shrubs are typically slow; more than a century may elapse before new habitats are fully restored.
The need to establish monitoring programs that may have components that last for more than a century, combined with the great richness of environmental attributes and processes that can be measured, stresses the importance of careful selection of indicators and attention to how frequently measurements need to be taken. In general, fast acting variables need to be measured frequently, whereas slow acting ones need to be measured much less often. For example, a major effect of the changed hydrology in the Picayune Strand is likely to be the conversion of extensive pine/palm savannas to bald cypress woodlands, a change unlikely to be completed in less than a century. Vegetation surveys no more often than once per decade should suffice to document those changes. Given the limitations in CERP funding, a small number of carefully selected indicators that are monitored at appropriate temporal and spatial intervals can be suitable to document restoration progress and support adaptive management. The following sections outline the natural system restoration progress based on monitoring to date at four Generation 1 CERP projects and two Generation 2 CERP projects for which construction has begun. Box 3-2 highlights lessons learned from monitoring at several CERP and non-CERP projects to date.
Generation 1 CERP Projects
Generation 1 projects are those authorized by Congress in WRDA 2007 (Picayune Strand Restoration, Site 1 Impoundment, and Indian River Lagoon-
South) or by program authority (Melaleuca Eradication). A summary of implementation progress as of September 2016 is provided in Table 3-1. The location of the various projects is shown in Figure 3-1.
Picayune Strand Restoration
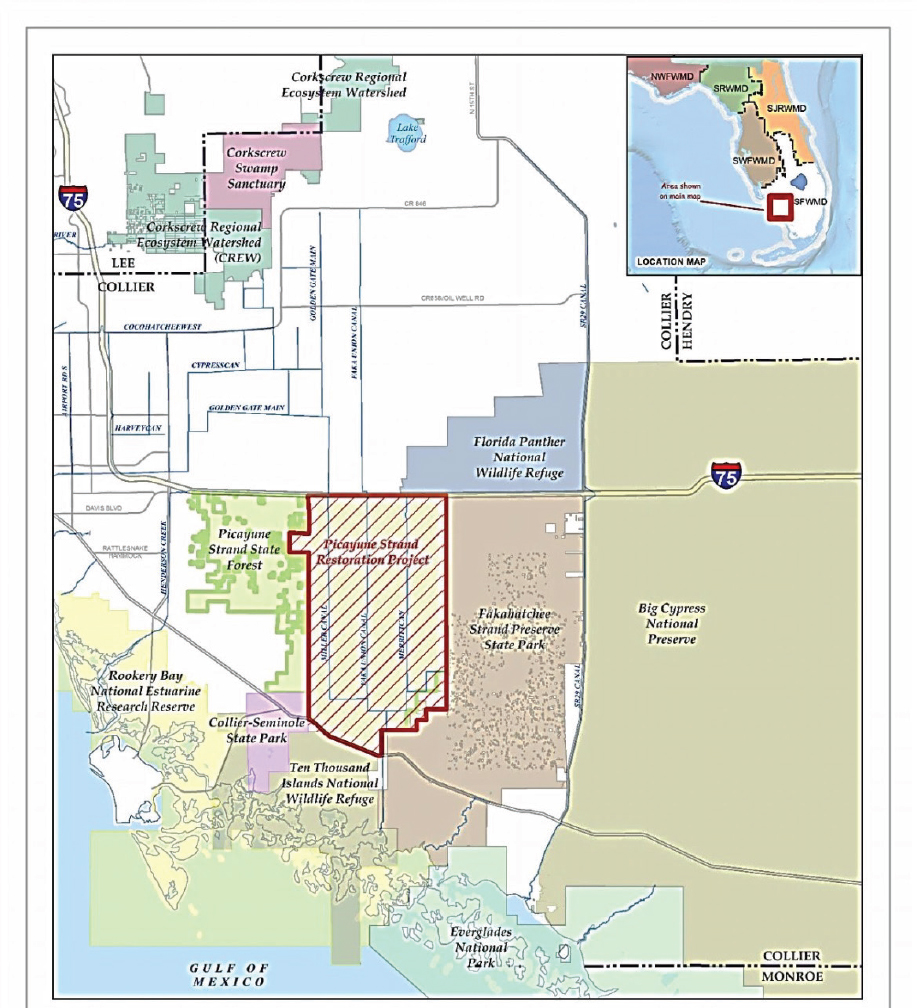
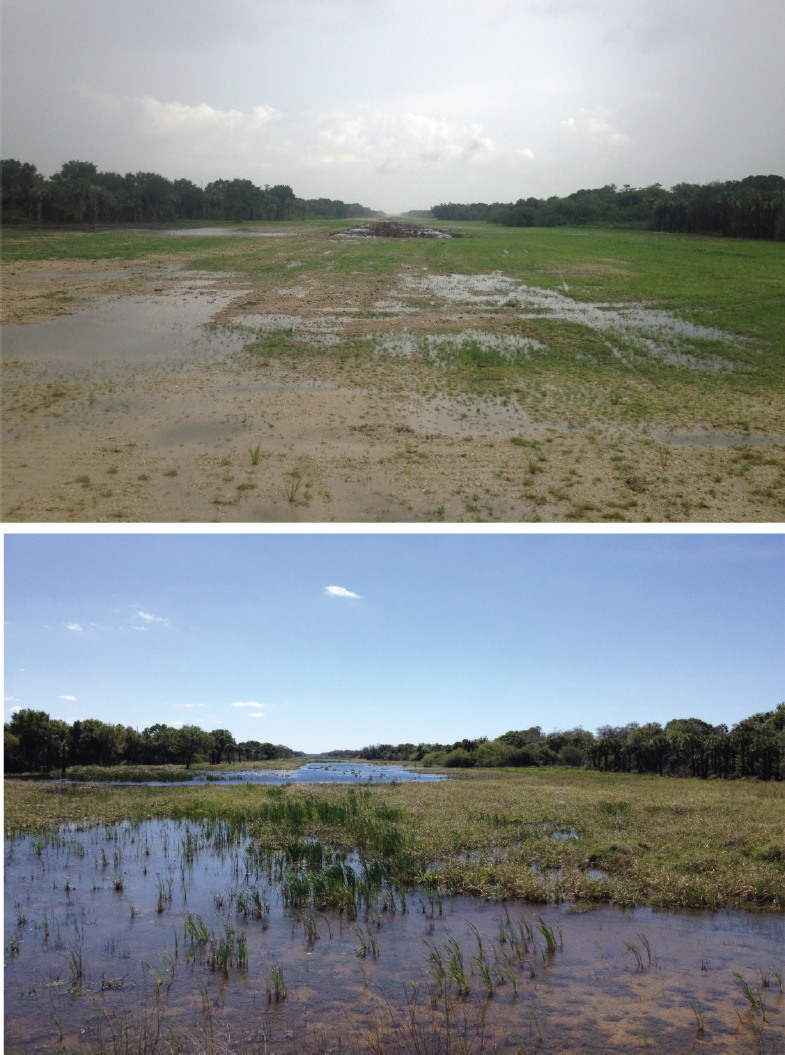
The Picayune Strand Restoration project, the first CERP project under construction, focuses on an area in southwest Florida substantially disrupted by a real estate development project that drained 55,000 acres (about 86 mi2) of wetlands before being abandoned (Figure 3-1, No. 5). The roads and drainage disrupted sheet flow into Ten Thousand Islands National Wildlife Refuge, altered regional groundwater flows in surrounding natural areas and drained a large expanse of wetland habitat (Figures 3-8 and 3-9). There has been considerable progress in constructing the Picayune Strand Restoration Project, including canal plugging, road removal, construction of pump stations (see Table 3-4). Due to cost and scope escalations, the project requires further authorization before it can be completed (SFERTF, 2014).
Natural system restoration benefits from the Picayune Strand Restoration are beginning to be recognized from the project increments completed to date, with improved wetland inundation and increased hydroperiods in 13,000 acres (about 29 mi2) (SFWMD, 2016a). Wet season surface water levels have increased
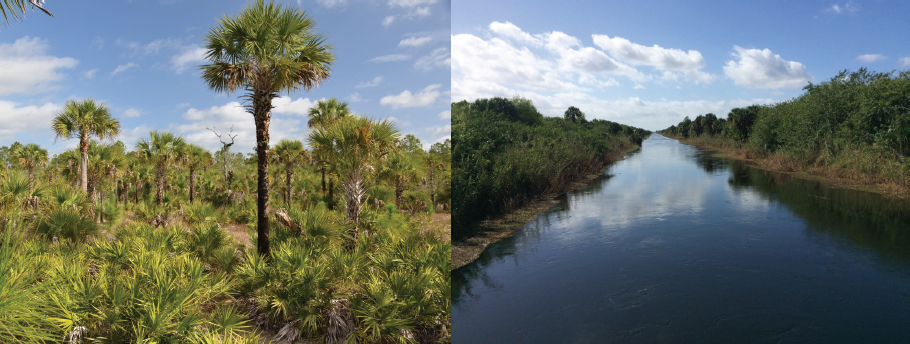
SOURCE: W.L. Graf, S. Johnson.
SOURCE: USACE and DOI, 2015.
TABLE 3-4 Phases and Progress of the Picayune Strand Project
| Lead Agency | Road Removal (mi) | Logging Tram Removal | Canals to Be Plugged (mi) | Other | Project Phase Status | |
|---|---|---|---|---|---|---|
| Tamiami Trail Culverts | State | NA | NA | 17 culverts constructed | Completed in 2007 | |
| Prairie Canal Phase | State (expedited) | 64 | 30 | 7 | Hydrologic restoration of 11,000 acres in Picayune Strand and 9,000 acres in Fakahatchee Strand State Preserve Park | Plugging and road removal completed in 2007; logging trams removed in 2012 |
| Merritt Canal Phase | Federal | 65 | 16 | 8.5 | Merritt pump station, spreader basin, and tie-back levee constructed | Completed in 2015; pump station transferred to SFWMD in 2016 |
| Faka Union Canal Phase | Federal | 81 | 11 | 7.6 | Faka Union pump station, spreader basin, and tie-back levee constructed | Roads removed in 2013; pump station completed in 2015; operational testing underway; canal plugging scheduled for 2020 |
| Miller Canal Phase | Federal/State | 77 | 11 | 13 | Construct Miller Canal pump station, spreader basin, tie-back levee, and private lands drainage canal; remove western stair-step canals | Miller pump station under construction to be complete in 2017; road removal and canal plugging scheduled for 2018 and 2020, respectively |
| Manatee Mitigation Feature | State | 0 | 0 | 0 | Construct warm water refugium to mitigate loss of existing refugium | Completed in 2016 |
| Southwestern Protection Feature | State | 0 | 0 | 0 | Construct 7-mile levee for flood protection of adjacent lands | Construction completion scheduled for 2020 |
| Stair-step Canals between Prairie and Faka Union Canals | Federal | 0 | 0 | 5.2 | Construction completion estimated in 2018 |
SOURCES: J. Starnes, SFWMD, personal communication, 2016; USACE and SFWMD (2016a).
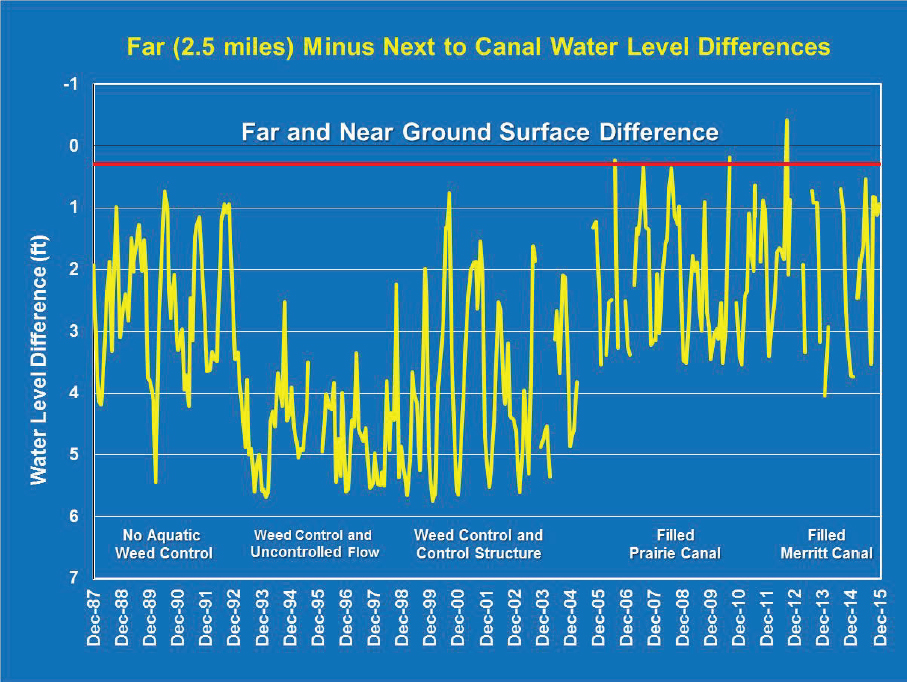
1 to 2 feet relative to background conditions and dry season groundwater levels have increased 3 to 4 feet due to the plugging of the Prairie and Merritt canals (Figure 3-10), and monitoring results suggest that canal filling has stimulated a rise in groundwater levels within about 3 miles of the filled canal (RECOVER, 2014). Additional increases in water level toward reference conditions (as monitored since 1987 in the neighboring Fakahatchee Strand, an area with similar topography and vegetation) are expected in these areas when the stair-step canals at the southern end of the project are also plugged in 2017 (see Figure 3-9). The Florida panther population is expanding, and they are seen more frequently in
SOURCE: M. Duever, Natural Ecosystems, personal communication, 2016.
the project area, although the specific impact of the Picayune Strand project is not clear (USACE and DOI, 2015). Early vegetation monitoring shows that groundcover near the Prairie Canal is becoming more similar to reference conditions (Figure 3-11), although restoration has not yet affected the density of Sabal palmetto, a native nuisance species in drained areas (RECOVER, 2014). There are anecdotal reports of wading birds, once absent from the area, now returning for foraging but wildlife monitoring is not planned until all three pump stations are operational. Aquatic faunal monitoring will begin in 2016, and data will be compared to baseline and reference site data. Vegetation transect surveys are also anticipated in 2016. Vegetation monitoring at Picayune Strand will be repeated in years 1, 3, and 5 after the first full growing season following the plugging of the canal (in any given phase) and then every 5 years for years 5-20, and then every 10 years until 2050 (J. Starnes, SFWMD, personal communication, 2016).
Site 1 Impoundment
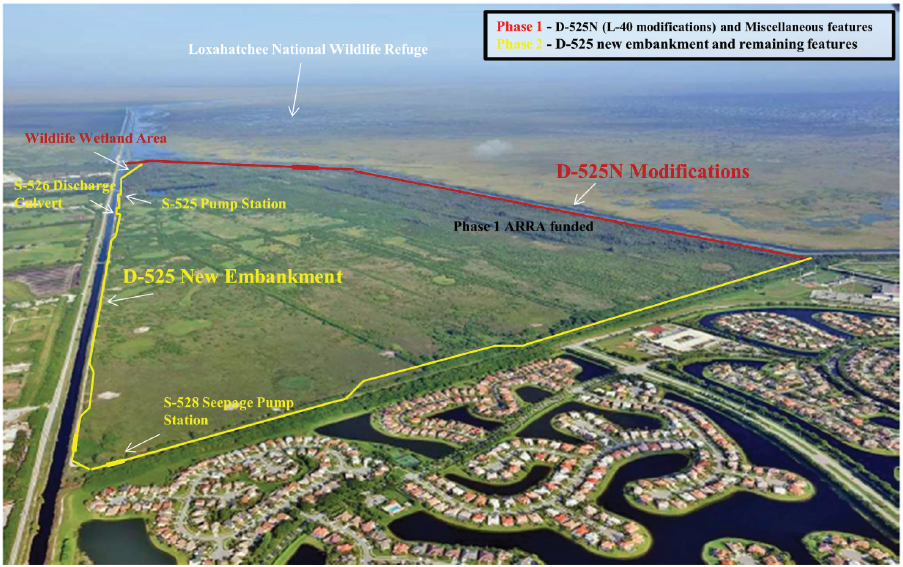
The Site 1 impoundment project (No. 6 on Figure 3-1) is located at the junction of the southern tip of the Loxahatchee National Wildlife Refuge (LNWR, also known as Water Conservation Area 1 [WCA-1]) with the Hillsboro Canal (Figure 3-12). The project was originally cast as a single-phase effort to modify local hydrologic conditions to store more water (13,300 acre-feet [AF]) and help alleviate demands on water in LNWR. Without the project, during wet periods, runoff from LNWR is shunted to the ocean, while during dry periods, water is taken from the LNWR to meet user demands elsewhere. With the Site 1 impoundment, water can be better managed to supply natural system demands within the LNWR (USACE and SFWMD, 2016b). In 2009, the project was divided into two phases (see Figure 3-12). Construction of Phase 1—an $81 million effort included clearing, ground preparation, modifications to the existing L-40 levee, and construction of a 6-acre wildlife wetland area—was completed in January 2016 (USACE and SFWMD, 2016b G. Landers, USACE, personal communication, 2016). USACE (2016c) stated that phase 1 provides a 16 percent reduction in existing seepage at the L-40 levee. It is unclear whether such a change would be detectable in the hydrologic conditions of LNWR.
Phase 2 of the project awaits further congressional authorization necessitated by increased costs (USACE and SFWMD, 2016b). The SFWMD, however, in 2016 communicated to the USACE that it is no longer interested in constructing Phase 2, because of the high anticipated cost of the plan relative to the benefits provided (M. Morrison, SFWMD, personal communication, 2016). The committee has not reviewed the project benefits in detail relative to the benefits of other CERP projects, but such an analysis could reasonably be part of the systemwide assessment of the CERP under alternative future conditions
SOURCE: M. Duever, Natural Ecosystems, personal communication, 2016.
SOURCE: Modified from Audubon, 2010.
proposed in Chapter 5. The future of Site 1 Impoundment, Phase 2, for now, remains unsettled.
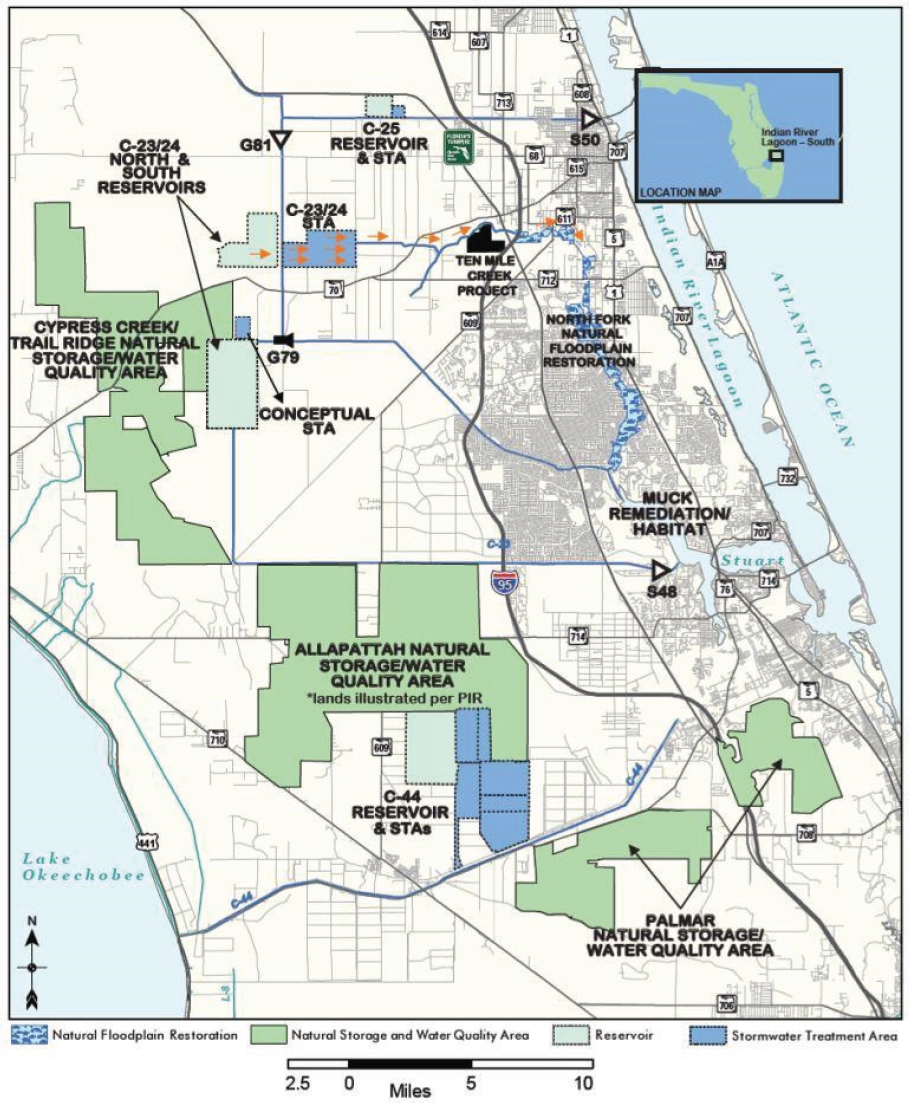
Indian River Lagoon-South
The Indian River Lagoon and St. Lucie Estuary are biologically diverse estuaries located on the east side of the Florida Peninsula, whose ecosystems have been impacted by polluted runoff from farmlands and urban areas and surges of freshwater (USACE, 2013). The Indian River Lagoon-South (IRL-S) project (Figure 3-1, No. 7) is designed to reverse this damage through improved water management, including the 50,600-AF C-44 storage reservoir, three additional reservoirs with a total of 97,000 AF of storage, four new stormwater treatment areas (STAs), dredging of the St. Lucie River to remove 7.9 million cubic yards of muck, and
restoring 53,000 acres of wetlands, among other features (Figure 3-13). The project is anticipated to cost $3 billion in 2014 dollars, an increase of $1.3 billion from 2010 primarily due to changes in scope associated with additional dam safety requirements (USACE and DOI, 2016).
Construction on Indian River Lagoon South has made considerable progress over the last 2 years (since June 2014). Construction was completed on some features included in the C-44 reservoir, including intake and drainage canals, access roads, and staging areas. Construction has also begun on the C-44 reservoir, pump station, and stormwater treatment area (USACE and SFWMD, 2016c). Reservoir construction is anticipated to be completed in 2020 (R. Braun, SFWMD, personal communication, 2016). It is still too soon to see improvements to the natural system as a result of this project.
Melaleuca Eradication and Other Exotic Plants
The Melaleuca Eradication and Other Exotic Plants Project is a CERP effort to address the potential threat to restoration posed by non-native invasive plant species. Four invasive species that are particularly problematic are the focus of major ongoing management efforts: Melaleuca (Melaleuca quinquenervia), Brazilian pepper (Schinus terebinthifolius), Australian pine (Casuarina spp.), and old world climbing fern (Lygodium microphyllum). A crucial part of this work is centered at the U.S. Department of Agriculture’s Invasive Plant Research Laboratory in Davie, Florida, where specific biological control agents—mostly insects—are developed. With CERP funds, U.S Department of Agriculture has constructed a 2,700-ft2 annex to the present laboratory to facilitate additional mass rearing (Figure 3-1, No. 8). The $4.5 million annex was completed in 2013 and has been transferred to the local sponsor (USACE, 2015b; K. Smith, USACE, personal communication, 2016). The project includes CERP operations and maintenance funding (estimated at $660,000/year) for mass rearing, release, and field monitoring of biocontrol agents to manage the spread of invasive nonnative plant species in the Everglades and South Florida (USACE and SFWMD, 2015a). In 2015, the facility released more than 500,000 brown lygodium moths and mites to control climbing fern, and almost 400,000 insects targeted to water hyacinth (Rodgers, 2016).
The Melaleuca Eradication and Other Exotic Plants project is one effort among many efforts to control invasive plant species in the Everglades, and several federal and state agencies are engaged to control these problem plants. In FY2015, the SFWMD spent $19 million combating 75 nonindigenous plant species in the Greater Everglades region (Rodgers, 2016). As a result, the exact contributions of this CERP project in the overall effort are difficult to parse, although the control of invasive plants is essential to achieve restoration goals
SOURCE: USACE (2016c).
(NRC, 2014). Discussion of progress coordinating the broad efforts to address invasive species is discussed later in this chapter (see Non-CERP Restoration Progress).
Generation 2 CERP Projects
Four second-generation CERP projects were authorized as part of WRRDA 2014 (Table 3-1). These projects were the Biscayne Bay Coastal Wetlands (Phase 1), the C-111 Spreader Canal (Western) Project, C-43 Reservoir, and the Broward County Water Preserve Areas. No construction has begun on the Broward County Water Preserve Areas, so the discussions will focus on the other three projects.
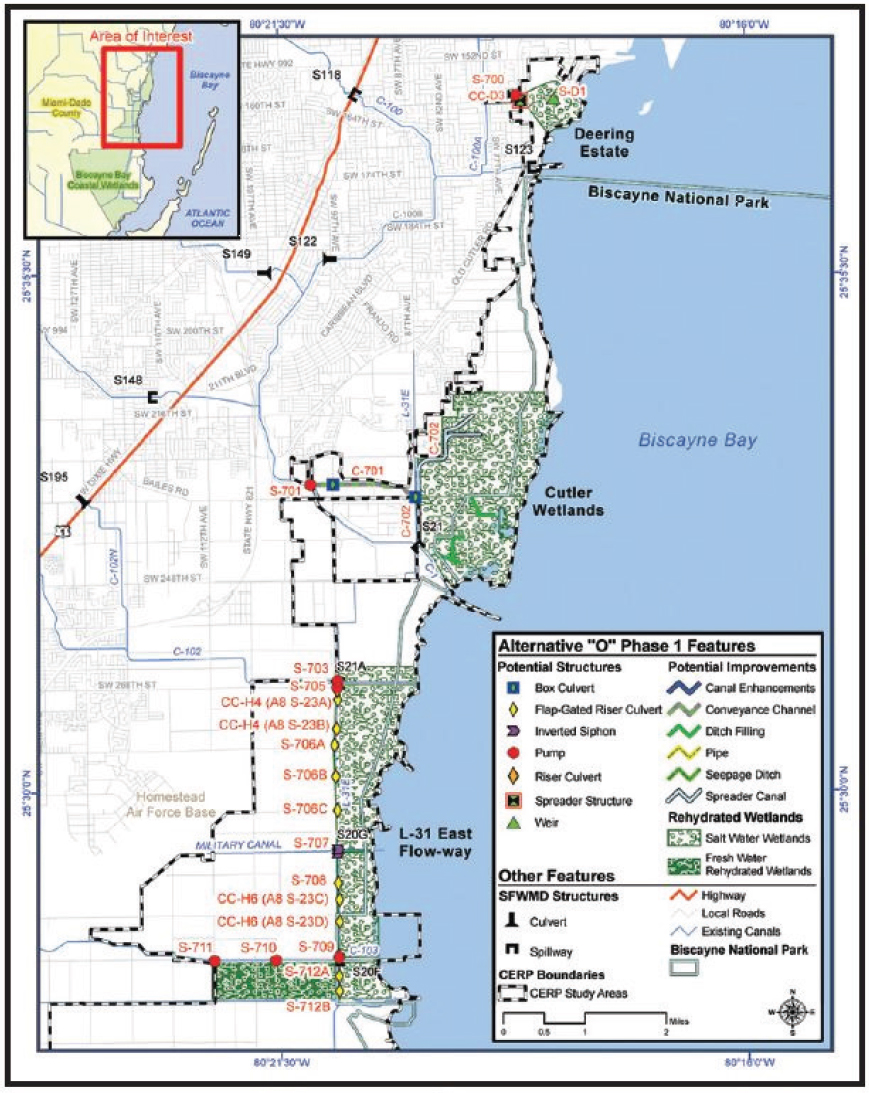
Biscayne Bay Coastal Wetlands (Phase 1)
The Biscayne Bay Coastal Wetlands are located in Miami-Dade County at the western edge of Biscayne Bay (Figure 3-1, No. 10, and Figure 3-14). Drainage and development has cut off the wetlands from their source of freshwater flows resulting in a loss of wetland ecosystems and causing an increase in salinity along the margin of the bay. The project seeks to reverse these effects on 11,300 acres of the total 22,500 acres of wetlands by installing pump stations, spreader canals, culverts, and ditch plugs. The project is proceeding in two phases: Phase 1 is a stand-alone project encompassing three geographic areas (Deering Estates, Cutler Wetlands, and L-31E Flow-way), while Phase 2 has not yet been specifically planned or authorized. The components of the Deering Estates phase—a spur canal extension, spreader structure, and pump station—were completed and became operational in 2012. Four culverts out of ten in the L-31E canal designed to divert flows into coastal wetlands were finished in June 2010. The work on Cutler Wetlands has not yet begun. Continued work on the L-31E component is anticipated to begin in 2017 (USACE, 2016n).
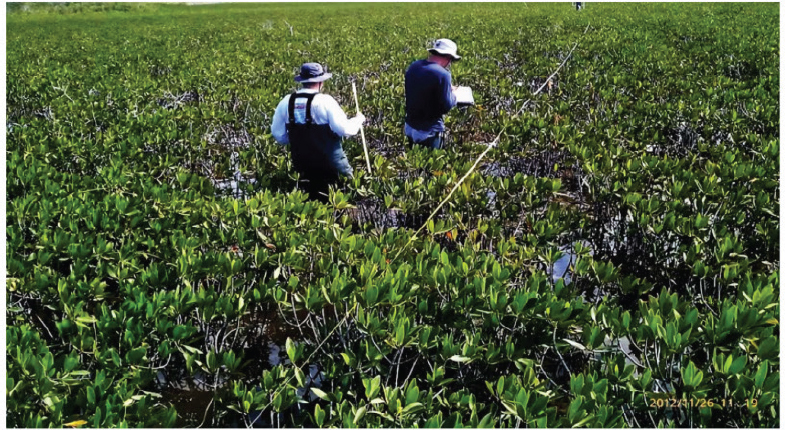
To date, the project increments implemented have been rather small in the context of the original project objectives, but the construction allows partial restoration of flows through the coastal wetlands to Biscayne Bay to help restore a more natural salinity balance (USACE and SFWMD, 2016d). SFWMD has collected monitoring data on water stage, discharge, salinity, and vegetation for the past 4 years to document the effects of the project (Figure 3-15), comparing the results to baseline data collected before project implementation. In WY2014 and 2015, approximately 20,000 and 15,000 AF/year were diverted into the Deering Estate wetlands (Charkhian, 2015, 2016). The response of salinity was mixed; nearshore salinity did not show much response to pumping and remained above the RECOVER target of 20 ppt, while salinity decreased in the remnant wetlands,
SOURCE: USACE (2016d).
SOURCE: Charkhian (2016).
declining from 25-40 ppt to less than 1 ppt within 6 weeks of the start of pumping (RECOVER, 2014). In response, upland vegetation that had encroached into the wetland has begun to die back (Charkhian, 2016).
During 2015, approximately 8,000 AF of water was diverted into the coastal wetlands through the L-31E culverts, representing about 5 percent of available flow and exceeding the project target for the first time since the project began operations (Charkhian, 2015, 2016). Periphyton is now common in the mangrove areas of the project, while east of the L-31E canal sawgrass has increased from 43 acres to 48 acres. Additionally, faunal monitoring showed an increased abundance of fish, wading birds, amphibians, and invertebrates east of the culverts in 2015 (Charkhian, 2016). Field observations show that there has been no significant response in the composition and coverage of the vascular plant communities (RECOVER, 2014). Monitoring to date did not show effects on nearshore salinity.
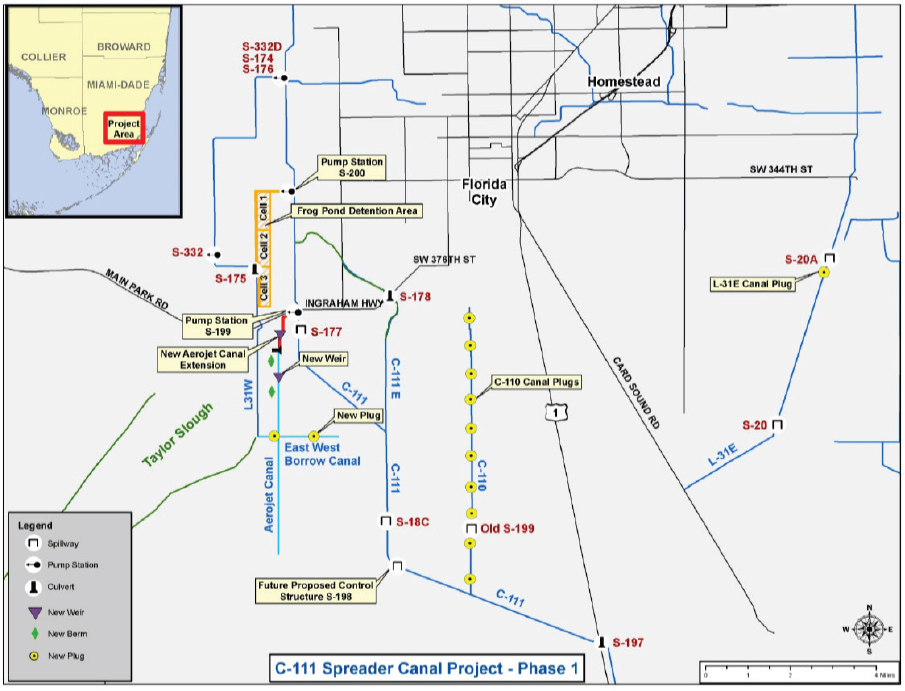
C-111 Spreader Canal (Western) Project
The C-111 canal (Figure 3-1, No. 9) is the southernmost canal for the entire Central and Southern Florida Project. Designed to provide flood protection for
agricultural lands to the east in South Dade County, the C-111 canal also drained water from the Southern Glades and Taylor Slough in Everglades National Park. Much of the water in the canal is a result of seepage from Everglades National Park to the west. This change in flow pattern caused ecological damage to Taylor Slough, which became too dry; at the same time, Barnes Sound and Manatee Bay suffered ecological damages as releases of freshwater upset the salinity balance of their waters. Working in concert with the non-CERP C-111 South Dade project to the north (discussed later in this chapter), the C-111 Spreader Canal (Western) project promises increased flow volumes in Taylor Slough and improved salinity regimes in eastern Florida Bay by reducing seepage along the C-111 corridor (SFWMD, 2013a). The project is structured in two phases, with the first phase (Western Project) to include two pumping stations, a 560-acre detention basin, and various canal modifications. Water from the C-111 canal is pumped into the C-111 Spreader Canal detention and the plugged Aerojet canal areas, creating a 6-mile-long hydraulic ridge along the eastern boundary of Everglades National Park. Most of the water in the detention area seeps back into the canal, but the hydraulic ridge reduces seepage from the Everglades and retains water in Taylor Slough, thus, improving the distribution of flows into Florida Bay (Qui, 2016) (Figure 3-16). The C-111 Spreader Canal (Eastern) project has not yet been specifically planned or authorized. The C-111 Spreader Canal (Western) project was largely completed in February 2012 and is now operational. One additional new structure (S-198) is authorized in the lower C-111 but it is not currently scheduled for construction (USACE and SFWMD, 2016e). The natural system benefits of the C-111 Spreader Canal (Western) Project are difficult to separate from those of the C-111 South Dade project to the north (discussed later in the chapter), because C-111 South Dade project features, including the South Detention Area that has been operating since 2010 have similar overarching objectives. Thus, the results discussed here should be attributed to both projects, until more analysis is available to attribute benefits to a specific project.
Based on the first 4-6 years of project operations and available monitoring data, the hydrologic and ecological effects of the project have not been determined. Initial reports of project benefits, including hydroperiods that were 50 days longer on an average annual basis and reduced salinity levels in coastal waters (Audubon Florida, 2014; Rudnick et al., 2015; USACE and DOI, 2015), cannot be definitively attributed to the project because these outcomes occurred during a period of increased rainfall. The same areas of Florida Bay in which low salinities were originally attributed to the project showed elevated salinities in the summer of 2015 during an extended localized drought (see Chapter 2). Based on model predictions, it may be difficult to detect improvements in salinity in Florida Bay from the C-111 Spreader Canal (Western) Project amidst the natural variability (Qui, 2016).
SOURCE: USACE and SFWMD (2016e).
Some ecological changes have been noted since 2012 that may be attributable, at least in part, to the two projects. American crocodile nesting and population trends are increasing along the coast (USACE and DOI, 2015). Roseate spoonbills nesting increased from 87 nests in WY2011 to 207 nests in WY2013, and nesting success has also increased (RECOVER, 2014). However, the National Park Service (NPS) (2015) reports declining chick production in northeast Florida Bay in its 2015 assessment. Longer hydroperiods have improved conditions for Cape Sable seaside sparrows in areas that have habitually experienced overly dry conditions previously (i.e., population F, see Figure 3-6) (FWS, 2016). However, portions of population D east of Taylor Slough are now more often experiencing hydroperiods that are longer than the 90-to-210-day target for this species.
Additional gages have been installed to enable more accurate monitoring of conditions experienced by this population (FWS 2016).
A longer monitoring period compared to baseline data will be required to specify the quantitative results and aid in determining the role of the restoration project (Qui, 2016). Reference site monitoring is available for some measures, such as surface-water stages and rainfall, and salinity in Florida Bay, but less so for others, which makes attribution of positive outcomes to the project as opposed to other factors more challenging (USACE and SFWMD, 2011a). In conclusion, this committee agrees with the assessment of Qui (2016) that “because of the relatively short period of operation and monitoring period of record (start-up occurred in 2012), it is too early to fully evaluate the project’s success in achieving its objectives. A longer monitoring period and assessment during a wide range of meteorological conditions will reduce uncertainty about the relationship between the project’s operations, stages, and flows in Taylor Slough and salinity in Florida Bay.” This conclusion applies to effects on biota as well.
C-43 Storage Reservoir
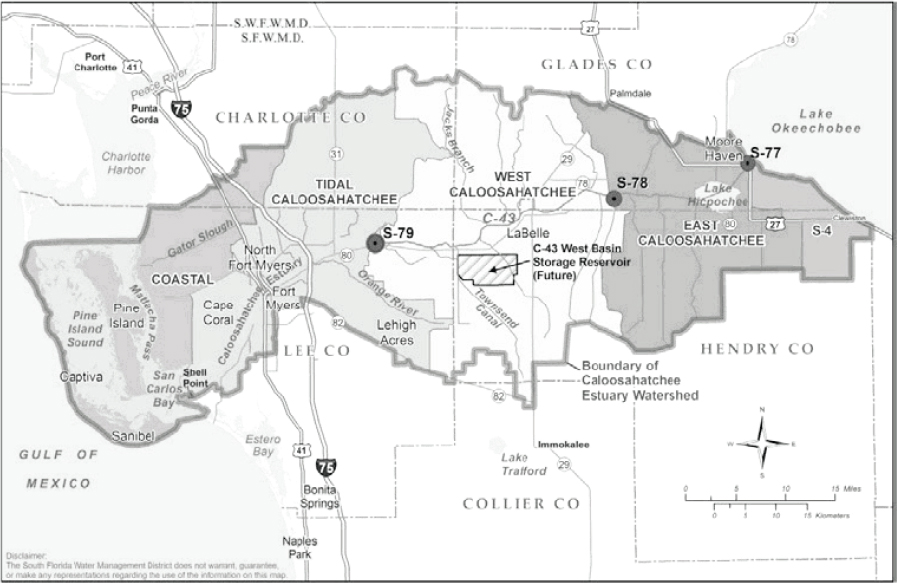
A major environmental issue in the estuary of the Caloosahatchee River on the west coast of Florida is the restoration and maintenance of appropriate salinity levels for aquatic organisms, particularly shellfish. Early in the twentieth century, the course of the Caloosahatchee River was deepened and straightened, and canals were dug in the river basin to provide a capacity for drainage of agricultural lands and urban areas. The result is that during periods of prolonged low rainfall, freshwater flow to the estuary is greatly reduced, to the extent that saline water can migrate far up the river and kill beds of freshwater submerged plants. During periods of heavy rainfall, large volumes of nutrient- and sediment-rich freshwater are transported into the estuary, affecting habitat quality for sea-grasses, oysters, and other aquatic organisms. The Caloosahatchee River (C-43) West Basin Storage Reservoir (Figure 3-1, No. 11) is a CERP project designed to impound up to 170,000 AF of stormwater runoff from the C-43 drainage basin or from Lake Okeechobee during wet periods (Figure 3-17; USACE and SFWMD, 2016f). During dry periods, this stored water can be released to supplement low river flows to maintain optimal salinity levels in the estuary and is available for water supply. The area of ecosystem benefits extends to almost 80,000 acres (about 125 mi2) of riverine and coastal waters (USACE, 2007b).
This first phase of construction began in late 2015 and is anticipated to be completed by 2021 (R. Braun, SFWMD, personal communication, 2016). As of early 2016, the first of two construction phases is under way, including construction of two pumping stations, construction of the western cell of the reservoir
SOURCE: Zhang et al. (2016).
(cell 1), and establishment of the perimeter canal. Because reservoir construction is still ongoing, it is too soon to see natural system benefits from this project.
Generation 3 Projects
Generation 3 represents projects that have been pending authorization, with approved project implementation reports, during the 2015-2016 period. The only project in this category is the Central Everglades Planning Project (Figure 3-1, No. 13 and 14), a $1.9 billion initiative designed to expedite restoration of the Water Conservation Areas, Everglades National Park, and Florida Bay. The final project implementation report was completed in August 2014 (USACE and SFWMD, 2014a), after an intensive 2.5-year planning effort (see NRC, 2014). The administrative review of the project and the record of decision
were completed in August 2015 (USACE and SFWMD, 2016g). The project was authorized by Congress in December 2016 in WRDA 2016. Construction has not begun and therefore, there are no project-related benefits to discuss.
Generation 4 Projects in Planning
This section describes aspects of several projects for which planning is under way or anticipated to begin soon, including the Loxahatchee River Watershed Restoration, Lake Okeechobee Watershed, and Western Everglades. Progress in project planning has important implications for the location and pace of future restoration progress, because completion and approval of project implementation reports followed by congressional authorization are required steps prior to federal restoration investments.
Loxahatchee River Watershed Restoration
The Loxahatchee River Watershed Restoration Project (Figure 3-1, No. 15) is a CERP project that had been expedited by SFWMD investment. The purpose of the project, located in the southern headwaters of the Loxahatchee River and north of LNWR (WCA-1), is to rehydrate several thousand acres of wetland habitat that has been desiccated by artificial drainage, provide restoration flows to the Northwest Fork Loxahatchee River, and address saltwater intrusion. Plans for this project were suspended in 2011, but they have now been restarted and project delivery team is now doing preliminary work on the project implementation report (USACE, 2015d, 2016e).
Lake Okeechobee Watershed
The CERP Lake Okeechobee Watershed Project includes several CERP project components located north of Lake Okeechobee that were intended to increase habitat, reduce phosphorus loading into the lake, and provide additional storage to regulate extreme high and low water levels in Lake Okeechobee and reduce high volume estuary discharges. A general list of management measures to be considered in the project planning includes the 250,000 AF of total storage capacity, aquifer storage and recovery (ASR), wetland restoration, and improved flexibility within the existing lake regulation schedule, based on project features in the 1999 CERP plan.10 This storage total is far below other estimates of storage requirements to satisfy flow targets in the estuaries. The
___________________
10 Project Delivery Team, meeting of August 10, 2016. See saj.usace.army.mil/Missions/Environmental/Ecosystem-Restoration/Lake-Okeechobee-Watershed-Project/.
River of Grass planning process set a “conceptual level” estimate of storage north of the Lake in the range of 450,000–575,000 AF (Balci, 2010), and the Lake Okeechobee Phase II Technical Plan (SFWMD and FDEP, 2008) identified a storage goal of 900,000 to 1.3 million AF for the watershed under the assumption that no additional water from the Lake could be sent south.11 A recent independent review by the University of Florida Water Institute (2015) determined that there is a need for as much as 1,000,000 AF of storage north or south of Lake Okeechobee to meet restoration goals for the northern estuaries. It is unknown whether additional storage would be considered during the project planning process to meet broader restoration goals or to address shortfalls in storage in other areas of the CERP (see Chapter 4). Planning began in August 2016; the initial array of alternatives was presented in November 2016. The CERP project would complement other state efforts on water storage and water quality north of Lake Okeechobee, including the Northern Everglades Estuaries Protection Plan, the Lakeside Ranch and Taylor Creek/Nubbin Slough STAs, and the Dispersed Water Management Program.
Western Everglades
The term “Western Everglades” is commonly used to refer to the Everglades landscape at and near the western perimeter of WCA-3A as delineated by the L-28 canal and the watershed reaching northward from this area (Figure 3-18). Although the Northern, Central, and Southern Everglades have been prominent in the CERP and closely related projects, the Western Everglades exist in relative obscurity. This obscurity cloaks the importance of the Western Everglades. Model simulations show that flows issuing from the Western Everglades represent more than 40 percent of inflows to WCA-3A (see Appendix B) and have substantial impacts to water management in WCA-3 and Everglades National Park. The L-28 Interceptor (Figure 3-19) diverts water from Big Cypress National Preserve into WCA-3A, contributing to high water levels and tree island flooding in the latter. In addition, the L-28 drains water out of Big Cypress southward toward the western marl prairie in Everglades National Park, contributing to overly wet conditions for Cape Sable seaside sparrows in that area (see ERTP later in this chapter) (FWS, 2016).
The habitats of the Western Everglades are directly shaped by water depth and topography. Generally, the area west of the L-28 canal is a landscape of pine flatwood forests and forests of cypress and palm trees (Figure 3-20), with elevations 1 to 2 feet higher than the central Everglades (Butcher, 2016). Prior
___________________
11 SFWMD, Lake Okeechobee Protection Plan Update, March 2011. Section 6.3 Watershed Water Storage—Strategies and Promising Solutions.
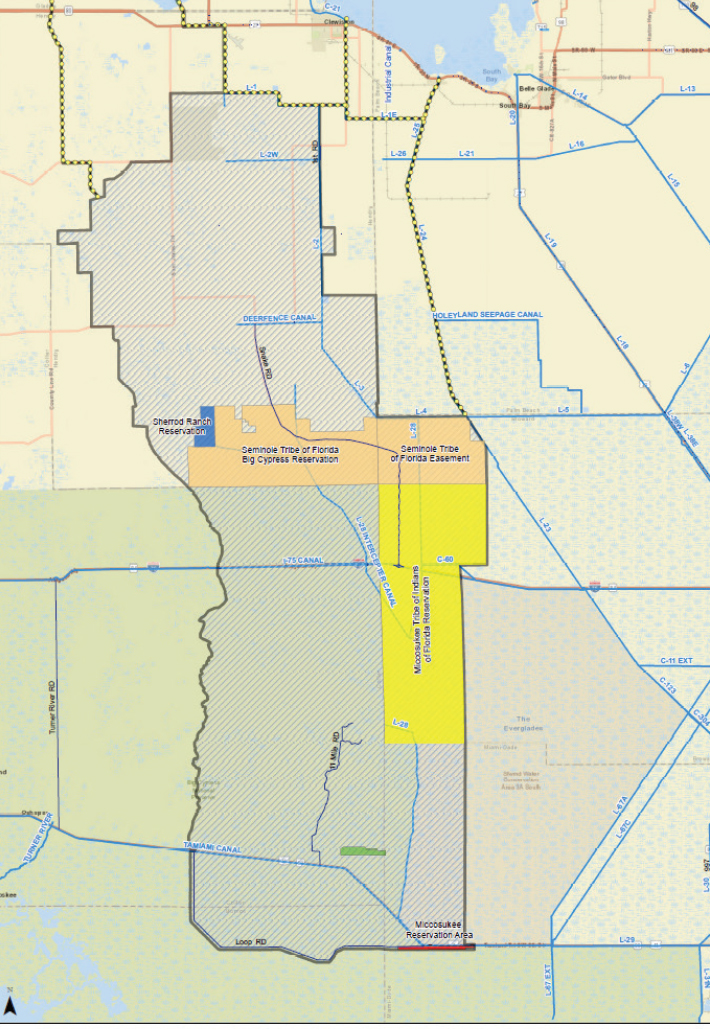
SOURCE: http://www.saj.usace.army.mil/Missions/Environmental/Ecosystem-Restoration/Western-Everglades-Restoration-Project/.
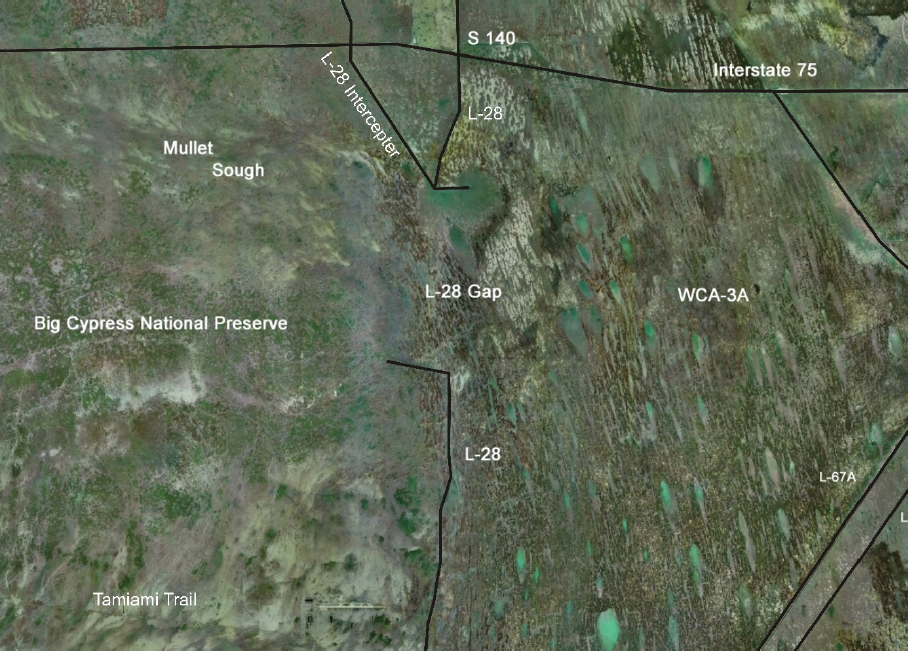
SOURCE: Base image from Google Earth 2005.
to development, water flows in the vicinity of the Western Everglades were shallow-gradient unconfined flows generally from northwest to south and southeast, flowing through Mullet Slough into what is now WCA-3A to join the main Everglades flows (Figure 3-19). Canal drainage for agricultural development has disrupted these flows and over-drained natural areas.
Water quality is also a major issue in the Western Everglades. Waters issuing from the mostly agricultural landscapes located in the northern portions of the Western Everglades (including the C-139 basin and the Feeder basin) have elevated phosphorus content (Figure 3-21) and are of particular concern for
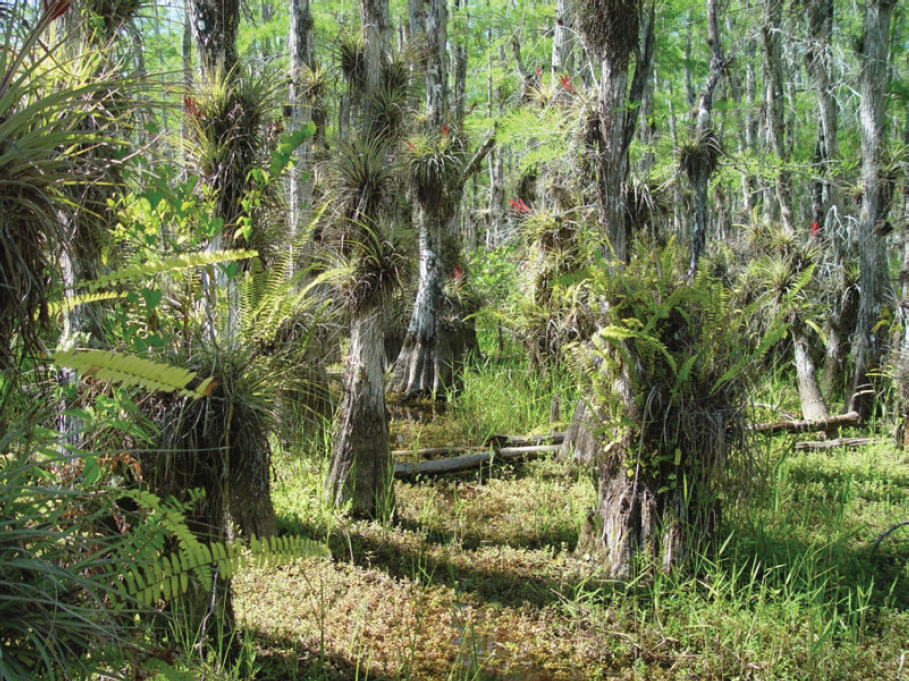
SOURCE: W.L. Graf image.
the Miccosukee Tribe of Indians of Florida. One particularly visible ecosystem effect of these nutrient-enriched waters is a dense forest of willow (Salix sp.; Richardson, 2008) growing at the end of the northern stretch of the L-28 that appears as a dense thicket of vegetation expanding over ridge and slough as well as tree islands that were once used as Miccosukee camps (visible as a bright green halo at the end of the L-28 interceptor in Figure 3-19).
The Big Cypress/L-28 Interceptor Modification outlined in the Yellow Book (USACE and SFWMD, 1999) was developed to reestablish sheetflow across the Big Cypress Seminole Indian Reservation into Big Cypress National Preserve and address water quality concerns in the North and West Feeder Canals. A planning
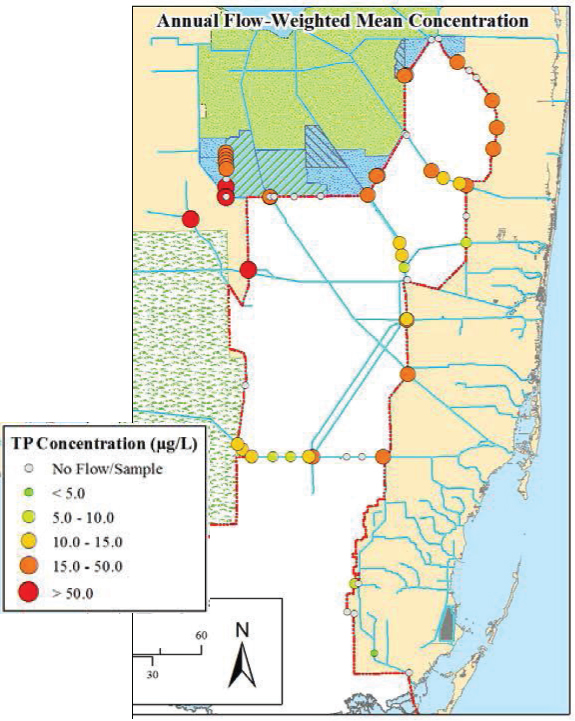
SOURCE: Julian et al. (2016).
process was launched in August 2016 that describes its purpose as improving “the quantity, quality, timing, and distribution of water needed to restore and reconnect the western Everglades ecosystem.”12 Public meetings are under way
___________________
12 See http://www.evergladesrestoration.gov/content/werp/meetings/082316/CERP_WERP_introduction.pdf.
to develop more specific project objectives and ultimately CERP project features, with the goal of a signed Chief’s Report by 2019. The contributions of the water management system in the western Everglades to the adverse conditions experienced by Cape Sable seaside sparrows in western Everglades National Park highlighted in the recent jeopardy opinion (FWS, 2016) promises to focus more attention on water management in the western Everglades.
CERP Pilot Projects
Pilot projects are limited efforts designed to provide scientific or engineering knowledge that can be applied to improve major projects that result in natural system benefits. Additionally, pilot projects may inform larger projects to make them more timely and cost-effective. Pilot projects provide the opportunity to experiment with methods and approaches without the large expense of fully developed restoration projects. Below, progress and key findings of the Aquifer Storage and Recovery Regional Study, and Decomp Physical Model (DPM) pilot projects are discussed.
Aquifer Storage and Recovery Regional Study
The CERP proposed completion of 333 ASR wells, which would store water within the upper Floridan Aquifer during wet periods for recovery for ecosystem purposes during seasonal dry periods. To evaluate and reduce uncertainties stemming from regional effects of large-scale ASR implementation in South Florida, the USACE together with the SFWMD conducted an 11-year ASR Regional Study (USACE and SFWMD, 2015b). The Regional Study involved synthesis of published literature, laboratory testing, field-scale experimentation at two pilot ASR sites, and regional-scale groundwater flow modeling.
Based on results of the model simulations, the Regional Study concluded that only 131 ASR wells, or 200 less than envisioned under the CERP, could be operated without regional effects on groundwater flow. The study acknowledged that further optimization of well placement could possibly permit a greater number of ASR wells, but these configurations were not identified in the technical data report. The study evaluated subsurface chemical changes that occurred during storage, and indicated that water-rock interactions reduced the concentrations of mercury and phosphorus in recovered water and that initially high levels of arsenic were lowered with additional cycles of recharge, storage, and recovery. Results of chronic toxicity testing and water quality modeling did not exclude the possibility of impacts to aquatic ecosystems that may receive recovered water but revealed few adverse effects. The study also examined the potential for hydraulic fracturing during aquifer recharge, concluding that
expected operational pressures during water injection were insufficient to cause rock failure.
The National Academies convened a committee to review and evaluate the methods, principles, and data that formed the basis of the Regional Study. This committee endorsed the Regional Study’s principal finding that no “fatal flaws” in ASR have emerged, but concluded that many uncertainties remain that warrant further consideration before large-scale ASR should be implemented (NRC, 2015). In particular, the committee recommended more research to (i) identify operation protocols that maximize freshwater recovery and minimize water quality impacts; (ii) reduce uncertainty associated with ecological risks of ASR to the Everglades; (iii) understand the unexplored benefit of ASR in phosphorus removal; (iv) improve disinfection of recharge water; and (v) establish the costs of ASR compared to other storage alternatives. The implications of a sharply reduced regional capacity for ASR are discussed further in Chapter 4.
Decomp Physical Model
One objective of the CERP is to restore the ridge-and-slough landscape of the central Everglades, a distinctive attribute of the historic Everglades that has been degraded by drainage and compartmentalization. It is now widely accepted that the structure of this landscape depends on flow (McVoy et al., 2011; SCT, 2003). Water flow forms and maintains the parallel arrangement of sloughs and ridges by governing the mobilization and redistribution of organic floc, sediments, and nutrients. Without flow, sediments and sawgrass invade open-water sloughs, tree islands drown, water quality deteriorates, and microtopography disappears. These changes, in turn, lead to habitat loss for wading birds and may encourage the proliferation of exotic fish at the expense of native species. Although the importance of flow is recognized and has been the focus of ongoing research at the Loxahatchee Impoundment Landscape Assessment since 2003 (see Box 3-3), the hydrologic conditions needed to restore and sustain the ridge-and-slough configuration are poorly known.
Restoration of flows associated with CERP implementation will be accompanied by decompartmentalization, which involves removal of levees and, possibly, canal backfilling. The need to remove levees to permit sheet flow and sediment transport is obvious; however, the appropriateness of canal backfilling is controversial because ecosystem responses remain uncertain. Recreational fishing interests resist canal backfilling, suggesting that it is unnecessary for wetland restoration and will reduce game-fish habitat and access to fishing areas. Scientists and managers have expressed concerns that failure to backfill canals may imperil landscape restoration by disrupting sheet flow, lowering sediment transport, providing deep water refugia for exotic invasive fauna, and altering phosphorus dynamics.
The DPM was proposed as a large-scale active adaptive management project to help resolve these issues and better inform future restoration decision making regarding engineering design and operational targets. The pilot project is guided by questions focused on ecosystem responses to higher flows and canal backfilling (see questions in Box 3-4). The DPM experiment is being conducted between L-67A and L-67C, in an area near the border of WCA-3A and WCA-3B known as the “the pocket” (see Figure 3-22). In preparation for the experiment, ten gated culverts on the L-67A canal (S-152) were constructed, and a 3,000-foot gap was created in the L-67C levee with three back-fill treatments in the adjacent canal. The canal was left completely open for the northern-most treatment, while the center and southern-most treatments have partial and complete backfills, respectively (Figure 3-22). A two-month flow experiment was initiated in November 2013 by opening the ten gated culverts that comprise S-152 (Figure 3-23). A second 3-month flow experiment was conducted starting in November 2014, and a 2-day pulse experiment, was executed in November 2015.
Currently in its third year of operation, the DPM has yielded important insights relevant to the questions in Box 3-4 that improve the understanding of how degraded portions of the ridge and slough landscape might respond to improved water deliveries. Analysis of field-based observations has delimited the flow velocities that must be achieved to mobilize floc and sediments from
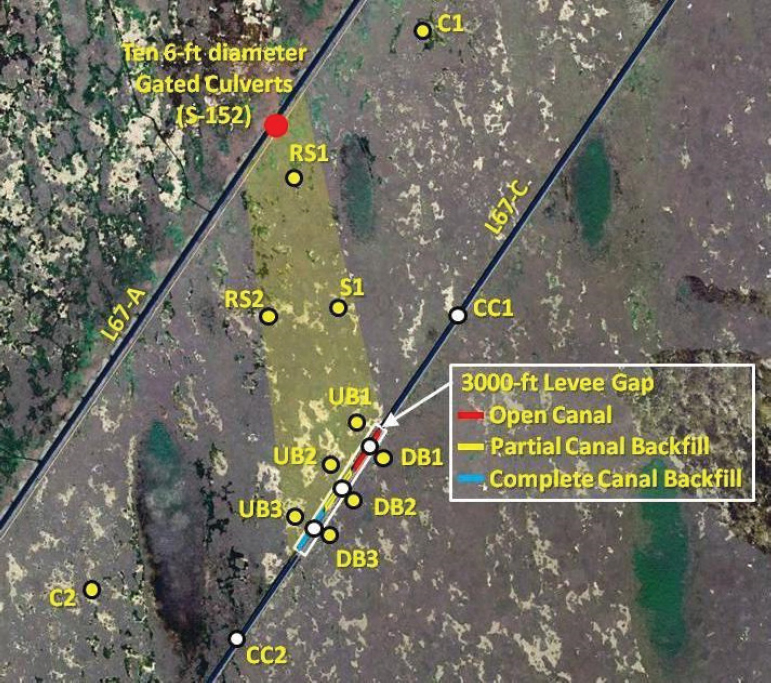
SOURCE: Sklar (2013).
the slough and to transport these constituents onto adjacent ridges. This analysis suggests that the range of optimal velocities (0.025 to 0.1 m s–1) is narrow and thus may be difficult to maintain across large swaths of the wetland (J. Harvey, USGS, personal communication, 2016). During the 2013, 2014, and 2015 experiments, optimal velocities were achieved over a small fraction of the wetland, ranging from 24 to 48 acres. Flow velocities are sensitive to the fraction of sawgrass, which influences flow resistance (Harvey et al., 2009; Nepf, 1999), but the results of model simulations suggest that the area of optimal flow could be expanded by increasing inflows. In addition to the velocity of restored flows, the duration of restored flows appears to be influential. Short-duration pulses
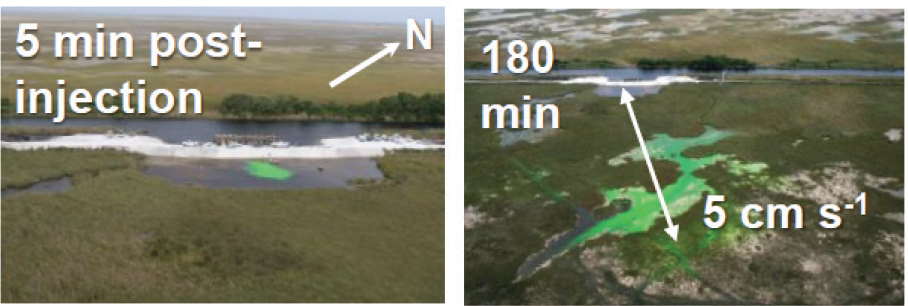
SOURCE: J. Harvey, USGS, personal communication, 2016.
were found to mobilize the highest concentrations of suspended sediments from the bed and metaphyton, but the sediment sources were quickly depleted. Hence, pulsed high flows may have a limited effect on slough-to-ridge sediment exchange. Sustained high flow, on the other hand, promoted periphyton sinking, break up, and transport that increased sediment transfer from sloughs to ridges. This slough clearing is a self-reinforcing process that further increases flow velocities, which, in turn, entrains and redistributes greater loads of sediments.
The DPM has also begun to illuminate how flow enhancement interacts with landscape modifications that accompany restoration. The data show that sheetflow characteristics, as well as sediment and phosphorus dynamics, are sensitive to the way in which canals are backfilled. For example, unfilled portions of L-67C were discovered to be hot spots for sediment and phosphorus accumulation, while canal backfilling decreased sediment-phosphorus levels. Canal backfilling was also discovered to create more high-quality habitat, leading to the increases in the abundance of large fish. The results to date suggest that canal backfilling affects biogeochemical and ecosystem functioning, but the results are not definitive and are confounded by problems encountered during the restored-flow experiments. In particular, the canal backfill treatments were discovered to be misaligned with the center of experimental flows through the marsh, which led to rerouting of flow and sediments down the L-67C canal and preferential flow over the northern end of the levee gap (Figure 3-24). The disparity between anticipated and actual flow patterns complicates estimates of water, sediment, and phosphorus budgets for L-67C backfill areas, thereby increasing
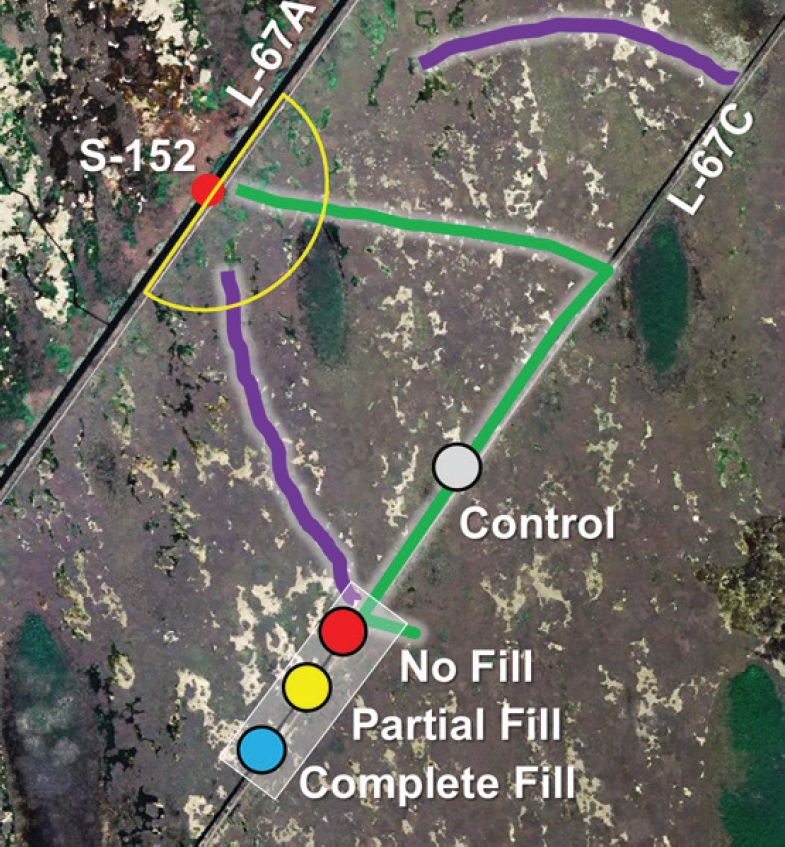
SOURCE: J. Harvey, USGS, personal communication, 2016.
uncertainty of inferences on the coupled hydrologic and biogeochemical effects of the backfill treatments. Improvements of the canal backfill experimental design may be feasible but would be expensive to construct. As an alternative, high resolution measurement of water quality and flow velocities using raft-mounted equipment could be used to complement fixed station measurements.
When considered together, the findings from the DPM have improved our understanding of hydrologic and water-quality changes that occur rapidly, soon after the onset of restorative measures. Despite these advancements, the DPM has yet to illuminate how the cumulative effects of these changes will shape the landscape. Existing knowledge is insufficient to predict sediment and floc accretion rates along ridges and tree islands as a function of flow rate, so estimates of time scales for larger-scale improvements in topography and pattern restoration remain beyond our reach. Similarly, the feasibility of achieving and maintaining flow targets over large portions of wetlands exhibiting spatiotemporal heterogeneity with respect to vegetation density and microtopography remain poorly understood. The role of unfilled and backfilled canals as sources (or sinks) of phosphorus and sediments over inter-annual time scales is equally uncertain. These limitations stem from the challenges and vagaries inherent to large-scale experiments in natural systems, as well as insufficient time to detect the effects of restorative interventions on ecosystem improvements that occur gradually, perhaps over a period of decades.
The DPM is authorized through January 2017, with funding in place for a fourth controlled-flow experiment in fall 2016. The SFWMD and USACE are seeking to extend DPM for 3 more years, pending completion of a supporting National Environmental Policy Act documentation and provided funding can be secured.13 If DPM does proceed beyond January 2017, DPM managers should consider cost-effective modifications to the experimental design to better elucidate if (and when) the short-term phenomena observed to date lead to ridge- and-slough restoration. These modifications might involve extending the current operational window of DPM beyond the dry season to include wet-season flows, while shifting to lower frequency sampling appropriate for understanding longer-term ecological responses to higher flows, thereby informing future project design. Placing an emphasis on marsh-based measurements up-gradient of L-67C may be most advantageous, unless the feasibility of addressing the canal-backfill questions considering shortcomings encountered in the previous experiments can be firmly established.
___________________
13 Note that the DPM is statutorily constrained as a set of temporary features to obtain data to inform the potential design of future decompartmentalization efforts. The time-limited nature of this effort is required by WRDA 2000, which specifically prohibits appropriations for construction of decompartmentalization projects until the completion of the Modified Water Deliveries project (discussed later in the chapter).
NON-CERP RESTORATION PROGRESS
CERP projects are not the only restoration efforts ongoing in the Everglades region. Several non-CERP projects are critical to the overall success of the restoration program, and their progress directly affects CERP restoration progress. New information on major non-CERP efforts are reviewed in this section, with emphasis on natural system restoration benefits or implications for CERP progress. Projects discussed include the Modified Water Deliveries Project, C-111 South Dade, ERTP, the Limestone Products Association L-31N seepage management project, Everglades water quality improvements, the Kissimmee River Restoration Project, invasive species and the Herbert Hoover Dike rehabilitation.
Modified Water Deliveries and the Tamiami Trail Bridge
Congress provided legislative authority in 1989 for the creation of a project to improve water flows into Everglades National Park, where Everglades microtopography and vegetation were in decline as a result of insufficient inflows. In 1992, the General Design Memorandum (GDM) for the Modified Water Deliveries to Everglades National Park Project (Mod Waters; USACE, 1992) envisioned several features to increase the flow of water from WCA-3 into Everglades National Park to accommodate flows up to 4,000 cubic feet per second (cfs). Increasing the flow of water from WCA-3A into Northeast Shark River Slough is a central aspect of Everglades restoration, and the capacity for successful southward movement of waters provided by the Central Everglades Planning Project and other future CERP projects depend critically upon the conveyance, seepage management, and flood control provided by Mod Waters. Hence, completion of Mod Waters is essential to the ultimate success of the CERP. An extensive discussion of the history and details of this long-delayed project was provided by NRC (2008), and updates on progress are provided in each of the three succeeding NRC biennial reviews. It is encouraging to begin this similar update by noting the National Park Service pronouncement that long-expected benefits from Mod Waters are finally reaching Everglades National Park (NPS, 2016b).
Mod Waters consists of four major components (SFERTF, 2014; USACE, 2016f):
- Flood mitigation in the 8.5-square mile area, to protect residences and small businesses adjacent to the Park from possible resultant flooding
- Conveyance and seepage control features,
- Tamiami Trail modifications, and
- Project implementation support.
The status of each component is summarized in Table 3-5, with additional details on the Combined Operational Plan provided in Box 3-5. The locations of the features are shown in Figure 3-25.
The components of Mod Waters have been substantially completed, with 93 percent of the estimated $417 million cost (in 2016 dollars) obligated as of 2016 (K. Smith, USACE, personal communication, 2016). The remaining construction features are anticipated to be complete by 2017 (see Table 3-5). Although the 1-mile Tamiami Trail bridge is now the sole bridging feature within Mod Waters, the Tamiami Trail Modifications: Next Steps Project is under way as a separate initiative, with funding to support a 2.6-mile western bridge from the State of Florida, the National Park Service, and the Federal Highway Administration (FHA, 2014; NPS, 2016c; Scott, 2013). Construction on the western bridge began in November 2016, with anticipated completion in 2020.
The new facilities present under Mod Waters and C-111 South Dade (described in the next section) necessitate a modified operations plan for the region—the Combined Operational Plan (see Box 3-5). Currently, the Everglades Restoration Transition Plan (ERTP; George, 2016) defines operations for the con-
TABLE 3-5 Summary Status of Mod Waters Components
| Component | Work Completed | Work Remaining | Anticipated Completion |
|---|---|---|---|
| Flood Mitigation in the 8.5 square mile area | Land acquisition; construction of levee, seepage canal, pump station | Additional seepage canal (C-358) and water control structure (S-357N) to assist with flood mitigation | 2017 |
| Conveyance and Seepage Control |
|
None | Completed |
| Tamiami Trail Modifications | Raised roadway and 1-mile bridge completed in 2014 | Land acquisition and right-of-way | 2017 |
| Project Implementation Support |
|
2017-2019, monitoring through 2025 |
NOTE: See Figure 3-25 for locations.
SOURCES: FHA (2014); George (2016); NRC (2012); Scott, R. (2013); USACE (1992, 2014b, 2016g); R. Johnson, DOI, personal communication, 2016.
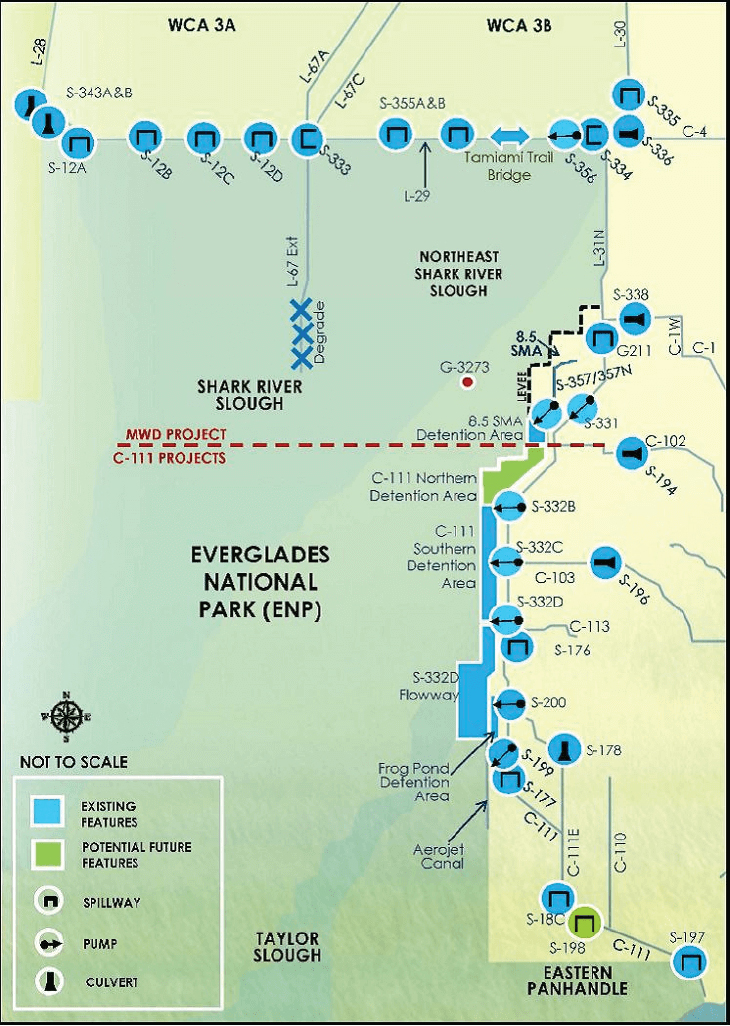
SOURCE: USACE (2016f).
structed features of the Mod Waters and C-111 South Dade projects (described in the next section) until the Combined Operational Plan is implemented. In cooperation with Everglades National Park, the Corps of Engineers has begun a phased implementation of operations of Mod Waters and C-111 facilities in three increments to obtain data needed to develop the operating plan (see Box 3-5) (NPS, 2016b; USACE, 2016g).
Water quality and ecological monitoring are also components of the Combined Operational Plan development. It is important that seepage water from L-31N that is pumped back into Northeast Shark River Slough be of acceptable quality. Sampling at the S-356 intake during Increment 1 from October 2015 through January 2016 showed a flow-weighted total phosphorus mean of 7.1 parts per billion (ppb), with a range of 4-17 ppb (Riley, 2016). These values are consistent with a management goal of ≤ 10 ppb total phosphorus for water within the Everglades National Park (Julian, 2015) and are thus encouraging. Tracer testing during this time period demonstrated north to south flows into Northeast Shark River Slough near the 1-mile bridge (Rudnick et al., 2016). Dry weather for much of calendar year 2015 did not allow for a broader initial assessment of most flow-related natural system benefits of Mod Waters.
Unusually high rainfall during November 2015 through February 2016 in South Florida created systemwide flooding challenges (see Chapter 2). Mod Waters structural components allowed additional flexibility for movement of water during the emergency deviations. From February to May 2016, under the 2016 Temporary Emergency Deviation, L-29 canal levels were permitted to be raised up to 8.5 feet, allowing additional water to flow out of WCA-3A through S-333 into Northeast Shark River Slough (SFWMD, 2016f; USACE 2016h). This helped relieve record water levels in WCA-3A, while providing additional benefits to Everglades National Park and Florida Bay.
C-111 South Dade
As shown in Figure 3-25, the C-111 South Dade project provides the connection between Mod Waters to the north and the C-111 Spreader Canal (Western) project to the south (described earlier in this chapter). This major modification to the Central and South Florida (C&SF) Project’s C-111 Canal was authorized in 1994 to maintain existing flood protection and other C&SF project purposes in developed areas east of C-111 while restoring natural hydrologic conditions in the Taylor Slough and eastern panhandle areas of Everglades National Park (USACE, 2015c). Increased freshwater flows in these areas also help conditions in Florida Bay.
The C-111 South Dade project consists of a combination of detention areas and levees, pump stations and structures, bridges, and backfilling (USACE,
2015b). The overall project contributes to maintenance of the hydraulic ridge along the C-111 corridor, discussed earlier. Approximately 87 percent of the $323 million total project costs (in 2016 dollars) have been obligated by the state and federal governments through FY2016, (K. Smith, USACE, personal communication, 2016). The South Detention Area was completed and operational as of 2010, and in October 2015, the Corps awarded the construction contract for the largest remaining component of the South Dade Project—the $13.9 million North Detention Area, also known as “Contract 8.” The North Detention Area will connect the C-111 South Dade Project to Mod Waters (see Figure 3-25) and is scheduled for completion in October 2017. An additional contract known as “Contract 8A,” awarded in September 2016, will construct interior flow-way berms and is scheduled for completion in 2018. The remaining contract (“Contract 9”) will provide plugs and modifications to the L-31W canal and is scheduled for construction in 2017 and completion in 2018 (G. Landers, USACE, personal communication, 2016). Other storage and structural modifications have been implemented as part of the C-111 Spreader Canal (Western) Project and are operational. The C-111 South Dade Project will be operated and evaluated as part of the Combined Operational Plan described in Box 3-5. Preliminary benefits from the C-111 South Dade project features implemented to date were discussed earlier in the chapter, in the context of the C-111 Spreader Canal (Western) project.
Everglades Restoration Transition Plan
The current water management plan for WCA-3, the Everglades Restoration Transition Plan (ERTP, USACE, 2012a) reflects a multi-species approach to management of avian species of concern in WCA-3 and Everglades National Park (FWS, 2010). The ERTP was developed to improve conditions in WCA-3A for snail kites and wood storks and to maintain protection levels for the Cape Sable seaside sparrows in Everglades National Park. ERTP established targets for wet season high-water levels, recession rates, dry season low water levels, and ascension rates (USACE, 2011c). It is intended to provide greater operational flexibility relative to the previous water management plan, the Interim Operating Plan (IOP).
The ERTP has failed to produce significant improvement in water management for endangered species, missing many of its targets in its first 3 years of operation. For example, recession rate targets to provide foraging habitat for wood storks were in the optimal range 18-23 percent of the time and were suboptimal 68-77 percent of the time (FWS, 2016). Generally, ERTP has improved conditions for snail kites modestly compared to IOP, but not sufficiently so to prevent continued degradation of kite habitat (FWS, 2016). The largest short-
coming, however, has been its failure to achieve targets for the population of Cape Sable seaside sparrows located west of Shark River Slough (population A; see Figure 3-6). Hydroperiods in this area have far exceeded targets each year. Thus, conversion of marl prairie to marsh habitat unsuitable for sparrows has continued, and the overall sparrow population has fallen below the threshold established for incidental take. Emergency releases of water associated with excessive rainfall in the dry season of 2015-2016 created even greater challenges to ERTP. Some water was released through the S12s to avoid overtopping, and subsequent release occurred through the S344 (located on the L-28 canal) under a planned emergency deviation, adversely affected breeding conditions for sparrows in population A. Against this backdrop of less than desired performance, a lawsuit was filed against the FWS, Department of Interior and USACE based on the claim that the ERTP has failed to protect the endangered sparrows.14
As required under the Endangered Species Act and in order to continue operations until the Combined Operational Plan is completed, the Corps reinitiated consultation with the FWS on ERTP in November 2014. In its biological opinion released in July 2016, FWS (2016) concluded that continued water management under the ERTP would affect but not jeopardize the wood stork, the snail kite and its critical habitat, and the critical habitat of the Cape Sable seaside sparrow, but would jeopardize the continued existence of the sparrow. The FWS identified a single Reasonable and Prudent Alternative for the Corps to consider, which includes closing the S12A and S12B structures from October to July 15, raising the stage of the L-29 canal in increments, and using the S-333 for preemptive releases of water. All of these measures will result in more movement of water through Northeast Shark River Slough, thereby increasing restoration benefits to this region, while reducing flows (and associated adverse impacts) in western Shark River Slough. To a large extent, the Reasonable and Prudent Alternative follows the existing plan to develop the Combined Operational Plan (Box 3-5), requiring the ability to raise the L29 canal stage to 7.8 feet by March 2017 (termed Increment 1 Plus; see Box 3-5) and implementation of Increment 2 by March 2018, as allowable by law. The Reasonable and Prudent Alternative in addition includes a provision to explore backfilling the L28 canal and other measures to reduce harmful flows from the northwest out of Big Cypress National Preserve into the western portion of population A (FWS, 2016). At this writing, the USACE has responded with specific actions that they will take to comply with the Reasonable and Prudent Alternative (Kirk, 2016).
___________________
14 Pimm & Bass v. U.S. Fish and Wild Service & U.S. Army Corps of Engineers, No. 1:15-cv-00657 (DC, filed April 30, 2015). The lawsuit was voluntarily dismissed by the plaintiffs in October 2016.
Limestone Products Association Seepage Barrier
Seepage management, in the context of the CERP, involves regulating the exchange of groundwater from natural areas into developed areas, which are separated from one another by canals and levees. During the wet season in particular, the L-31N Canal diverts groundwater, drawn primarily from the northeastern portion of Everglades National Park, to the C-111 basin in south Miami-Dade County. A seepage barrier is intended to reduce this groundwater discharge to the L-31N Canal, thereby increasing water levels and promoting greater sheet flow in northeast Shark River Slough.
Substantial progress on seepage management is associated with a non-CERP project sponsored by the Limestone Products Association. The initial phase of this project began in 2012 with the construction of a 2-mile long seepage barrier as a pilot project (Figure 3-26). In the second phase of the project, completed in
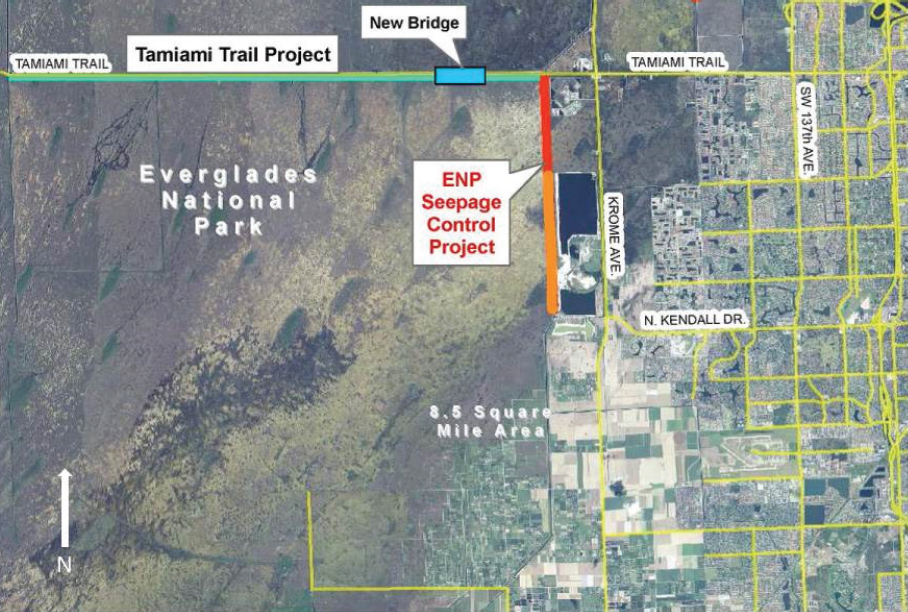
SOURCE: MacVicar (2014).
2016, the barrier was extended to a total length of 5 miles. Construction of the barrier involved excavating a 32-inch wide trench to a depth of 35 feet below the ground’s surface (Figure 3-27). The trench was filled with a concrete-bentonite slurry formulated specifically for this application.
Hydrologic monitoring began in 2004, 8 years prior to construction of the seepage barrier and has continued since that time. Although there has been insufficient opportunity to evaluate the performance of the 3-mile extension, more than 3 years of data have been collected since completion of the initial, 2-mile portion of the barrier. These hydrologic measurements reveal that installation of the barrier has increased head gradients between northeast Shark River Slough and the L-31N canal without increasing seepage into the canal (Figure 3-28). That is, for a similar amount of seepage loss to the canal, the barrier provides an additional 0.4 feet of hydraulic head within the wetland to drive sheet flow southwest through Shark River Slough.
These observations are encouraging and suggest that the 2-mile pilot project is thus far satisfying its original objectives. More time is needed to characterize the effects of the 3-mile extension under appropriately broad ranges of operational and hydrologic conditions. In future analyses, the response of surface-
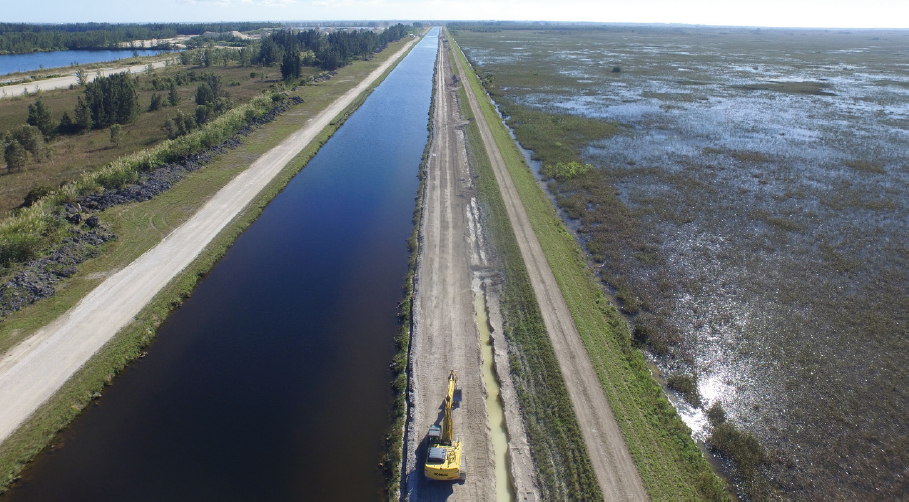
SOURCE: MacVicar (2016).
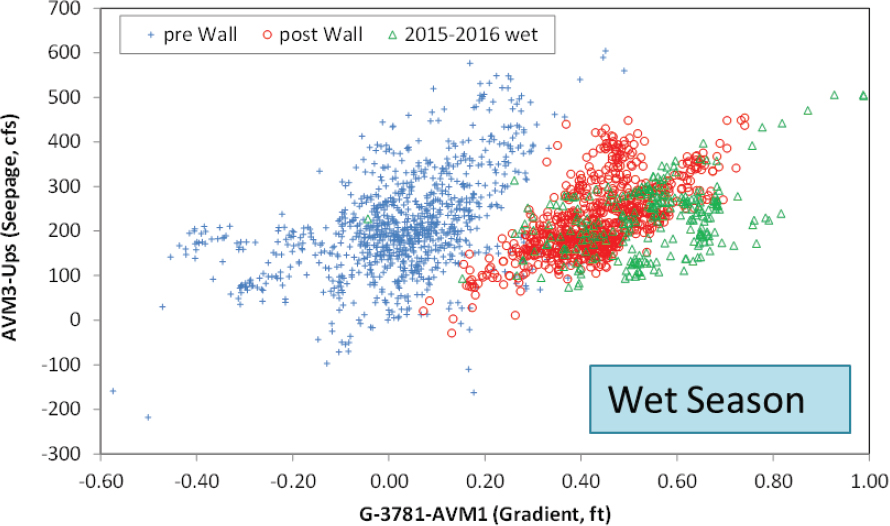
SOURCE: MacVicar (2016).
water flow in Northeast Shark River Slough to the increases in hydraulic head should be assessed through hydrologic modeling.
Everglades Water Quality Initiatives
Achieving water quality goals—specifically total phosphorus levels—is critical to progress in moving water into the Everglades Protection Area (see Chapter 2), and therefore, progress addressing water quality throughout the watershed has implications for CERP progress. Additionally, water quality affects the capacity to reach CERP ecological objectives regarding habitat quality in Lake Okeechobee, the northern estuaries, the remnant Everglades, and Florida Bay. For example, the massive harmful cyanobacterial blooms that occurred on Lake Okeechobee and in the St. Lucie Estuary during the summer 2016 (see Box 2-2) caused by unnaturally high levels of phosphorus and nitrogen in the
lake are inconsistent with long-term CERP goals. Thus, water quality trends and progress on major state water quality initiatives are reviewed in this section.
Lake Okeechobee Watershed Nutrient Reduction Programs
The state of Florida recently adopted a Lake Okeechobee Basin Management Action Plan (BMAP) focused on six sub-basins located north of the lake. The plan builds on decades of actions completed under the Lake Okeechobee Watershed Construction Project and provides an enforceable framework to achieve restoration. This program supplements existing efforts north of the lake to improve water quality, including the Lakeside Ranch and Taylor Creek STAs, distributed water storage, and hybrid wetland treatment systems (Zhang et al., 2016). These projects are the latest in initiatives that have been happening since the 1980s in an attempt to reduce nutrient exports off of agricultural lands in the watershed, to reduce nutrient export from sub-basins, and ultimately to reduce the total phosphorus load into Lake Okeechobee to meet an EPA-mandated total maximum daily load (TMDL) of 140 metric tons/year (5-year moving average).
Despite these efforts, the phosphorus load entering Lake Okeechobee has not significantly declined since a phosphorus budget was first determined for the lake in 1974 (Figure 3-29). Since 2000, when the EPA established the phosphorus TMDL, the actual load has exceeded that 140 ton/year value (as a 5-year rolling average) by 211-440 tons/year, and over the last 5 years, the rolling-average load has exceeded the TMDL by 369 tons/year. As noted in NRC (2008), even when the external phosphorus loads are curtailed through the implementation of best management practices and other phosphorus management strategies into the watershed, legacy phosphorus associated with sediments and soils will continue to leach into the water, extending the time required for the lake to meet environmental goals. Reddy et al. (2011) estimated that there is sufficient accumulated phosphorus to maintain substantially elevated loads for the next 50-120 years.
Within the lake, where there is a total phosphorus target of 40 μg/L (Havens and Walker, 2002) upon which the TMDL is based, total phosphorus concentrations have significantly increased over the period of record (Figure 3-30). Although phosphorus concentrations have declined since the abrupt increase in 2004 and 2005 in response to three major hurricanes passing over the lake (Havens et al., 2016), total phosphorus has remained at approximately 120 μg/L over the last 5 years, or three times the in-lake target concentration. Although it appears that in-lake total phosphorus concentrations may have plateaued since 2000, other 10-year periods of record also give indication of a plateau, only for the lake to experience a further increase.
The increased phosphorus concentration over time in the lake while loads have not changed is a common phenomenon seen in lakes heavily loaded with
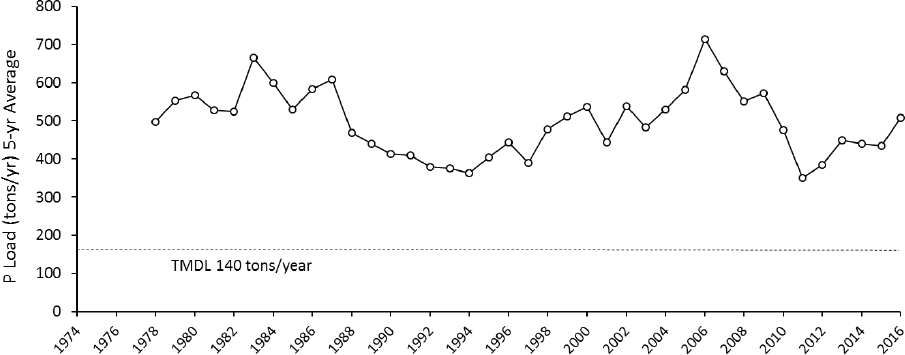
SOURCE: Data provided by the SFWMD.
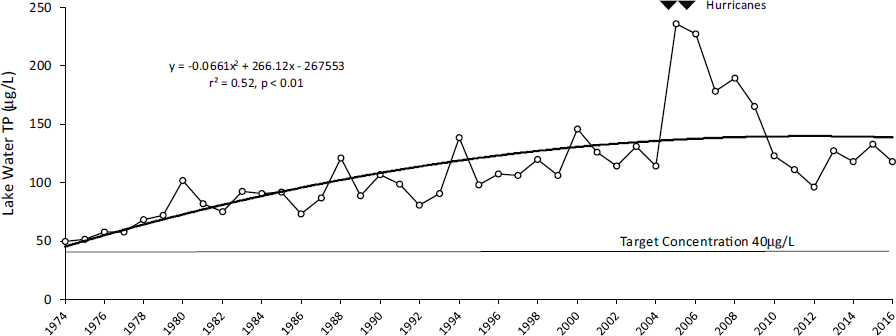
SOURCE: Data from SFWMD.
phosphorus, as phosphorus-adsorbing sites on the lake sediments are saturated and no longer able to buffer the external inputs (Havens et al., 2007; Moss et al., 1997). This trend can be seen in Figure 3-31, a plot of the lake’s phosphorus sedimentation coefficient,15 which reflects a proportional sorption of phosphorus to the sediments. When the sedimentation coefficient reaches zero, the lake is no longer adsorbing phosphorus, and when it becomes negative, the lake has become a net source, adding phosphorus to what comes in from external sources. Now that the sedimentation coefficient is approaching zero, recovery of the lake after external phosphorus loads are reduced will require more time as the lake buffers itself against change (Moss et al., 1997).
The role of nitrogen inputs in cyanobacteria blooms and the need for increased attention to nitrogen loading to surface waters is currently an emerging scientific finding (Paerl et al., 2016b). Some recent research has suggested that it is necessary to control both phosphorus and nitrogen inputs to eutrophic lakes to effectively reduce the occurrence of cyanobacteria blooms (Conley et al., 2009; Lewis and Wurtsbaugh, 2008; Paerl et al., 2016b). In the case of Lake Okeechobee, cyanobacterial harmful algal blooms recently have been dominated by a species (Microcystis aeruginosa) that cannot fix N2, and therefore it requires some level of nitrogen in the water. It is prudent for South Florida resource managers to stay abreast of the rapidly evolving literature on this controversial topic as it relates to the importance of simultaneous phosphorus and nitrogen control to reduce harmful algal blooms in lakes such as Okeechobee. Overall, nitrogen loads to Lake Okeechobee over the period from 1974 to 2016 have remained relatively steady, while there is a slight (but significant) decline in nitrogen concentrations in the lake.16 See Box 2-2 for additional discussion of cyanobacteria blooms and the increased stresses posed by climate change.
Concentrations of nutrients in Lake Okeechobee have major consequences for the larger CERP restoration program because they affect the type and amount of treatment features that are needed downstream of the lake. Further, algal blooms in the northern estuaries, as seen in 2000 and 2016 (see Chapter 2), are
___________________
15 The sedimentation coefficient for a lake can be calculated in many different ways, including from the lake’s phosphorus mass balance. The SFWMD calculates sedimentation coefficient in the following manner:
Sedimentation coefficient = -1 * {[ΔML – (Min – Mout)] / ML}
Where:
ML is the mass of phosphorus in the lake in tons (average of monthly concentration of phosphorus times lake volume)
ΔML is the yearly (May 1 in year n to April 30 in year n+1) change in mass of phosphorus (tons) in the lake
Min is the yearly mass input in tons from tributaries and rainfall
Mout is the yearly mass output in tons to outflow structures
16 The committee calculated a linear rate of decline at –0.0098 mg/L/year at p=0.01 considering yearly mean concentrations of total nitrogen in Lake Okeechobee between 1974 and 2016.
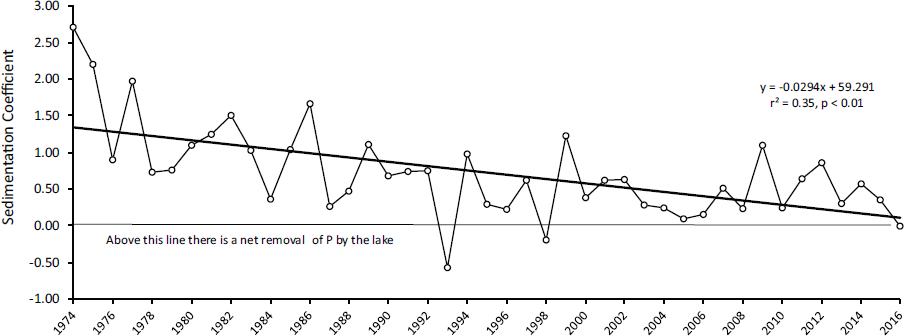
caused by persistent high nutrient levels and affect the capacity to meet ecosystem restoration goals in those regions. See NRC (2008 and 2010) for further discussions of Lake Okeechobee water quality in the context of systemwide restoration goals.
Water Quality Treatment for the Everglades Protection Area
As part of its Long-Term Plan for Achieving Water Quality Goals, the state of Florida has completed construction of and now has approximately 57,000 acres of STAs, which are permitted to operate to treat phosphorus-contaminated water (Figure 3-32). Meanwhile, some enhancements to maintain or improve the performance of existing STAs were completed in WY2015, such as regrading some cells to decrease hydraulic short-circuiting and converting or reestablishing vegetation as needed (Andreotta et al., 2014).
STA Performance and Implications for the Everglades. Monitoring data presented in Chimney et al. (2015) and Pietro et al. (2016) indicate continued improvement in STA performance. Hydraulic loading rates for WY2014 and 2015 are comparable to relatively wet periods of the past (e.g., 2004-2006,
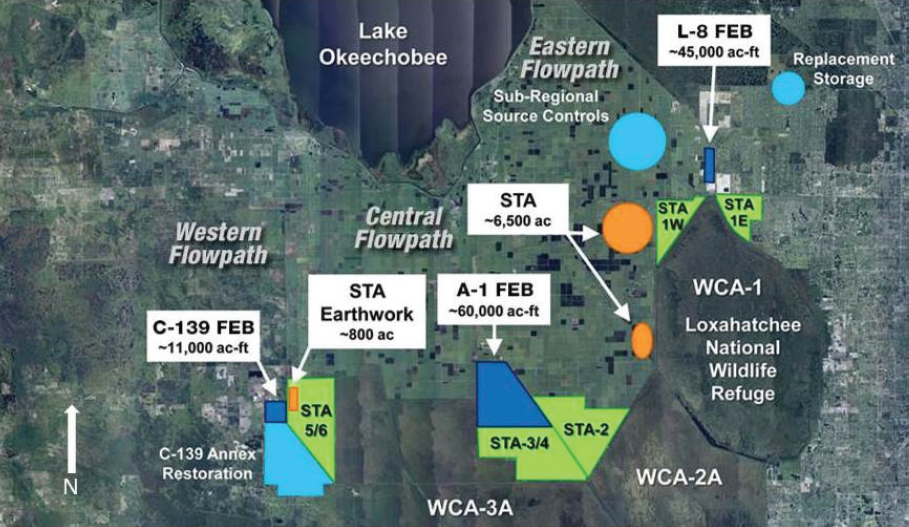
SOURCE: https://www.sfwmd.gov/sites/default/files/documents/map_restoration_strategies_2014.jpg.
2009-2010) while the outflow flow-weighted mean total phosphorus concentrations are less in the recent years than in the past. Indeed, the total phosphorus load retained hovers in the 80 percent range even in relatively wet years since 2009 (Figure 3-33). In WY 2015, flow-weighted mean total phosphorus was reduced from 99 ppb inflow concentration to 17 ppb in outflows, and 83 percent of the inflow total phosphorus load (138 metric tons [mt]) was retained. The outflow mean concentration of 17 ppb is the lowest achieved over 21 years of operation. Although none of the STAs produced a flow weighted mean of 13 ppb (the Water Quality Based Effluent Limit, or WQBEL, see Chapter 2), STA-3/4 came very close with flow-weighted means of 14 ppb and 15 ppb in WY2014 and 2015, respectively. Pietro et al. (2016) attribute the good performance of the Everglades STAs in WY2015 (except for STA-5/6), to a moderate water year with no major storm events or dry-outs (except for STA-5/6 cells dominated by emerging aquatic vegetation), consistently moderate phosphorus loading rates
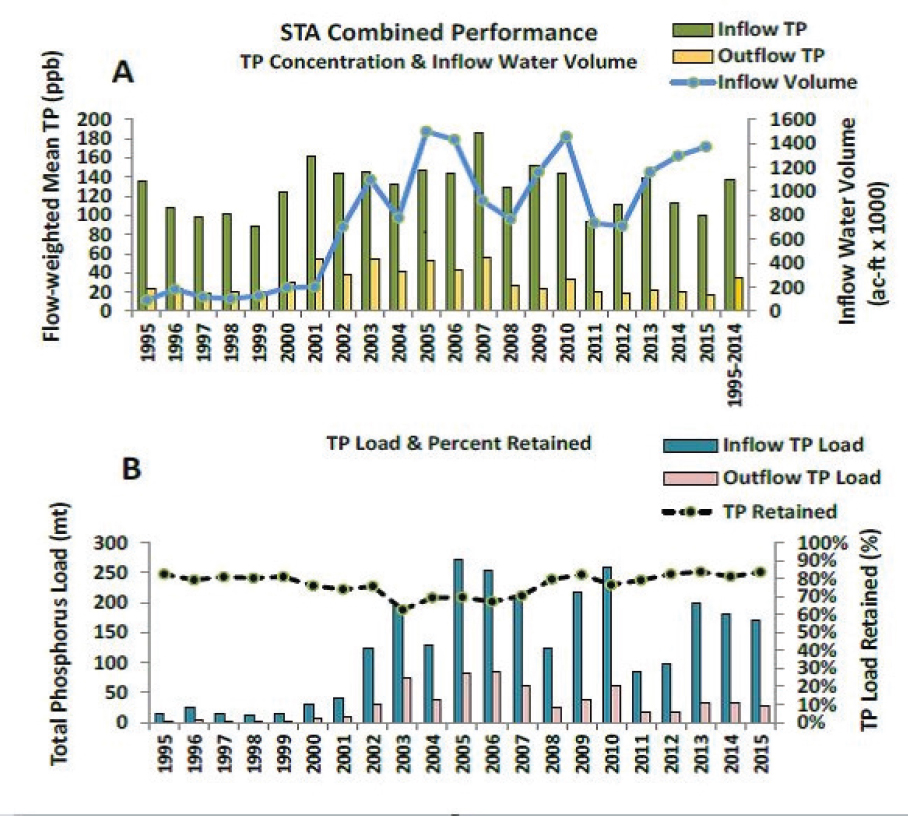
SOURCE: Pietro et al. (2016).
for all the STAs, as well as the methodical operation of individual flow-ways using real-time information. Additionally, the SFWMD performed extensive vegetation management, improvement, and rehabilitation efforts across the STAs and graded the soil in one cell to maximize phosphorus removal efficiency (Pietro et al., 2016).
While simple in concept, wetland treatment of phosphorus-contaminated water in the STAs is a complex operation (see Box 3-6). Treatment cells may be taken off-line for maintenance and operational flexibility as well as to address water level needs of aquatic vegetation and migratory birds. From the available data, management schemes to date continue to produce good reductions in phosphorus, and additional reductions appear promising through efforts in the Restoration Strategies program (discussed later in this section).
The implications of the encouraging trends in STA performance can be seen in an examination of long-term trends in total phosphorus concentrations in the Everglades Protection Area (see Figure 3-34). The impact of STAs is very noticeable on inflow phosphorus levels into WCA-2 and WCA-3. As agricultural best management practices were initiated and STAs became operational during the Phase I (1994-2004) period, annual mean phosphorus concentrations were reduced markedly and became less variable compared to levels observed during the 1979-1993 period. The downward trend of inflow total phosphorus into the three WCAs is statistically significant when analyzed over the WY19792015 period of record (Julian et al., 2016). The same trend is not apparent in inflows to Everglades National Park, although total phosphorus levels within the park are consistently and generally well below 10 ppm. Overall, these trends are encouraging and should reduce the spread of cattails and enhance habitat conditions over time.
Restoration Strategies. In 2012, the state of Florida announced its Restoration Strategies Regional Water Quality Plan to ensure that sufficient treatment is provided for the approximately 1.4 million AF/yr of contaminated water currently flowing into the Everglades Protection Area to meet the legally required water quality standard. The plan includes six projects that create approximately 6,500 acres of new STAs and 116,000 AF total capacity in three new FEBs, which are intended to moderate inflows into existing STAs and improve their treatment performance (Figure 3-32).17 The Restoration Strategies plan was formally launched in September 2012, and the status of individual components is provided in Table 3-6, with completion of all projects set for 2025. Operational testing of the A-1 FEB is ongoing, and should soon result in improved performance for STA-2 and 3/4. Knowledge gained regarding the operations of FEBs can also be used to enhance the operations of the Central Everglades A-2 FEB, once constructed.
The Restoration Strategies program is supported by a $55-million water quality research program designed by the SFWMD (2013b, 2014b) in collaboration
___________________
17 See http://www.sfwmd.gov/portal/page/portal/xwebprotectingandrestoring/restorationstrategies#projects.
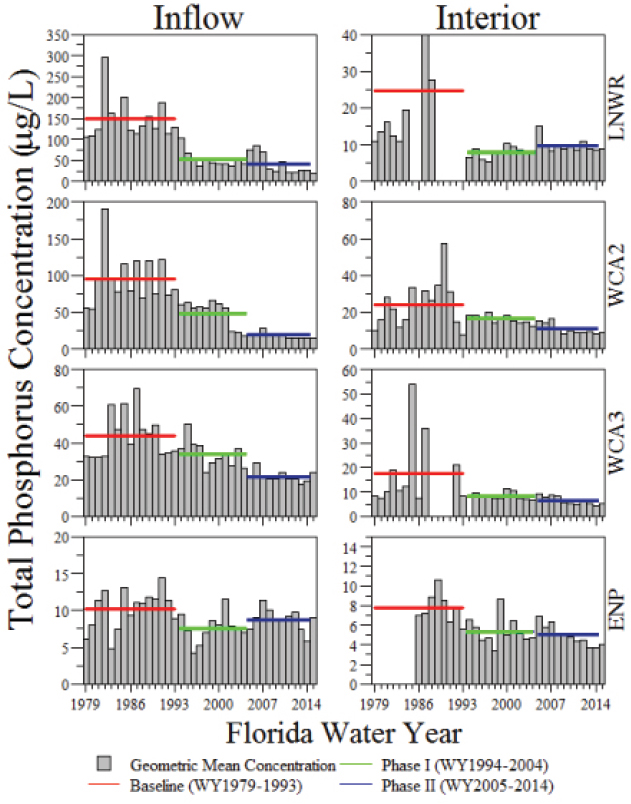
SOURCE: Julian et al. (2016).
TABLE 3-6 Summary status of Major Restoration Strategies Project Elements.
| Component | Purpose | Status | Anticipated Construction Completion |
|---|---|---|---|
| Eastern Flowpath | |||
| L-8 FEB | Attenuate flow into STAs 1E and 1W | Under construction | November 2016 |
| L-8 Conveyance Features (G-716, G-341, G-541) | Assist movement of inflows and outflows to L-8 FEB | Under construction | April 2017 |
| STA-1W expansion (Phase 1) | Increase STA-1W effective treatment area | Under construction | December 2018 |
| STA-1W expansion (Phase 2) | Increase STA-1W effective treatment area | Not begun | TBD |
| Central Flowpath | |||
| A-1 FEB | Attenuate flow into STAs 2 and 3/4 | Ongoing operational testing and monitoring | July 2015 |
| Western Flowpath | |||
| STA 5/6 Earthwork | Improve the performance of STA 5/6 | Design to begin in 2019 | TBD |
| C-139 FEB | Attenuate flow into STA 5/6 | Design to begin in 2019 | TBD |
with the U.S. Environmental Protection Agency and the FDEP. The Restoration Strategies Science Plan (SFWMD, 2013a; reviewed in NRC, 2014) identified six key questions (see Box 3-7) that need to be addressed to improve the understanding of various physical, chemical, and biological factors regulating the total phosphorus concentration in STA outflows. Eight ongoing 2013-2018 projects to address these questions and their status are described in Schwartz and Jacoby (2016). The SFWMD plans to use the results of these investigations to improve the design and operations of STAs to achieve compliance with the total phosphorus water quality-based effluent limit (WQBEL; see Chapter 2), which is currently a key dependency of moving new water into the Everglades via the Central Everglades Planning Project. Thus, the primary objective of the Science Plan is to improve understanding of the external and internal drivers that regulate the performance of STAs at low phosphorus concentration.
The eight ongoing studies listed outlined in Schwartz and Jacoby (2016) are well-developed toward practical and immediate needs for meeting phosphorus-removal goals in the STAs. This is understandable and appropriate given the concern to meet WQBEL limits. However, as suggested by NRC (2014a), the single-
minded focus on phosphorus cycling is noticeable, to the detriment of important analyses of the role of other macro-elements (carbon, nitrogen, and sulfur) on the regulation of total phosphorus in STA outflows. It is critical to recognize the importance of coupled biogeochemical cycles of these macro-elements in regulating sustained performance of STAs. Additionally, the Science Plan does not include any discussion on the influence of extreme events such as hurricanes and severe droughts. Currently, 60 percent of the STA treatment is in submerged aquatic vegetation, which has been shown to be more prone to disturbances from extreme events. As the initial 5-year studies conclude, future emphasis should include consideration of other macro-elements, such as carbon, nitrogen and sulfur on sustained STA performance, as well as the influence of extreme weather events.
The Kissimmee River Restoration Project
The Kissimmee River basin forms the headwaters of Lake Okeechobee and the Everglades to the south. Originally an integrated mosaic of aquatic habitats (lakes, wetlands, creeks, and the mainstem river and floodplains), the basin was severely altered when the 103-mile, meandering Kissimmee River
was channelized in the 1960s to form the 56-mile long, 30-foot deep, C-38 Canal. Channelization caused widespread hydrologic and ecological change to the basin, including loss of in-stream habitat, drainage of the once-extensive floodplain wetlands, and replacement of floodplain wetlands with pastures. Populations of native fish declined and an estimated 90 percent of wading birds were eliminated (USACE, 2016i). The Kissimmee River Restoration Project was authorized in 1992 with the goal or restoring more than 40 square miles (or one-third) of the river-floodplain ecosystem and 44 miles of the river channel. Plans to accomplish this include backfilling 22 miles of the C-38 canal, removing water control structures, and reconnecting remnant river segments. This long-term project is nearly complete, with two phases of restoration construction completed and the remaining components of the other two phases estimated to be complete in 2020, including backfilling the last 9 miles of the C-38 canal and reestablishing flow in 16 miles of river channel (Koebel et al., 2016; USACE and SFWMD, 2015c; G. Landers, USACE, personal communication, 2016). Approximately 84 percent of the $754 million total project costs (in 2016 dollars) have been obligated by the state and federal governments through FY2016 (K. Smith, USACE, personal communication, 2016). The Kissimmee headwaters regulation schedule will be implemented after the river restoration is complete. Issues discussed in NRC (2014) regarding interagency conflicts over land acquisition and cost crediting, which delayed implementation progress, have now been resolved (Koebel et al., 2016), and only two construction contracts (the S-69 Weir and reinforcements of the C-37 embankment) are remaining to be awarded to complete the project (USACE, 2016j; A. Patterson, USACE, personal communication, 2016).
To evaluate project performance, the Kissimmee River Restoration Project adopted a monitoring program quite early in the project to track environmental responses to restoration efforts. Past reports of this committee (NRC, 2010, 2012, 2014) have documented the impressive hydrologic, geomorphic, and ecological responses of the Kissimmee restoration. Interested readers can consult Koebel et al. (2016) for the most recent synthesis of progress. Of note, the first meander breakthrough on the river in over 25 years took place in March, 2014 in the former Micco Run (Kissimmee River Restoration Project Phase I area), resulting from high flows in WY2015. The cutoff created an island, and an oxbow lake appears to be forming adjacent to what is now the main river channel (Figure 3-35; Cheek et al. 2015).
Planning for Invasive Species Management
Invasive species have plagued the Everglades for decades, despite continuing efforts to control them (Figure 3-36). Their impact on Everglades restoration
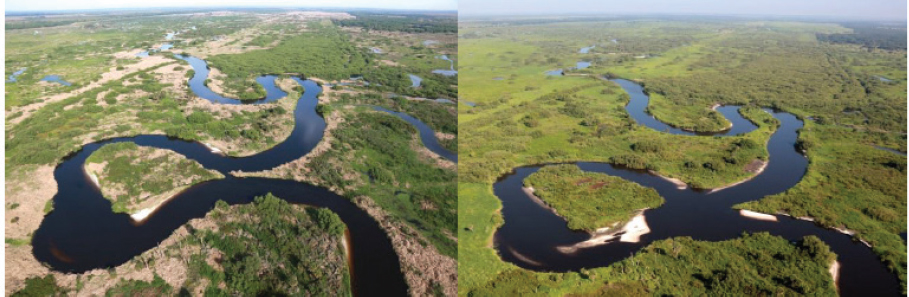
SOURCE: Koebel et al. (2016).
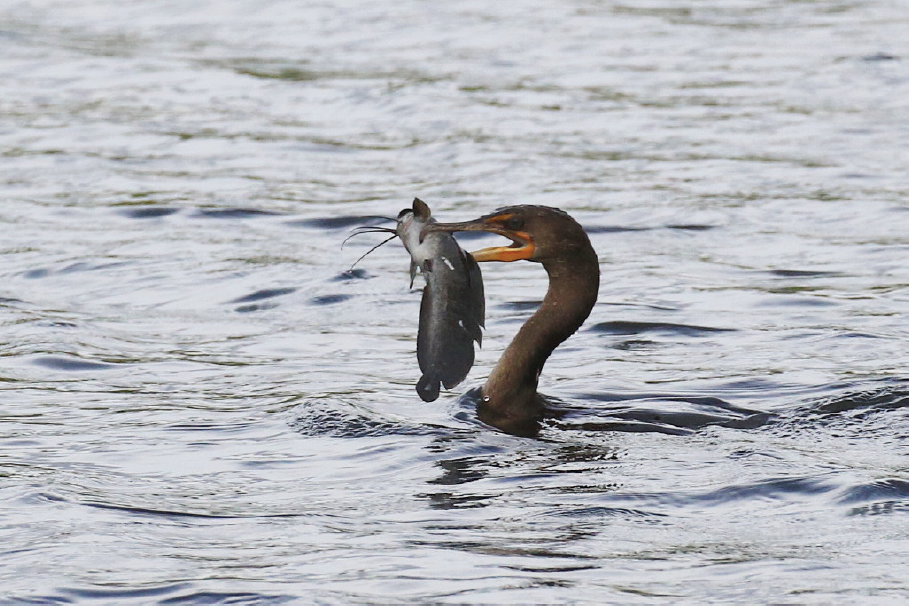
SOURCE: David Policansky.
and progress in the attempts to deal with them were discussed extensively in the previous biennial review, along with some recommendations (NRC, 2014).
Several factors make South Florida more vulnerable to invasions by nonnative species than many other regions. As in other peninsulas, the diversity of biological species and habitat types in Florida decreases toward its tip—South Florida. This peninsula effect (Busack and Hedges, 1984; Jenkins and Rhine, 2008, results from unidirectional colonization, primarily from the direction of the land mass and not from the surrounding ocean. Due to the peninsula effect, the animals and plants of South Florida have had to compete with a relatively small number of species. For this reason, they have been especially vulnerable to extinction after the arrival of people, the habitat modifications they impose, and the exotic animals and plants that always accompany them. South Florida is also vulnerable to invasions because human activities have created extensive habitat types not previously found in the area. Some introduced species are more likely than native species to be adapted to those habitats, and successful invaders of modified habitats may spill over into remnant original habitats. In addition, people bring non-native species with them to new areas, or import them once they have arrived, and those non-native species often escape into the environment. All these factors will ensure that the problem of invasive species in the Everglades will not disappear.
The NRC (2014) review concluded that despite dedicated efforts to manage invasive species in South Florida, there “is a lack of coordination at a strategic level that includes a comprehensive view of all nonnative species in all parts of the greater Everglades.” The committee added that it was “optimistic that the Strategic Action Framework being developed by the South Florida Ecosystem Restoration Task Force [SFERTF] would be a major step forward. . . .” It recommended the establishment of a “strategic early detection and rapid response (EDRR) system that addresses all areas, habitats, and species,” and concluded that there was a lack of a “systemwide mechanism for prioritizing research on and management of invasive species,” and a lack of research on “non-native species and their impacts to adequately inform prioritization efforts.” In this section, the committee provides a brief update on efforts to manage invasive species since its last report.
The SFERTF released its Strategic Action Framework (SFERTF, 2015), which established four main strategic goals:
- To prevent the introduction of invasive, exotic species;
- To eradicate them through EDRR;
- To contain their spread; and
- To reduce and maintain the populations of invasive, exotic species at the lowest feasible levels.
These four goals are based on the invasion curve for exotic species (Harvey and Mazzotti, 2014), and should be viewed as being listed in priority order. Each goal was divided into two or three objectives, and each objective had several strategies, totaling 31 in all. The goals, objectives, and strategies appear to be consistent with the conclusions and recommendations in NRC (2014), although they do not provide a mechanism for prioritizing efforts. To address the issue of prioritization, the Task Force prepared a Preliminary Action Assessment Working Draft (SFERTF, 2016b), which is expected to be modified and revised as conditions warrant (C. Beeler-Kanderski, DOI Office of Restoration Initiatives, personal communication, 2016). The document represents the efforts of the assessment team to prioritize the 31 strategies according to their urgency, potential effectiveness, lack of current effort being expended on them, and the degree to which the strategies can be influenced by the Task Force and its members. Eleven priority strategies were identified from all four goals, but the majority of them focused on eradication through EDRR (Goal 2). For each priority strategy, the team reviewed current efforts and identified gaps that if filled, would support the strategy. The committee did not review the priority strategies and identification of gaps in detail.
Overall, the prioritized strategies generally reflect—or at least, are consistent with—the advice provided in NRC (2014), and the details, of course, go far beyond that advice in many cases. It is too soon to judge their effectiveness, which will depend in part on funding, continued cooperation among agencies and other entities, and the skill and energy with which the activities are carried out. Nonetheless, it appears that substantial progress in planning has been made—or at least delineated—in dealing with a pervasive and challenging problem. That progress builds on an already sound foundation.
Herbert Hoover Dike
The Herbert Hoover Dike (HHD) is a 143-mile structure surrounding Lake Okeechobee. Construction of over 80 miles of levee began in 1932 and the remaining structure was completed in the late 1960s. A Major Rehabilitation Report (USACE, 2000) identified erosion problems (seepage, piping, and erosion of the downstream embankment) that posed imminent risk to the people of South Florida, and in 2007, the USACE launched a major effort to rehabilitate the HHD. Between 2007 and 2016, the USACE invested more than $500 million in projects to reduce the risk of catastrophic failure, including 21 miles of cutoff wall, and has approved an additional 6.6 miles for construction by 2020, completing the cutoff wall along the southeastern portion of the dike (see Inundation Zone A in Figure 3-37; Bon, 2016; USACE, 2016k). The Dam Safety Modification Study (USACE, 2016|) proposed a revised rehabilitation plan for the dike based
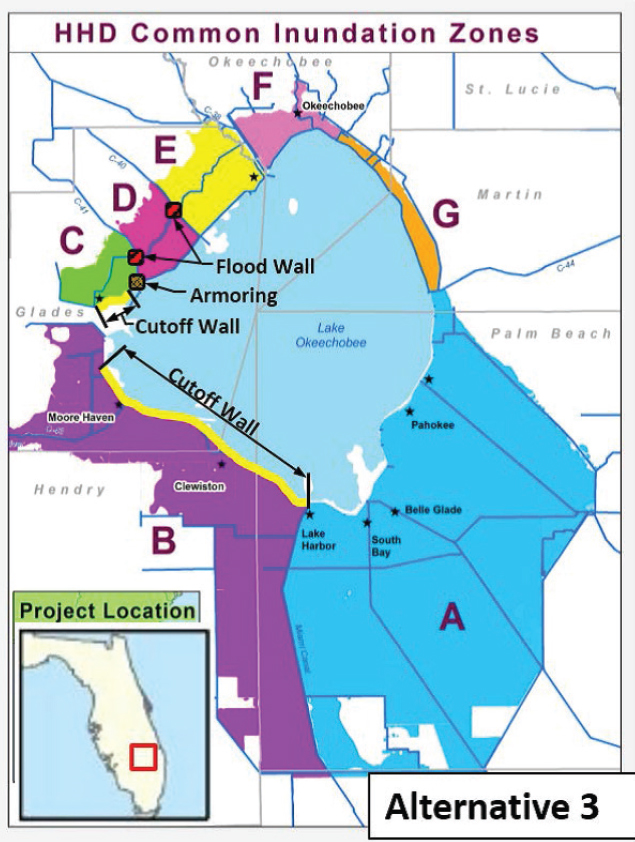
SOURCE: USACE (2016|).
on an updated systemwide risk assessment. The modified rehabilitation plan includes an additional 28 miles of cutoff wall (Zones B and C in Figure 3-37), two embankment flood walls at two water control structures, and armoring of a bridge abutment—a substantially reduced plan compared to that in USACE (2000), while still meeting expectations for acceptable risk.
Integrity issues and concerns that led to the Dam Safety Modification Study also resulted in a new regulation schedule designed to limit high water levels in the lake and thereby reduce the risk of catastrophic levee failure until substantial progress is made on HHD rehabilitation. The Lake Okeechobee Regulation Schedule (LORS; USACE, 2007c, 2008), implemented in April, 2008, lowered the maximum stage from 18.5 feet to 17.25 feet NGVD (see Chapter 4 for more discussions of regulation schedule changes in Lake Okeechobee and implications for storage). Implementation of the recommended HHD modifications (USACE, 2016|) is expected to begin in FY2019 and take 5-7 years to complete, depending on funding (Bon, 2016). The Dam Safety Modification Study assumes that the current lake regulation schedule will continue into the future, at least until the recommended risk reduction measures are implemented, and does not propose to change LORS 2008 as part of the rehabilitation efforts. USACE (2016|) notes that “any proposed revisions to the current LORS will require an updated risk evaluation and be part of a future and independent lake regulation study for informed decision making. A study for a new regulation schedule could be undertaken concurrently while risk reduction features identified in the DSMR [Dam Safety Modification Study] are constructed.”
With implementation of the proposed HHD modifications, higher water levels in Lake Okeechobee may be feasible as early as 2024-2026, which would provide substantial additional water storage. However, a process would need to be implemented to develop the new lake regulation schedule in a timely manner and determine whether higher water levels can be maintained with the updated HHD modifications without exceeding acceptable risk.
CONCLUSIONS AND RECOMMENDATIONS
Completed components of CERP projects are beginning to show ecosystem benefits. Several CERP project increments that have been completed or are nearing completion are beginning to yield measurable results, especially in terms of creating hydrologic conditions that are increasingly similar to pre-drainage flows. For example, portions of Picayune Strand are experiencing higher wet- and dry-season water levels even though the project is not yet complete, and vegetation is becoming more similar to reference conditions. The Biscayne Bay Coastal Wetlands project has enhanced wetland inundation for more than 1,600 acres of the project area, although nearshore salinity values remained above the project targets. The documented hydrologic improvements from the CERP to date, however, involve a small proportion of the overall restoration footprint and are located on the periphery of the remnant Everglades.
Major non-CERP projects are nearing completion, with documented early benefits and anticipated large-scale ecosystem restoration outcomes in the
heart of the remnant Everglades once fully implemented. After resolving procedural impediments that led to delays noted in NRC (2014), there is substantial progress under way on the Modified Water Deliveries (Mod Waters), C-111 South Dade, and Kissimmee River Restoration Projects, which are all anticipated to be completed in the next 5 years. Emergency deviations allowed additional water to flow under the Mod Waters 1-mile bridge in the spring of 2016, bringing enhanced benefits to Everglades National Park while reducing high water in WCA-3A. Continued attention to completing the few remaining project components and developing operational plans will help to avoid further delays in the delivery of these large-scale restoration benefits that the CERP will build upon. Rigorous monitoring is essential to document the ecosystem responses to these projects, to communicate restoration progress to decision makers and the public and to inform future restoration projects.
Water quality in the remnant Everglades continues to improve through enhancements in STA management and operation, but water quality entering Lake Okeechobee and in the lake and its outflows remains in a degraded state. South of the lake, STAs are currently removing approximately 80 percent of phosphorus from their inflows, and in WY2015 the flow-weighted mean outflow concentration for all STAs (17 ppb total phosphorus) was the lowest achieved over 21 years of operation. Although the target of 13 ppb has not yet been achieved, some STAs are approaching that goal. Improvements to STA operations are anticipated to continue as progress is made on Restoration Strategies projects and targeted research efforts. Continued progress on the quality of STA outflows is an essential prerequisite to additional and redistributed CERP flows in the central Everglades. In contrast, there is no long-term downward trend in phosphorus loading to Lake Okeechobee, despite implementation of projects that have reduced phosphorus export from agricultural land parcels and certain sub-basins. In the lake itself, phosphorus concentrations at over 100 ppb are more than double what they were in the early 1980s, and concentration of nitrogen also are high. As a result, outflows from the lake continue to contribute nutrient pollution to the estuaries, as evidenced by the algal blooms of 2016, and make it more difficult to reach CERP goals for those areas. Additionally, if high phosphorus loads into Lake Okeechobee are not reduced through more stringent nutrient management in the watershed, larger CERP STAs may be necessary for future projects that move lake water south.
Reports on CERP progress need to clearly describe ecosystem benefits by documenting changes in key indicators relative to expectations, goals, and baseline and/or reference conditions. Timely and effective reporting of CERP ecosystem benefits to decision makers and the public is critical to ensure accountability for those governmental entities that provide funding and for generating continued public support. So far CERP reporting has emphasized
construction progress, but clear ecosystem changes are now evident for some projects and ecosystem benefits from other projects are likely in the near future. Therefore, additional attention is needed toward assessing and reporting CERP natural system restoration progress. Reports of CERP progress should describe the ecosystem effects predicted to result from the project relative to baseline and/or reference conditions and the time frame over which they are likely to unfold. Explaining the expected time frame for ecosystem effects is important because, although some ecosystem responses (e.g., hydrologic changes) are typically rapid, others (e.g., changes in vegetation structure) may unfold slowly. To avoid creating unrealistic expectations, funders, the public, and managers need to appreciate and understand why some important ecosystem benefits may only become apparent long after project implementation. Also, understanding ecosystem responses relative to expectations is necessary to support adaptive management and determine the need for subsequent management actions if benefits fall far short of project objectives. CERP reports of restoration progress should also describe and explain the key indicators that need to be monitored to document the predicted changes. This step could help communicate to decision makers the value of carefully chosen indicators and a well-designed monitoring plan that uses resources efficiently to address the needs of assessment and adaptive management efforts. Finally, the performance of individual projects should be linked to a holistic assessment of progress toward systemwide restoration objectives to support systemwide adaptive management (see Chapter 5) and to clearly communicate overall progress.
Although the outlook for CERP funding has shown modest improvements since the all-time low in FY2012, outlays of funds continue to fall short of what is needed to complete the CERP within the next 50 years. Increased CERP funding would expedite project implementation and the delivery of restoration benefits and ameliorate ongoing ecosystem declines. Recent Water Resources Reform and Development Act legislation, new project partnership agreements, and a more stable source of state funds have alleviated constraints on federal spending that had been caused by state-federal 50-50 cost-sharing requirements for the CERP. Although construction is underway on six CERP projects, the pace of progress is dependent on funding. Sixteen years into the restoration (roughly half the original timeline of the CERP), only 16 to 18 percent of estimated total cost has been funded. Thus, substantial additional investment is needed to complete the project as envisioned.
Conflicts between restoration objectives and the needs of protected species are issues that require programmatic solutions. The creation of new wetlands and alterations in hydrology in Everglades restoration creates potential conflicts between broad restoration goals and the specific needs of protected species. The frequent nesting of stilts and snail kites in the STAs affects operations
of most flow-ways and a large percentage of individual STA treatment cells. Protecting stilts and kites potentially conflicts with restoration goals related to water quality, although the effect on overall STA performance has not yet been quantified. Documenting the reduction in STA performance due to protection of nesting birds is critical to determining the importance of this conflict. In addition, restoration activities that produce net benefits for a species at the system scale can often create negative, local impacts on that species. Thus, conflicts emerge between the needs of these species and the needs of restoration, as has occurred repeatedly and will likely continue to occur with Cape Sable seaside sparrows. These conflicts merit forward-looking programmatic solutions, so they do not repeatedly cause restoration delays. The USACE has proposed that a Comprehensive Conservation Plan be developed that includes identification of potential future habitat for this subspecies considering predicted flows associated with Everglades restoration projects. This approach has the potential to produce a much-needed long-term solution for the sparrow conflict that integrates systemwide sparrow conservation with the multi-species benefits provided by the restoration. As such, it could provide a model for addressing similar issues with other species. In the case of the conflict over management of the STAs, the agencies could explore options under the MBTA, such as special use permits or memoranda of understanding, that would provide the flexibility necessary to optimize STA performance.


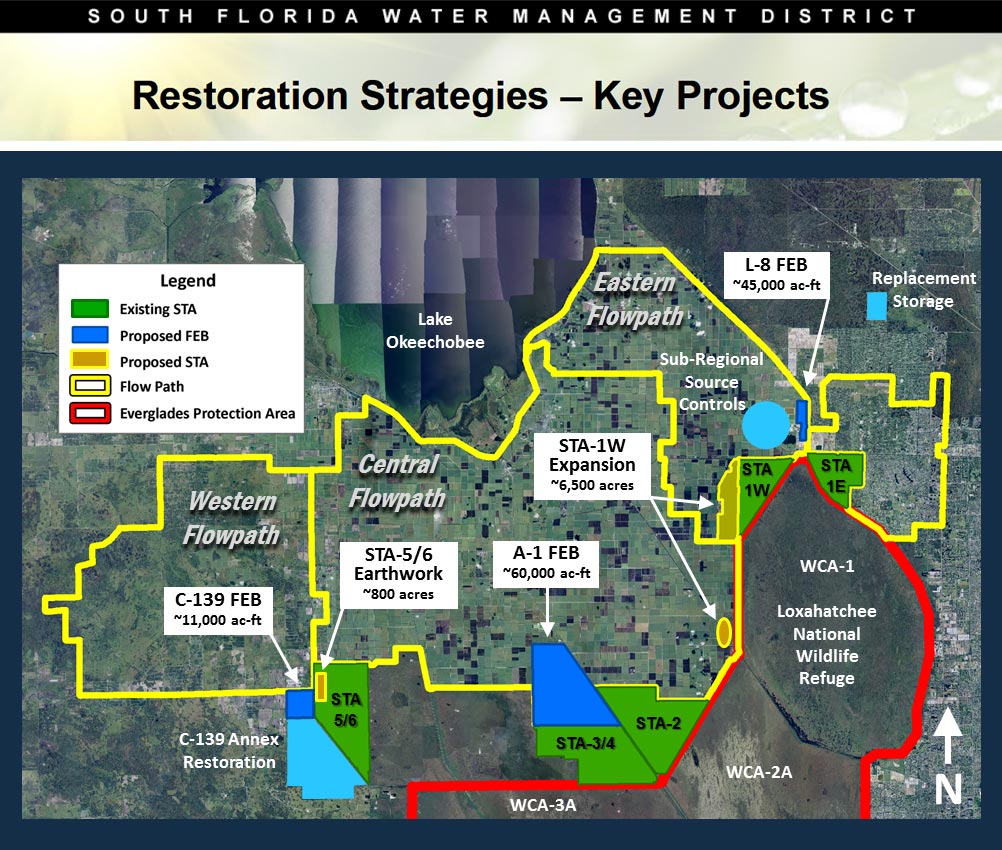